
Decoding the Complexity of Systemic Inflammation Predictors in Locally Advanced Cervical Cancer, with Hemoglobin as the Hidden Key (the ESTHER Study)

 , , ,
, , ,  , , , ,
  ,
,  ,
, 
Abstract
:Simple Summary
Abstract
1. Introduction
2. Materials and Methods
2.1. Study Objective and Design
2.2. Staging, Treatment, and Follow-Up
2.3. Examined Parameters
2.3.1. Patient, Tumor, and Treatment Information
2.3.2. Inflammation Indices
2.4. Statistical Analysis
3. Results
3.1. Patient Demographics
3.2. Treatment Aspects
3.3. Univariate Analysis
3.3.1. Patient-Related Parameters
3.3.2. Tumor-Related Parameters
3.3.3. Treatment-Related Parameters
3.3.4. Pretreatment Inflammatory Indices
3.3.5. Post-Treatment Inflammatory Indices
3.3.6. Delta Indices
3.4. Multivariate Analysis
4. Discussion
5. Conclusions
Supplementary Materials
Author Contributions
Funding
Institutional Review Board Statement
Informed Consent Statement
Data Availability Statement
Acknowledgments
Conflicts of Interest
References
- Torre, L.A.; Bray, F.; Siegel, R.L.; Ferlay, J.; Lortet-Tieulent, J.; Jemal, A. Global cancer statistics, 2012. CA Cancer J. Clin. 2015, 65, 87–108. [Google Scholar] [CrossRef]
- Pötter, R.; Tanderup, K.; Schmid, M.P.; Jürgenliemk-Schulz, I.; Haie-Meder, C.; Fokdal, L.U.; Sturdza, A.E.; Hoskin, P.; Mahantshetty, U.; Segedin, B.; et al. MRI-guided adaptive brachytherapy in locally advanced cervical cancer (EMBRACE-I): A multicentre prospective cohort study. Lancet Oncol. 2021, 22, 538–547. [Google Scholar] [CrossRef]
- Morris, M.; Eifel, P.J.; Lu, J.; Grigsby, P.W.; Levenback, C.; Stevens, R.E.; Rotman, M.; Gershenson, D.M.; Mutch, D.G. Pelvic Radiation with Concur-rent Chemotherapy Compared with Pelvic and Para-Aortic Radiation for High-Risk Cervical Cancer. N. Engl. J. Med. 1999, 340, 1137–1143. [Google Scholar] [CrossRef] [PubMed]
- Vale, C.; Jakobsen, A. Reducing Uncertainties About the Effects of Chemoradiotherapy for Cervical Cancer: A Systematic Review and Meta-Analysis of Individual Patient Data from 18 Randomized Trials. J. Clin. Oncol. 2008, 26, 5802–5812. [Google Scholar]
- Lai, C.H. Management of recurrent cervical cancer. Chang. Gung Med. J. 2004, 27, 711–717. [Google Scholar]
- Atahan, I.L.; Onal, C.; Ozyar, E.; Yiliz, F.; Selek, U.; Kose, F. Long-term outcome and prognostic factors in patients with cervical carcinoma: A retrospective study. Int. J. Gynecol. Cancer 2007, 17, 833–842. [Google Scholar] [CrossRef]
- Winter, W.E., 3rd; Maxwell, G.L.; Tian, C.; Sobel, E.; Rose, G.S.; Thomas, G.; Carlson, J.W. Association of hemoglobin level with survival in cervical carcinoma patients treated with concurrent cisplatin and radiotherapy: A Gynecologic Oncology Group Study. Gynecol. Oncol. 2004, 94, 495–501. [Google Scholar] [CrossRef] [PubMed]
- Grogan, M.; Thomas, G.M.; Melamed, I.; Wong, F.L.; Pearcey, R.G.; Joseph, P.K.; Portelance, L.; Crook, J.; Jones, K.D. The importance of hemoglobin levels during radiotherapy for carcinoma of the cervix. Cancer 1999, 86, 1528–1536. [Google Scholar] [CrossRef]
- Thomas, G. The effect of hemoglobin level on radiotherapy outcomes: The Canadian experience. Semin. Oncol. 2001, 28, 60–65. [Google Scholar] [CrossRef]
- Koulis, T.A.; Kornaga, E.N.; Banerjee, R.; Phan, T.; Ghatage, P.; Magliocco, A.M.; Lees-Miller, S.P.; Doll, C.M. Anemia, leukocytosis and thrombocytosis as prognostic factors in patients with cervical cancer treated with radical chemoradiotherapy: A retrospective cohort study. Clin. Transl. Radiat. Oncol. 2017, 12, 51–56. [Google Scholar] [CrossRef]
- Templeton, A.J.; Ace, O.; McNamara, M.G.; Al-Mubarak, M.; Vera-Badillo, F.E.; Hermanns, T.; Šeruga, B.; Ocaña, A.; Tannock, I.F.; Amir, E. Prognostic Role of Platelet to Lymphocyte Ratio in Solid Tumors: A Systematic Review and Meta-Analysis. Cancer Epidemiol. Biomark. Prev. 2014, 23, 1204–1212. [Google Scholar] [CrossRef] [PubMed]
- Haraga, J.; Nakamura, K.; Omichi, C.; Nishida, T.; Haruma, T.; Kusumoto, T.; Seki, N.; Masuyama, H.; Katayama, N.; Kanazawa, S.; et al. Pretreatment prognostic nutritional index is a significant predictor of prognosis in patients with cervical cancer treated with concurrent chemoradiotherapy. Mol. Clin. Oncol. 2016, 5, 567–574. [Google Scholar] [CrossRef] [PubMed]
- Jeong, M.H.; Kim, H.; Kim, T.H.; Kim, M.H.; Kim, B.J.; Ryu, S.Y. Prognostic significance of pretreatment lymphocyte percentage and age at diagnosis in patients with locally advanced cervical cancer treated with definite radiotherapy. Obstet. Gynecol. Sci. 2019, 62, 35–45. [Google Scholar] [CrossRef]
- Lee, J.W.; Seol, K.H. Pretreatment Neutrophil-to-Lymphocyte Ratio Combined with Platelet-to-Lymphocyte Ratio as a Predictor of Survival Outcomes after Definitive Concurrent Chemoradiotherapy for Cervical Cancer. J. Clin. Med. 2021, 10, 2199. [Google Scholar] [CrossRef]
- Lee, H.J.; Kim, J.M.; Chin, Y.J.; Chong, G.O.; Park, S.H.; Lee, Y.H.; Hong, D.G.; Lee, Y.S. Prognostic Value of Hematological Parameters in Locally Advanced Cervical Cancer Patients Treated with Concurrent Chemoradiotherapy. Anticancer Res. 2020, 40, 451–458. [Google Scholar] [CrossRef]
- Lee, Y.Y.; Choi, C.H.; Kim, H.J.; Kim, T.J.; Lee, J.W.; Lee, J.H.; Bae, D.S.; Kim, B.G. Pretreatment neutrophil: Lymphocyte ratio as a prognostic factor in cervical carcinoma. Anticancer Res. 2012, 32, 1555–1561. [Google Scholar]
- Li, Y.X.; Chang, J.Y.; He, M.Y.; Wang, H.R.; Luo, D.Q.; Li, F.H.; Li, J.H.; Ran, L. Neutrophil-to-Lymphocyte Ratio (NLR) and Monocyte-to-Lymphocyte Ratio (MLR) Predict Clinical Outcome in Patients with Stage IIB Cervical Cancer. J. Oncol. 2021, 2021, 2939162. [Google Scholar] [CrossRef]
- Mizunuma, M.; Yokoyama, Y.; Futagami, M.; Aoki, M.; Takai, Y.; Mizunuma, H. The pretreatment neutrophil-to-lymphocyte ratio predicts therapeutic response to radiation therapy and concurrent chemoradiation therapy in uterine cervical cancer. Int. J. Clin. Oncol. 2015, 20, 989–996. [Google Scholar] [CrossRef] [PubMed]
- Onal, C.; Guler, O.C.; Yildirim, B.A. Prognostic Use of Pretreatment Hematologic Parameters in Patients Receiving Definitive Chemoradiotherapy for Cervical Cancer. Int. J. Gynecol. Cancer 2016, 26, 1169–1175. [Google Scholar] [CrossRef] [PubMed]
- Wang, Y.Y.; Bai, Z.L.; He, J.L.; Yang, Y.; Zhao, R.; Hai, P.; Zhe, H. Prognostic Value of Neutrophil-Related Factors in Locally Advanced Cervical Squamous Cell Carcinoma Patients Treated with Cisplatin-Based Concurrent Chemoradiotherapy. Dis. Markers 2016, 2016, 3740794. [Google Scholar] [CrossRef]
- Zhu, M.; Feng, M.; He, F.; Han, B.; Ma, K.; Zeng, X.; Liu, Z.; Liu, X.; Li, J.; Cao, H.; et al. Pretreatment neutrophil-lymphocyte and platelet-lymphocyte ratio predict clinical outcome and prognosis for cervical Cancer. Clin. Chim. Acta 2018, 483, 296–302. [Google Scholar] [CrossRef]
- Holub, K.; Biete, A. Impact of systemic inflammation biomarkers on the survival outcomes of cervical cancer patients. Clin. Transl. Oncol. 2019, 21, 836–844. [Google Scholar] [CrossRef] [PubMed]
- Kim, Y.J.; Kim, Y.S.; Shin, J.W.; Osong, B.; Lee, S.H. Prediction scoring system based on clinic hematologic parameters for cervical cancer patients undergoing chemoradiation. Int. J. Gynecol. Cancer 2020, 30, 1689–1696. [Google Scholar] [CrossRef] [PubMed]
- Jonska-Gmyrek, J.; Gmyrek, L.; Zolciak-Siwinska, A.; Kowalska, M.; Fuksiewicz, M.; Kotowicz, B. Pretreatment neutrophil to lymphocyte and platelet to lymphocyte ratios as predictive factors for the survival of cervical adenocarcinoma patients. Cancer Manag. Res. 2018, 10, 6029–6038. [Google Scholar] [CrossRef]
- Chauhan, R.; Trivedi, V.; Rani, R.; Singh, U.; Singh, K. Pre-treatment hematological parameters as a cost effective predictive marker for response to concurrent chemo radiation in locally advanced cervical cancer. Cancer Treat. Res. Commun. 2022, 31, 100539. [Google Scholar] [CrossRef]
- Li, S.W.; Yuan, W.; Zhao, B.; He, Z.K.; Guo, X.; Xia, W.X.; Xu, L.H. Positive effect of HPV status on prognostic value of blood lymphocyte-to-monocyte ratio in advanced cervical carcinoma. Cancer Cell Int. 2016, 16, 54. [Google Scholar] [CrossRef]
- Liang, C.; Xu, Z.; Shen, X.; Wu, K. Correlation between Neutrophil-to-Lymphocyte Ratio and Pretreatment Magnetic Resonance Imaging and Their Predictive Significance in Cervical Carcinoma Patients Referred for Radiotherapy. J. Oncol. 2022, 2022, 3409487. [Google Scholar] [CrossRef]
- Bhatla, N.; Berek, J.S.; Cuello Fredes, M.; Denny, L.A.; Grenman, S.; Karunaratne, K.; Kehoe, S.T.; Konishi, I.; Olawaiye, A.B.; Prat, J.; et al. Revised FIGO staging for carcinoma of the cervix uteri. Int. J. Gynaecol. Obstet. 2019, 145, 129–135. [Google Scholar] [CrossRef]
- Deodato, F.; Cilla, S.; Massaccesi, M.; Macchia, G.; Ippolito, E.; Caravatta, L.; Picardi, V.; Romanella, M.; Di Falco, C.; Bartollino, A.; et al. Daily on-line set-up correction in 3D-conformal radiotherapy: Is it feasible? Tumori J. 2012, 98, 441–444. [Google Scholar] [CrossRef]
- Ferioli, M.; Benini, A.; Malizia, C.; Forlani, L.; Medici, F.; Laghi, V.; Ma, J.; Galuppi, A.; Cilla, S.; Buwenge, M.; et al. Classical Prognostic Factors Predict Prognosis Better than Inflammatory Indices in Locally Advanced Cervical Cancer: Results of a Comprehensive Observational Study including Tumor-, Patient-, and Treatment-Related Data (ESTHER Study). J. Pers. Med. 2023, 13, 1229. [Google Scholar] [CrossRef] [PubMed]
- Perez, C.A. Dose fractionation and biological optimization in carcinoma of the uterine cervix. Rays 2004, 29, 253–270. [Google Scholar] [PubMed]
- Mileshkin, L.R.; Moore, K.N.; Barnes, E.H.; Gebski, V.; Narayan, K.; King, M.T.; Bradshaw, N.; Lee, Y.C.; Diamante, K.; Fyles, A.W.; et al. Adjuvant chemotherapy following chemoradiotherapy as primary treatment for locally advanced cervical cancer versus chemoradiotherapy alone (OUTBACK): An international, open-label, randomized, phase 3 trial. Lancet Oncol. 2023, 24, 468–482. [Google Scholar] [CrossRef] [PubMed]
- Ma, X.; Fang, J.; Zhang, L.; Huang, Y.; Shen, H.; Ma, X.; Zhang, S.; Zhang, B. Efficacy and safety of adjuvant chemotherapy for locally advanced cervical cancer: A systematic review and meta-analysis. Crit. Rev. Oncol. Hematol. 2023, 184, 103953. [Google Scholar] [CrossRef] [PubMed]
- Forni, F.; Ferrandina, G.; Deodato, F.; Macchia, G.; Morganti, A.G.; Smaniotto, D.; Luzi, S.; D’Agostino, G.; Valentini, V.; Cellini, N.; et al. Squamous cell carcinoma antigen in follow-up of cervical cancer treated with radiotherapy: Evaluation of cost-effectiveness. Int. J. Radiat. Oncol. Biol. Phys. 2007, 69, 1145–1149. [Google Scholar] [CrossRef]
- Ferrandina, G.; Macchia, G.; Legge, F.; Deodato, F.; Forni, F.; Digesù, C.; Carone, V.; Morganti, A.G.; Scambia, G. Squamous cell carcinoma antigen in patients with locally advanced cervical carcinoma undergoing preoperative radiochemotherapy: Association with pathological response to treat-ment and clinical outcome. Oncology 2008, 74, 42–49. [Google Scholar] [CrossRef] [PubMed]
- Han, X.; Liu, S.; Yang, G.; Hosseinifard, H.; Imani, S.; Yang, L.; Maghsoudloo, M.; Fu, S.; Wen, Q.; Liu, Q. Prognostic value of systemic hemato-immunological indices in uterine cervical cancer: A systemic review, meta-analysis, and meta-regression of observational studies. Gynecol. Oncol. 2021, 160, 351–360. [Google Scholar] [CrossRef] [PubMed]


| Patients n (%) | 173 (100%) |
|---|---|
| Median age (range), years | 56 (27–85) |
| Histological type, number of patients (%) | |
| Squamous cell carcinoma | 173 (85.0) |
| Adenocarcinoma | 26 (15.0) |
| Federation of Gynecology and Obstetrics stage, number of patients (%) | |
| IB | 1 (0.6) |
| IIA | 3 (1.7) |
| IIB | 73 (42.2) |
| IIIA | 9 (5.2) |
| IIIB | 3 (1.7) |
| IIIC1 | 39 (22.5) |
| IIIC2 | 22 (12.7) |
| IVA | 23 (13.3) |
| Radiotherapy technique, number of patients (%) | |
| 3-D conformal radiotherapy | 87 (50.3) |
| Intensity-modulated radiotherapy | 66 (38.1) |
| Volumetric modulated arc therapy | 20 (11.6) |
| Median radiotherapy dose (range), Gy | |
| Prophylactic pelvic nodes irradiation | 46.0 (26.0–50.4) |
| Metastatic nodes | 57.5 (52.5–61.0) |
| Brachytherapy boost | 28.0 (4.0–42.0) |
| Variable | Value | Patients No | 2-y LC | 5-y LC | p-Value | 2-y DMFS | 5-y DMFS | p-Value | 2-y DFS | 5-y DFS | p-Value | 2-y OS | 5-y OS | p-Value |
|---|---|---|---|---|---|---|---|---|---|---|---|---|---|---|
| Age (years) | <55 | 77 | 84.2 | 82.3 | 0.909 | 84.7 | 83.1 | 0.049 | 70.3 | 66.7 | 0.418 | 90.2 | 79.3 | 0.003 |
| 55 ≤ age < 70 | 62 | 81.1 | 81.1 | 82.2 | 72.6 | 73.0 | 66.1 | 87.7 | 69.7 | |||||
| ≥70 | 34 | 83.7 | 83.7 | 64.8 | 60.5 | 59.5 | 55.2 | 79.2 | 49.4 | |||||
| cN | 0 | 102 | 86.9 | 85.3 | 0.271 | 86.1 | 81.6 | 0.045 | 75.0 | 68.9 | 0.101 | 87.2 | 75.1 | 0.194 |
| 1–2 | 71 | 77.3 | 77.3 | 70.8 | 64.7 | 61.0 | 57.1 | 87.5 | 64.6 | |||||
| Total dose (Gy) | ≤75 | 129 | 81.1 | 81.1 | 0.317 | 79.1 | 73.4 | 0.899 | 67.7 | 62.0 | 0.596 | 83.9 | 66.6 | 0.012 |
| >75 | 44 | 88.4 | 85.8 | 81.8 | 77.0 | 72.7 | 68.0 | 97.4 | 81.6 | |||||
| FIGO stage | I–II | 77 | 93.4 | 91.5 | 0.005 | 90.3 | 85.1 | 0.021 | 82.2 | 74.8 | 0.003 | 93.3 | 80.5 | 0.032 |
| III | 73 | 77.7 | 77.7 | 71.1 | 63.8 | 61.2 | 56.6 | 84.4 | 58.8 | |||||
| IV | 23 | 64.2 | 64.2 | 72.8 | 72.8 | 49.7 | 49.7 | 74.7 | 68.5 | |||||
| Maximum tumor diameter | ≤4 | 55 | 91.9 | 89.0 | 0.114 | 84,3 | 75.9 | 0.910 | 77.0 | 68.4 | 0.403 | 88.3 | 74,3 | 0.675 |
| >4 | 118 | 78.8 | 78.8 | 77.8 | 74.2 | 65.5 | 62.0 | 87.0 | 69.1 | |||||
| Histologic type | SCC | 139 | 82.8 | 81.6 | 0.598 | 80.0 | 74.4 | 0.799 | 69.1 | 63.6 | 0.917 | 89.0 | 72.3 | 0.305 |
| N-SCC | 34 | 84.4 | 84.4 | 80.0 | 76.6 | 69.6 | 66.4 | 81.6 | 63.9 | |||||
| Overall treatment time | <54 | 92 | 83.4 | 81.7 | 0.888 | 78.1 | 73.1 | 0.536 | 68.4 | 63.7 | 0.892 | 86.1 | 75.9 | 0.254 |
| ≥54 | 81 | 82.8 | 82.8 | 82.0 | 76.6 | 70.0 | 64.5 | 88.8 | 65.5 | |||||
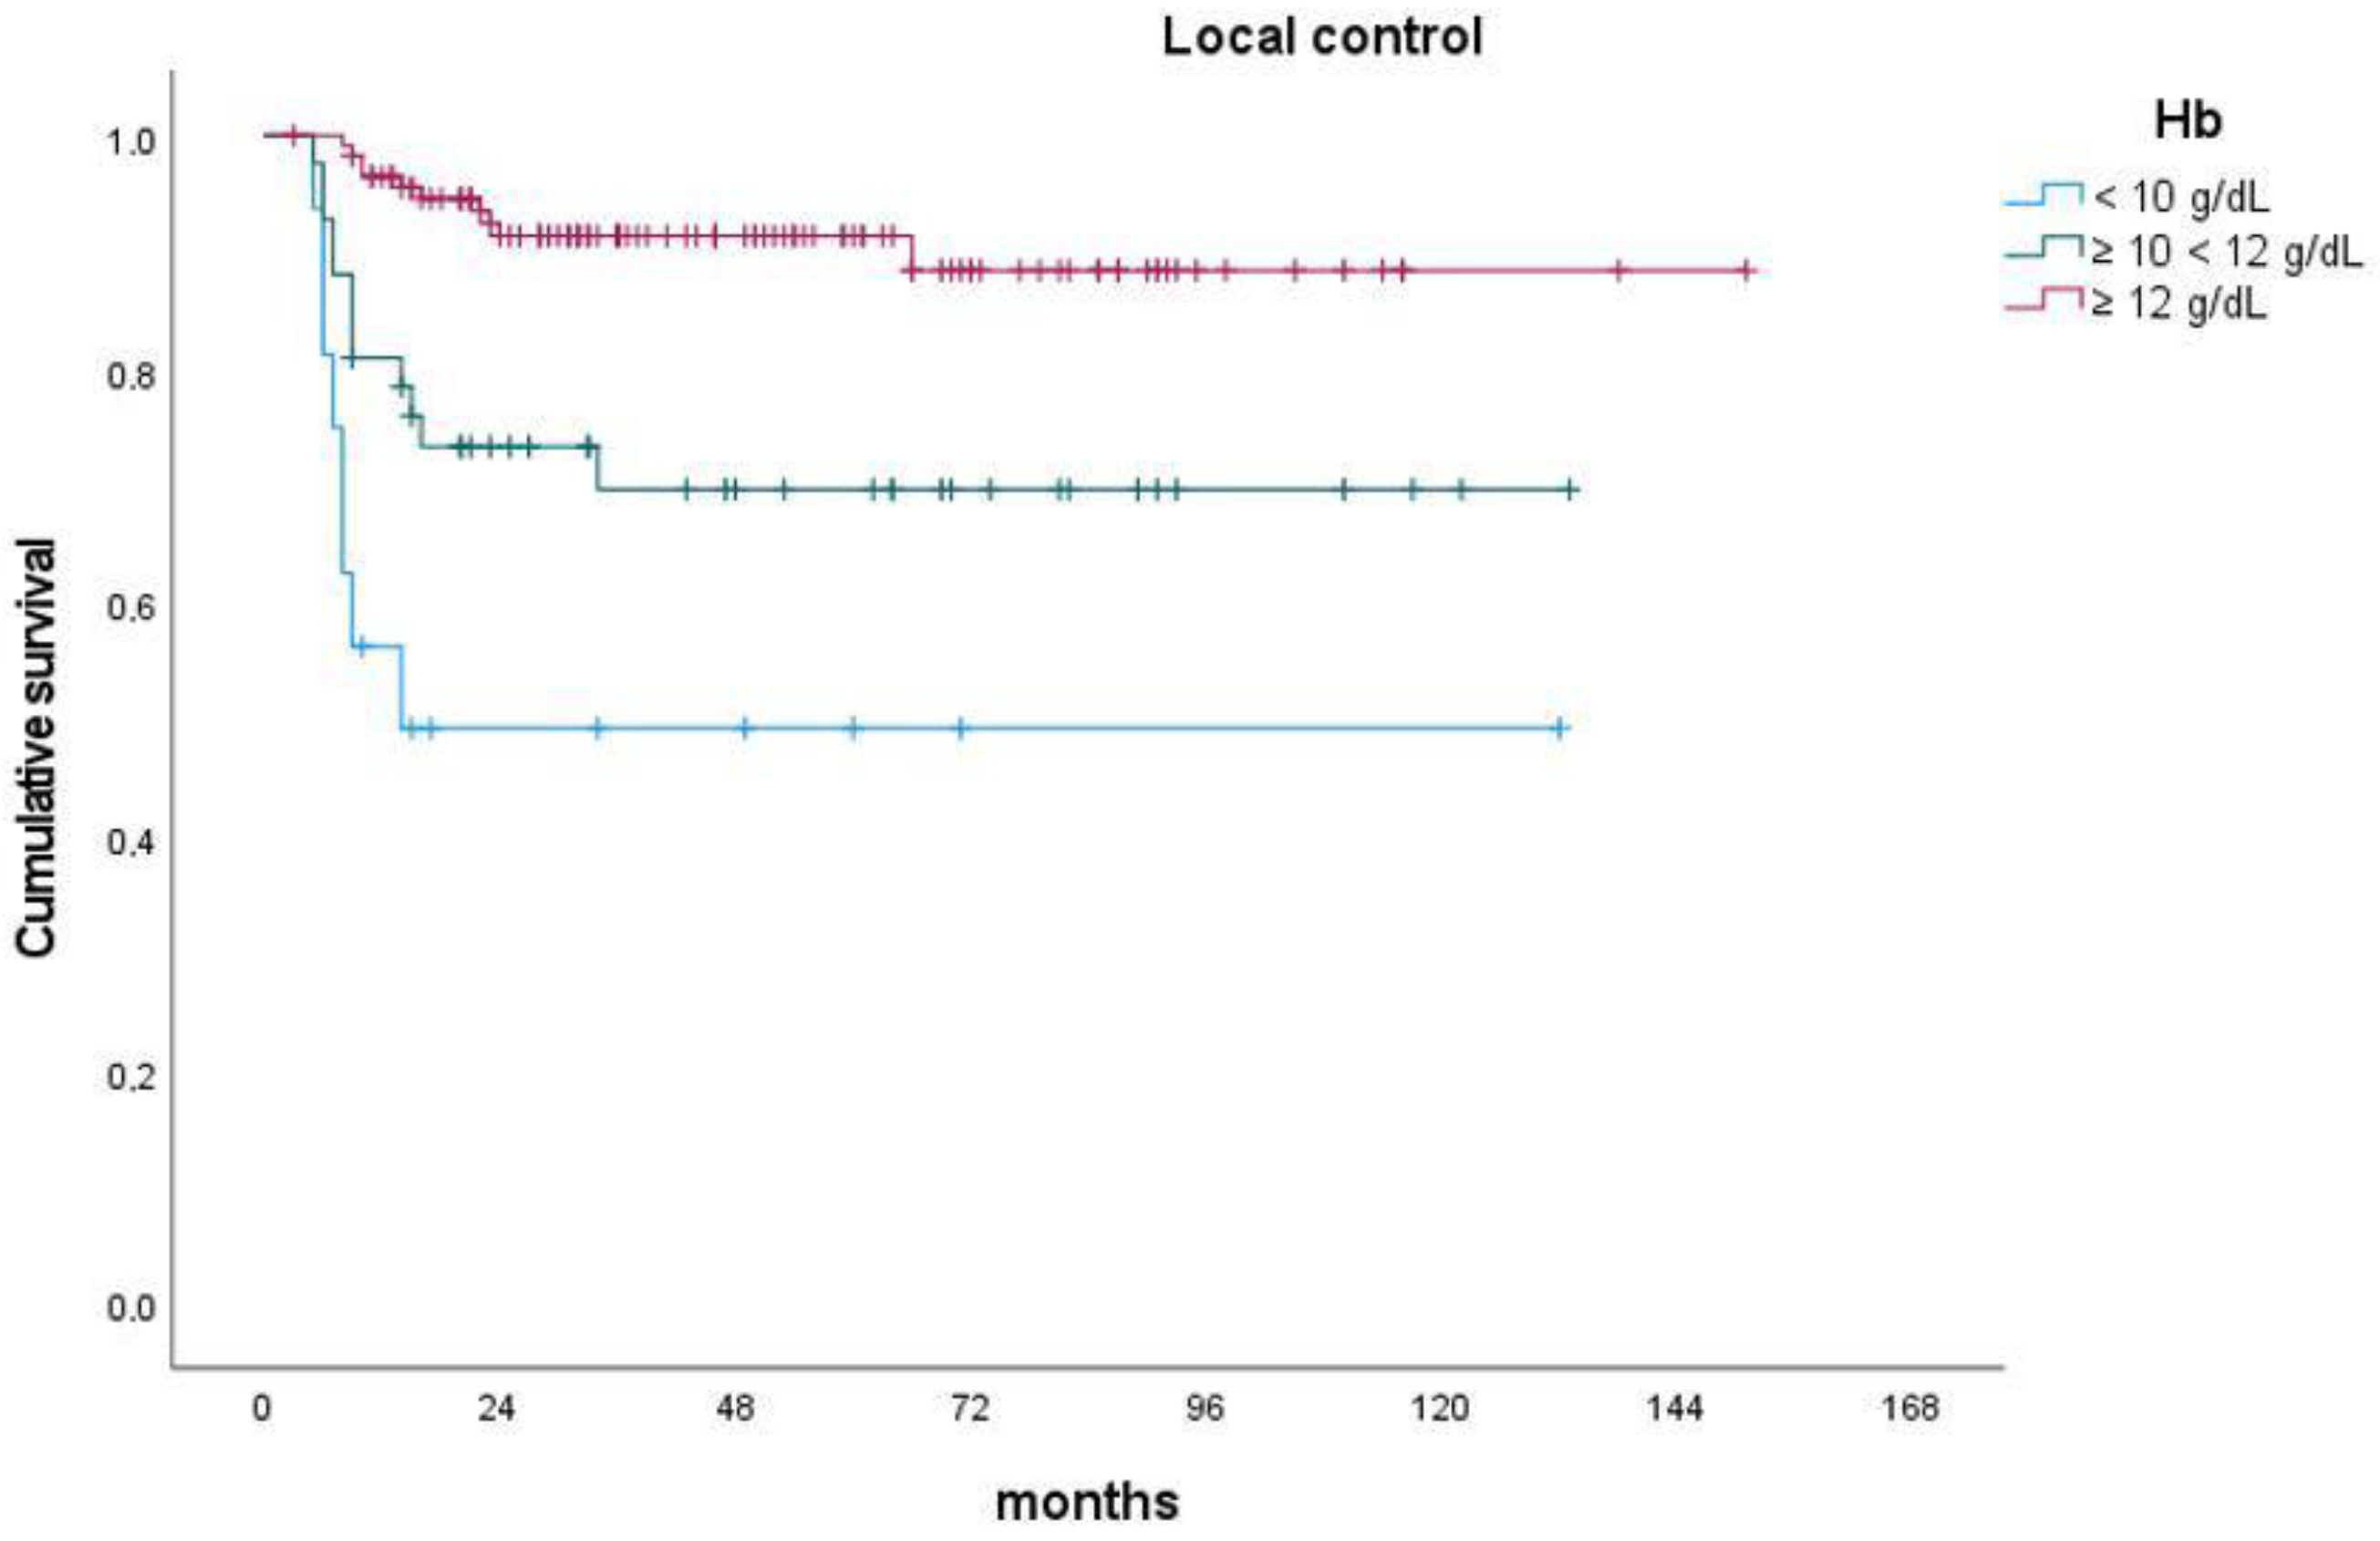
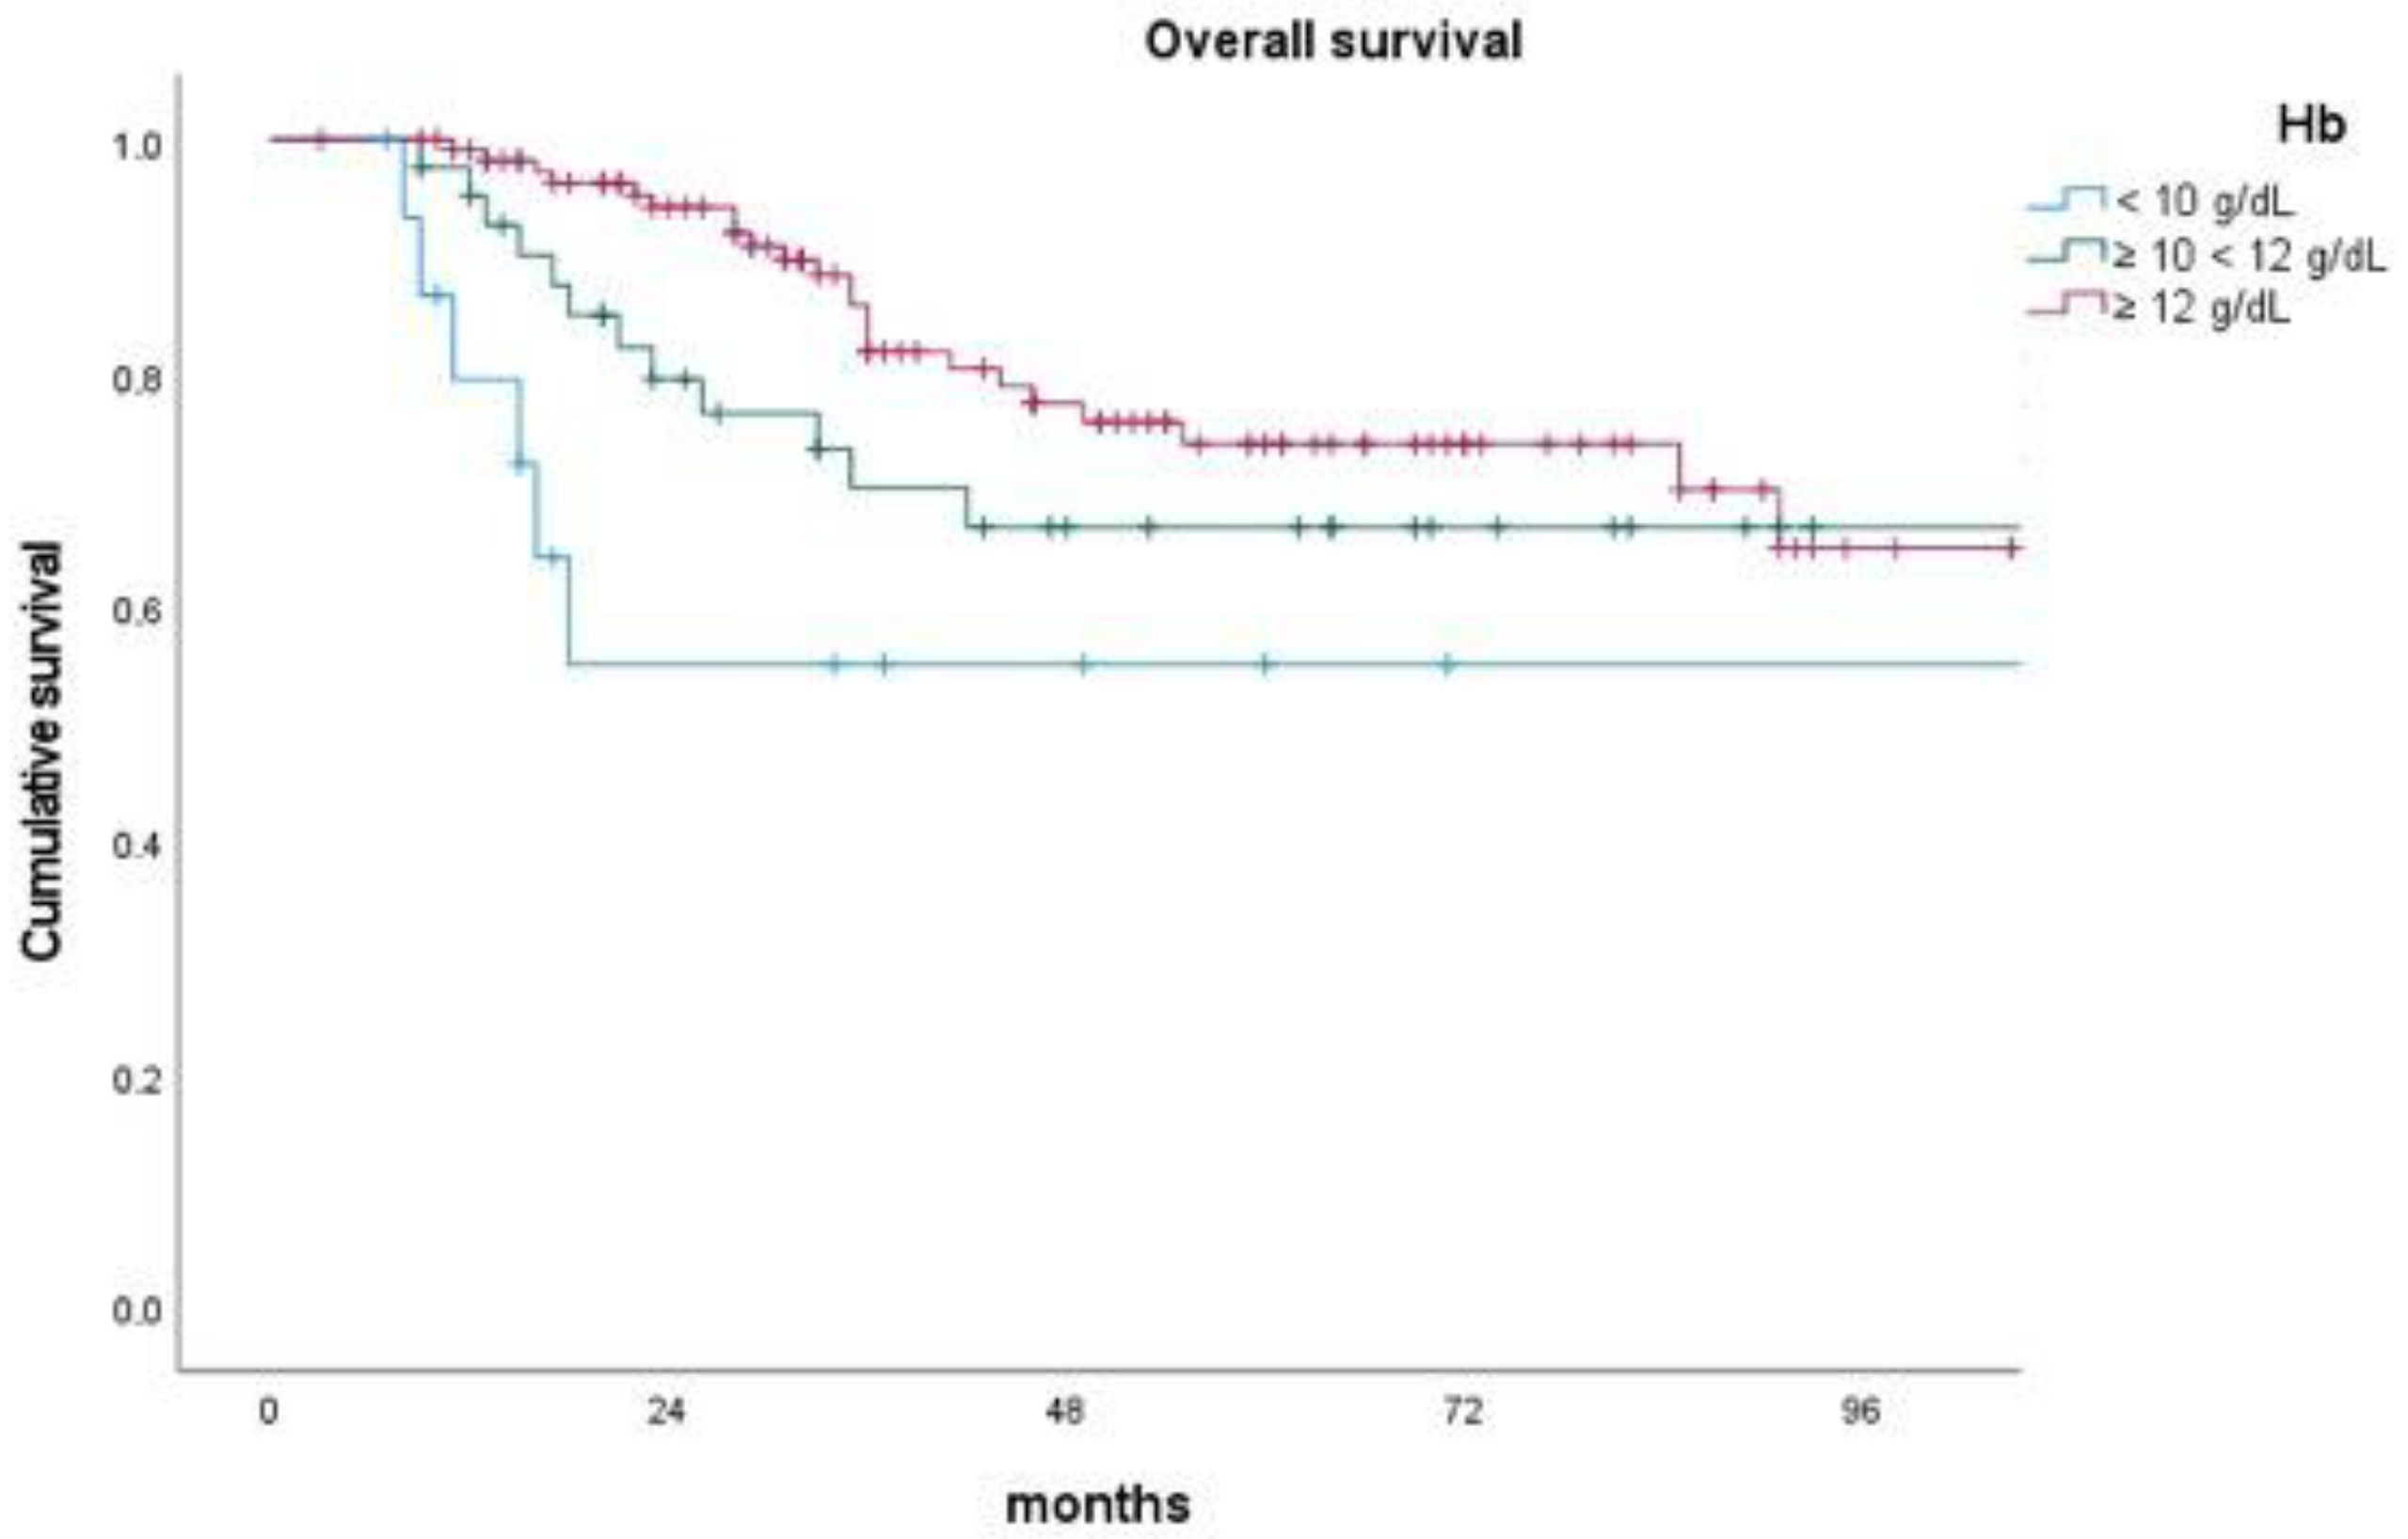
| Hemoglobin | <10 | 16 | 49.2 | 49.2 | <0.001 | 72.3 | 72.3 | 0.270 | 48.1 | 48.1 | 0.007 | 55.0 | 55.0 | 0.040 |
| 10 ≤ Hb < 12 | 42 | 73.3 | 69.7 | 79.5 | 79.5 | 63.4 | 60.1 | 79.5 | 66.8 | |||||
| ≥12 | 115 | 91.4 | 91.4 | 81.4 | 73.9 | 74.3 | 67.7 | 94.2 | 73.9 |
| Variable | Value # | Patients No | 2-y LC | 5-y LC | p-Value | 2-y DMFS | 5-y DMFS | p-Value | 2-y DFS | 5-y DFS | p-Value | 2-y OS | 5-y OS | p-Value |
|---|---|---|---|---|---|---|---|---|---|---|---|---|---|---|
| NLR | ≤1.60 | 24 | 100.0 | 100.0 | 0.022 | 90.9 | 83.3 | 0.243 | 78.9 | 78.9 | 0.075 | 91.3 | 72.9 | 0.572 |
| >1.60 | 149 | 84.3 | 79.4 | 79.0 | 73.2 | 66.4 | 61.7 | 84.8 | 68.6 | |||||
| NLR | ≤2.00 | 46 | 87.5 | 87.5 | 0.209 | 77.4 | 73.1 | 0.628 | 67.5 | 63.5 | 0.918 | 85.3 | 66.2 | 0.707 |
| >2.00 | 127 | 81.4 | 80.2 | 81.7 | 75.1 | 69.7 | 64.2 | 85.9 | 70.4 | |||||
| NLR | ≤2.50 | 73 | 87.9 | 87.9 | 0.145 | 80.4 | 74.0 | 0.698 | 70.7 | 66.5 | 0.671 | 87.9 | 70.1 | 0.524 |
| >2.50 | 100 | 79.5 | 78.0 | 80.8 | 75.0 | 68.0 | 62.2 | 84.2 | 68.8 | |||||
| NLR | ≤3.00 | 99 | 88.8 | 87.0 | 0.034 | 81.2 | 73.7 | 0.804 | 69.9 | 62.1 | 0.958 | 89.9 | 67.4 | 0.389 |
| >3.00 | 74 | 75.4 | 75.4 | 79.9 | 75.9 | 68.2 | 66.2 | 80.3 | 70.9 | |||||
| NLR | ≤3.59 | 122 | 87.6 | 86.2 | 0.014 | 81.6 | 74.6 | 0.698 | 71.6 | 65.5 | 0.255 | 90.3 | 69.5 | 0.164 |
| >3.59 | 51 | 72.3 | 72.3 | 78.5 | 75.1 | 63.4 | 60.4 | 74.8 | 68.2 | |||||
| NLR | ≤3.80 | 125 | 86.2 | 84.8 | 0.079 | 80.9 | 74.0 | 0.826 | 70.5 | 64.5 | 0.510 | 88.7 | 68.3 | 0.479 |
| >3.80 | 48 | 74.9 | 74.9 | 80.2 | 76.1 | 65.6 | 62.5 | 78.2 | 71.3 | |||||
| NLR | ≤5.00 | 142 | 90.0 | 83.9 | 0.129 | 80.2 | 74.1 | 0.581 | 70.4 | 65.2 | 0.482 | 87.8 | 67.6 | 0.571 |
| >5.00 | 31 | 74.1 | 74.1 | 83.0 | 77.8 | 63.0 | 58.5 | 76.1 | 76.1 | |||||
| PLR | ≤3.85 | 2 | 100 | 100 | 0.595 | 100 | 100 | 0.596 | 100 | 100 | 0.482 | 100 | 100 | 0.671 |
| >3.85 | 171 | 82.9 | 82.0 | 80.5 | 74.5 | 68.9 | 63.8 | 85.6 | 69.2 | |||||
| PLR | ≤70.00 | 7 | 85.7 | 85.7 | 0.957 | 100.0 | 100.0 | 0.267 | 85.7 | 85.7 | 0.502 | 80.0 | 80.0 | 0.982 |
| >70.00 | 166 | 83.0 | 82.1 | 80.0 | 74.0 | 68.7 | 63.5 | 85.9 | 69.2 | |||||
| PLR | ≤133.02 | 63 | 87.9 | 84.2 | 0.479 | 83.9 | 72.0 | 0.527 | 73.0 | 61.5 | 0.943 | 91.4 | 60.3 | 0.657 |
| >133.02 | 110 | 80.3 | 80.3 | 78.8 | 75.2 | 67.0 | 64.4 | 82.7 | 72.4 | |||||
| PLR | ≤136.6 | 67 | 88.6 | 85.2 | 0.334 | 84.8 | 73.4 | 0360 | 74.5 | 63.5 | 0.644 | 91.8 | 62.3 | 0.854 |
| >136.6 | 106 | 79.6 | 79.6 | 78.1 | 74.4 | 65.9 | 63.3 | 82.2 | 71.7 | |||||
| PLR | ≤139.2 | 69 | 88.9 | 85.6 | 0.268 | 85.3 | 74.2 | 0.342 | 73.8 | 62.9 | 0.736 | 92.1 | 63.3 | 0.772 |
| >139.2 | 104 | 79.2 | 79.2 | 77.7 | 73.9 | 66.3 | 63.7 | 81.8 | 72.1 | |||||
| PLR | ≤148.8 | 83 | 89.6 | 87.2 | 0.097 | 84.8 | 76.2 | 0.165 | 75.5 | 67.0 | 0.354 | 90.8 | 65.4 | 0.688 |
| >148.8 | 90 | 77.2 | 77.2 | 76.8 | 72.5 | 63.5 | 60.7 | 81.3 | 72.1 | |||||
| PLR | ≤154.17 | 88 | 88.7 | 86.5 | 0.100 | 93.1 | 75.2 | 0.269 | 74.5 | 66.6 | 0.373 | 88.6 | 65.1 | 0.595 |
| >154.17 | 85 | 77.2 | 77.2 | 77.9 | 73.4 | 63.8 | 60.8 | 82.8 | 72.0 | |||||
| PLR | ≤158.00 | 90 | 89.0 | 86.9 | 0.073 | 83.6 | 75.9 | 0.201 | 75.1 | 67.5 | 0.266 | 88.9 | 66.2 | 0.733 |
| >158.00 | 83 | 76.6 | 76.6 | 77.3 | 72.7 | 62.9 | 59.9 | 82.3 | 71.4 | |||||
| PLR | ≤172.50 | 103 | 86.2 | 84.4 | 0.245 | 83.9 | 76.3 | 0.203 | 72.0 | 65.9 | 0.408 | 88.1 | 67.9 | 0.619 |
| >172.50 | 70 | 78.3 | 78.3 | 75.7 | 71.9 | 64.8 | 61.1 | 82.2 | 70.7 | |||||
| PLR | ≤210.00 | 127 | 88.3 | 85.9 | 0.017 | 83.1 | 77.3 | 0.147 | 72.7 | 66.7 | 0.185 | 88.8 | 73.6 | 0.080 |
| >210.00 | 46 | 71.4 | 71.4 | 73.6 | 67.5 | 59.2 | 56.4 | 77.4 | 63.3 | |||||
| SII | ≤1000.00 | 106 | 87.8 | 86.1 | 0.077 | 80.3 | 74.3 | 0.864 | 70.8 | 63.3 | 0.759 | 87.6 | 67.9 | 0.734 |
| >1000.00 | 67 | 75.6 | 75.6 | 81.2 | 75.0 | 66.4 | 64.2 | 82.8 | 70.7 | |||||
| LLR | ≤4.17 | 93 | 88.1 | 86.2 | 0.088 | 79.2 | 75.4 | 0.601 | 69.0 | 60.9 | 0.714 | 81.9 | 39.2 | 0.328 |
| >4.17 | 80 | 77.2 | 77.2 | 82.1 | 73.8 | 69.2 | 67.3 | 89.7 | 69.4 | |||||
| LLR | ≤5.28 | 127 | 85.5 | 84.2 | 0.138 | 80.6 | 74.7 | 0.687 | 70.9 | 65.0 | 0.324 | 83.4 | 68.4 | 0.259 |
| >5.28 | 46 | 76.0 | 76.0 | 80.7 | 74.3 | 64.2 | 61.0 | 91.4 | 71.7 | |||||
| MLR | ≤0.26 | 103 | 87.1 | 85.4 | 0.100 | 79.7 | 72.8 | 0.347 | 68.1 | 63.9 | 0.779 | 88.2 | 66.1 | 0.791 |
| >0.26 | 70 | 77.0 | 77.0 | 82.0 | 77.4 | 70.6 | 64.2 | 82.2 | 74.1 | |||||
| MLR | ≤0.33 | 122 | 89.9 | 84.9 | 0.268 | 80.3 | 74.4 | 0.713 | 67.2 | 62.4 | 0.517 | 87.4 | 66.6 | 0.702 |
| >0.33 | 51 | 78.4 | 78.4 | 81.4 | 75.3 | 73.9 | 68.1 | 81.7 | 76.3 | |||||
| APRI | ≤0.18 | 96 | 76.4 | 76.4 | 0.012 | 80.1 | 77.4 | 0.769 | 64.7 | 64.7 | 0.325 | 84.4 | 70.7 | 0.327 |
| >0.18 | 77 | 91.5 | 89.1 | 79.6 | 71.3 | 74.7 | 62.6 | 91.0 | 70.2 | |||||
| ALRI | ≤9.62 | 87 | 87.4 | 87.4 | 0.117 | 81.2 | 77.6 | 0.950 | 71.9 | 70.1 | 0.380 | 89.6 | 72.9 | 0.848 |
| >9.62 | 86 | 78.6 | 77.0 | 78.6 | 72.1 | 66.3 | 58.6 | 85.0 | 68.6 | |||||
| ANRI | ≤3.47 | 87 | 77.6 | 77.6 | 0.044 | 81.5 | 78.2 | 0.822 | 66.8 | 65.3 | 0.462 | 84.0 | 69.9 | 0.186 |
| >3.47 | 86 | 88.6 | 88.6 | 78.3 | 71.6 | 71.5 | 62.8 | 90.6 | 71.2 | |||||
| COP-NLR * | ≤1 | 137 | 86.7 | 85.5 | 0.010 | 80.2 | 74.5 | 0.733 | 70.6 | 63.9 | 0.390 | 90.3 | 70.0 | 0.250 |
| >1 | 36 | 69.0 | 69.0 | 79.0 | 75.2 | 63.0 | 63.0 | 75.6 | 71.6 |
| Parameter | Values | Patients N (%) | LC | DMFS | DFS | OS | ||||||||
|---|---|---|---|---|---|---|---|---|---|---|---|---|---|---|
| HR | 95% CI | p-Value | HR | 95% CI | p-Value | HR | 95% CI | p-Value | HR | 95% CI | p-Value | |||
| NLR | ≤3.59 | 122 | 1 | rif. | 1 | rif. | ||||||||
| >3.59 | 51 | 1.990 | 0.957–4.140 | 0.065 | 1.360 | 0.795–2.328 | 0.262 | |||||||
| PLR | ≤210.00 | 127 | 1 | rif. | 1 | rif. | ||||||||
| >210.00 | 46 | 1.360 | 0.706–2.620 | 0.357 | 1.646 | 0.885–3.059 | 0.115 | |||||||
| APRI | ≤0.18 | 96 | 1 | rif. | ||||||||||
| >0.18 | 77 | 0.412 | 0.174–0.976 | 0.044 | ||||||||||
| Parameter | Values | Patients N (%) | LC | DMFS | DFS | OS | ||||||||
|---|---|---|---|---|---|---|---|---|---|---|---|---|---|---|
| HR | 95% CI | p-Value | HR | 95% CI | p-Value | HR | 95% CI | p-Value | HR | 95% CI | p-Value | |||
| Age (years) | <55 | 77 | 1 | rif. | 0.025 | 1 | rif. | 0.061 | 1 | rif. | <0.001 | |||
| 55 ≤ age < 70 | 62 | 1.378 | 0.668–2.839 | 0.385 | 1.141 | 0.621–2.095 | 0.671 | 2.014 | 0.929–4.366 | 0.076 | ||||
| ≥70 | 34 | 2.919 | 1.334–6.387 | 0.007 | 2.253 | 1.122–4.526 | 0.022 | 4.969 | 2.168–11.386 | <0.001 | ||||
| Total dose (Gy) | ≤75 | 129 | 1 | rif. | ||||||||||
| >75 | 44 | 0.375 | 0.168–0.833 | 0.016 | ||||||||||
| FIGO stage | I–II | 77 | 1 | rif. | 0.077 | 1 | rif. | 0.015 | 1 | rif. | 0.004 | 1 | rif. | 0.005 |
| III | 73 | 2.164 | 0.877–5.339 | 0.094 | 2.656 | 1.315–5.364 | 0.006 | 2.203 | 1.222–3.972 | 0.009 | 3.220 | 1.589–6.526 | 0.001 | |
| IV | 23 | 3.271 | 1.154–9.269 | 0.026 | 2.924 | 1.115–7.670 | 0.029 | 3.256 | 1.527–6.943 | 0.002 | 2.575 | 0.914–7.250 | 0.073 | |
| Hemoglobin | <10 | 16 | 1 | rif. | <0.001 | 1 | rif. | 0.008 | 1 | rif. | 0.013 | |||
| 10 ≤ x <12 | 42 | 0.467 | 0.188–1.157 | 0.100 | 0.445 | 0.193–1.027 | 0.058 | 0.488 | 0.184–1.295 | 0.150 | ||||
| ≥12 | 115 | 0.141 | 0.054–0.367 | <0.001 | 0.278 | 0.123–0.628 | 0.002 | 0.255 | 0.098–0.666 | 0.005 | ||||
| LLR | ≤4.17 | 93 | 1 | rif. | ||||||||||
| >4.17 | 80 | 0.628 | 0.363–1.086 | 0.096 | ||||||||||
| Author/Year | Evaluated Indexes | Cut-Off | Outcome Predictions | Confounders Considered |
|---|---|---|---|---|
| Koulis et al./2017 [10] | NLR | 5 11.5 | <PFS and <OS if Hb < 11.5; no impact of NLR alone (pre-CRT) | age; anemia; histological type; FIGO; T size; N stage; treatment |
| Haraga et al./2016 [12] | NLR PLR PNI | 2.85 172.5 48.5 | <OS and <PFS if <PNI; no impact of NLR and PLR (pre-CRT) | histological type; FIGO; T size; N stage; lymphovascular invasion |
| Jeong et al./2019 [13] | NLR | 2.8 | < PFS if >NLR; no impact on OS | age; histological type; T size; FIGO; treatment |
| Lee et al./2021 [14] | NLR PLR | 2.34 148.9 | <OS only if both >NLR and >PLR | age; histological type; FIGO; T size; N stage |
| Lee et al./2020 [15] | NLR MLR PLR | 3.04 174.3 3.85 | <DFS if >NLR, >ΔNLR, >ΔPLR (post-CRT); <OS if >NLR (post-CRT); no impact on OS of NLR, MLR, PLR (pre-CRT), ΔNLR, ΔMLR, ΔPLR, and MLR, PLR (post-CRT) | age; histological type; FIGO; T size; N stage |
| Lee et al./2012 [16] | NLR | 1.9 | <OS if >NLR (pre-CRT) | age; histological type; FIGO; treatment |
| Li et al./2021 [17] | NLR PLR MLR SIRI BLR | 2.49 154.2 0.26 1.02 0.02 | <OS and <PFS if >NLR and >MLR (pre-CRT); no impact of PLR, BLR, SIRI (pre-CRT) | age; histological type; T size; N stage; menopausal status |
| Mizunuma et al./2015 [18] | NLR | 2.5 | <OS and <PFS if >NLR (pre-CRT) | age; histological type; FIGO; T size; N stage; treatment |
| Onal et al./2016 [19] | NLR PLR | 3.03 133.0 | <OS, <PFS if >NLR; no impact of PLR (pre-CRT) | age; histological type; FIGO; T size; N stage |
| Wang et al./2016 [20] | NLR | 2 | <OS if >NLR (pre-CRT) | age; histological type; FIGO; T size; N stage |
| Holub et al./2019 [22] | NLR PLR SII ELR | 3.8 210 1000 0.07 | >OS if >ELR; <PFS if >PLR or >SII (pre-CRT) | age; histological type; FIGO; HPV status |
| Kim et al./2020 [23] | NLR PLR LMR | 2.33 136.6 4.17 | <PFS and OS if >ΔNLR; no impact of NLR, PLR, LMR (pre-CRT), and of ΔPLR, ΔLMR | age; histological type; FIGO |
| Jonska-Gymrec et al./2018 [24] | NLR PLR MLR | 1.6 158 0.33 | <OS if> NLR; no impact of PLR (pre-CRT) | age; histological type; FIGO; T grade; N stage |
| Chauan et al./2022 [25] | NLR PLR | 3 70 | >CR rate if <NLR and <PLR | age; histological type; FIGO |
| Li et al./2016 [26] | LMR | 5.28 | >PFS and >OS if >LMR (pre-CRT) | age; histological type; N stage; HPV status |
| Liang et al./2022 [27] | NLR | 3.87 | <OS and <PFS if >NLR (pre-CRT) | age; BMI; histological type; FIGO; T size; N stage; treatment |
| Ferioli et al./2023 [30] | NLR, PLR, MLR, SII, LLR, APRI, ALRI, SIRI, ANRI, COP * | c.v. | <distant metastasis-free survival if >SII | age; BMI; anemia; histological type; FIGO; T size; N stage; treatment; PNI |
| Present series | NLR, PLR, MLR, SII, LLR, APRI, ALRI, SIRI, ANRI, COP * | # | >LC if <NLR and >LLR (only without including clinical parameters in the multivariate analysis) | age; anemia; histological type; FIGO; T size; N stage; treatment |
Disclaimer/Publisher’s Note: The statements, opinions and data contained in all publications are solely those of the individual author(s) and contributor(s) and not of MDPI and/or the editor(s). MDPI and/or the editor(s) disclaim responsibility for any injury to people or property resulting from any ideas, methods, instructions or products referred to in the content. |
© 2023 by the authors. Licensee MDPI, Basel, Switzerland. This article is an open access article distributed under the terms and conditions of the Creative Commons Attribution (CC BY) license (https://creativecommons.org/licenses/by/4.0/).
Share and Cite
Medici, F.; Ferioli, M.; Forlani, L.; Laghi, V.; Ma, J.; Cilla, S.; Buwenge, M.; Macchia, G.; Deodato, F.; Vadalà, M.; et al. Decoding the Complexity of Systemic Inflammation Predictors in Locally Advanced Cervical Cancer, with Hemoglobin as the Hidden Key (the ESTHER Study). Cancers 2023, 15, 5056. https://doi.org/10.3390/cancers15205056
Medici F, Ferioli M, Forlani L, Laghi V, Ma J, Cilla S, Buwenge M, Macchia G, Deodato F, Vadalà M, et al. Decoding the Complexity of Systemic Inflammation Predictors in Locally Advanced Cervical Cancer, with Hemoglobin as the Hidden Key (the ESTHER Study). Cancers. 2023; 15(20):5056. https://doi.org/10.3390/cancers15205056
Chicago/Turabian StyleMedici, Federica, Martina Ferioli, Ludovica Forlani, Viola Laghi, Johnny Ma, Savino Cilla, Milly Buwenge, Gabriella Macchia, Francesco Deodato, Maria Vadalà, and et al. 2023. "Decoding the Complexity of Systemic Inflammation Predictors in Locally Advanced Cervical Cancer, with Hemoglobin as the Hidden Key (the ESTHER Study)" Cancers 15, no. 20: 5056. https://doi.org/10.3390/cancers15205056
APA StyleMedici, F., Ferioli, M., Forlani, L., Laghi, V., Ma, J., Cilla, S., Buwenge, M., Macchia, G., Deodato, F., Vadalà, M., Malizia, C., Tagliaferri, L., Perrone, A. M., De Iaco, P., Strigari, L., Arcelli, A., & Morganti, A. G. (2023). Decoding the Complexity of Systemic Inflammation Predictors in Locally Advanced Cervical Cancer, with Hemoglobin as the Hidden Key (the ESTHER Study). Cancers, 15(20), 5056. https://doi.org/10.3390/cancers15205056