Article

Interaction between Genetic Risks and Socioeconomic Factors on Thyroid Cancer: Evidence from 0.5 Million UK Biobank Participants

1
Department of Otolaryngology Head and Neck Surgery, Shanghai General Hospital, Shanghai Jiao Tong University School of Medicine, Shanghai 200080, China
2
Department of Surgery, LKS Faculty of Medicine, The University of Hong Kong, Hong Kong, China
*
Author to whom correspondence should be addressed.
These authors contributed equally to this work.
Cancers 2023, 15(20), 5028; https://doi.org/10.3390/cancers15205028
Submission received: 8 August 2023 / Revised: 21 September 2023 / Accepted: 16 October 2023 / Published: 18 October 2023
(This article belongs to the Special Issue Thyroid Cancer: Incidence and Risk Factors)

Abstract

:

Simple Summary

The interaction effect between genetic risk and socioeconomic factors on thyroid cancer remains unclear. In this study, we utilized a large-scale population dataset to comprehensively estimate the independent effects of genetic and socioeconomic factors and their interaction with thyroid cancer (TCa). The results of this study showed that (1) telomerase reverse transcriptase (TERT) variants significantly related to TCa risk were commonly situated in the intron 2 region; and (2) low-to-medium genetic risk combined with low household income was associated with a high TCa risk, whereas medium-to-high genetic risk combined with a higher education level and frequent social connection was associated with an increased TCa risk. These findings furnish insights into risk stratification and are informative for implementing the precise screening of thyroid cancer in the general population.

Abstract

Background: There is a research gap between genetic predisposition, socioeconomic factors, and their interactions on thyroid tumorigenesis. Methods: Individual and genetic data were obtained from UK Biobank. Logistic regression models were used to evaluate the association between genetic risk, socioeconomic factors, and thyroid cancer (TCa). A stratified analysis was conducted to estimate their joint effects. A two-sample Mendelian randomization (MR) analysis was further used to examine the potential causality. Results: A total of 502,394 participants were included in this study. Three index loci (rs4449583, rs7726159, and rs7725218) of telomerase reverse transcriptase (TERT) were found to be significantly related to incident TCa. Association analyses showed that high genetic risk, low household income, and high education level were independent risk factors, while unemployment and frequent social connection were suggestive risk factors for TCa. Interaction analyses showed that in participants with low genetic risk, low household income was significantly associated with TCa (odds ratio [OR] = 1.56, 95% confidence interval [CI]: 1.00–2.46). In participants with high genetic risk, those with a high education level (OR = 1.32, 95%CI: 1.06–1.65) and frequent social connection (OR = 1.36, 95%CI: 1.02–1.81) had a significantly increased risk of TCa. However, no causal relationship was observed in the MR analysis. Conclusion: Interactions exist between genetic risk, household income, education level, and social connection and thyroid cancer.

1. Introduction

Thyroid cancer (TCa) is one of the most frequent endocrine tumors, with an estimated 586,000 new cases and 44,000 cancer deaths worldwide in 2020, according to Global Cancer Statistics [1]. A wide range of risk factors for TCa have been identified to date [2], such as female sex, radiation exposure, excessive iodine intake, comorbid autoimmune disease, socioeconomic factors, and genetic susceptibility.
Genetic predisposition is the most critical risk factor for thyroid tumorigenesis. People with a family history of TCa were reported to have a three- to five-fold lifetime increment of TCa risk [3]. A prior study using UK Biobank (UKB) data of 264,956 participants suggested that compared to people with low genetic risk, based on single nucleotide polymorphisms (SNPs), those with intermediate and high risks were associated with 71% and 125% increased risks of incident TCa [4]. Mutations in telomerase-related gene regions in relation to tumorigenesis have long intrigued researchers. An example is telomerase reverse transcriptase (TERT), a key determinant of the enzymatic activity of telomerase, whose mutation was found to be related to numerous cancers, such as breast, bladder, prostate, and thyroid cancers [5,6].
In addition to genetic risk, socioeconomic factors have been reportedly associated with TCa development. A population-based study including one million participants showed that TCa incidence was 1.5 times elevated in high human development index (HDI) regions, compared with low HDI regions [7]. However, other observational studies from Europe and East Asia held the opposite view that higher income level was related to lower TCa risk [4,8]. In our prior research using the Surveillance, Epidemiology, and End Results Database (SEER) [9], we found that patients insured by Medicaid had a 2.15-fold poorer cancer-specific survival (CSS) and a 2.42-fold poorer overall survival (OS) than those insured by commercial insurance or Medicare. Additionally, divorced or widowed status, rural living location, and low Yost index were significantly associated with poor CSS and OS of thyroid adenomas/adenocarcinomas.
Although genetic and socioeconomic factors have been proven to influence TCa independently, the interaction effect between them remains unclear. Only one study to date has reported an interplay between genetic susceptibility and social behaviors on thyroid cancer [10]. Socioeconomic factors are suggested to play a crucial role in modifying the tumorous biological determinants activated by genetic mutations [11]. For instance, Goel et al. observed a significant synergistic effect between genetic variation and low neighborhood socioeconomic status for breast carcinogenesis [12]. Given a literature gap and equivocal understanding of the gene–environmental interaction on TCa etiology, it is essential to investigate how genetics and socioeconomics interplay in thyroid tumorigenesis.
Therefore, in this study, we utilize the latest UKB data to (1) comprehensively explore the genetic predisposition of TCa, including aggregate genetic risks and TERT loci polymorphisms; (2) re-confirm the risk effect of common socioeconomic factors (income, education, employment, and social connection) on TCa development; and (3) explore the interaction between the aforementioned genetic and socioeconomic factors and thyroid tumorigenesis.

2. Materials and Methods

2.1. Study Population

The study was performed using the UK Biobank [13], a large-scale biomedical database containing up to 0.5 million individuals between 40 and 69 years old recruited from 2006 to 2010. Participants were followed up for thyroid cancer (C73) using records linkage with the regional system of disease surveillance, chronic disease management, and electronic health records (EHRs) based on diagnostic codes from the International Classification of Diseases, 10th revision (ICD-10).

2.2. Measurement of Socioeconomic Factors

Demographic information including age and sex was collected by questionnaire. All societal exposures were derived from the baseline assessment center data collection, including annual household income, age finishing full-time education, highest education level, employment, household size, frequency of friend/family visits, and frequency of confiding in others. Missingness of variables of interest are shown in Table S1.

2.3. Ascertainment of Genetic Risk

Blood samples of each participant were collected, and germline DNA samples were extracted via a whole blood genomic DNA extraction kit and then further genotyped using the UK Biobank Axiom array [14]. Imputation for UKB genotyping data was performed using the IMPUTE4 program [14]. Genetic loci (SNPs) in relation to TCa were collected from the latest genome-wide association study (GWAS) [15] (Table S2), and these SNPs were used for calculating the polygenic risk score (PRS) in the UKB dataset, which is the proxy of TCa heritability.

2.4. Two-Sample Mendelian Randomization Study

A two-sample Mendelian randomization (MR) study was conducted to examine the causal effects of socioeconomic factors on thyroid cancer. This methodology, based on instrumental variable (IV) principles, allowed us to explore the causality between exposures and outcomes using multiple genetic variants from summary-level data [16]. This approach has been widely used to explore the risk factors for various tumors [17,18]. The framework of this study was in line with the three MR assumptions: (i) instrumental variables (SNP) were truly associated with the socioeconomic factors, (ii) SNPs were unrelated to the confounders on the exposure–TCa nexus, and (iii) SNPs affected TCa only through socioeconomic factors. The instrumental variables (SNPs) of the socioeconomic factors were obtained from publicly downloadable sources, including the GWAS catalog (www.ebi.ac.uk/gwas (accessed on 26 July 2023)) and the MR-Base repository of full GWAS association statistics (www.mrbase.org (accessed on 26 July 2023)). Most of the summary GWAS data on the exposure traits were from the UKB database. To reduce bias caused by sample overlap between the exposure and the outcome datasets, we used the FinnGen r9 database to collect the summary GWAS data on TCa traits [19] (Table S3).

2.5. Statistical Analysis

The association between each SNP and TCa risk was estimated by the odds ratio (OR), 95% confidence interval (CI), and corresponding p-value using logistic regression analysis with adjustment for age and sex based on an additive model. We further used the MAGMA v1.10 software to implement the gene-based analysis according to the remission and percentage improvement in GWAS p-values [20]. The gene-based analysis was performed based on genetic variants and linkage disequilibrium (LD) in the 1000 Genomes European panel reference datasets, and then SNPs were assigned to genes using the MAGMA NCBI37.3.gene.loc file with a 10 kb window. Associations were estimated using Z statistics and corresponding p-values. The PRS was calculated by aggregating the number of risk alleles carried in each individual, with effect size weighted for each variance. Regional plots and an LD heatmap were created by using LocusZoom (http://csg.sph.umich.edu/locuszoom/ (accessed on 26 June 2023)) and LDBlockShow v1.39 software [21]. Since the percentages of missing values were less than 2% for all variables of interest, all association and stratified analyses below were complete case analyses. Risk stratification of thyroid cancer was conducted using a tertile method, and participants were divided into low, medium, and high genetic risks correspondingly. Joint analyses of genetic and socioeconomic factors were performed by creating categorical interaction terms, which were further examined by Wald tests. The random-effects inverse-variance weighted method was used to pool the effects of proxy SNPs on TCa in the MR main analysis [16]. A two-tailed Bonferroni correction method for p-values was adopted in baseline comparison and SNP–TCa association analyses. Other statistical tests were two-tailed, and p-values were deemed statistically significant at the <0.05 level. All statistical analyses were performed under PLINK v1.90 and R4.1.2.

3. Results

3.1. Participant Characteristics

A total of 502,394 participants (1026 TCa cases/501,368 controls) were included in this study (Table 1). Briefly, female sex (p < 0.001), low household income (p = 0.001), and unemployment status (p = 0.004) were significantly observed in TCa patients. These patients were unlikely to be involved in heavy work in their jobs (p = 0.026).

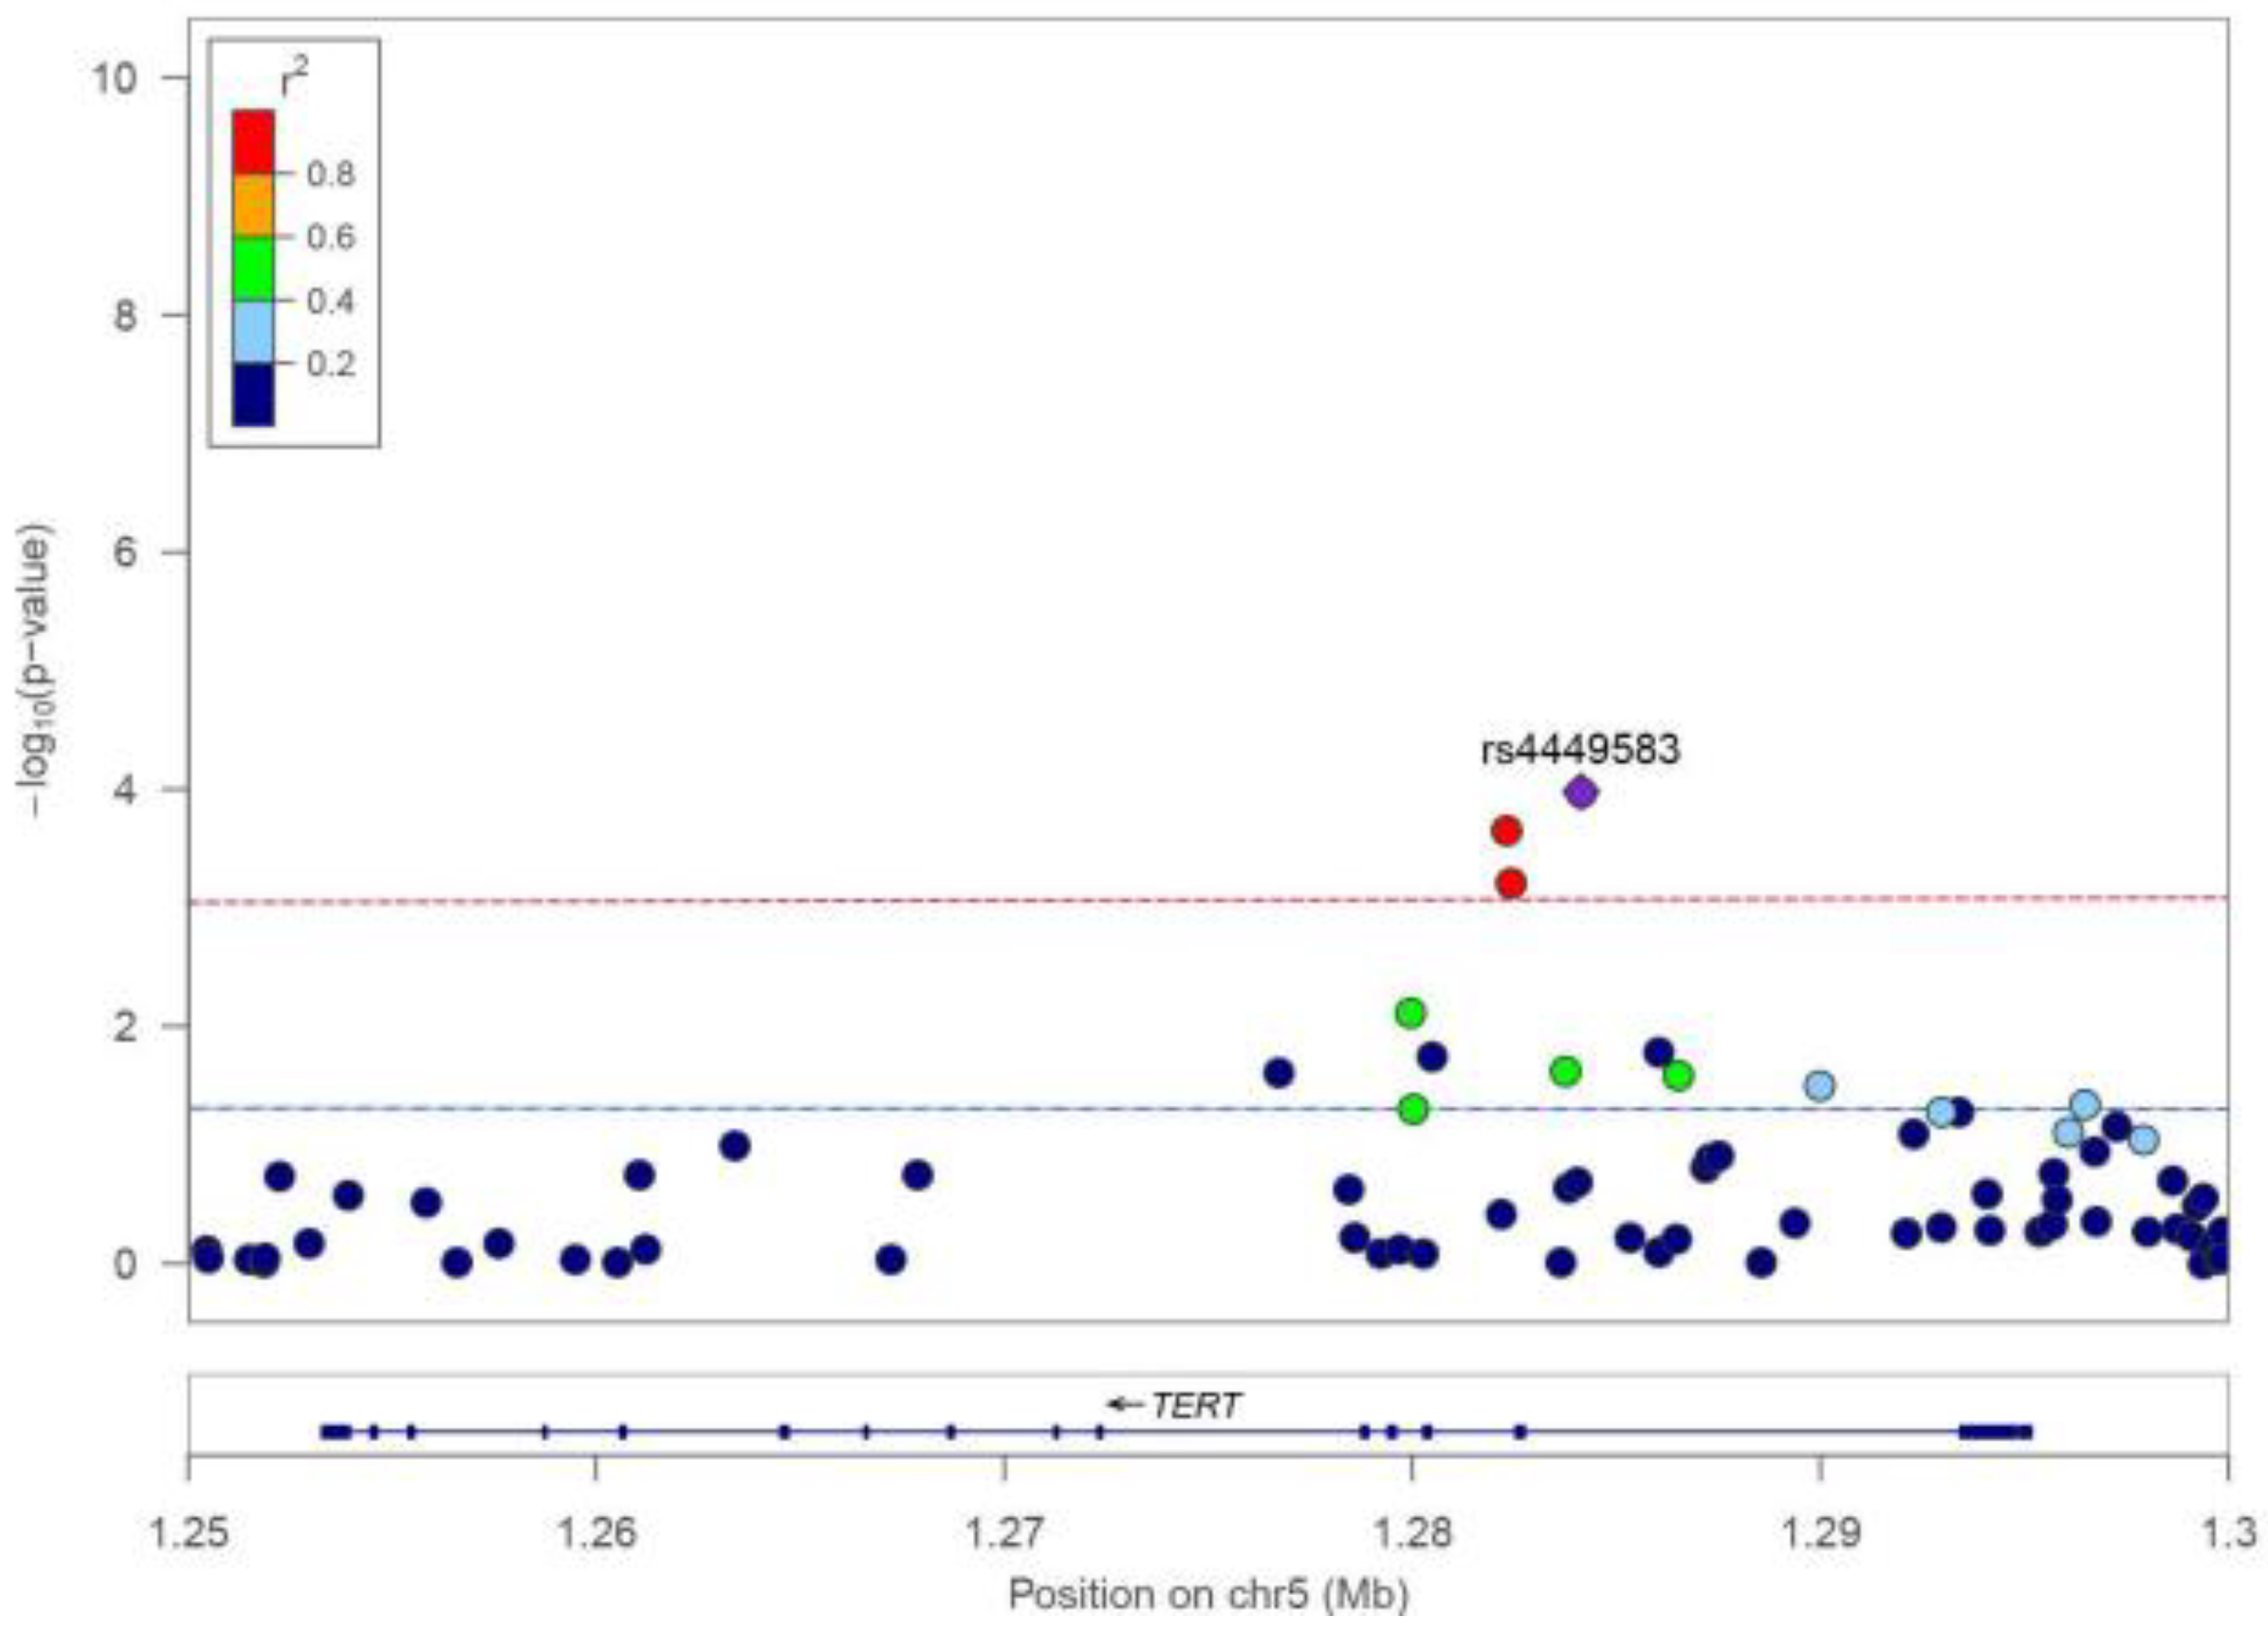
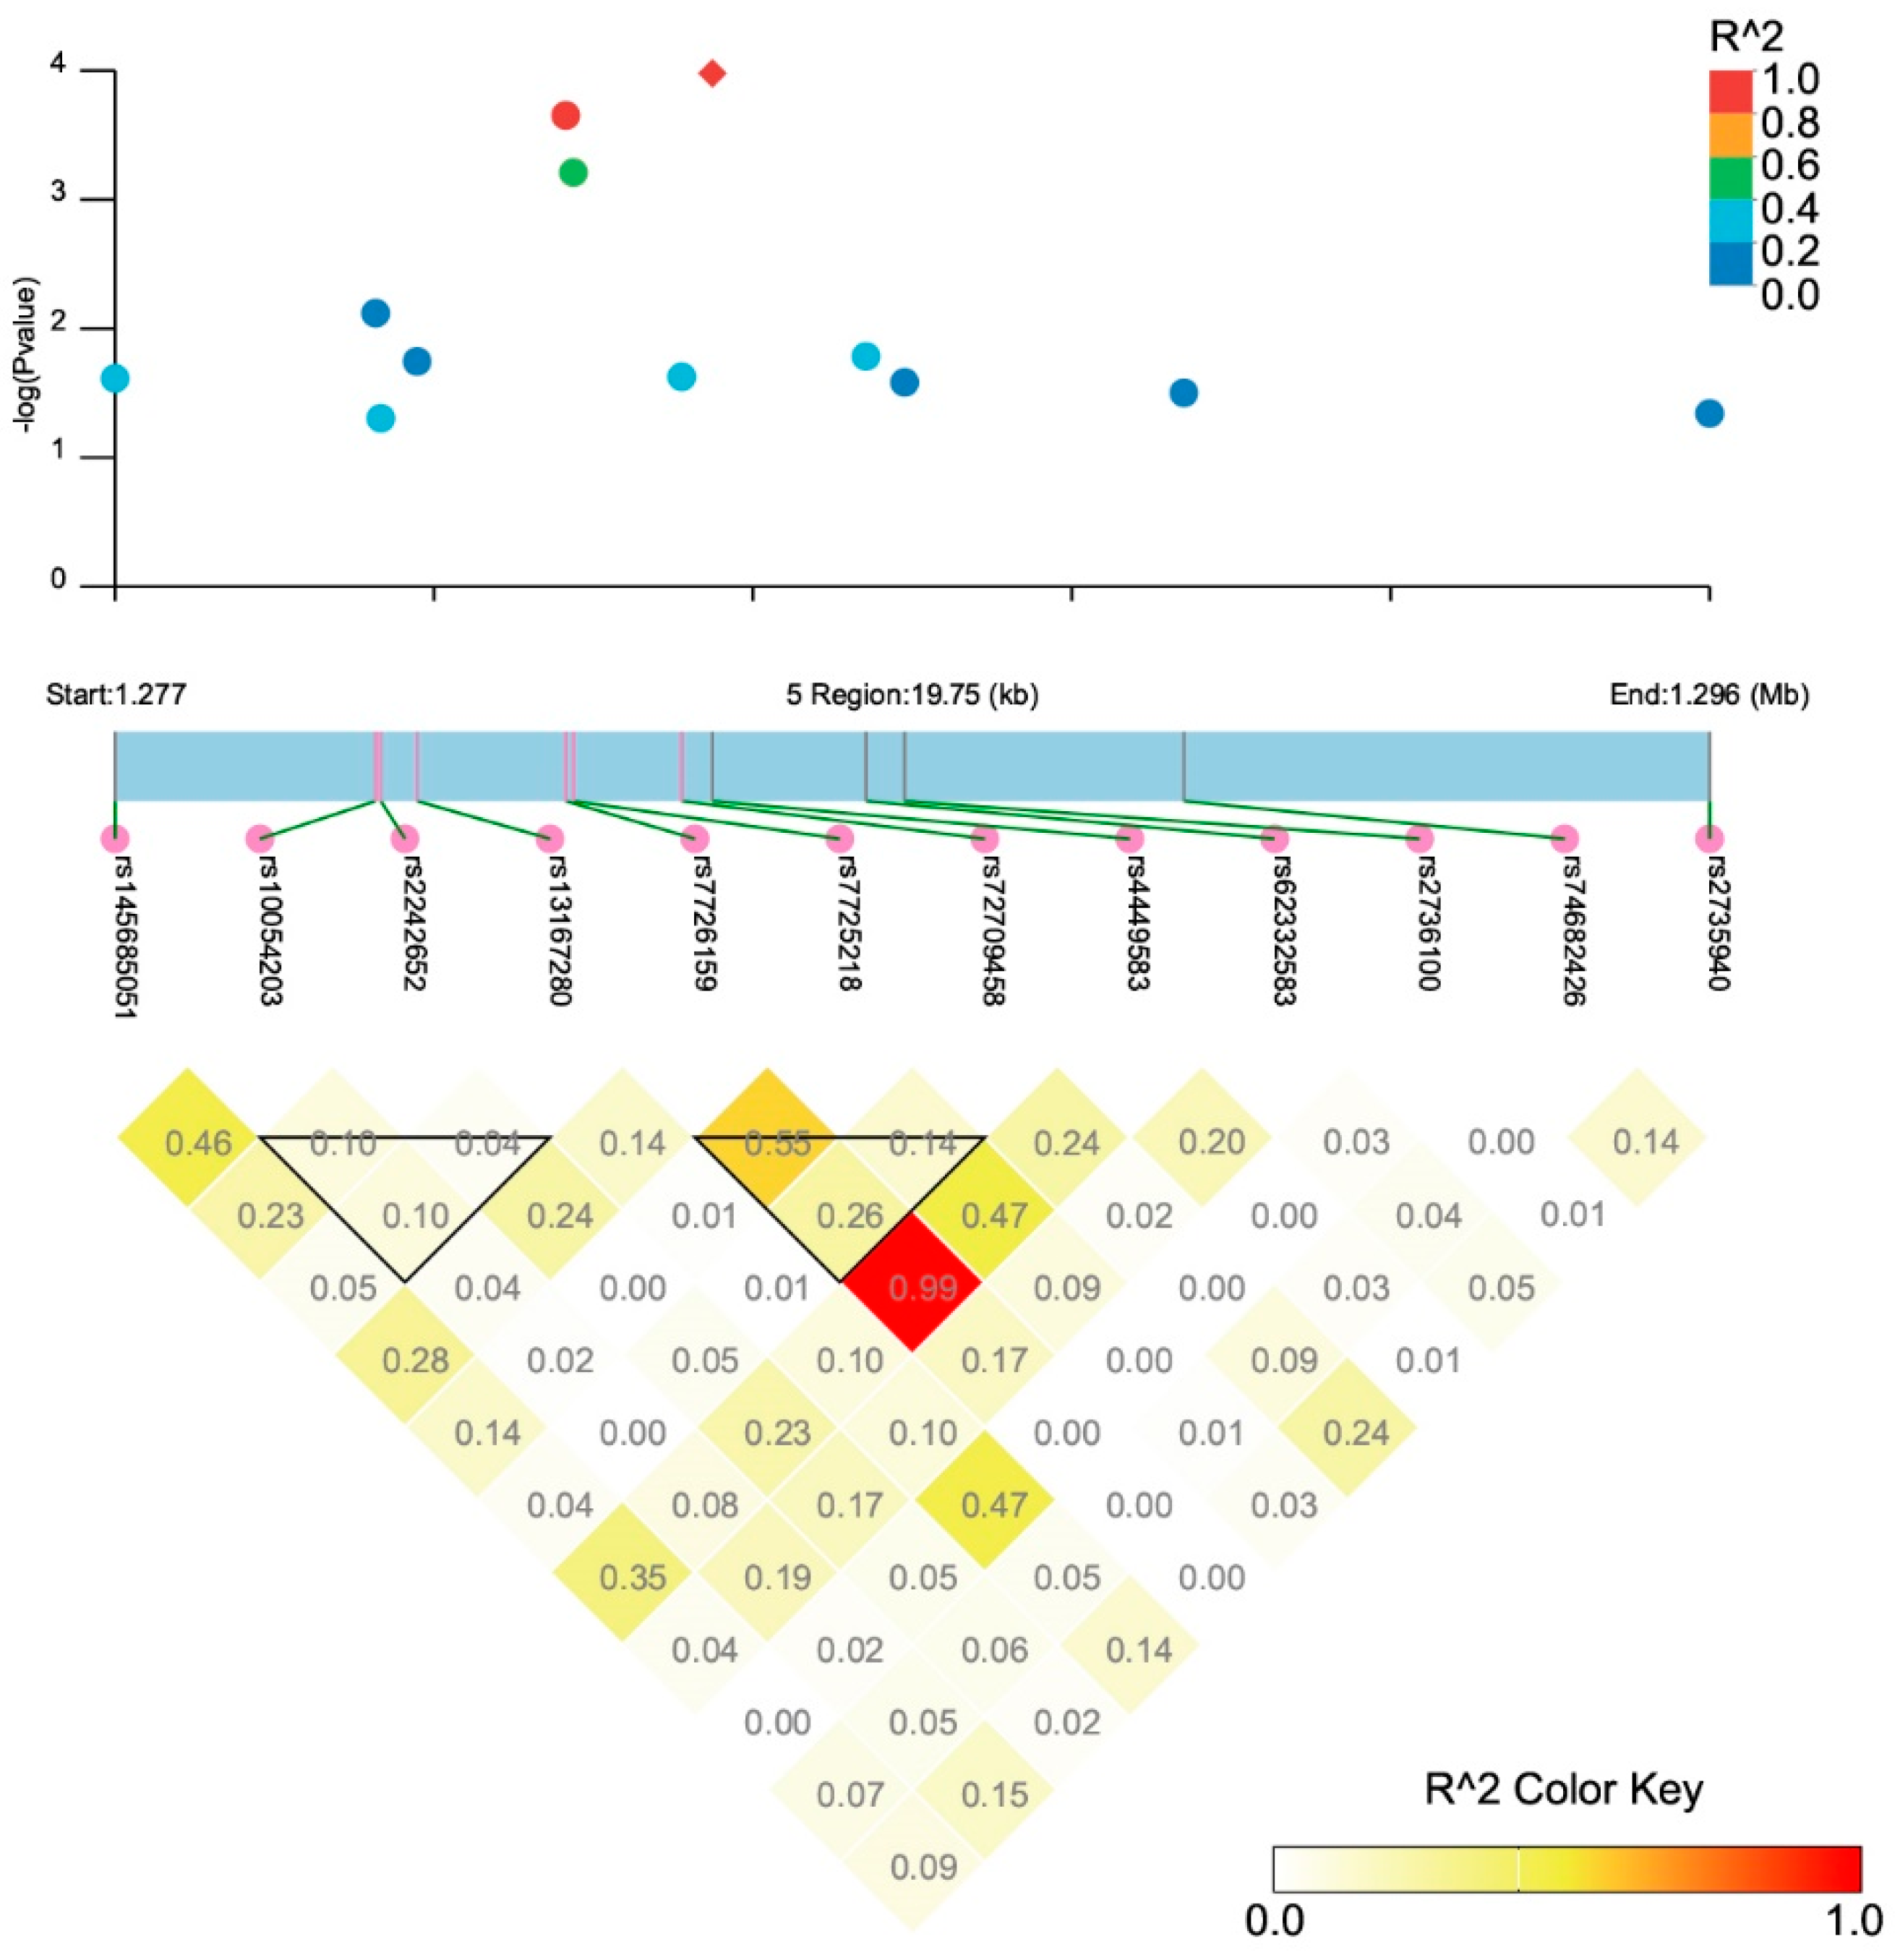
3.2. Association between TERT SNPs and TCa Risk

After quality control, 473,367 participants with germline genetic variation data were included in the association analysis on TERT SNPs and TCa risk. A total of 12 tagging SNPs were identified (Figure 1), among which rs4449583 (OR = 1.20, 95%CI: 1.10–1.32, p = 1.05 × 10⁻⁴), rs7726159 (OR = 1.19, 95%CI: 1.09–1.31, p = 2.23 × 10⁻⁴), and rs7725218 (OR = 1.18, 95%CI: 1.07–1.29, p = 6.17 × 10⁻⁴) were significantly associated with TCa after Bonferroni correction for multiplicity (p < 0.0042) (Table 2). Figure 2 shows that no linkage disequilibrium was observed between the index SNP rs4449583 (located at intron 2 of TERT) and other surrounding loci, which indicated this locus to be an independent risk locus for thyroid cancer. We further performed a gene-based analysis using 49 TERT SNPs and found that TERT was significantly related to thyroid cancer (Z = 2.76, p = 0.003).

3.3. Genetic Susceptibility, Socioeconomic Factors, and TCa Risk

In terms of genetic susceptibility, compared to participants with low PRS, those with high and medium PRSs had 2.49- (95%CI: 2.10–2.94) and 1.63-fold (95%CI: 1.36–1.95) increased risks of TCa. As for socioeconomic factors, the crude model showed that low annual household income (<£52,000), high education level (college/university or above), unemployed status, and frequent social connection (≥1 time/week) were potential risk factors. After adjustment with age and sex, we found that low household income and high education level were associated with 23% (OR = 1.23, 95%CI: 1.02–1.47) and 19% (OR = 1.19, 95%CI: 1.02–1.39) increased risks of TCa (Table 3).

3.4. Interaction between Genetic and Socioeconomic Factors on TCa Risk

Joint analyses showed a potential interplay between genetic risk, household income, and frequent social connection (p-interaction < 0.05). After stratification, we observed that in participants with low PRS, low household income was significantly associated with TCa (OR = 1.56, 95%CI: 1.00–2.46). In participants with medium PRS, high TCa risk was also observed in those with low household income (OR = 1.46, 95%CI: 1.03–2.08). In participants with high PRS, those with a high education level (OR = 1.32, 95%CI: 1.06–1.65) and frequent social connections (OR = 1.36, 95%CI: 1.02–1.81) had a significantly increased risk of TCa (Table 4).
To estimate the interaction between TERT polymorphism, socioeconomic factors, and TCa risk, we focused on the variant of the index SNP rs4449583. We found that in participants carrying a genotype of CC, those with low household income had a 45% (OR = 1.45, 95%CI: 1.06–1.98) significantly increased risk of TCa, while those with a high education level and unemployment had 25% and 31% increased risks of TCa (Table 5).

3.5. Examination of Causal Effect by MR Analysis

An MR analysis was further performed to examine the causal effect between the aforementioned socioeconomic factors and thyroid cancer risk. But we did not observe any significant causality of low family income, high education level, unemployed status, and frequent social connection on incident TCa (p > 0.05) (Table 6 and Figures S1 and S2).

4. Discussion

This large-scale population-based study comprehensively evaluated the association between genetic susceptibility, socioeconomic factors, and their interactions with thyroid cancer. Specifically, we found that (1) half of the variants significantly related to TCa risk were situated in the intron 2 region of TERT; and (2) low-to-medium genetic risk combined with low household income was associated with a high TCa risk, whereas medium-to-high genetic risk combined with high education level or frequent social connection was associated with an increased TCa risk. Results of the present study are informative for risk stratification and the precise screening of thyroid cancer in the general population.
This study suggested that risk loci in the intron 2 region were significantly associated with TCa rather than the promoter region of TERT. As reported by previous research, there may be a putative regulatory region located in intron 2 of TERT that can elicit biological functions by genome organization, transcription regulation, and alternative splicing, etc. [22]. For instance, a prior functional experiment found that SNP rs2736100 was located in an intronic enhancer and could pose a genotype-specific impact on TERT expression by gene regulation [23]. In addition, DNA methylation, often occurring in intron regions [24], plays an important role in tissue-specific transcriptional regulation and is considered a biomarker for multiple cancers [25].
Another important finding of this study is the joint effect between genetic susceptibility and socioeconomic factors. Our study revealed that people with lower family income had a higher risk of TCa, even under low-to-medium genetic risk, whilst people with better social connection combined with high genetic risk should receive regular screening, since they had a higher TCa risk. Household income, regarded as a surrogate marker for health disparity, can influence people when it comes to accessing primary care and health examinations [26]. Other studies showed that a bottom income level was significantly associated with advanced-stage TCa and poor cancer-specific survival [26,27]. The positive correlation between high education level and incident TCa may be due to an early diagnosis [28]. People with a higher level of education have generally increased health awareness, and they tend to seek early medical attention, which may allow them to detect an indolent cancer. Our study is the first to investigate a positive relationship between frequent family/friend visits and the risk of thyroid cancer. A plausible explanation is the risky lifestyle (e.g., excessive iodine intake) aggregation and spread among family members/friends through social network and communication. Another explanation is that these people become more informed about their cancer risk and have increased awareness to receive examinations, resulting in early diagnosis. The findings of the present study provide insights into the risk stratification and precise screening of thyroid cancer in the general population.
There are several limitations in this study. First, limited thyroid cancer cases have been collected in the UK Biobank dataset. However, the prospective cohort design based on a large-scale general population with sufficient genetic data provided strong evidence for assessing the effects of genetic and socioeconomic factors on TCa. Second, given the scant genome-wide association analysis on TCa subtypes, we could not investigate the association between genetic and socioeconomic factors and TCa from a subtype-specific perspective. This merits further exploration in future research. Third, the limited number of thyroid cancer deaths in the current dataset preclude us from exploring the interplay effect on cancer-specific death. Fourth, the test in this study that was based on statistical significance may lead to unimportant differences, simply due to large sample sizes. More attention should be paid to the sizes of point estimates, as well as the deviations between interval estimates and the crossing point. Finally, the residual confounding might bias the effect estimate in the cohort study because we did not observe a causal relationship between socioeconomic factors and TCa in the MR analysis.

5. Conclusions

To sum up, this study utilizes large-scale population data from the UK Biobank to comprehensively evaluate the relationship and interaction of genetic susceptibility (including cumulative germline genetic risk and TERT variation) and socioeconomic factors with the risk of thyroid cancer. We find that low-to-medium genetic risk combined with low household income is associated with a high TCa risk, whereas a medium-to-high genetic risk combined with high education level or frequent social connection is associated with an increased TCa risk. The findings of this study furnish insights into risk stratification and is imperative for implementing precise screening of thyroid cancer in the general population.

Supplementary Materials

The following supporting information can be downloaded at: https://www.mdpi.com/article/10.3390/cancers15205028/s1. Figure S1. Scatter plots of the four socioeconomic traits in relation to thyroid cancer. Figure S2. Funnel plots of each single nucleotide polymorphism of the four socioeconomic traits in relation to thyroid cancer. Table S1. Missingness of variables of interest in this study (n, %). Table S2. Association results from latest genome-wide association studies for previously reported thyroid cancer risk loci in European ancestry. Table S3. Characteristics of GWAS summary data for socioeconomic factors and thyroid cancer in European ancestry.

Author Contributions

Y.L. designed the research and drafted the manuscript. Y.Z. undertook the statistical analyses and drafted the manuscript. W.M. and B.W. conducted data collection and provided technical support. P.D. supervised the study and revised the manuscript. R.N. provided the fundings and revised the manuscript. All authors have read and agreed to the published version of the manuscript.

Funding

This work was supported by grants from the National Natural Science Foundation of China [grant number 81972645], Shenzhen-Hong Kong-Macau Science and Technology Program (Category C) (SGDX20220530111403024), an innovative research team of high-level local universities in Shanghai, the Shanghai Youth Talent Support Program, and an intramural grant of The University of Hong Kong to R.N. The funders had no roles in the design and conduct of the study; in the collection, management, analysis, and interpretation of the data; in the preparation, review, or approval of the manuscript; and in the decision to submit the manuscript for publication.

Institutional Review Board Statement

The study was conducted in accordance with the Declaration of Helsinki and was approved by the Institutional Review Board of each hospital. Data of this study are secondary data from UK Biobank, whose ethnical approval information have been published in previous research [14]. Specifically, the UKB study was approved by the North West Centre for Research Ethics Committee (21/NW/0157) on 29 June 2021.

Informed Consent Statement

Informed consent was obtained from all subjects in the UKB project.

Data Availability Statement

UKB data used in this research are publicly available to qualified researchers upon application to the UK Biobank (www.ukbiobank.ac.uk (accessed on 12 May 2023)). The study protocol, statistical analysis plan, and analytical code of this study will be available from the time of publication in response to any reasonable request to the corresponding author.

Acknowledgments

We thank the UK Biobank (Access Number: 66813) for access to the data.

Conflicts of Interest

The authors declare no conflict of interest.

References

  1. Sung, H.; Ferlay, J.; Siegel, R.L.; Laversanne, M.; Soerjomataram, I.; Jemal, A.; Bray, F. Global Cancer Statistics 2020: GLOBOCAN Estimates of Incidence and Mortality Worldwide for 36 Cancers in 185 Countries. CA Cancer J. Clin. 2021, 71, 209–249. [Google Scholar] [CrossRef]
  2. Bogovic Crncic, T.; Ilic Tomas, M.; Girotto, N.; Grbac Ivankovic, S. Risk Factors for Thyroid Cancer: What Do We Know So Far? Acta Clin. Croat. 2020, 59, 66–72. [Google Scholar] [CrossRef] [PubMed]
  3. Parad, M.T.; Fararouei, M.; Mirahmadizadeh, A.R.; Afrashteh, S. Thyroid cancer and its associated factors: A population-based case-control study. Int. J. Cancer 2021, 149, 514–521. [Google Scholar] [CrossRef]
  4. Feng, X.; Wang, F.; Yang, W.; Zheng, Y.; Liu, C.; Huang, L.; Li, L.; Cheng, H.; Cai, H.; Li, X.; et al. Association Between Genetic Risk, Adherence to Healthy Lifestyle Behavior, and Thyroid Cancer Risk. JAMA Netw. Open. 2022, 5, e2246311. [Google Scholar] [CrossRef]
  5. Zhan, Y.; Ruan, X.; Liu, J.; Huang, D.; Huang, J.; Huang, J.; Chun, T.T.S.; Ng, A.T.; Wu, Y.; Wei, G.; et al. Genetic Polymorphisms of the Telomerase Reverse Transcriptase Gene in Relation to Prostate Tumorigenesis, Aggressiveness and Mortality: A Cross-Ancestry Analysis. Cancers 2023, 15, 2650. [Google Scholar] [CrossRef] [PubMed]
  6. Zhang, X.; Chen, Y.; Yan, D.; Han, J.; Zhu, L. TERT Gene rs2736100 and rs2736098 Polymorphisms are Associated with Increased Cancer Risk: A Meta-Analysis. Biochem. Genet. 2022, 60, 241–266. [Google Scholar] [CrossRef] [PubMed]
  7. Fidler, M.M.; Gupta, S.; Soerjomataram, I.; Ferlay, J.; Steliarova-Foucher, E.; Bray, F. Cancer incidence and mortality among young adults aged 20–39 years worldwide in 2012: A population-based study. Lancet Oncol. 2017, 18, 1579–1589. [Google Scholar] [CrossRef]
  8. Myung, S.K.; Lee, C.W.; Lee, J.; Kim, J.; Kim, H.S. Risk Factors for Thyroid Cancer: A Hospital-Based Case-Control Study in Korean Adults. Cancer Res. Treat. 2017, 49, 70–78. [Google Scholar] [CrossRef]
  9. Li, Y.; Huang, D.; Wang, B.; Mao, W.; Chen, X.; Dong, P. Socioeconomic factors are associated with the prognosis of Thyroid Cancer. J. Cancer 2021, 12, 2507–2512. [Google Scholar] [CrossRef]
  10. Luo, J.; Li, H.; Deziel, N.C.; Huang, H.; Zhao, N.; Ma, S.; Ni, X.; Udelsman, R.; Zhang, Y. Genetic susceptibility may modify the association between cell phone use and thyroid cancer: A population-based case-control study in Connecticut. Environ. Res. 2020, 182, 109013. [Google Scholar] [CrossRef]
  11. Mbemi, A.; Khanna, S.; Njiki, S.; Yedjou, C.G.; Tchounwou, P.B. Impact of Gene-Environment Interactions on Cancer Development. Int. J. Environ. Res. Public. Health 2020, 17, 8089. [Google Scholar] [CrossRef]
  12. Goel, N.; Yadegarynia, S.; Kwon, D.; Kesmodel, S.B.; Harbour, J.W.; Kobetz, E.; Merchant, N.; Rodriguez, D.A. Translational Epidemiology: An Integrative Approach to Determine the Interplay Between Genetic Ancestry and Neighborhood Socioeconomic Status on Triple Negative Breast Cancer. Ann. Surg. 2022, 276, 430–440. [Google Scholar] [CrossRef] [PubMed]
  13. Sudlow, C.; Gallacher, J.; Allen, N.; Beral, V.; Burton, P.; Danesh, J.; Downey, P.; Elliott, P.; Green, J.; Landray, M.; et al. UK biobank: An open access resource for identifying the causes of a wide range of complex diseases of middle and old age. PLoS Med. 2015, 12, e1001779. [Google Scholar] [CrossRef] [PubMed]
  14. Bycroft, C.; Freeman, C.; Petkova, D.; Band, G.; Elliott, L.T.; Sharp, K.; Motyer, A.; Vukcevic, D.; Delaneau, O.; O’Connell, J.; et al. The UK Biobank resource with deep phenotyping and genomic data. Nature 2018, 562, 203–209. [Google Scholar] [CrossRef] [PubMed]
  15. Gudmundsson, J.; Thorleifsson, G.; Sigurdsson, J.K.; Stefansdottir, L.; Jonasson, J.G.; Gudjonsson, S.A.; Gudbjartsson, D.F.; Masson, G.; Johannsdottir, H.; Halldorsson, G.H.; et al. A genome-wide association study yields five novel thyroid cancer risk loci. Nat. Commun. 2017, 8, 14517. [Google Scholar] [CrossRef]
  16. Burgess, S.; Butterworth, A.; Thompson, S.G. Mendelian randomization analysis with multiple genetic variants using summarized data. Genet. Epidemiol. 2013, 37, 658–665. [Google Scholar] [CrossRef]
  17. Zhan, Y.; Ruan, X.; Wang, P.; Huang, D.; Huang, J.; Huang, J.; Chun, T.T.S.; Ho, B.S.; Ng, A.T.; Tsu, J.H.; et al. Causal Effects of Modifiable Behaviors on Prostate Cancer in Europeans and East Asians: A Comprehensive Mendelian Randomization Study. Biology 2023, 12, 673. [Google Scholar] [CrossRef]
  18. Zhan, Y.; Wang, Y.; Qu, Y.; Zhang, L.; Liu, X.; Liu, R.; Xue, P.; Wang, J.; Qin, D.; Yue, H.; et al. Pregnancy Loss in Relation to the Risks of Female-Specific Cancers in a Population-Based Cohort and Mendelian Randomization Study—China, 2004–2017. China CDC Wkly. 2023, 5, 413–418. [Google Scholar] [CrossRef]
  19. Kurki, M.I.; Karjalainen, J.; Palta, P.; Sipila, T.P.; Kristiansson, K.; Donner, K.M.; Reeve, M.P.; Laivuori, H.; Aavikko, M.; Kaunisto, M.A.; et al. FinnGen provides genetic insights from a well-phenotyped isolated population. Nature 2023, 613, 508–518. [Google Scholar] [CrossRef]
  20. de Leeuw, C.A.; Mooij, J.M.; Heskes, T.; Posthuma, D. MAGMA: Generalized gene-set analysis of GWAS data. PLoS Comput. Biol. 2015, 11, e1004219. [Google Scholar] [CrossRef]
  21. Dong, S.S.; He, W.M.; Ji, J.J.; Zhang, C.; Guo, Y.; Yang, T.L. LDBlockShow: A fast and convenient tool for visualizing linkage disequilibrium and haplotype blocks based on variant call format files. Brief. Bioinform. 2021, 22, bbaa227. [Google Scholar] [CrossRef] [PubMed]
  22. Chorev, M.; Carmel, L. The function of introns. Front. Genet. 2012, 3, 55. [Google Scholar] [CrossRef] [PubMed]
  23. Ge, M.; Shi, M.; An, C.; Yang, W.; Nie, X.; Zhang, J.; Lv, Z.; Li, J.; Zhou, L.; Du, Z.; et al. Functional evaluation of TERT-CLPTM1L genetic variants associated with susceptibility of papillary thyroid carcinoma. Sci. Rep. 2016, 6, 26037. [Google Scholar] [CrossRef] [PubMed]
  24. Neri, F.; Rapelli, S.; Krepelova, A.; Incarnato, D.; Parlato, C.; Basile, G.; Maldotti, M.; Anselmi, F.; Oliviero, S. Intragenic DNA methylation prevents spurious transcription initiation. Nature 2017, 543, 72–77. [Google Scholar] [CrossRef]
  25. Li, L.; Gao, Y.; Wu, Q.; Cheng, A.S.L.; Yip, K.Y. New guidelines for DNA methylome studies regarding 5-hydroxymethylcytosine for understanding transcriptional regulation. Genome Res. 2019, 29, 543–553. [Google Scholar] [CrossRef]
  26. Siu, S.; McDonald, J.T.; Rajaraman, M.; Franklin, J.; Paul, T.; Rachinsky, I.; Morrison, D.; Imran, S.A.; Burrell, S.; Hart, R.; et al. Is lower socioeconomic status associated with more advanced thyroid cancer stage at presentation? A study in two Canadian centers. Thyroid 2014, 24, 545–551. [Google Scholar] [CrossRef]
  27. Swegal, W.C.; Singer, M.; Peterson, E.; Feigelson, H.S.; Kono, S.A.; Snyder, S.; Melvin, T.A.; Calzada, G.; Ghai, N.R.; Saman, D.M.; et al. Socioeconomic Factors Affect Outcomes in Well-Differentiated Thyroid Cancer. Otolaryngol. Head. Neck Surg. 2016, 154, 440–445. [Google Scholar] [CrossRef]
  28. Klotz, L. Cancer overdiagnosis and overtreatment. Curr. Opin. Urol. 2012, 22, 203–209. [Google Scholar] [CrossRef]
Figure 1. Regional plot of thyroid cancer-related SNPs in the TERT locus. (Statistical significance: p < 6.41 × 10⁻⁴ in the red dotted line; suggestive significance: p < 0.05 in the blue dotted line; r2 refers to the correlation coefficient of the linkage disequilibrium between loci.)
Cancers 15 05028 g001
Figure 2. Significant thyroid cancer-related SNPs and their linkage disequilibrium status. (R2 refers to the correlation coefficient of the linkage disequilibrium between loci.)
Cancers 15 05028 g002
Table 1. Characteristics of thyroid cancer cases and controls in the UKB population (n, %).
CasesControlsp-Value
N1026501,368
Age, years (mean ± SD)56.9 ± 7.756.5 ± 8.10.170
Sex <0.001
Female781 (76.1)272,534 (54.4)
Male245 (23.9)228,834 (45.6)
Annual household income 0.001
≤£30,999419 (41.2)204,912 (41.4)
£31,000–£51,999242 (23.8)110,508 (22.3)
≥£52,000180 (17.7)108,991 (22.0)
Not known/Refuse to answer175 (17.3)70,953 (14.3)
Missing106004
Age finishing full-time education 0.740
≤15 years206 (30.7)103,019 (30.6)
16–20 years392 (58.4)200,877 (59.7)
≥21 years60 (8.9)26,320 (7.8)
Not known/Refuse to answer13 (1.9)6451 (1.9)
Missing355164,701
Education level 0.260
College/university or above352 (34.6)160,765 (32.4)
High school121 (11.9)55,186 (11.1)
Middle school or below363 (35.7)190,216 (38.3)
Not known/Refuse to answer181 (17.8)90,568 (18.2)
Missing94633
Employment status 0.004
Employed537 (52.4)286,529 (57.2)
Unemployed472 (46.1)209,105 (41.8)
Not known/Refuse to answer15 (1.5)4864 (1.0)
Missing2870
Job involves heavy work 0.026
Never/rarely384 (71.0)186,824 (64.9)
Sometimes97 (17.9)61,951 (21.5)
Usually/always60 (11.1)38,808 (13.5)
Not known/Refuse to answer0 (0.0)335 (0.1)
Missing485213,450
Job involves walking or standing 0.670
Never/rarely198 (36.6)101,236 (35.2)
Sometimes168 (31.1)88,036 (30.6)
Usually/always175 (32.3)98,265 (34.1)
Not known/Refuse to answer0 (0.0)379 (0.1)
Missing485213,452
Job involves night shift work 0.280
Never/rarely58 (53.2)25,583 (49.5)
Sometimes23 (21.1)14,583 (28.2)
Usually/always28 (25.7)11,191 (21.6)
Not known/Refuse to answer0 (0.0)343 (0.7)
Missing917449,668
Household size 0.260
One186 (18.2)92,701 (18.6)
Two506 (49.5)232,201 (46.5)
Three or more326 (31.9)171,925 (34.4)
Not known/Refuse to answer5 (0.5)2283 (0.5)
Missing32258
Frequency of friend/family visits 0.057
<1 time/week194 (19.1)108,137 (21.8)
1 time/week348 (34.2)176,024 (35.4)
≥2 times/week467 (45.9)209,292 (42.1)
Not known/Refuse to answer8 (0.8)3270 (0.7)
Missing94645
Frequency of confiding in others 0.082
<1 time/month182 (17.8)98,879 (19.8)
1 time/month to 4 times/week283 (27.6)125,673 (25.1)
≥5 times/week531 (51.9)257,973 (51.5)
Not known/Refuse to answer28 (2.7)17,931 (3.6)
Missing2912
SD, standard deviation. The distributions of baseline characteristics were compared between two groups using a t-test for continuous variables, while a chi-square test was used for categorical variables. Significant p-value (p < 0.05) are shown in bold.
Table 2. Significant associations between TERT SNPs and thyroid cancer in the UKB.
SNP IDPosition *LocationAlleles #RAFOR (95% CI)p-Value
rs1456850511276736Intron 6G/A0.0171.41 (1.05–1.90)0.024
rs100542031279964Intron 4C/G0.3991.14 (1.03–1.25)0.008
rs22426521280028Intron 4A/G0.1891.12 (1.00–1.25)0.049
rs131672801280477Intron 3A/G0.1191.18 (1.03–1.34)0.018
rs77261591282319Intron 3A/C0.3271.19 (1.09–1.31)2.23 × 10⁻⁴
rs77252181282414Intron 3A/G0.3411.18 (1.07–1.29)6.17 × 10⁻⁴
rs727094581283755Intron 2T/C0.2011.14 (1.02–1.27)0.024
rs44495831284135Intron 2T/C0.3251.20 (1.10–1.32)1.05 × 10⁻⁴
rs623325831286037Intron 2T/C0.0141.48 (1.07–2.03)0.016
rs27361001286516Intron 2C/A0.5031.11 (1.01–1.21)0.026
rs746824261289975Intron 2A/C0.1331.15 (1.01–1.31)0.031
rs27359401296486PromoterA/G0.5141.10 (1.00–1.20)0.045
* Located in chromosome 5; # risk allele/reference allele. SNP, single nucleotide polymorphism; RAF, risk allele frequency; OR, odds ratio; 95% CI, 95% confidence interval.
Table 3. Thyroid cancer risks by polygenic risk levels and socio-economic factors.
Crude ModelAdjusted Model
OR (95%CI)p-ValueOR (95%CI)p-Value
PRS levels
Low1.00 1.00
Medium1.63 (1.36–1.94)<0.0011.63 (1.36–1.95)<0.001
High2.47 (2.09–2.91)<0.0012.49 (2.10–2.94)<0.001
Annual household income
≥£52,0001.00 1.00
<£52,0001.27 (1.08–1.50)0.0051.23 (1.02–1.47)0.029
Age finishing full-time education
20 years or less1.00 1.00
21 years or more1.01 (0.85–1.19)0.9521.02 (0.85–1.21)0.852
Education level
High school or below1.00 1.00
College/university or above1.15 (1.00–1.32)0.0491.19 (1.02–1.39)0.023
Employment status
Employed1.00 1.00
Unemployed1.20 (1.06–1.36)0.0031.10 (0.92–1.32)0.315
Household size
Three or more1.00 1.00
Two or less1.12 (0.98–1.28)0.0841.04 (0.90–1.21)0.586
Frequency of friend/family visits
<1 time/week1.00 1.00
≥1 time/week1.18 (1.01–1.37)0.0391.04 (0.899–1.22)0.608
Frequency of confiding in others
<1 time/week1.00 1.00
≥1 time/week1.15 (0.98–1.35)0.0831.04 (0.88–1.22)0.650
PRS, polygenic risk score; OR, odds ratio; CI, confidence interval. The adjusted model for PRS–cancer association includes age and sex. The adjusted model for socioeconomics–cancer association includes age, sex, ethnicity, income, education level, employment status, and frequency of friend/family visits. Significant p-value (p < 0.05) are shown in bold.
Table 4. Specific socioeconomic factors in relation to thyroid cancer stratified by levels of polygenic risk score.
PRS LevelsSample SizeSocioeconomic FactorsOR (95%CI)p-interaction
Annual household income
Low35,664≥£52,0001.000.049
102,771<£52,0001.56 (1.00–2.46)
Medium35,487≥£52,0001.00
102,900<£52,0001.46 (1.03–2.08)
High35,820≥£52,0001.00
103,109<£52,0001.03 (0.80–1.32)
Education level
Low62,487High school or below1.000.179
70,275College/university or above1.16 (0.81–1.65)
Medium61,932High school or below1.00
70,740College/university or above1.02 (0.77–1.34)
High61,810High school or below1.00
70,510College/university or above1.32 (1.06–1.65)
Employment status
Low93,148Employed1.000.137
67,481Unemployed1.11 (0.73–1.69)
Medium92,695Employed1.00
67,966Unemployed1.15 (0.83–1.59)
High92,849Employed1.00
67,855Unemployed1.05 (0.80–1.36)
Frequency of friend/family visits
Low35,528<1 time/week1.000.001
125,397≥1 time/week0.70 (0.47–1.04)
Medium35,261<1 time/week1.00
125,749≥1 time/week0.94 (0.68–1.31)
High34,894<1 time/week1.00
126,256≥1 time/week1.36 (1.02–1.81)
PRS, polygenic risk score; OR, odds ratio; CI, confidence interval. Adjusted model includes age, sex, ethnicity, income, education level, employment status, and frequency of friend/family visits. Significant p-value (p < 0.05) are shown in bold.
Table 5. Interaction between TERT polymorphisms of rs4449583 and socioeconomic factors on thyroid cancer.
Genotyping
of rs4449583
Sample SizeSocioeconomic FactorsOR (95%CI)p-interaction
Annual household income
CC46,161≥£52,0001.00 0.006
134,601<£52,000 1.45 (1.06–1.99)
CT45,346≥£52,0001.00
129,076<£52,0001.12 (0.85–1.47)
TT11,000≥£52,0001.00
30,979<£52,0001.03 (0.63–1.68)
Education level
CC81,281High school or below1.000.670
91,088College/university or above1.24 (0.97–1.59)
CT77,849High school or below1.00
88,780College/university or above1.08 (0.86–1.37)
TT18,833High school or below1.00
21,482College/university or above1.30 (0.84–2.00)
Employment status
CC120,841Employed1.000.179
88,336Unemployed1.31 (0.97–1.75)
CT116,324Employed1.00
85,626Unemployed1.02 (0.77–1.36)
TT28,228Employed1.00
20,447Unemployed0.94 (0.57–1.57)
Frequency of friend/family visits
CC45,322<1 time/week1.000.720
164,281≥1 time/week1.11 (0.81–1.51)
CT43,871<1 time/week1.00
158,583≥1 time/week1.09 (0.82–1.46)
TT10,565<1 time/week1.00
38,210≥1 time/week1.02 (0.61–1.71)
TERT, telomerase reverse transcriptase; OR, odds ratio; CI, confidence interval. Adjusted model includes age, sex, ethnicity, income, education level, employment status, and frequency of friend/family visits. Significant p-value (p < 0.05) are shown in bold.
Table 6. Genetic causal effects of socioeconomic factors on thyroid cancer risk based on the IVW model.
PhenotypeInstrumentEffect SizeHeterogeneityPleiotropy
SNPs (n)F-StatR2 (%)OR (95%CI)pQ-StatpI2 (%)MR-Egger Interceptp
Lower income4757.120.701.20 (0.61–2.36)0.58959.420.08922.580.000.945
College/university degree2419.050.680.93 (0.50–1.71)0.811262.770.1508.660.020.051
Unemployed910.480.02235.78 (0.29–19,204)0.1107.810.4520.00−0.030.327
Frequent friend/family visits2147.700.251.10 (0.32–3.72)0.88128.720.09330.370.050.413
OR, odds ratio; CI, confidence interval; IVW, inverse-variance weighted; SNP, single nucleotide polymorphism; MR, Mendelian randomization.
Disclaimer/Publisher’s Note: The statements, opinions and data contained in all publications are solely those of the individual author(s) and contributor(s) and not of MDPI and/or the editor(s). MDPI and/or the editor(s) disclaim responsibility for any injury to people or property resulting from any ideas, methods, instructions or products referred to in the content.

