
Highly Metastatic Subpopulation of TNBC Cells Has Limited Iron Metabolism and Is a Target of Iron Chelators

 ,
,  , and
, and 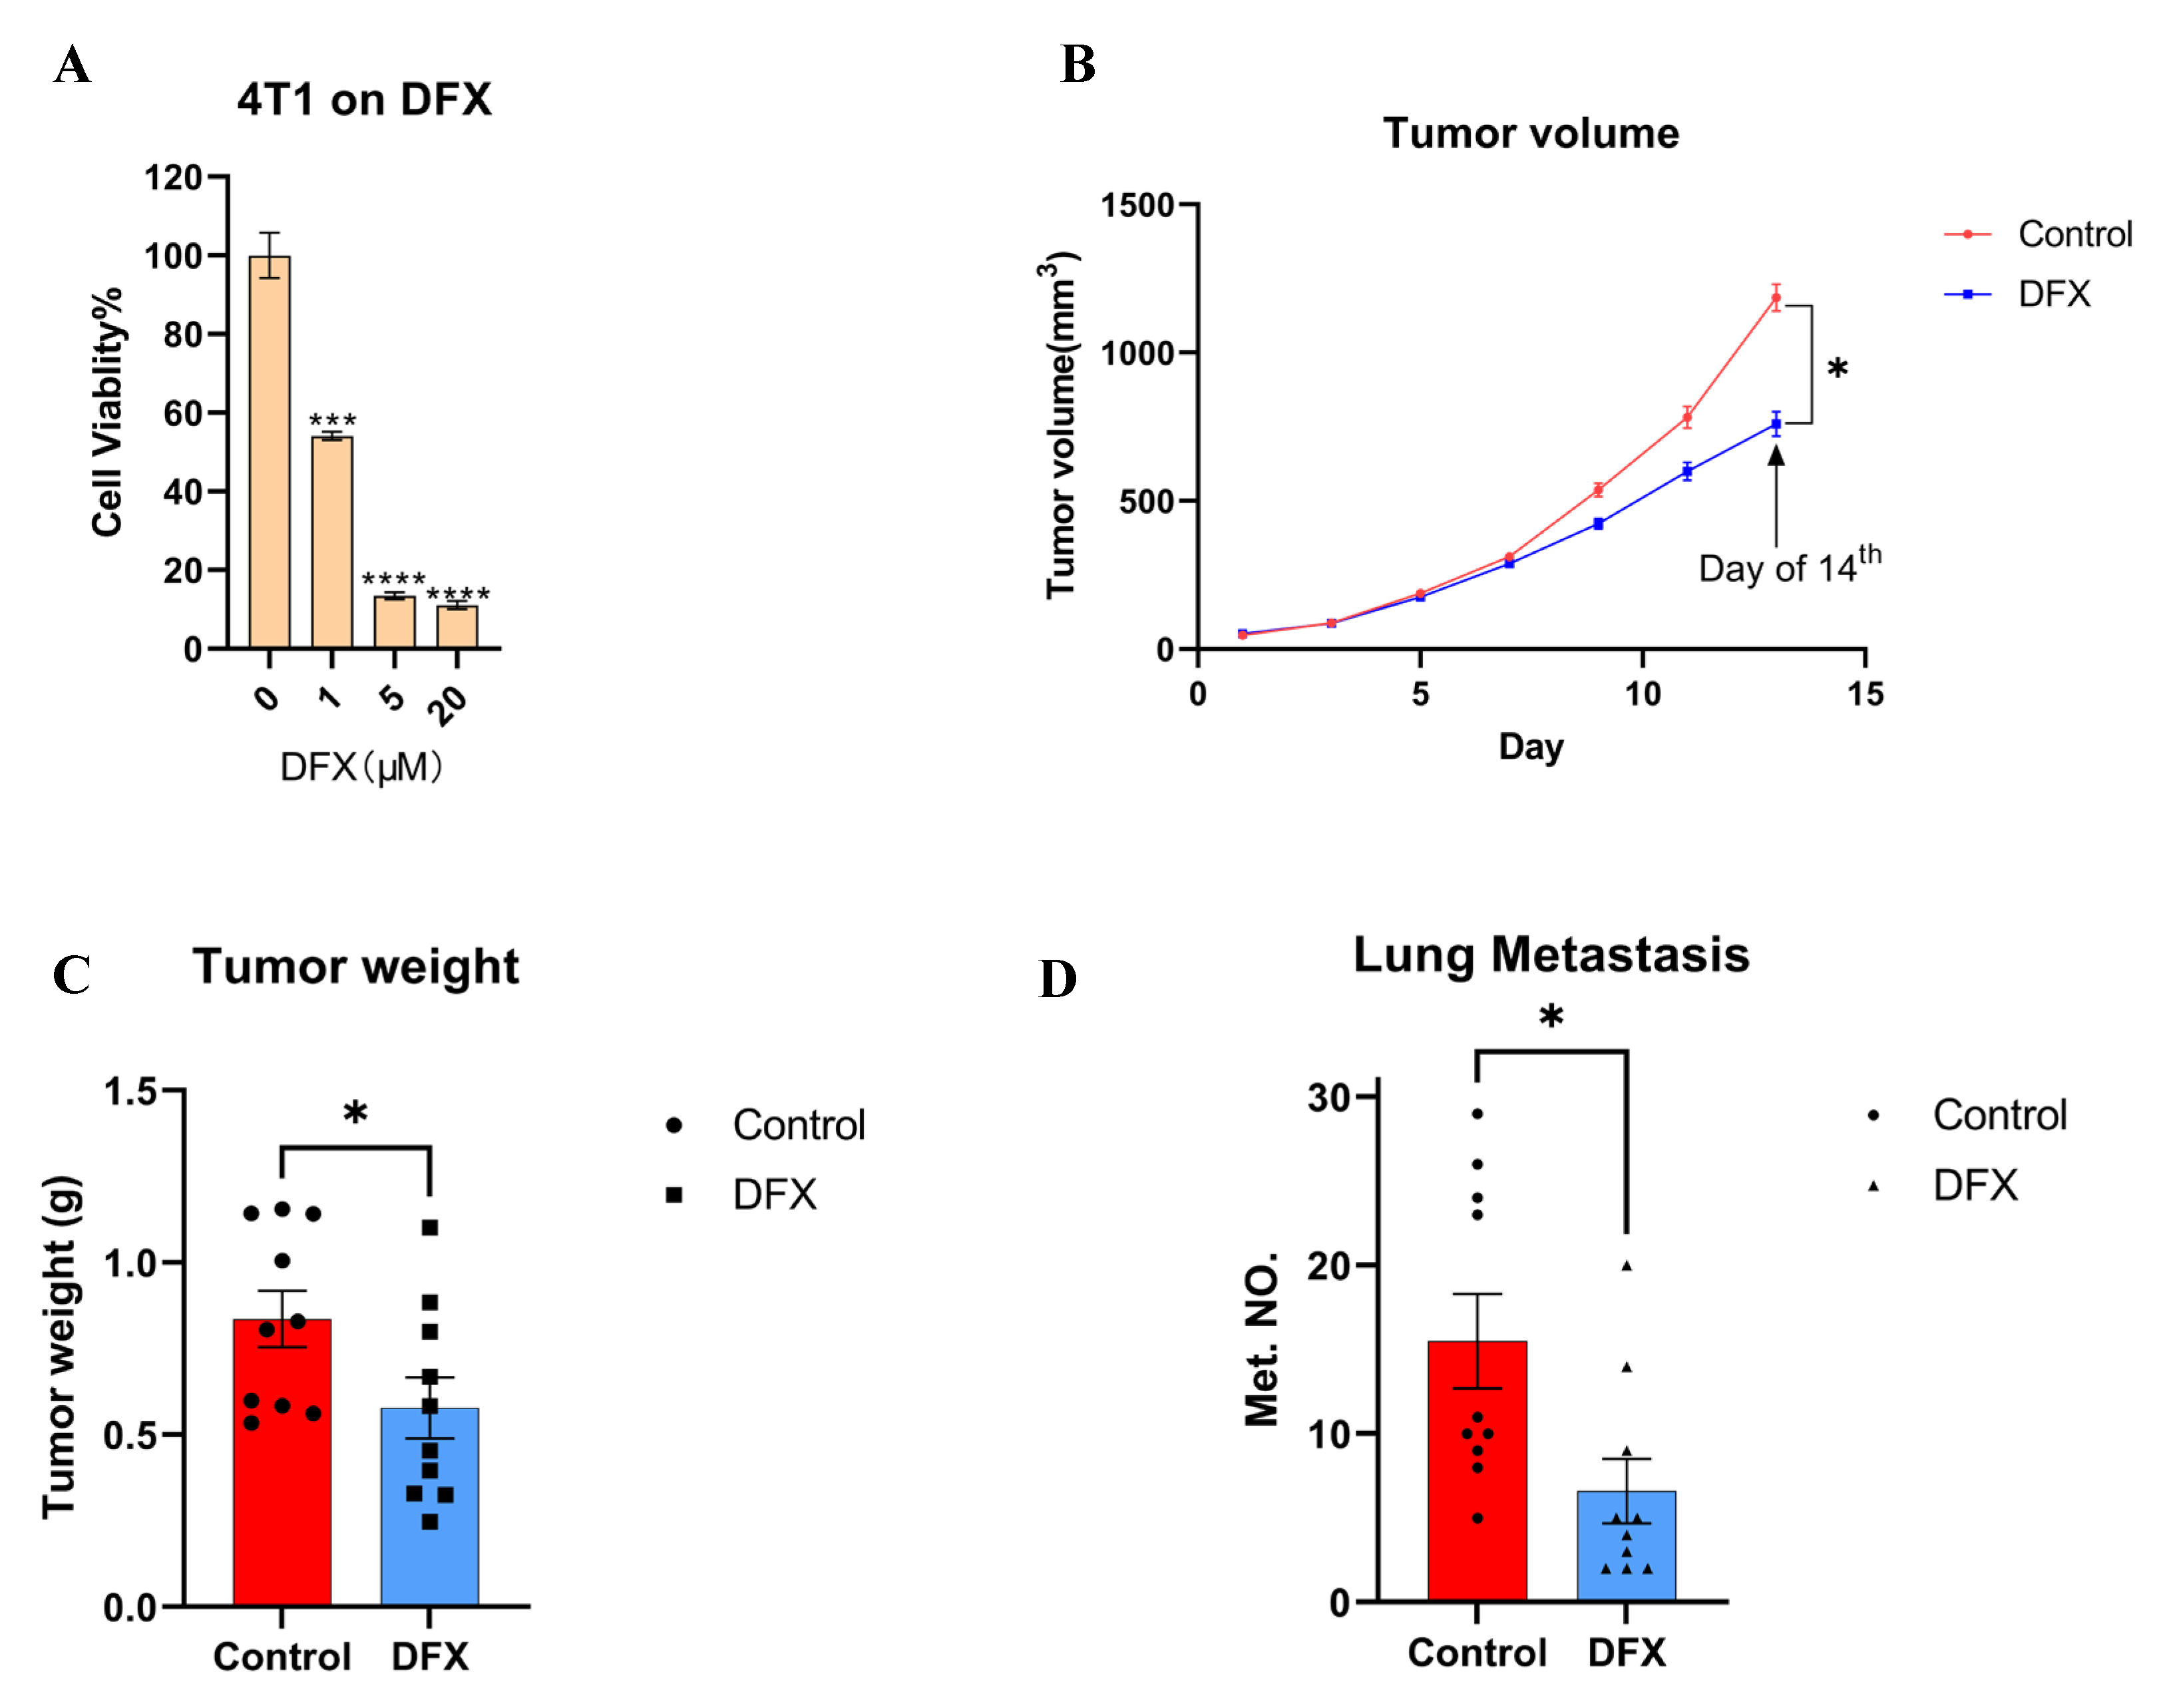
Abstract
Simple Summary
Abstract
1. Introduction
2. Materials and Methods
2.1. Cell Culture
2.2. Reagents
2.3. Cell Proliferation Assay
2.4. Western Blotting
2.5. Sphere–Formation Assay
2.6. RNA–Seq Assay
2.7. Database Analysis
2.8. Tumor Allograft Model
2.9. Orthotopic Tumor Model
2.10. Single–Cell RNA Sequencing Analysis
2.11. Statistical Analysis
3. Results
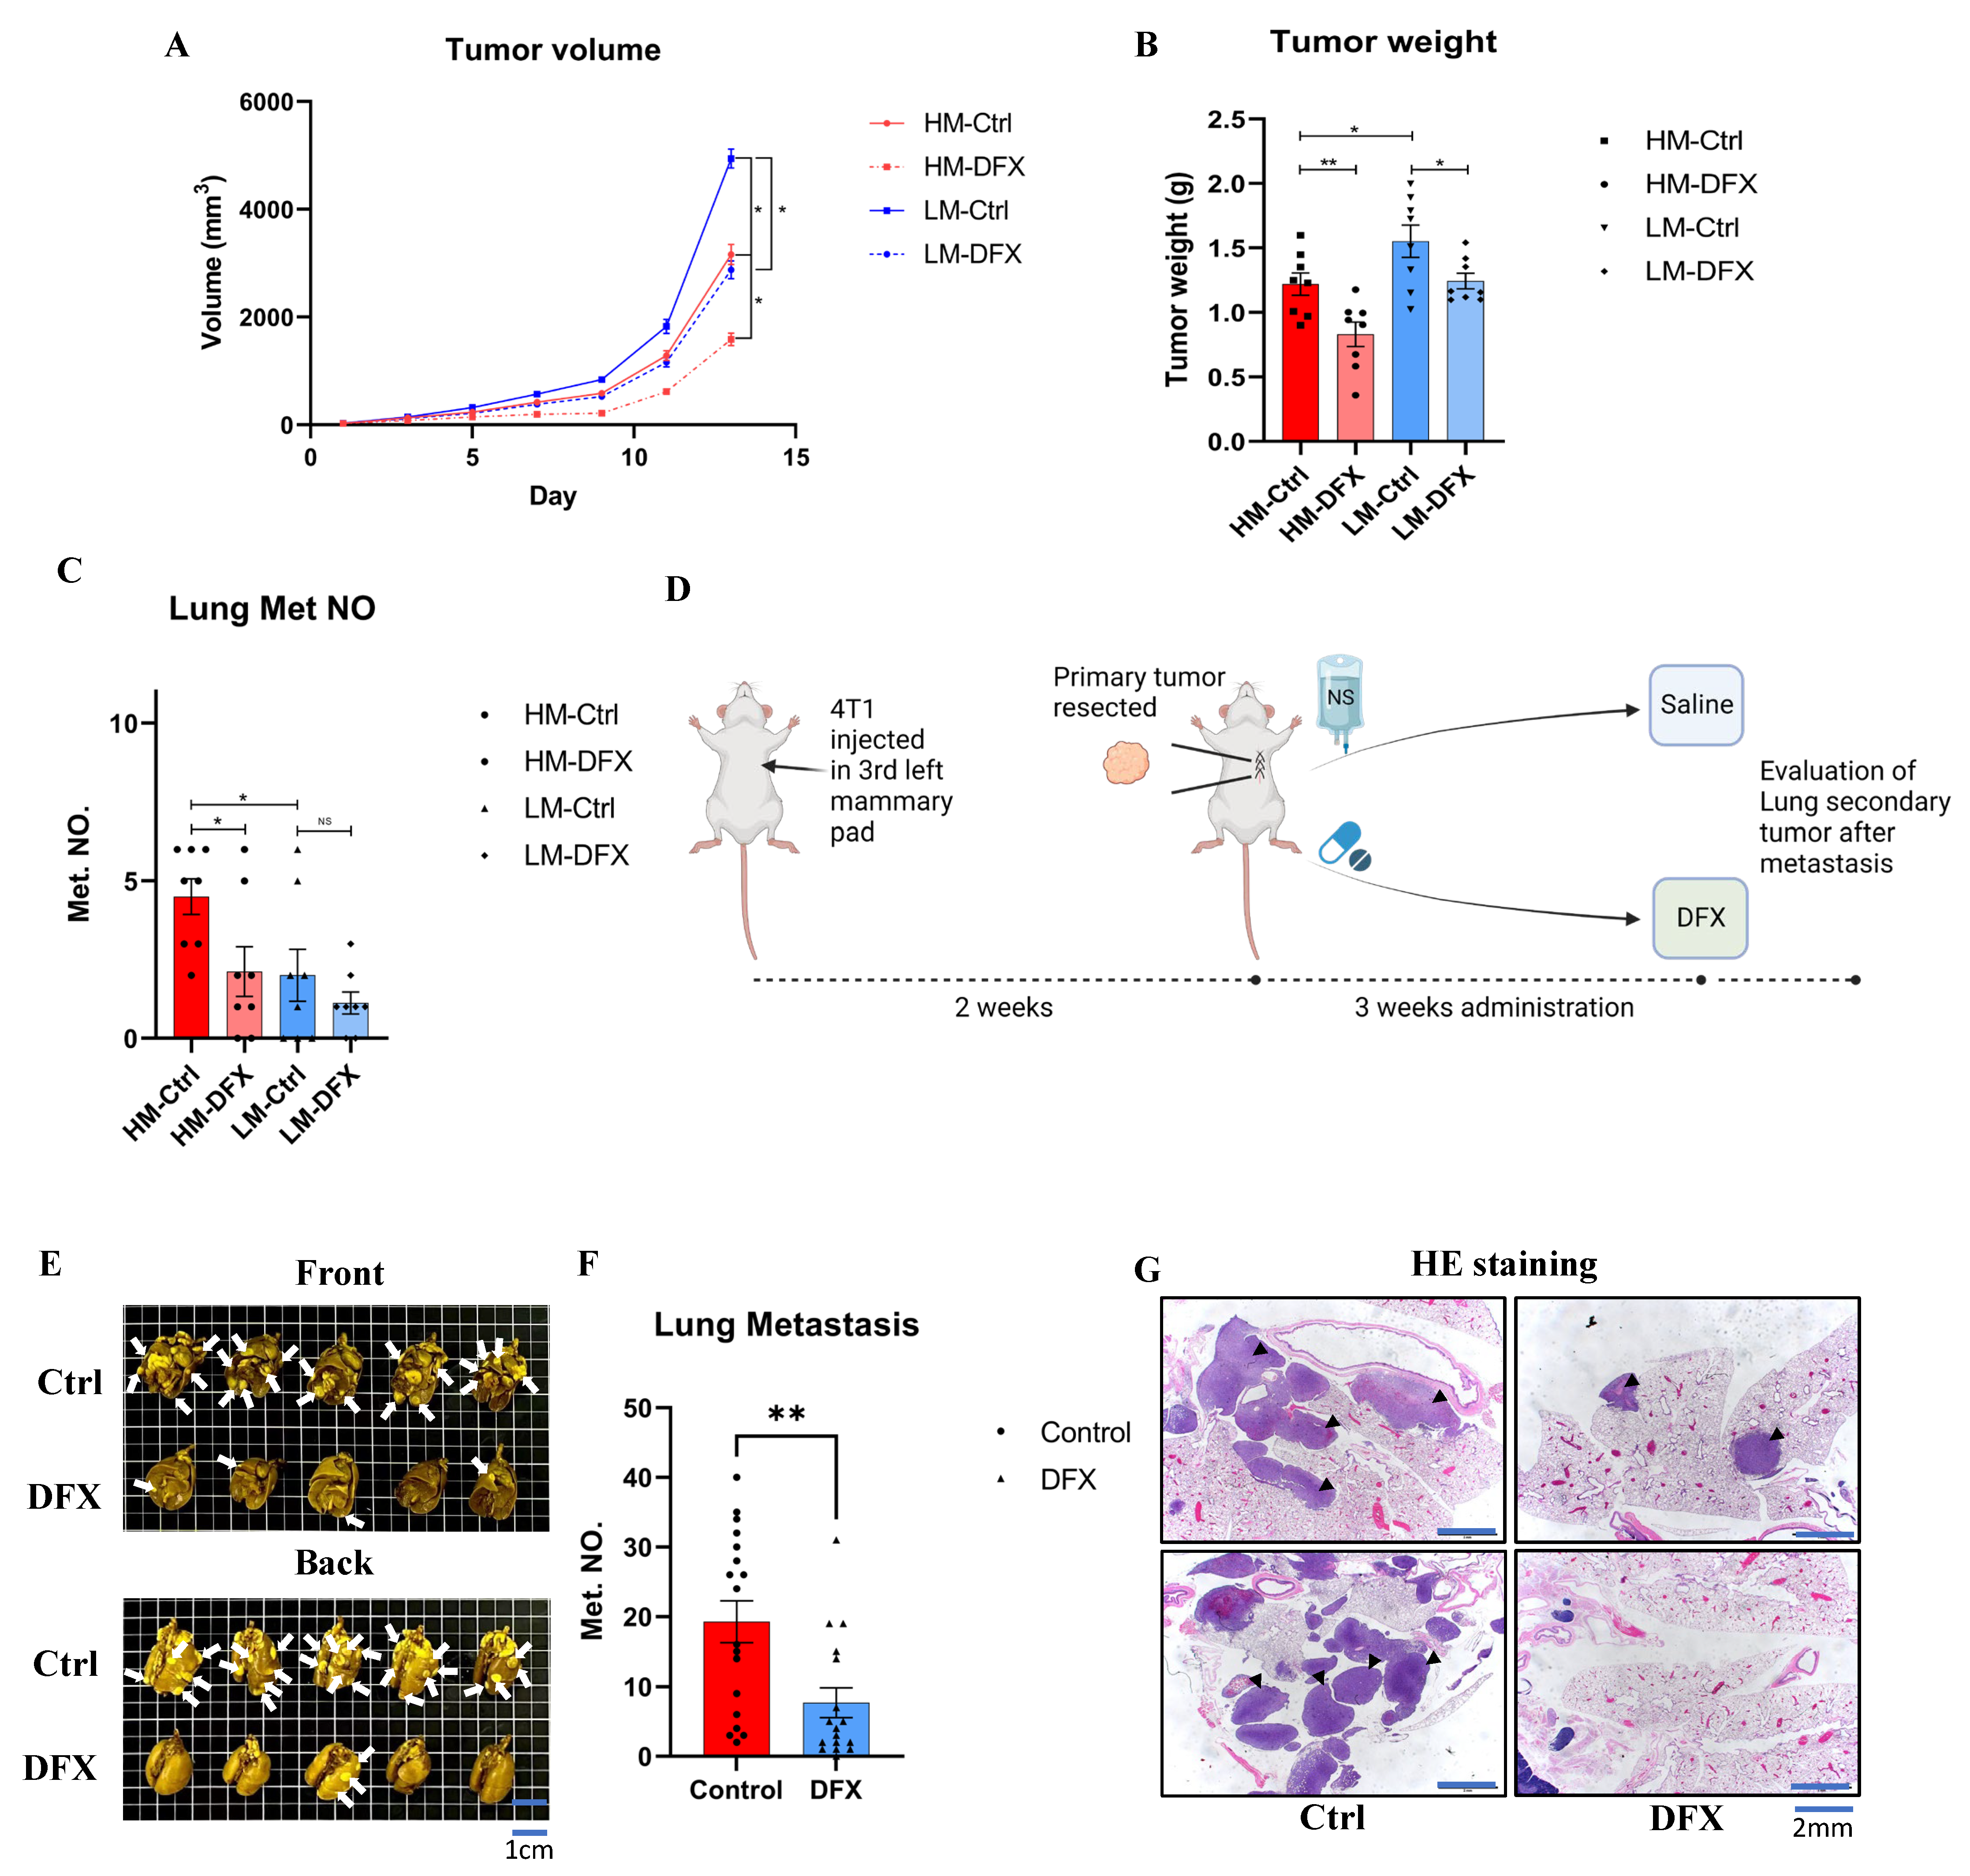
3.1. Iron Chelators Suppressed In Vitro Cell Proliferation, In Vivo Tumor Growth, and Lung Metastasis in a Murine 4T1 TNBC Model
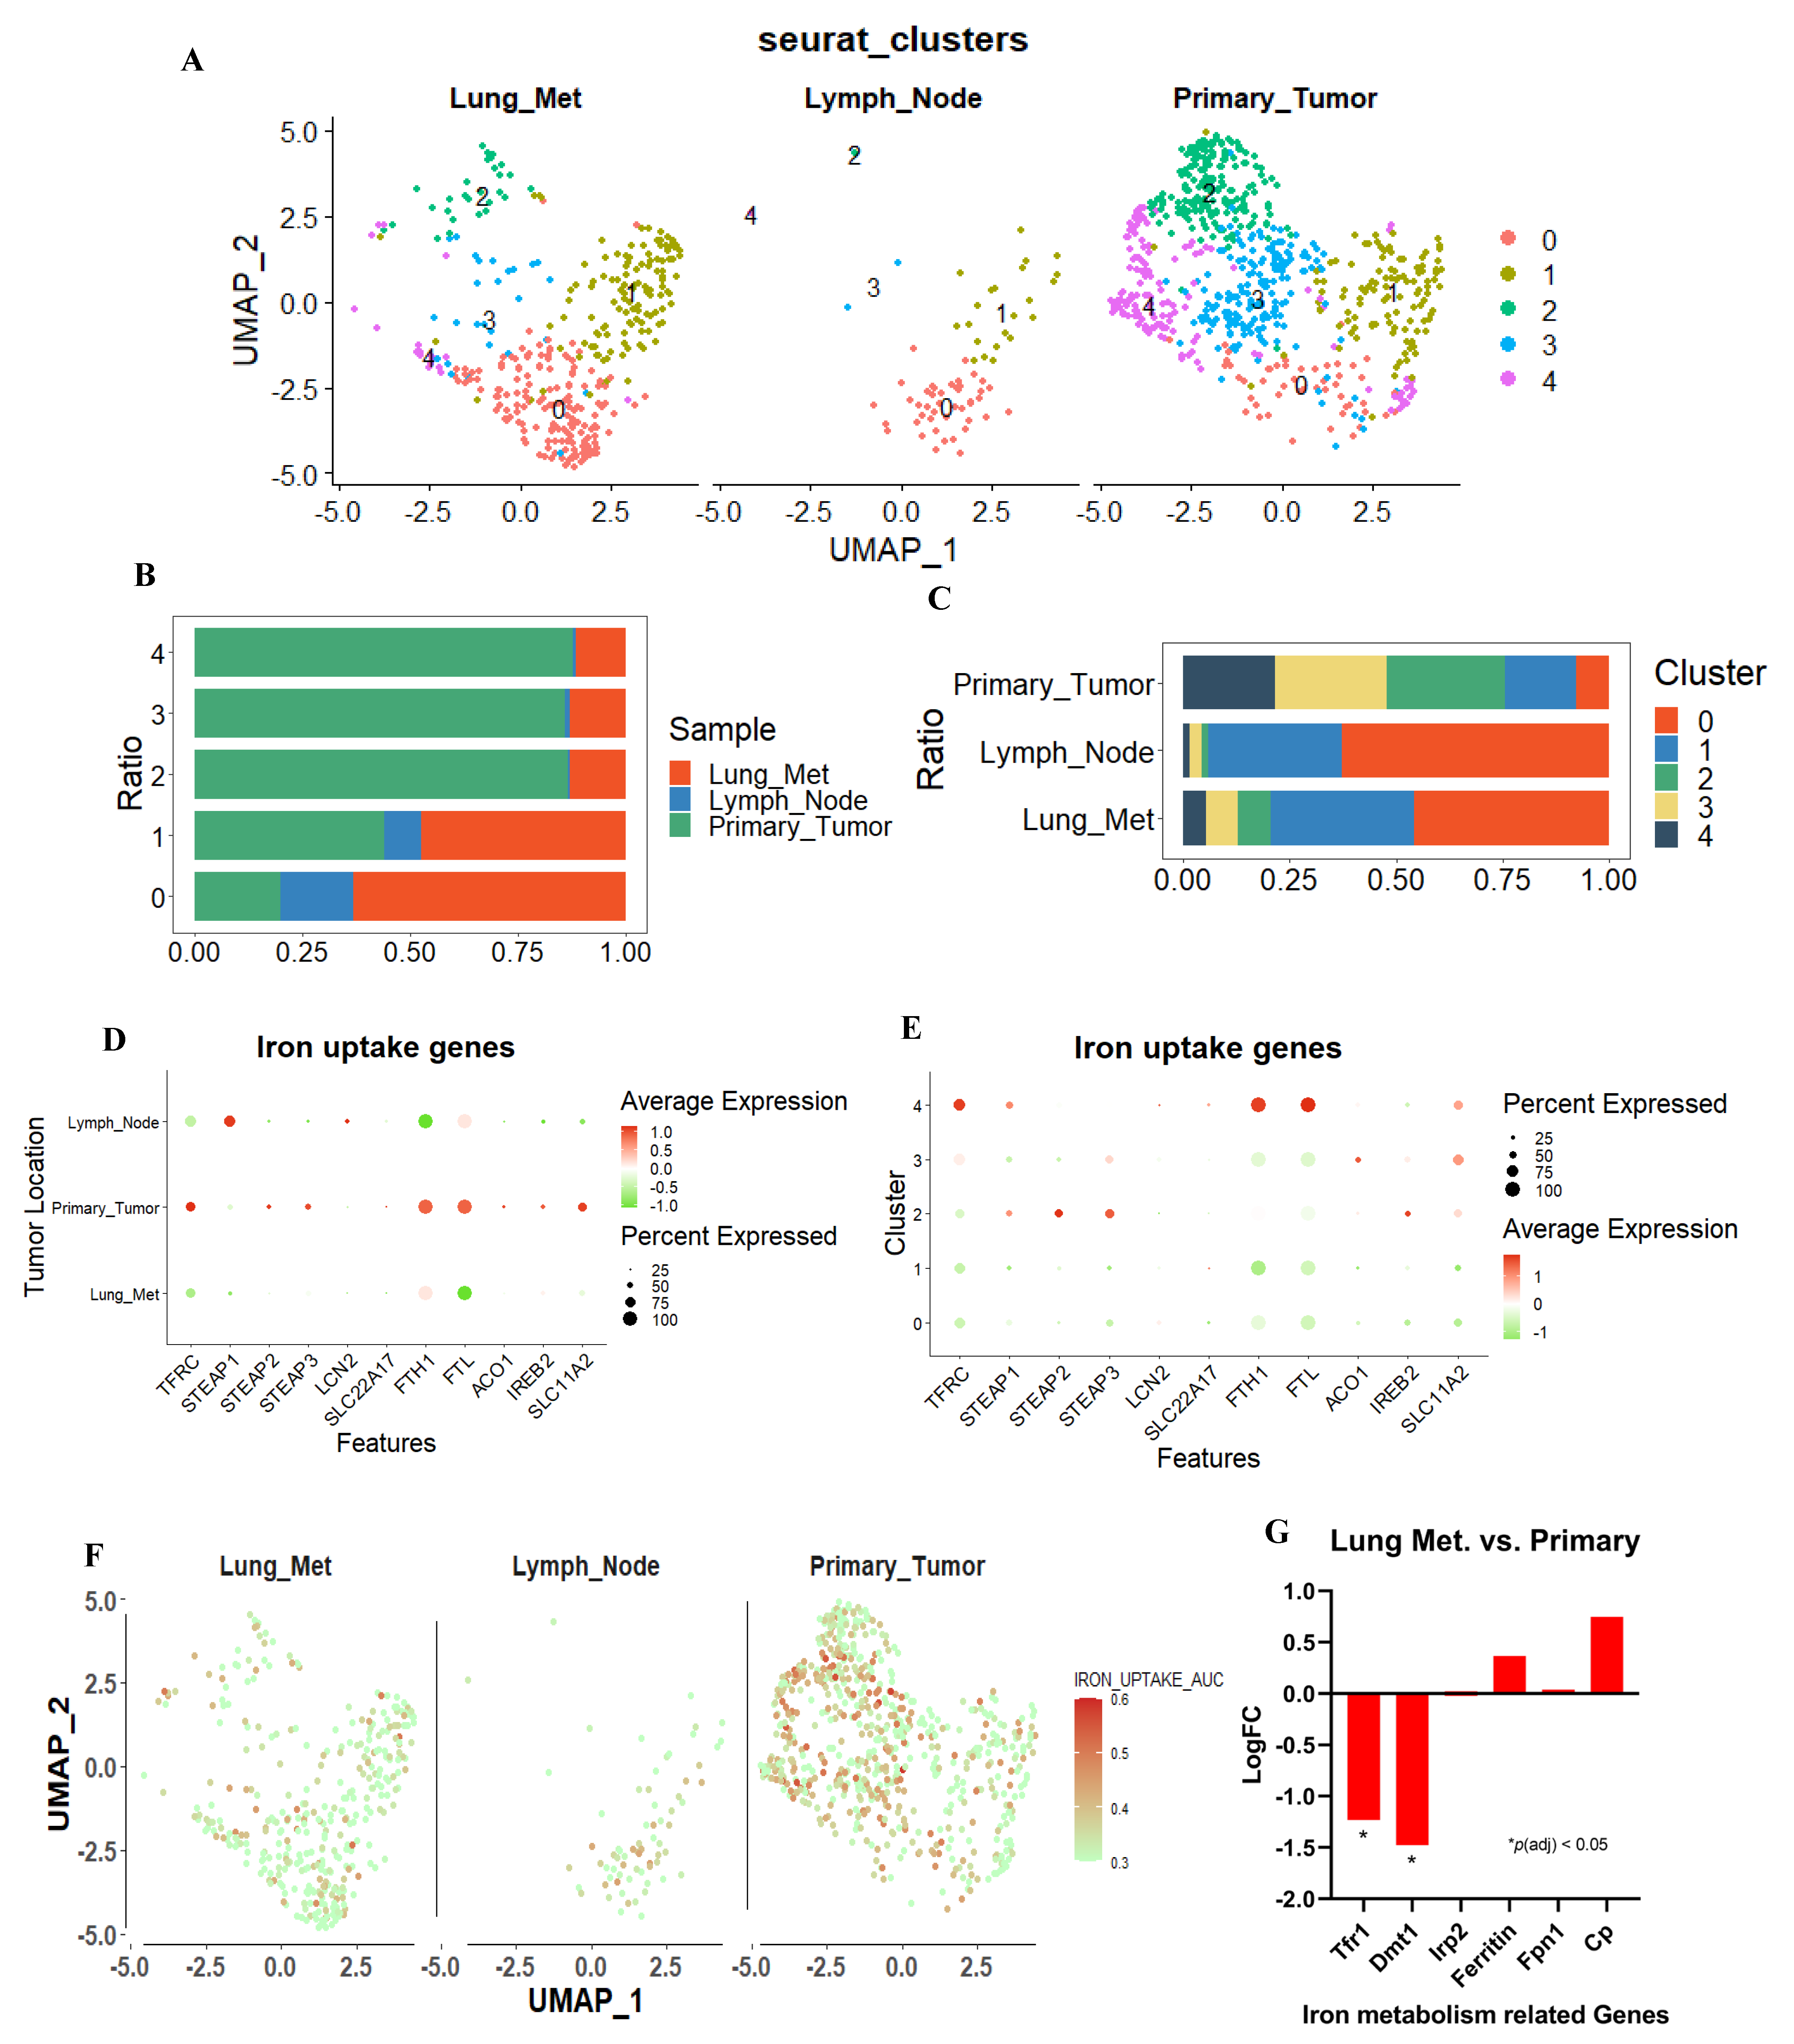
3.2. Database Analysis Showed That the Iron–Uptake Genes Are Suppressed in a Highly Metastatic TNBC Cell Patient–Derived Xenograft (PDX) Model and 4T1 Cells

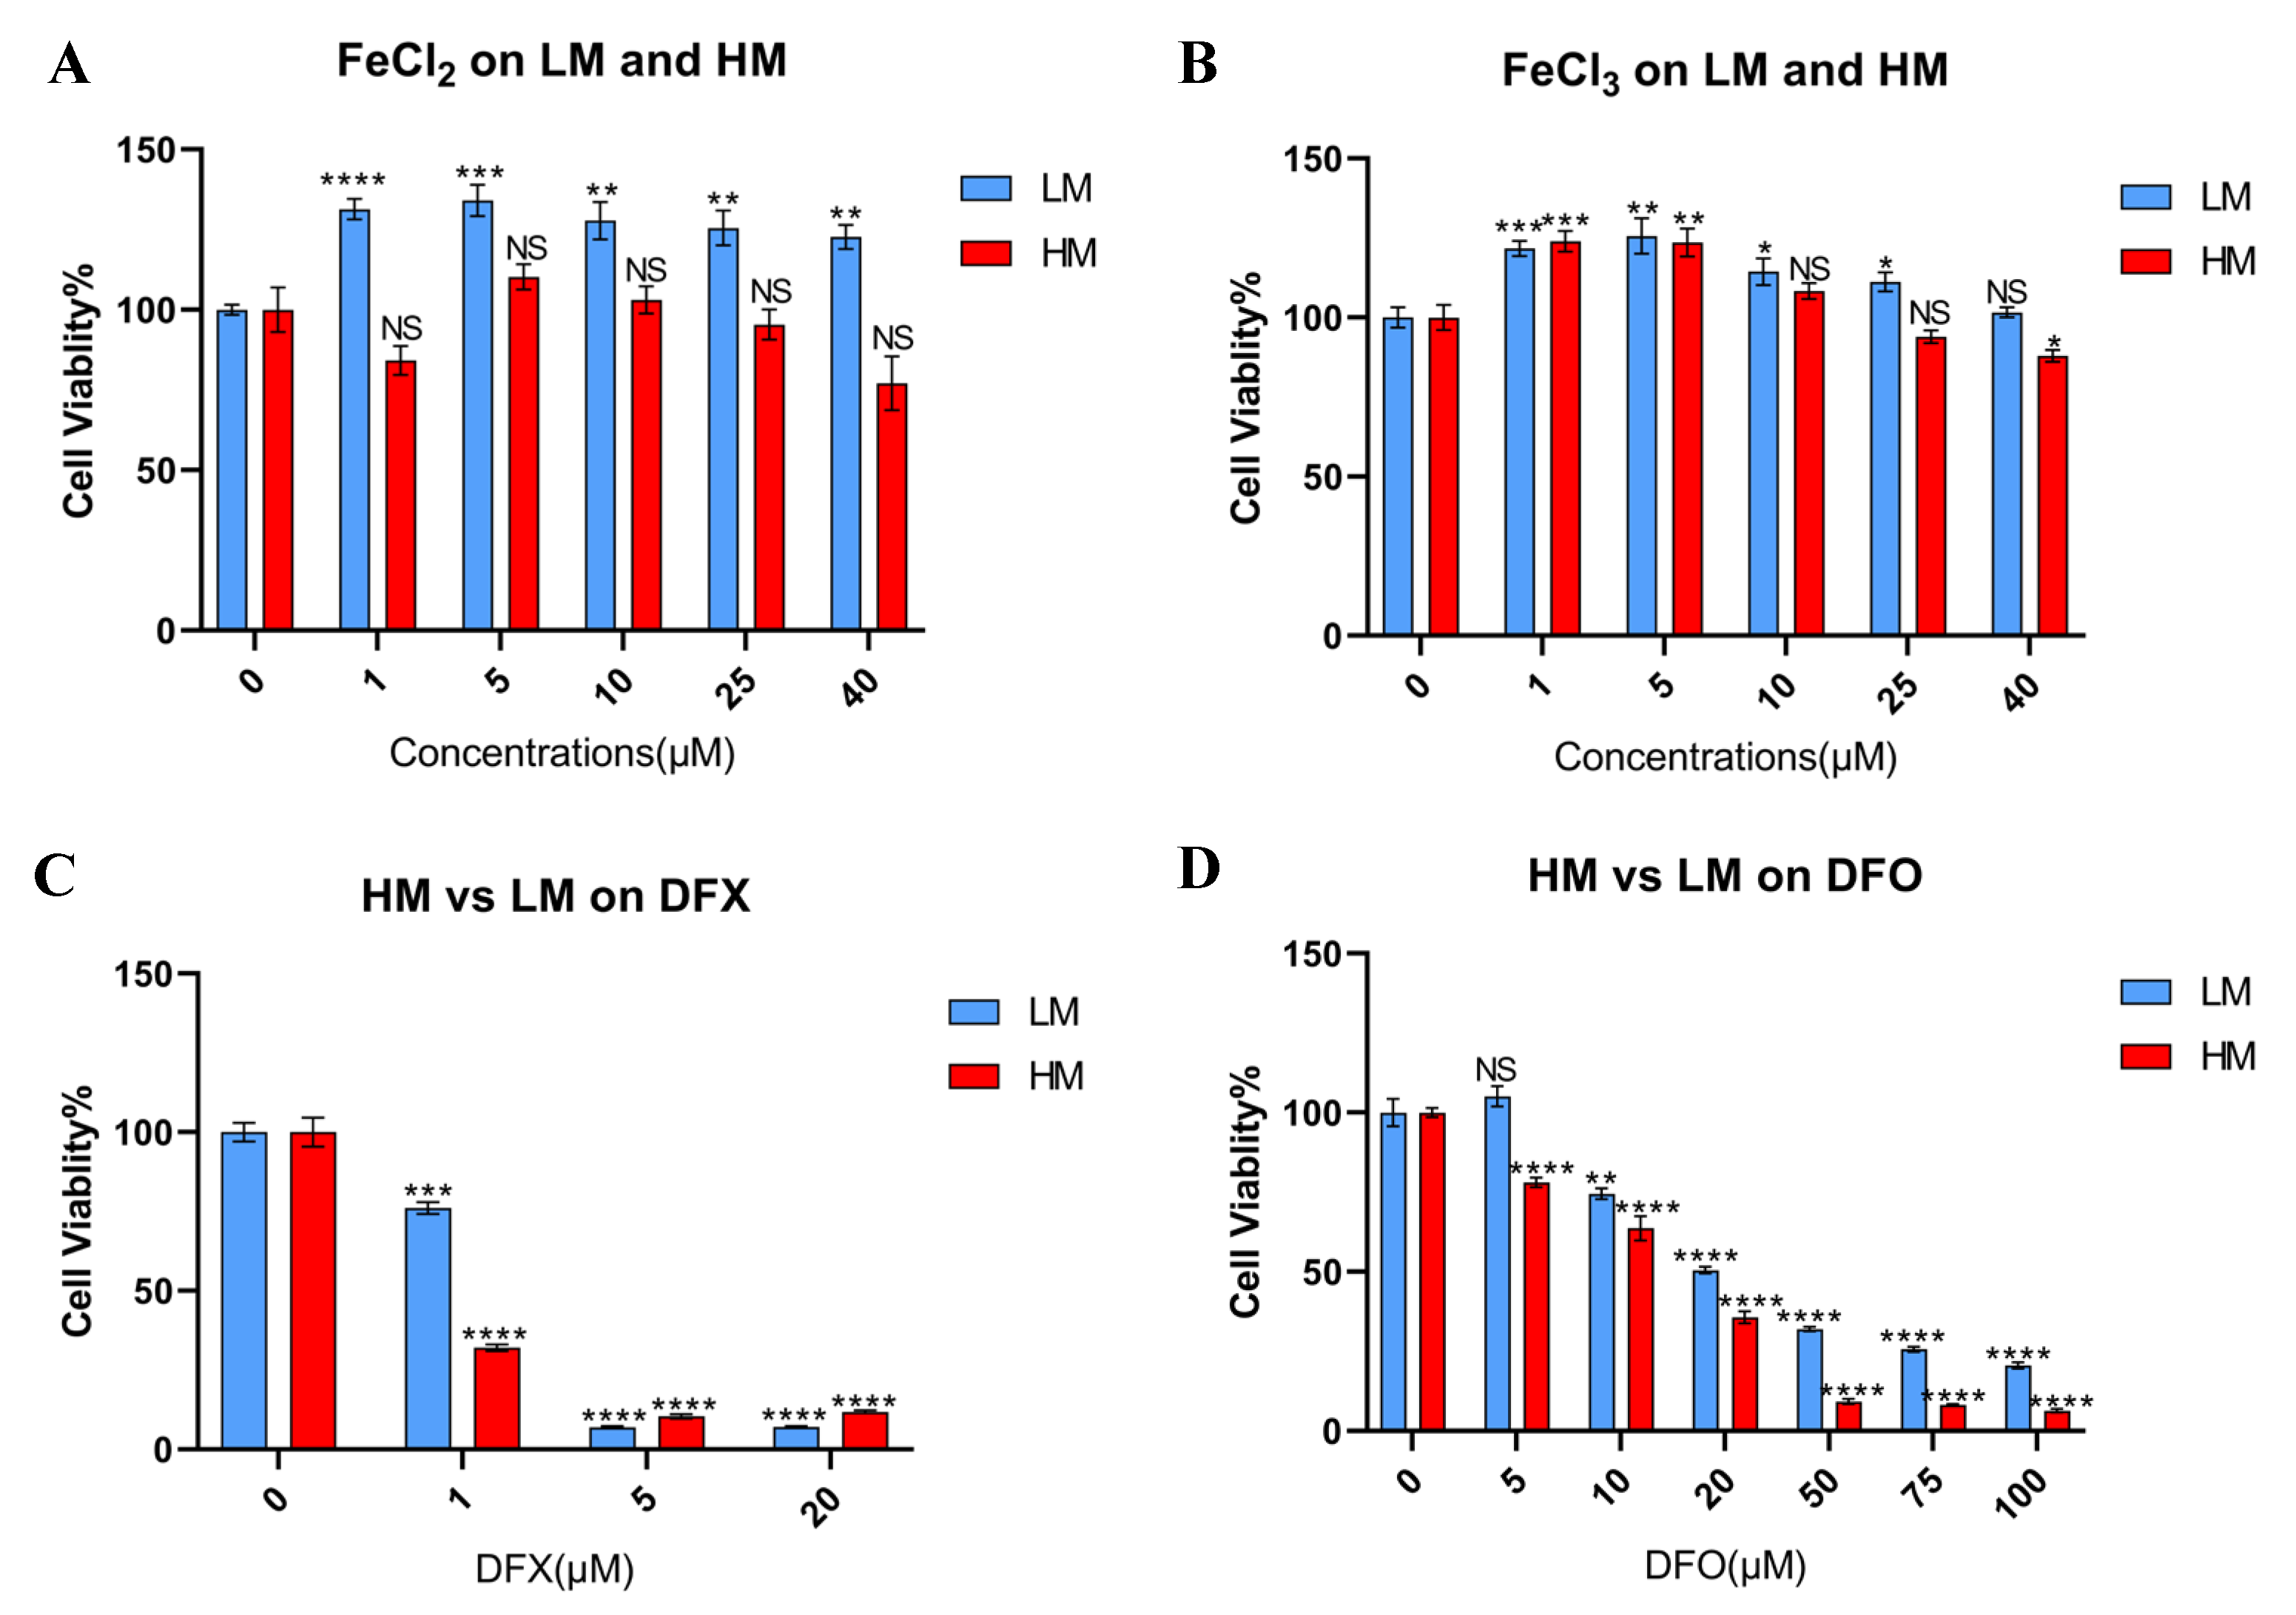
3.3. Tolerance of Iron Metabolic Change Differs between Metastatic and Primary Sites in Murine TNBC Cells
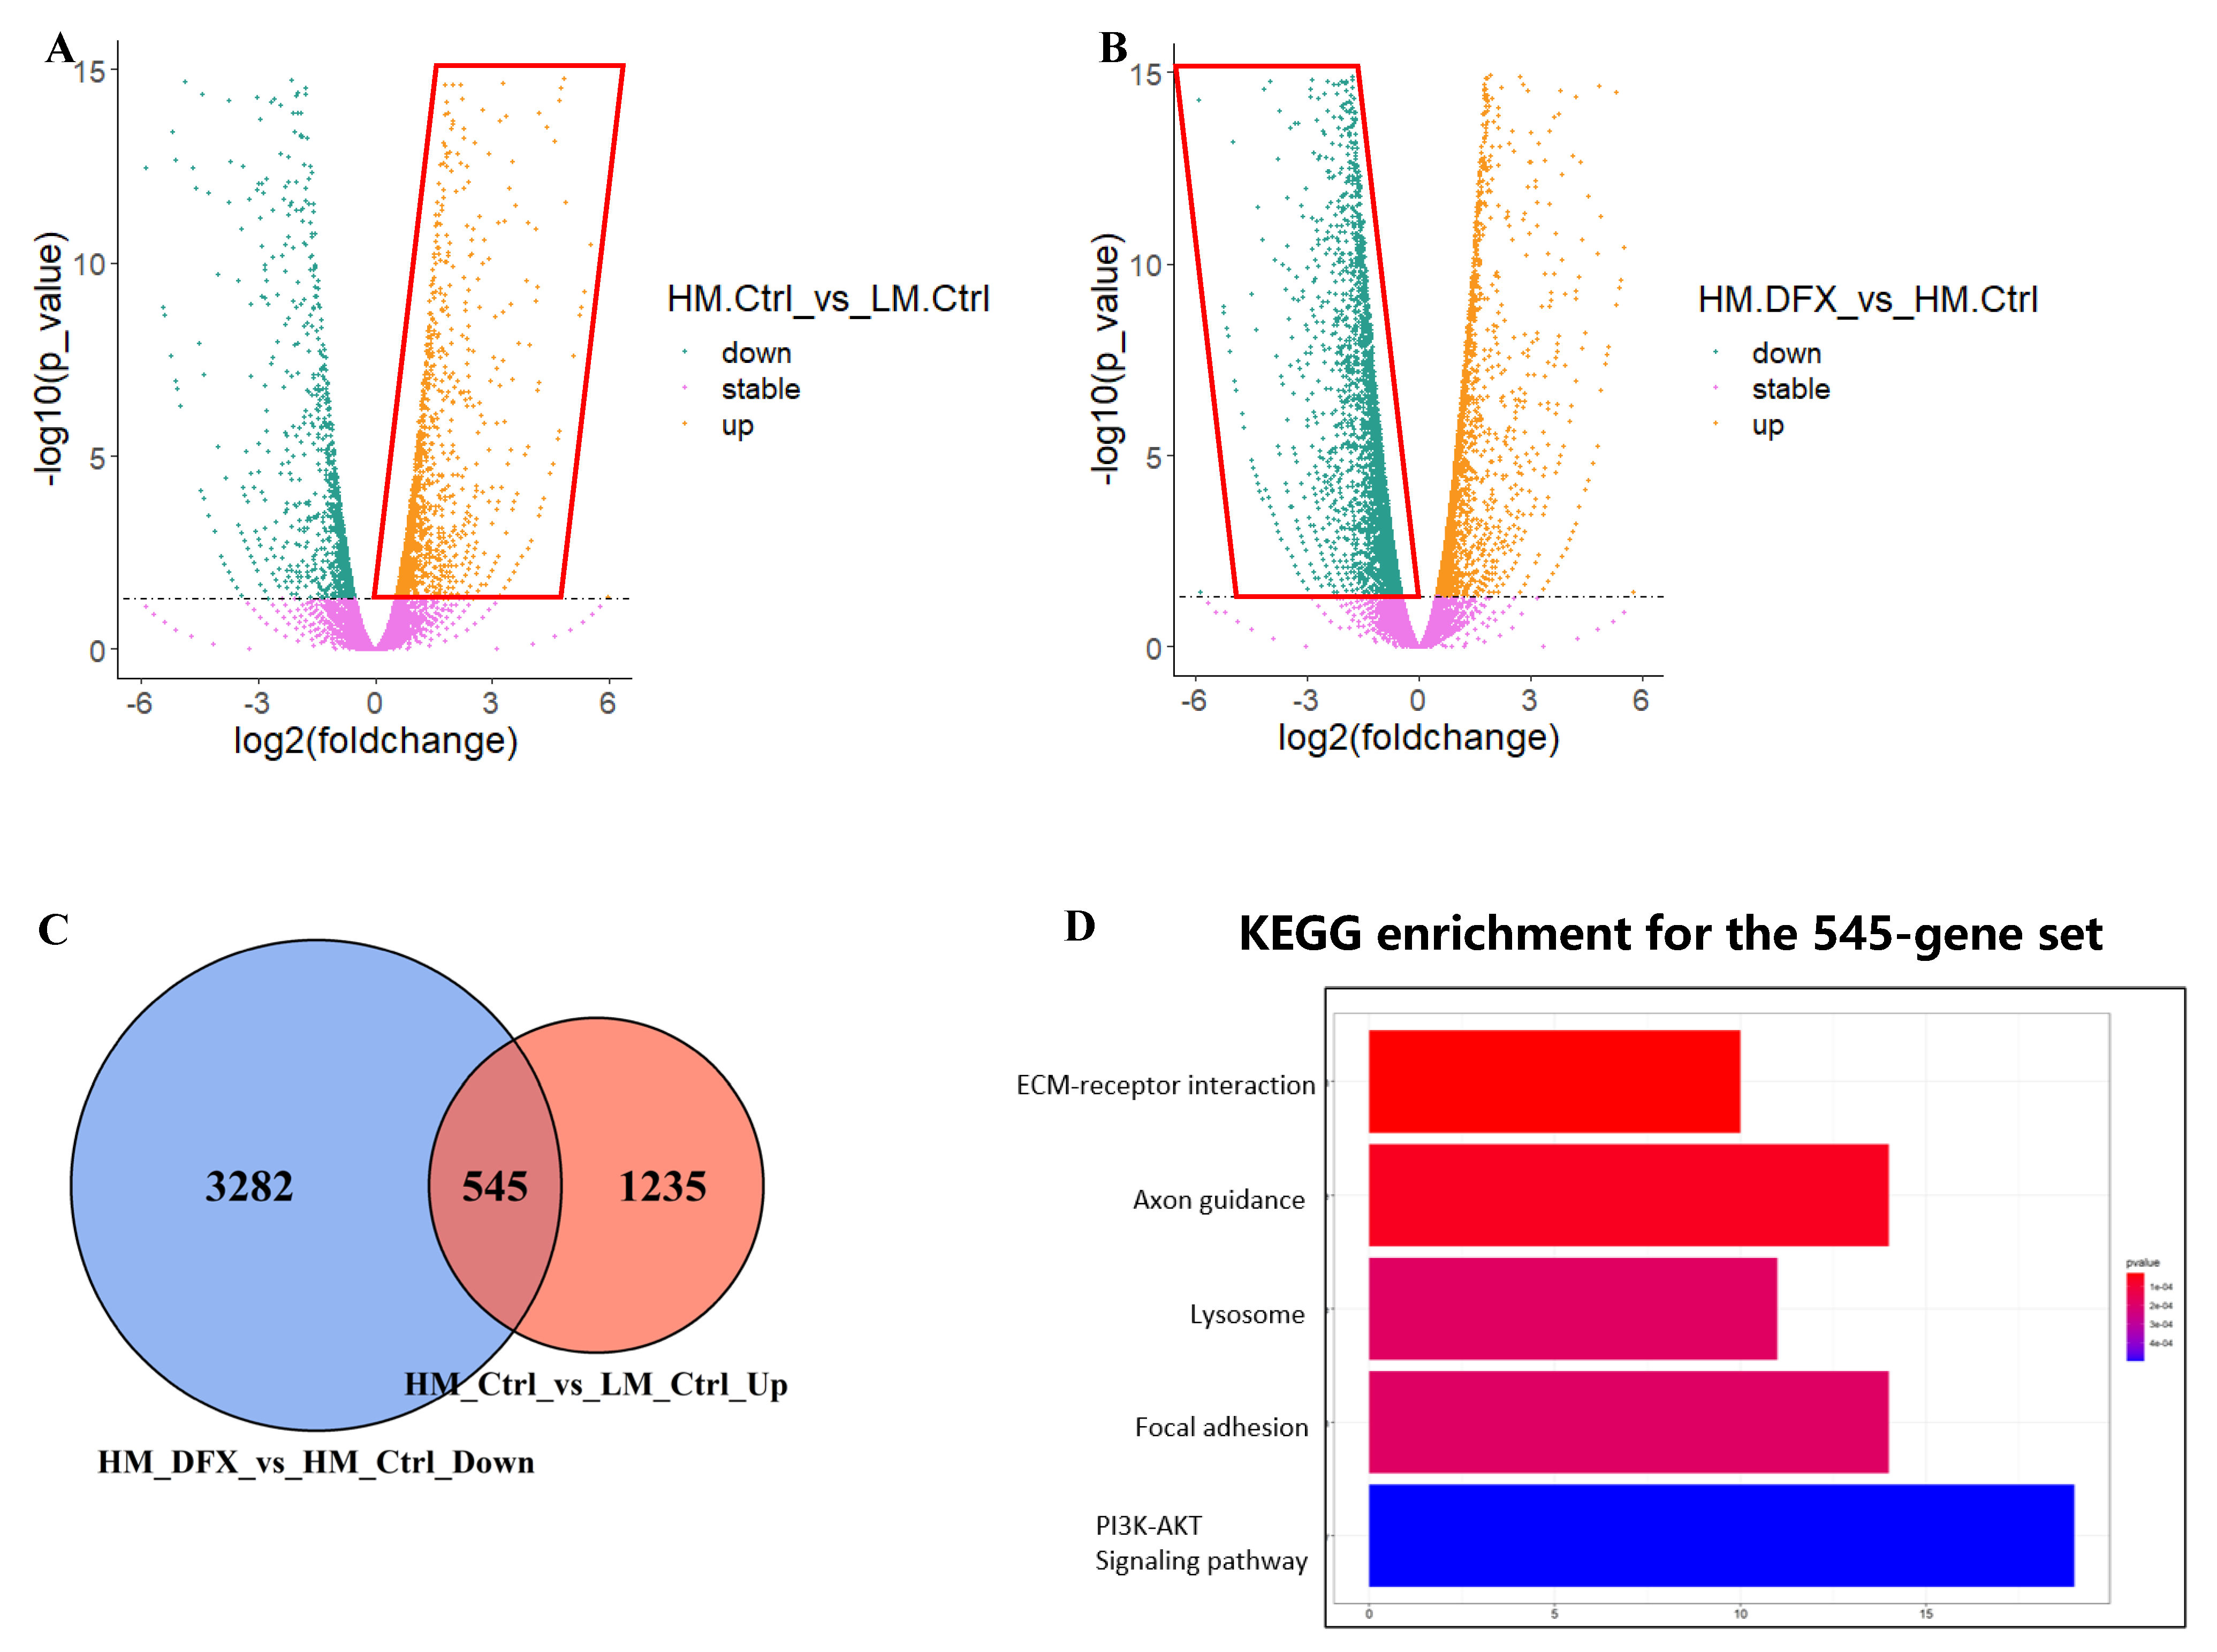
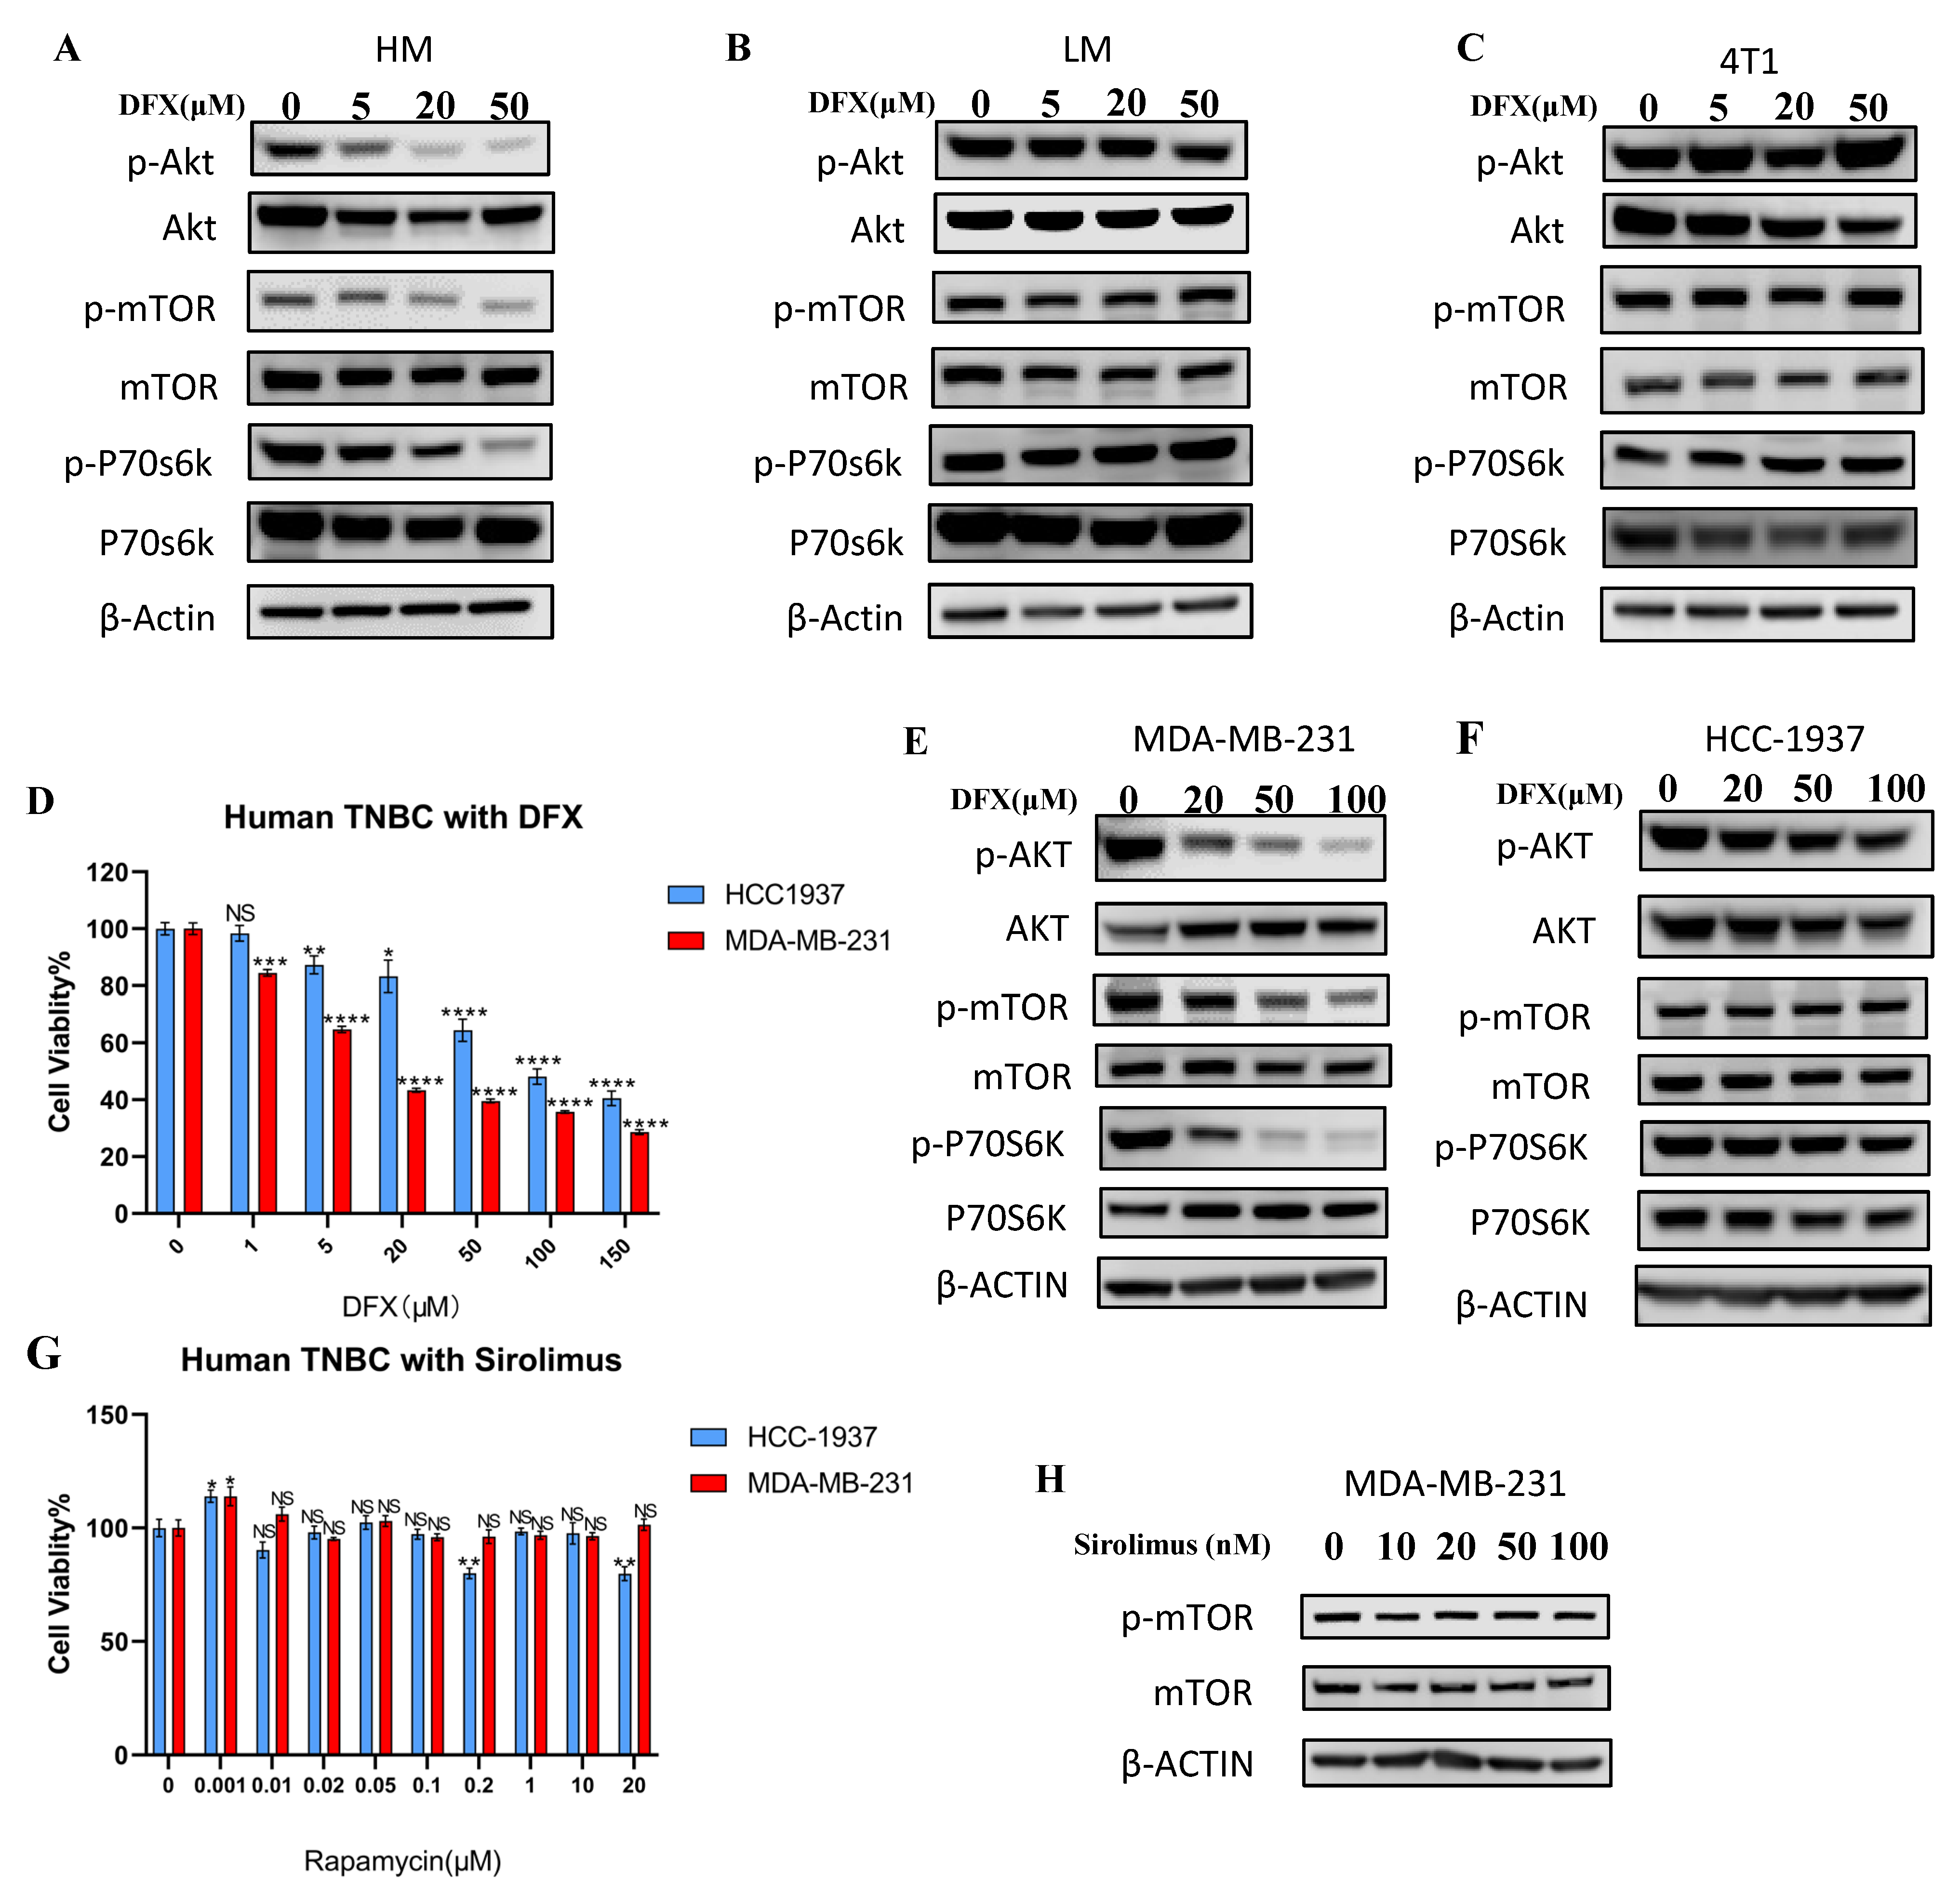
3.4. PI3K–AKT Pathway Was Responsible for Metastatic Phenotype and Strongly Inhibited by DFX in 4T1–HM Cells
3.5. Upregulated AKT–mTOR Pathway in Metastatic Phenotype Was Strongly Inhibited by DFX
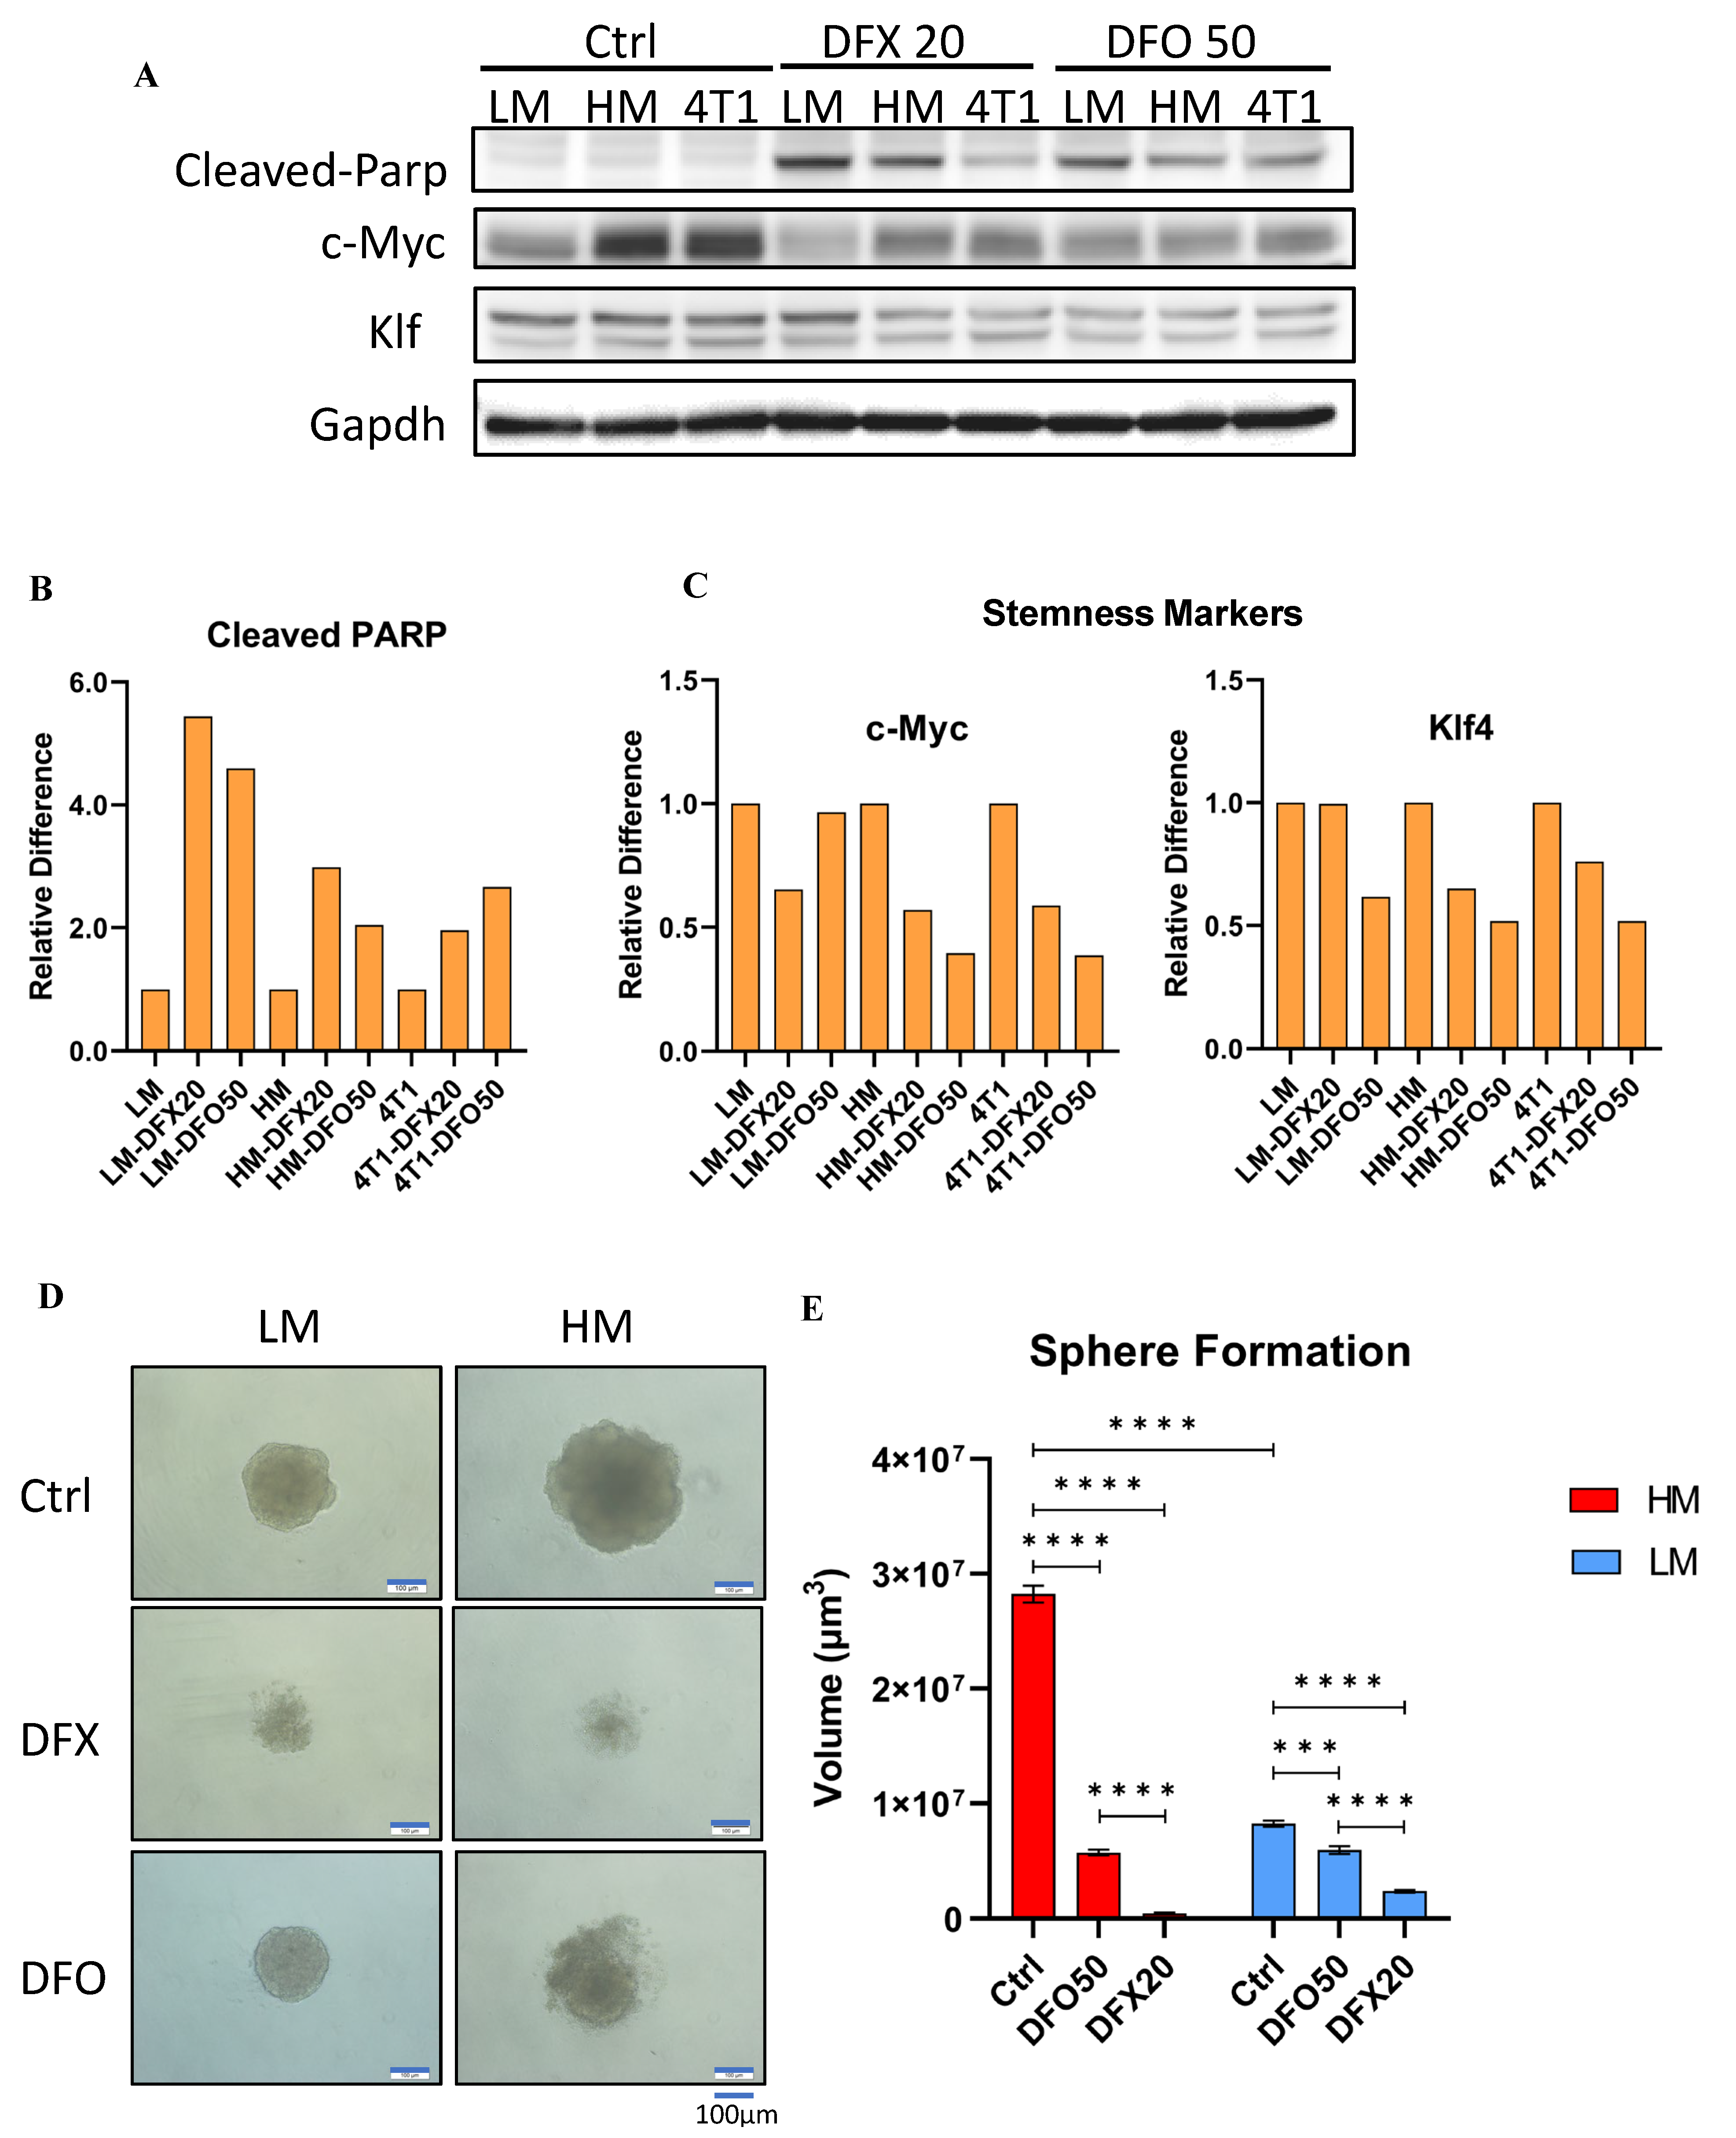
3.6. Iron Chelators Induce Apoptosis and Inhibit Stemness in 4T1 Cells
3.7. DFX Inhibited TNBC Tumor Growth in Orthotopic and Lung Metastatic Models
4. Discussion
5. Conclusions
Supplementary Materials
Author Contributions
Funding
Institutional Review Board Statement
Informed Consent Statement
Data Availability Statement
Acknowledgments
Conflicts of Interest
Abbreviations
| BL1 | Basal–like 1 |
| BL2 | Basal–like 2 |
| CSC | Cancer Stem Cell |
| DFX | Deferasirox |
| DFO | Deferoxamine |
| ER | Estrogen Receptor |
| Fpn | Ferroportin |
| M | Mesenchymal |
| MSL | Mesenchymal Stem–like |
| PDX | Patient–derived Xenograft |
| PI3K | Phosphoinositide-3-kinase-protein Kinase |
| PR | Progesterone Receptor |
| SP10 | Super–polyphenol 10 |
| TNBC | Triple–negative Breast Cancer |
| UMAP | Uniform Manifold Approximation and Projection |
References
- Okada, S.; Hamazaki, S.; Toyokuni, S.; Midorikawa, O. Induction of mesothelioma by intraperitoneal injections of ferric saccharate in male Wistar rats. Br. J. Cancer 1989, 60, 708–711. [Google Scholar] [CrossRef] [PubMed]
- Toyokuni, S. Role of iron in carcinogenesis: Cancer as a ferrotoxic disease. Cancer Sci. 2009, 100, 9–16. [Google Scholar] [CrossRef] [PubMed]
- Torti, S.V.; Manz, D.H.; Paul, B.T.; Blanchette-Farra, N.; Torti, F.M. Iron and Cancer. Annu. Rev. Nutr. 2018, 38, 97–125. [Google Scholar] [CrossRef] [PubMed]
- Chang, V.C.; Cotterchio, M.; Khoo, E. Iron intake, body iron status, and risk of breast cancer: A systematic review and meta-analysis. BMC Cancer 2019, 19, 543. [Google Scholar] [CrossRef] [PubMed]
- Ford, S.J.; Obeidy, P.; Lovejoy, D.B.; Bedford, M.; Nichols, L.; Chadwick, C.; Tucker, O.; Lui, G.Y.; Kalinowski, D.S.; Jansson, P.J.; et al. Deferasirox (ICL670A) effectively inhibits oesophageal cancer growth in vitro and in vivo. Br. J. Pharmacol. 2013, 168, 1316–1328. [Google Scholar] [CrossRef]
- Lee, J.C.; Chiang, K.C.; Feng, T.H.; Chen, Y.J.; Chuang, S.T.; Tsui, K.H.; Chung, L.C.; Juang, H.H. The Iron Chelator, Dp44mT, Effectively Inhibits Human Oral Squamous Cell Carcinoma Cell Growth in Vitro and in Vivo. Int. J. Mol. Sci. 2016, 17, 1435. [Google Scholar] [CrossRef]
- Ohara, T.; Noma, K.; Urano, S.; Watanabe, S.; Nishitani, S.; Tomono, Y.; Kimura, F.; Kagawa, S.; Shirakawa, Y.; Fujiwara, T. A novel synergistic effect of iron depletion on antiangiogenic cancer therapy. Int. J. Cancer 2013, 132, 2705–2713. [Google Scholar] [CrossRef]
- Urano, S.; Ohara, T.; Noma, K.; Katsube, R.; Ninomiya, T.; Tomono, Y.; Tazawa, H.; Kagawa, S.; Shirakawa, Y.; Kimura, F.; et al. Iron depletion enhances the effect of sorafenib in hepatocarcinoma. Cancer Biol. Ther. 2016, 17, 648–656. [Google Scholar] [CrossRef]
- Narusaka, T.; Ohara, T.; Noma, K.; Nishiwaki, N.; Katsura, Y.; Kato, T.; Sato, H.; Tomono, Y.; Kikuchi, S.; Tazawa, H.; et al. Nanog is a promising chemoresistant stemness marker and therapeutic target by iron chelators for esophageal cancer. Int. J. Cancer 2021, 149, 347–357. [Google Scholar] [CrossRef]
- Szymonik, J.; Wala, K.; Górnicki, T.; Saczko, J.; Pencakowski, B.; Kulbacka, J. The Impact of Iron Chelators on the Biology of Cancer Stem Cells. Int. J. Mol. Sci. 2021, 23, 89. [Google Scholar] [CrossRef]
- Waks, A.G.; Winer, E.P. Breast Cancer Treatment: A Review. JAMA 2019, 321, 288–300. [Google Scholar] [CrossRef] [PubMed]
- Bauer, K.R.; Brown, M.; Cress, R.D.; Parise, C.A.; Caggiano, V. Descriptive analysis of estrogen receptor (ER)-negative, progesterone receptor (PR)-negative, and HER2-negative invasive breast cancer, the so-called triple-negative phenotype: A population-based study from the California cancer Registry. Cancer 2007, 109, 1721–1728. [Google Scholar] [CrossRef] [PubMed]
- Risom, T.; Langer, E.M.; Chapman, M.P.; Rantala, J.; Fields, A.J.; Boniface, C.; Alvarez, M.J.; Kendsersky, N.D.; Pelz, C.R.; Johnson-Camacho, K.; et al. Differentiation-state plasticity is a targetable resistance mechanism in basal-like breast cancer. Nat. Commun. 2018, 9, 3815. [Google Scholar] [CrossRef] [PubMed]
- Won, K.A.; Spruck, C. Triple-negative breast cancer therapy: Current and future perspectives (Review). Int. J. Oncol. 2020, 57, 1245–1261. [Google Scholar] [CrossRef] [PubMed]
- Gradishar, W.J.; Moran, M.S.; Abraham, J.; Aft, R.; Agnese, D.; Allison, K.H.; Anderson, B.; Burstein, H.J.; Chew, H.; Dang, C.; et al. Breast Cancer, Version 3.2022, NCCN Clinical Practice Guidelines in Oncology. J. Natl. Compr. Cancer Netw. 2022, 20, 691–722. [Google Scholar] [CrossRef] [PubMed]
- Ninomiya, T.; Ohara, T.; Noma, K.; Katsura, Y.; Katsube, R.; Kashima, H.; Kato, T.; Tomono, Y.; Tazawa, H.; Kagawa, S.; et al. Iron depletion is a novel therapeutic strategy to target cancer stem cells. Oncotarget 2017, 8, 98405–98416. [Google Scholar] [CrossRef]
- Katsura, Y.; Ohara, T.; Noma, K.; Ninomiya, T.; Kashima, H.; Kato, T.; Sato, H.; Komoto, S.; Narusaka, T.; Tomono, Y.; et al. A Novel Combination Cancer Therapy with Iron Chelator Targeting Cancer Stem Cells via Suppressing Stemness. Cancers 2019, 11, 177. [Google Scholar] [CrossRef]
- Tury, S.; Assayag, F.; Bonin, F.; Chateau-Joubert, S.; Servely, J.L.; Vacher, S.; Becette, V.; Caly, M.; Rapinat, A.; Gentien, D.; et al. The iron chelator deferasirox synergises with chemotherapy to treat triple-negative breast cancers. J. Pathol. 2018, 246, 103–114. [Google Scholar] [CrossRef]
- Wagenblast, E.; Soto, M.; Gutiérrez-Ángel, S.; Hartl, C.A.; Gable, A.L.; Maceli, A.R.; Erard, N.; Williams, A.M.; Kim, S.Y.; Dickopf, S.; et al. A model of breast cancer heterogeneity reveals vascular mimicry as a driver of metastasis. Nature 2015, 520, 358–362. [Google Scholar] [CrossRef]
- Law, C.W.; Alhamdoosh, M.; Su, S.; Dong, X.; Tian, L.; Smyth, G.K.; Ritchie, M.E. RNA-seq analysis is easy as 1-2-3 with limma, Glimma and edgeR. F1000Res 2016, 5, 1408. [Google Scholar] [CrossRef]
- Li, C.; Yoshimura, T.; Tian, M.; Wang, Y.; Kondo, T.; Yamamoto, K.I.; Fujisawa, M.; Ohara, T.; Sakaguchi, M.; Matsukawa, A. Exosomal Wnt7a from a low metastatic subclone promotes lung metastasis of a highly metastatic subclone in the murine 4t1 breast cancer. Breast Cancer Res. 2022, 24, 60. [Google Scholar] [CrossRef] [PubMed]
- Basho, R.K.; Yam, C.; Gilcrease, M.; Murthy, R.K.; Helgason, T.; Karp, D.D.; Meric-Bernstam, F.; Hess, K.R.; Valero, V.; Albarracin, C.; et al. Comparative Effectiveness of an mTOR-Based Systemic Therapy Regimen in Advanced, Metaplastic and Nonmetaplastic Triple-Negative Breast Cancer. Oncologist 2018, 23, 1300–1309. [Google Scholar] [CrossRef] [PubMed]
- Lehmann, B.D.; Bauer, J.A.; Chen, X.; Sanders, M.E.; Chakravarthy, A.B.; Shyr, Y.; Pietenpol, J.A. Identification of human triple-negative breast cancer subtypes and preclinical models for selection of targeted therapies. J. Clin. Invest. 2011, 121, 2750–2767. [Google Scholar] [CrossRef] [PubMed]
- Vanhaesebroeck, B.; Perry, M.W.; Brown, J.R.; André, F.; Okkenhaug, K. PI3K inhibitors are finally coming of age. Nat. Rev. Drug. Discov. 2021, 20, 741–769. [Google Scholar] [CrossRef]
- Yang, L.; Shi, P.; Zhao, G.; Xu, J.; Peng, W.; Zhang, J.; Zhang, G.; Wang, X.; Dong, Z.; Chen, F.; et al. Targeting cancer stem cell pathways for cancer therapy. Signal. Transduct. Target Ther. 2020, 5, 8. [Google Scholar] [CrossRef]
- Pascual, J.; Turner, N.C. Targeting the PI3-kinase pathway in triple-negative breast cancer. Ann. Oncol. 2019, 30, 1051–1060. [Google Scholar] [CrossRef] [PubMed]
- Cailleau, R.; Young, R.; Olive, M.; Reeves, W.J., Jr. Breast tumor cell lines from pleural effusions. J. Natl. Cancer Inst. 1974, 53, 661–674. [Google Scholar] [CrossRef]
- Tomlinson, G.E.; Chen, T.T.; Stastny, V.A.; Virmani, A.K.; Spillman, M.A.; Tonk, V.; Blum, J.L.; Schneider, N.R.; Wistuba, I.I.; Shay, J.W.; et al. Characterization of a breast cancer cell line derived from a germ-line BRCA1 mutation carrier. Cancer Res. 1998, 58, 3237–3242. [Google Scholar]
- Aw Yong, K.M.; Ulintz, P.J.; Caceres, S.; Cheng, X.; Bao, L.; Wu, Z.; Jiagge, E.M.; Merajver, S.D. Heterogeneity at the invasion front of triple negative breast cancer cells. Sci. Rep. 2020, 10, 5781. [Google Scholar] [CrossRef]
- Richmond, H.G. Induction of sarcoma in the rat by iron-dextran complex. Br. Med. J. 1959, 1, 947–949. [Google Scholar] [CrossRef]
- Toyokuni, S.; Mori, T.; Dizdaroglu, M. DNA base modifications in renal chromatin of Wistar rats treated with a renal carcinogen, ferric nitrilotriacetate. Int. J. Cancer 1994, 57, 123–128. [Google Scholar] [CrossRef] [PubMed]
- Hann, H.W.; Stahlhut, M.W.; Blumberg, B.S. Iron nutrition and tumor growth: Decreased tumor growth in iron-deficient mice. Cancer Res. 1988, 48, 4168–4170. [Google Scholar] [PubMed]
- Kalinowski, D.S.; Richardson, D.R. The evolution of iron chelators for the treatment of iron overload disease and cancer. Pharmacol. Rev. 2005, 57, 547–583. [Google Scholar] [CrossRef] [PubMed]
- Brooks, D.; Taylor, C.; Dos Santos, B.; Linden, H.; Houghton, A.; Hecht, T.T.; Kornfeld, S.; Taetle, R. Phase Ia trial of murine immunoglobulin A antitransferrin receptor antibody 42/6. Clin. Cancer Res. 1995, 1, 1259–1265. [Google Scholar] [PubMed]
- Taetle, R.; Castagnola, J.; Mendelsohn, J. Mechanisms of growth inhibition by anti-transferrin receptor monoclonal antibodies. Cancer Res. 1986, 46, 1759–1763. [Google Scholar]
- Deng, Z.; Manz, D.H.; Torti, S.V.; Torti, F.M. Effects of Ferroportin-Mediated Iron Depletion in Cells Representative of Different Histological Subtypes of Prostate Cancer. Antioxid. Redox Signal. 2019, 30, 1043–1061. [Google Scholar] [CrossRef]
- Basuli, D.; Tesfay, L.; Deng, Z.; Paul, B.; Yamamoto, Y.; Ning, G.; Xian, W.; McKeon, F.; Lynch, M.; Crum, C.P.; et al. Iron addiction: A novel therapeutic target in ovarian cancer. Oncogene 2017, 36, 4089–4099. [Google Scholar] [CrossRef]
- Pinnix, Z.K.; Miller, L.D.; Wang, W.; D’Agostino, R., Jr.; Kute, T.; Willingham, M.C.; Hatcher, H.; Tesfay, L.; Sui, G.; Di, X.; et al. Ferroportin and iron regulation in breast cancer progression and prognosis. Sci. Transl. Med. 2010, 2, 43ra56. [Google Scholar] [CrossRef]
- Miller, L.D.; Coffman, L.G.; Chou, J.W.; Black, M.A.; Bergh, J.; D′Agostino, R.; Torti, S.V.; Torti, F.M. An iron regulatory gene signature predicts outcome in breast cancer. Cancer Res. 2011, 71, 6728–6737. [Google Scholar] [CrossRef]


Disclaimer/Publisher’s Note: The statements, opinions and data contained in all publications are solely those of the individual author(s) and contributor(s) and not of MDPI and/or the editor(s). MDPI and/or the editor(s) disclaim responsibility for any injury to people or property resulting from any ideas, methods, instructions or products referred to in the content. |
© 2023 by the authors. Licensee MDPI, Basel, Switzerland. This article is an open access article distributed under the terms and conditions of the Creative Commons Attribution (CC BY) license (https://creativecommons.org/licenses/by/4.0/).
Share and Cite
Wang, Y.; Ohara, T.; Chen, Y.; Hamada, Y.; Li, C.; Fujisawa, M.; Yoshimura, T.; Matsukawa, A. Highly Metastatic Subpopulation of TNBC Cells Has Limited Iron Metabolism and Is a Target of Iron Chelators. Cancers 2023, 15, 468. https://doi.org/10.3390/cancers15020468
Wang Y, Ohara T, Chen Y, Hamada Y, Li C, Fujisawa M, Yoshimura T, Matsukawa A. Highly Metastatic Subpopulation of TNBC Cells Has Limited Iron Metabolism and Is a Target of Iron Chelators. Cancers. 2023; 15(2):468. https://doi.org/10.3390/cancers15020468
Chicago/Turabian StyleWang, Yuze, Toshiaki Ohara, Yuehua Chen, Yusuke Hamada, Chunning Li, Masayoshi Fujisawa, Teizo Yoshimura, and Akihiro Matsukawa. 2023. "Highly Metastatic Subpopulation of TNBC Cells Has Limited Iron Metabolism and Is a Target of Iron Chelators" Cancers 15, no. 2: 468. https://doi.org/10.3390/cancers15020468
APA StyleWang, Y., Ohara, T., Chen, Y., Hamada, Y., Li, C., Fujisawa, M., Yoshimura, T., & Matsukawa, A. (2023). Highly Metastatic Subpopulation of TNBC Cells Has Limited Iron Metabolism and Is a Target of Iron Chelators. Cancers, 15(2), 468. https://doi.org/10.3390/cancers15020468