


Deep Learning for Detecting Brain Metastases on MRI: A Systematic Review and Meta-Analysis

 , , , ,
Abstract
Simple Summary
Abstract
1. Introduction
2. Materials and Methods
2.1. Literature Search
2.2. Study Selection
2.3. Data Extraction
2.4. Quality Assessment
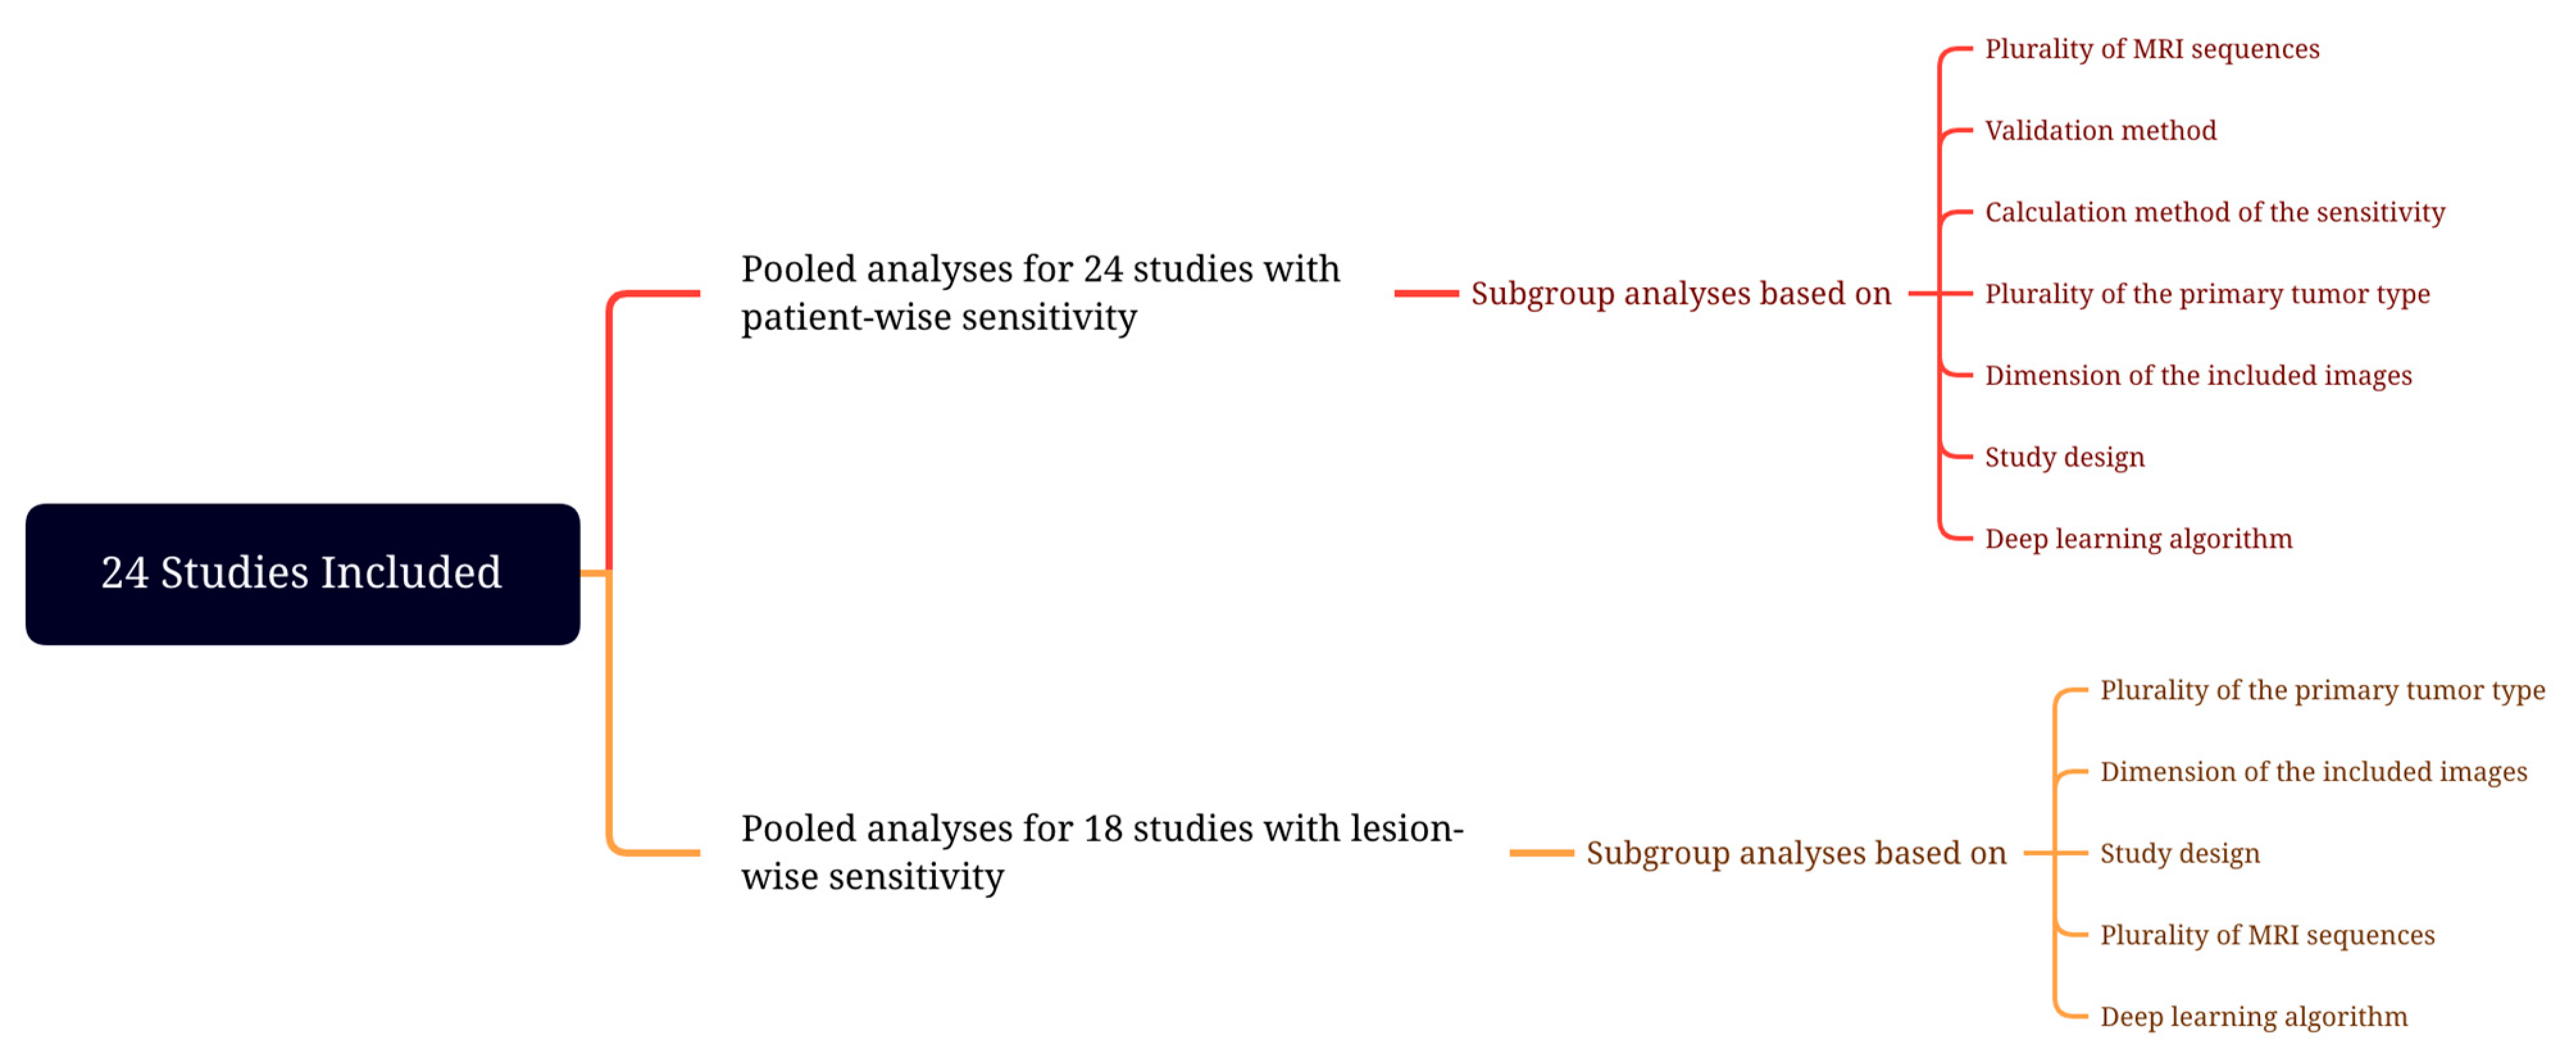
2.5. Meta-Analysis
3. Results
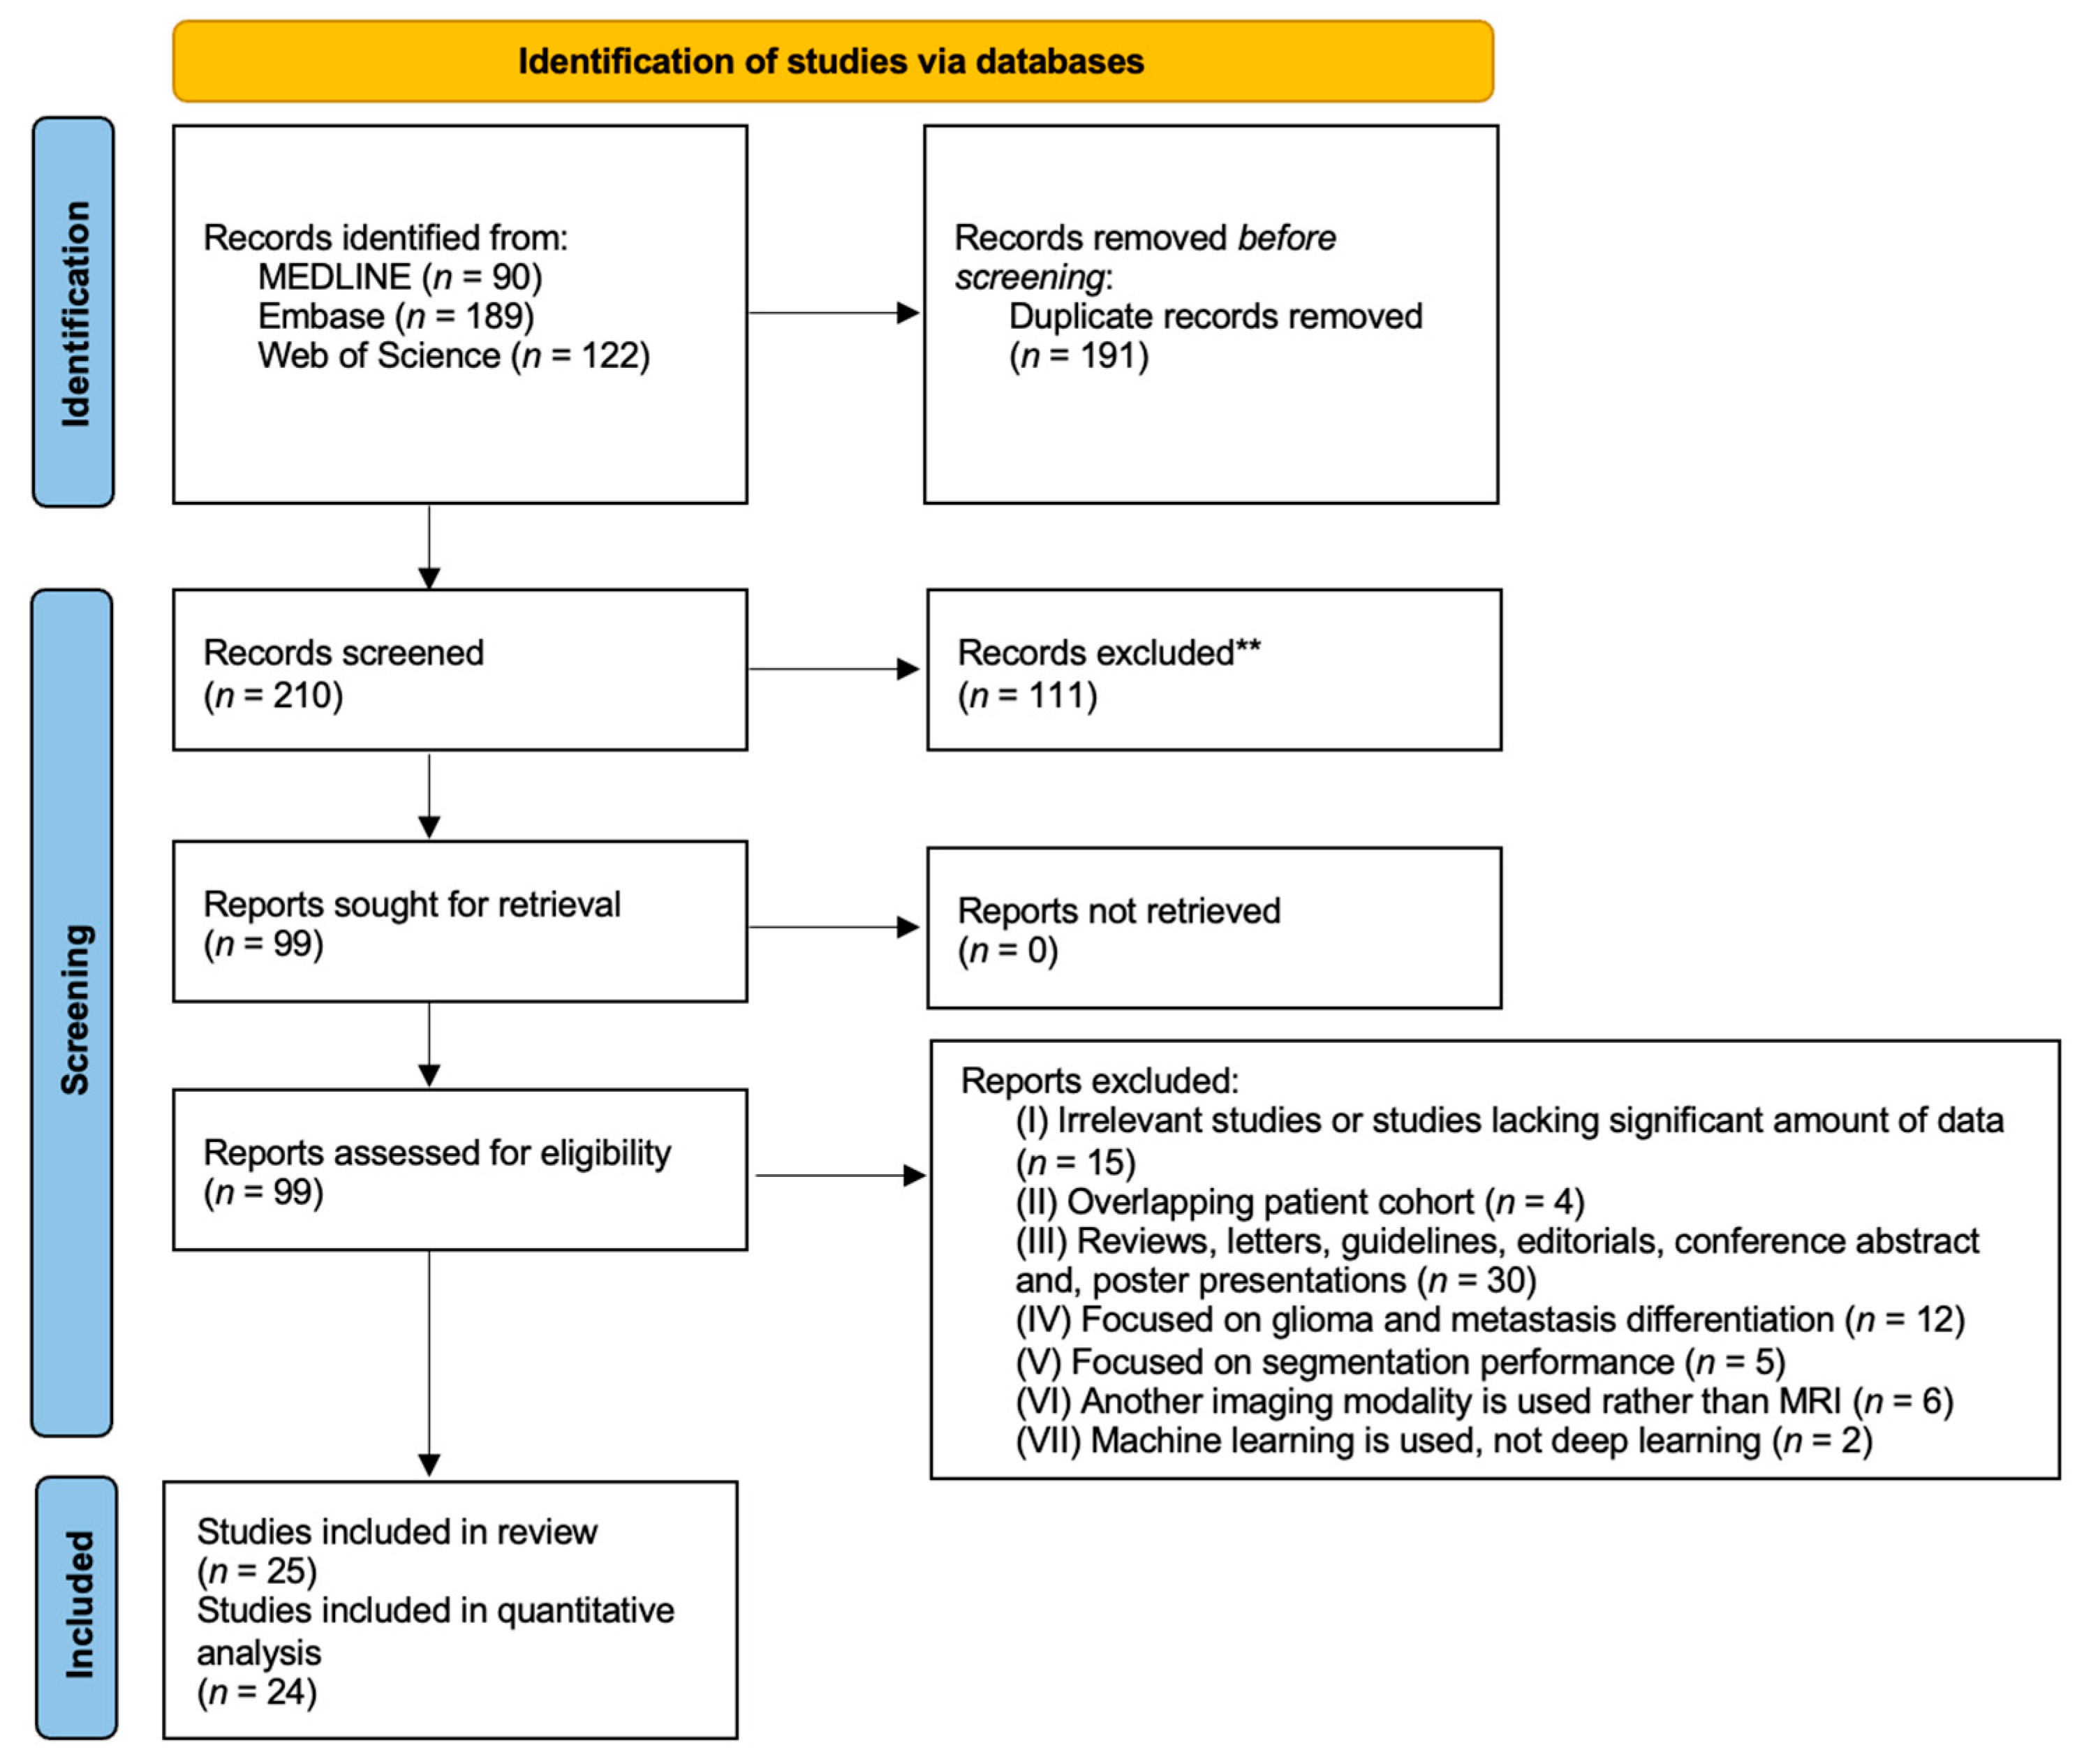
3.1. Literature Search
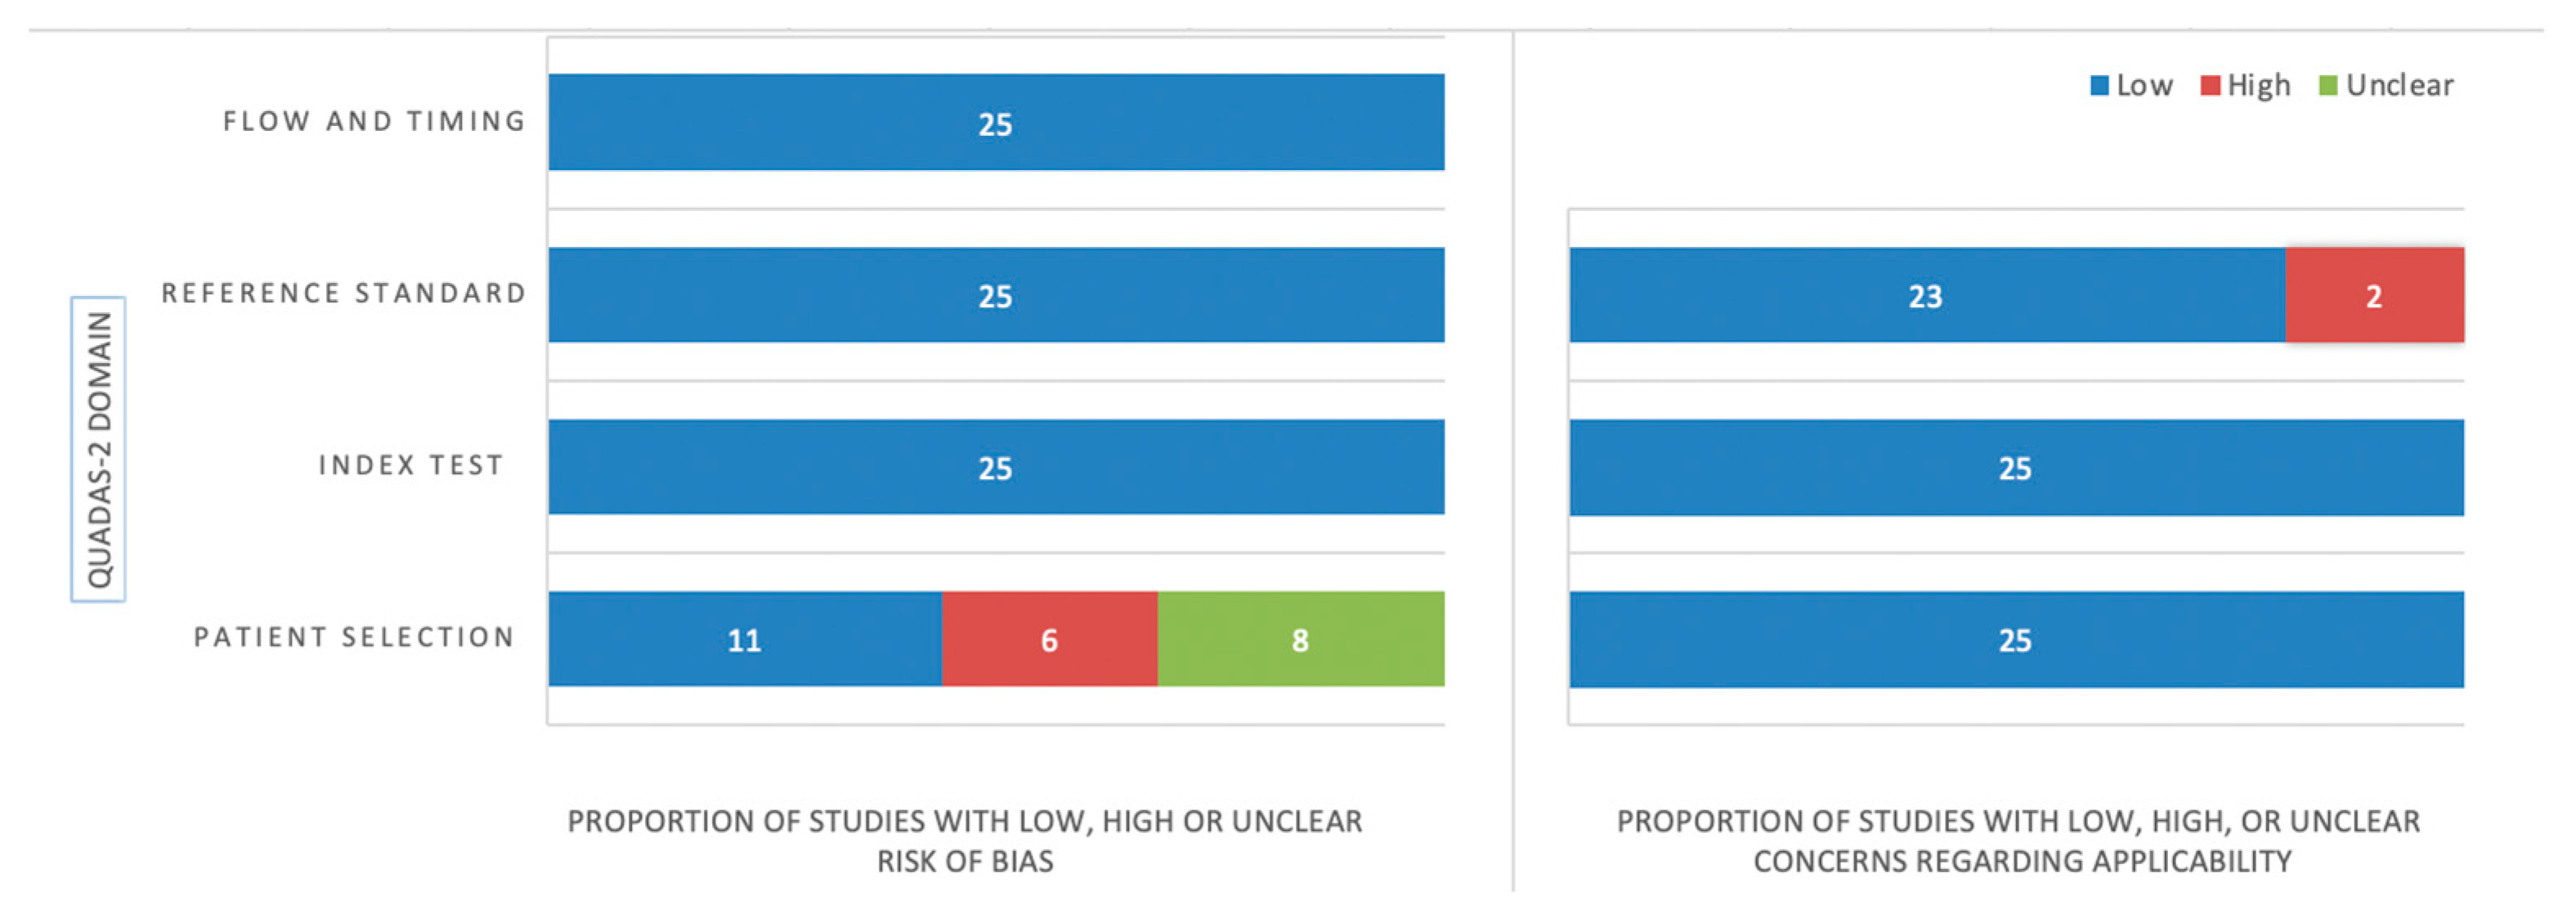
3.2. Quality Assessment
3.3. Characteristics of Included Studies
3.4. Deep Learning Algorithms
3.5. Assessment of Detectability Performance
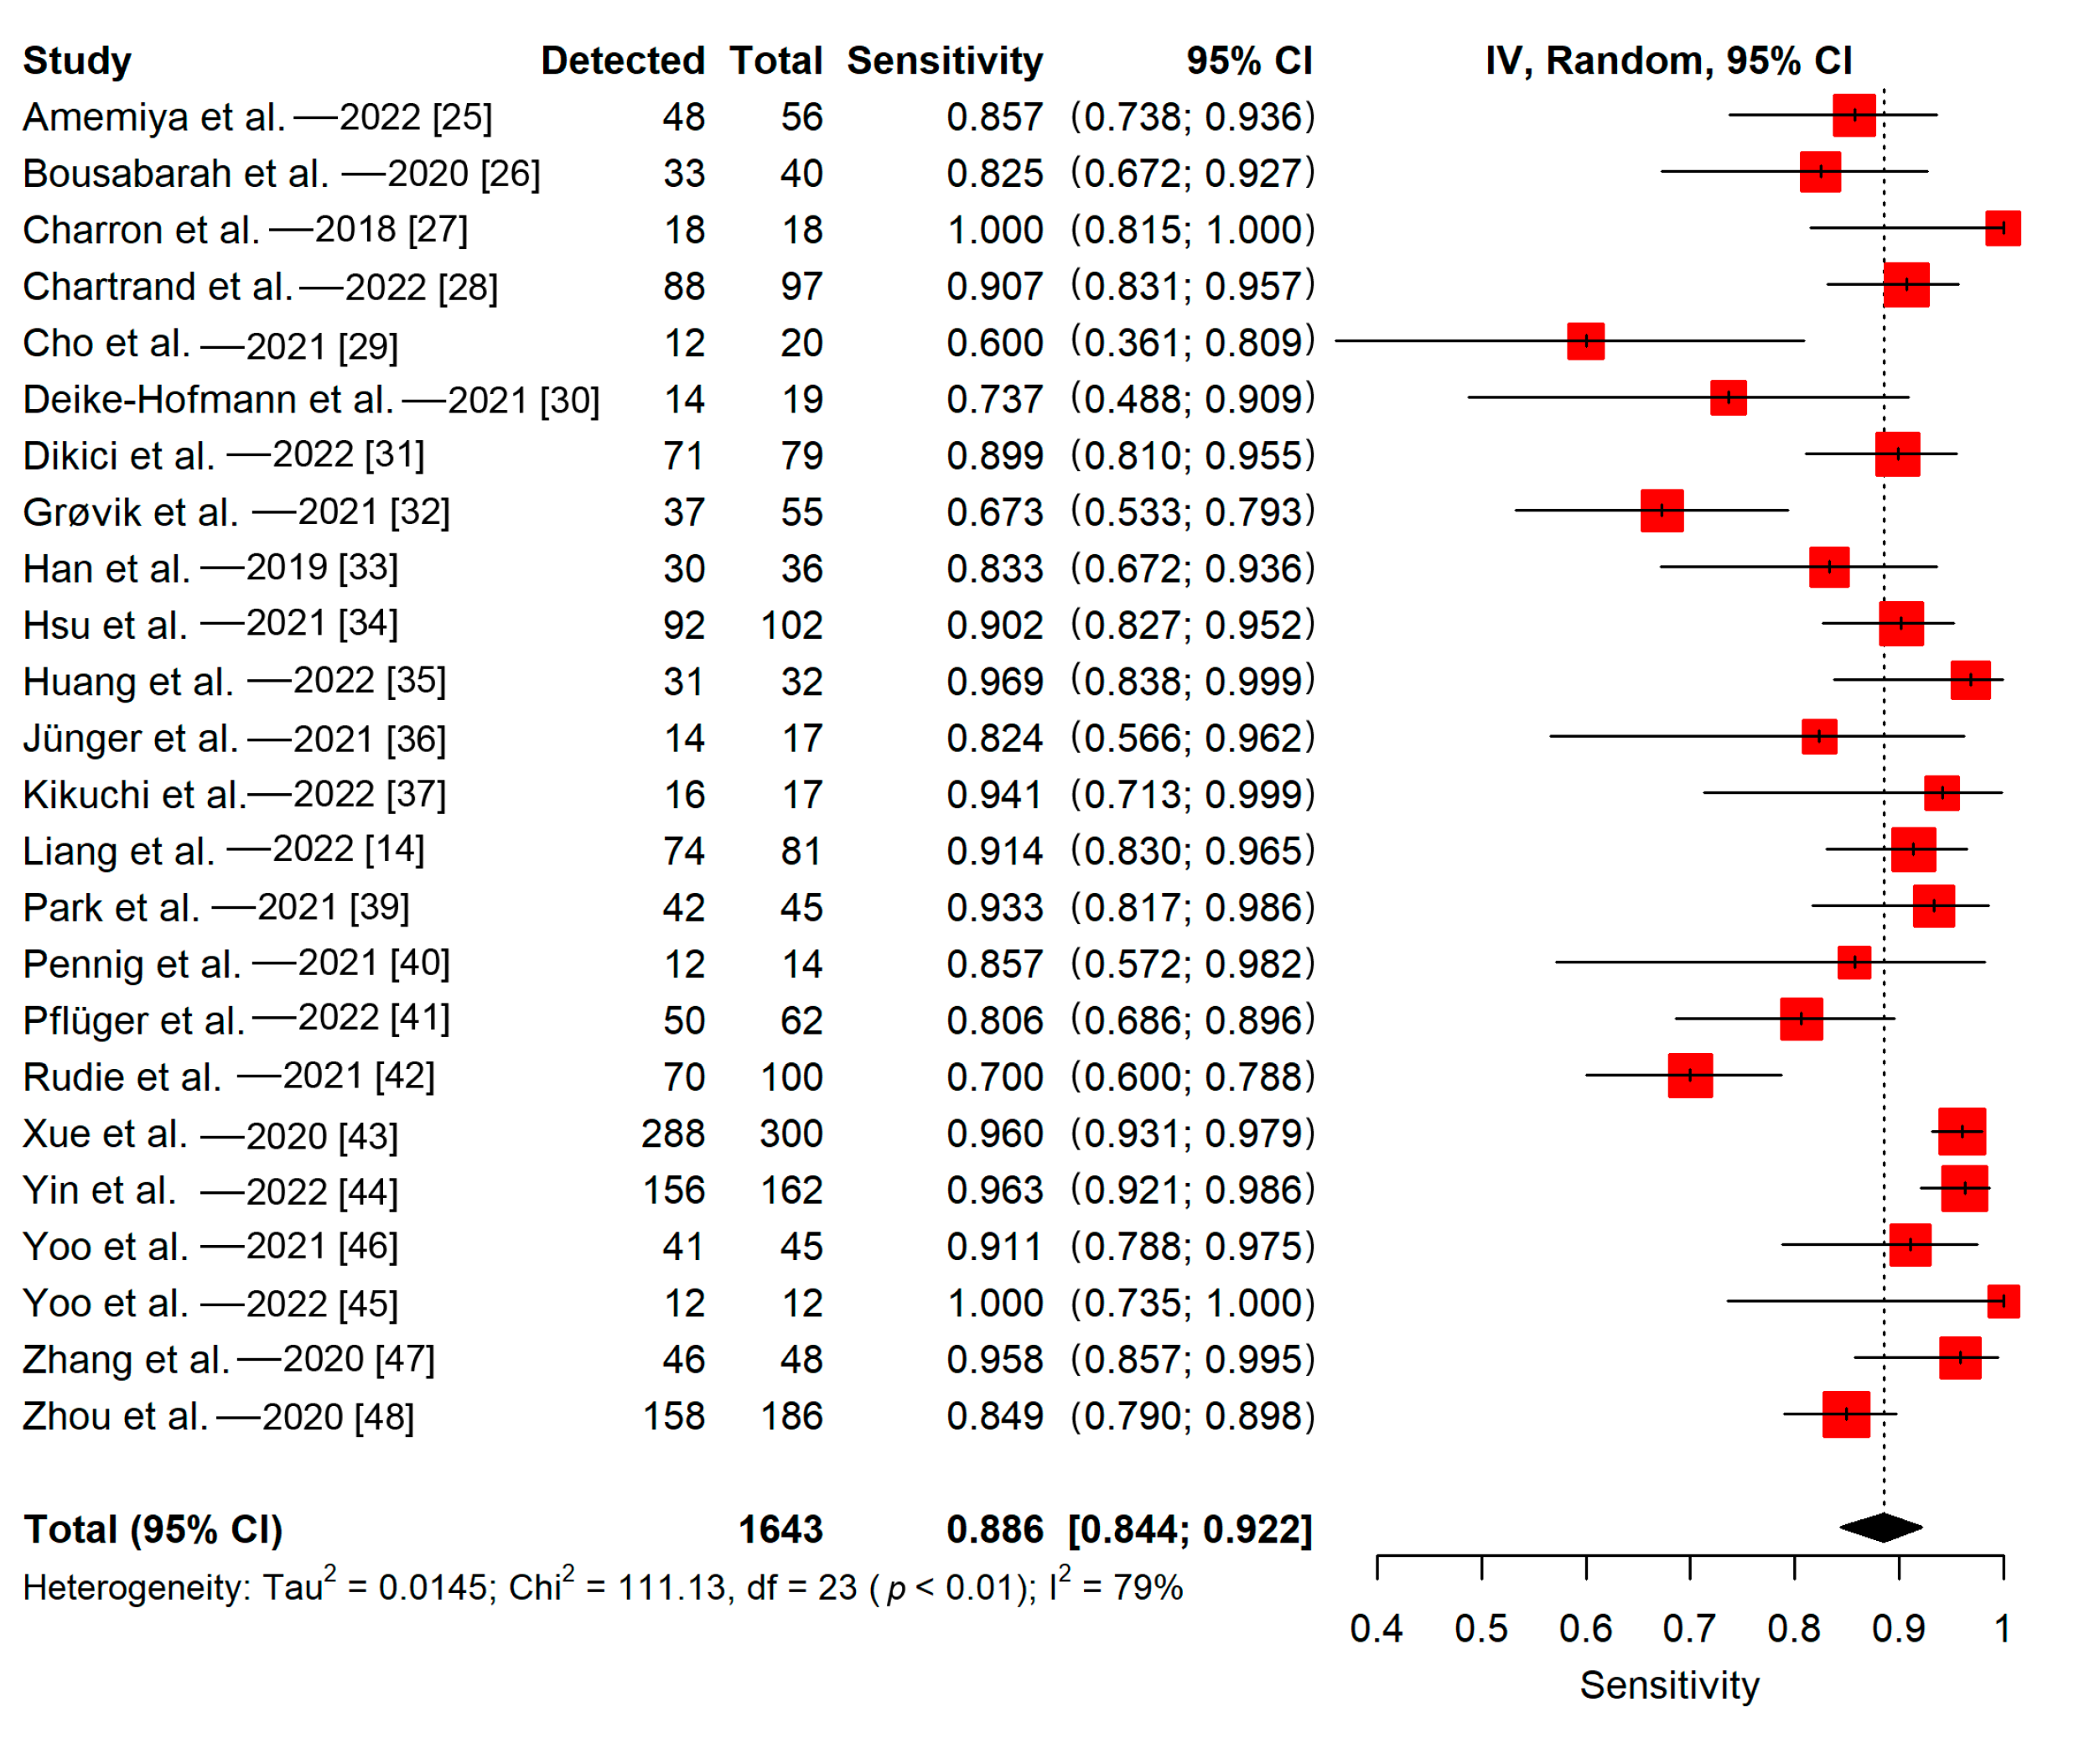
3.5.1. Patient-Wise
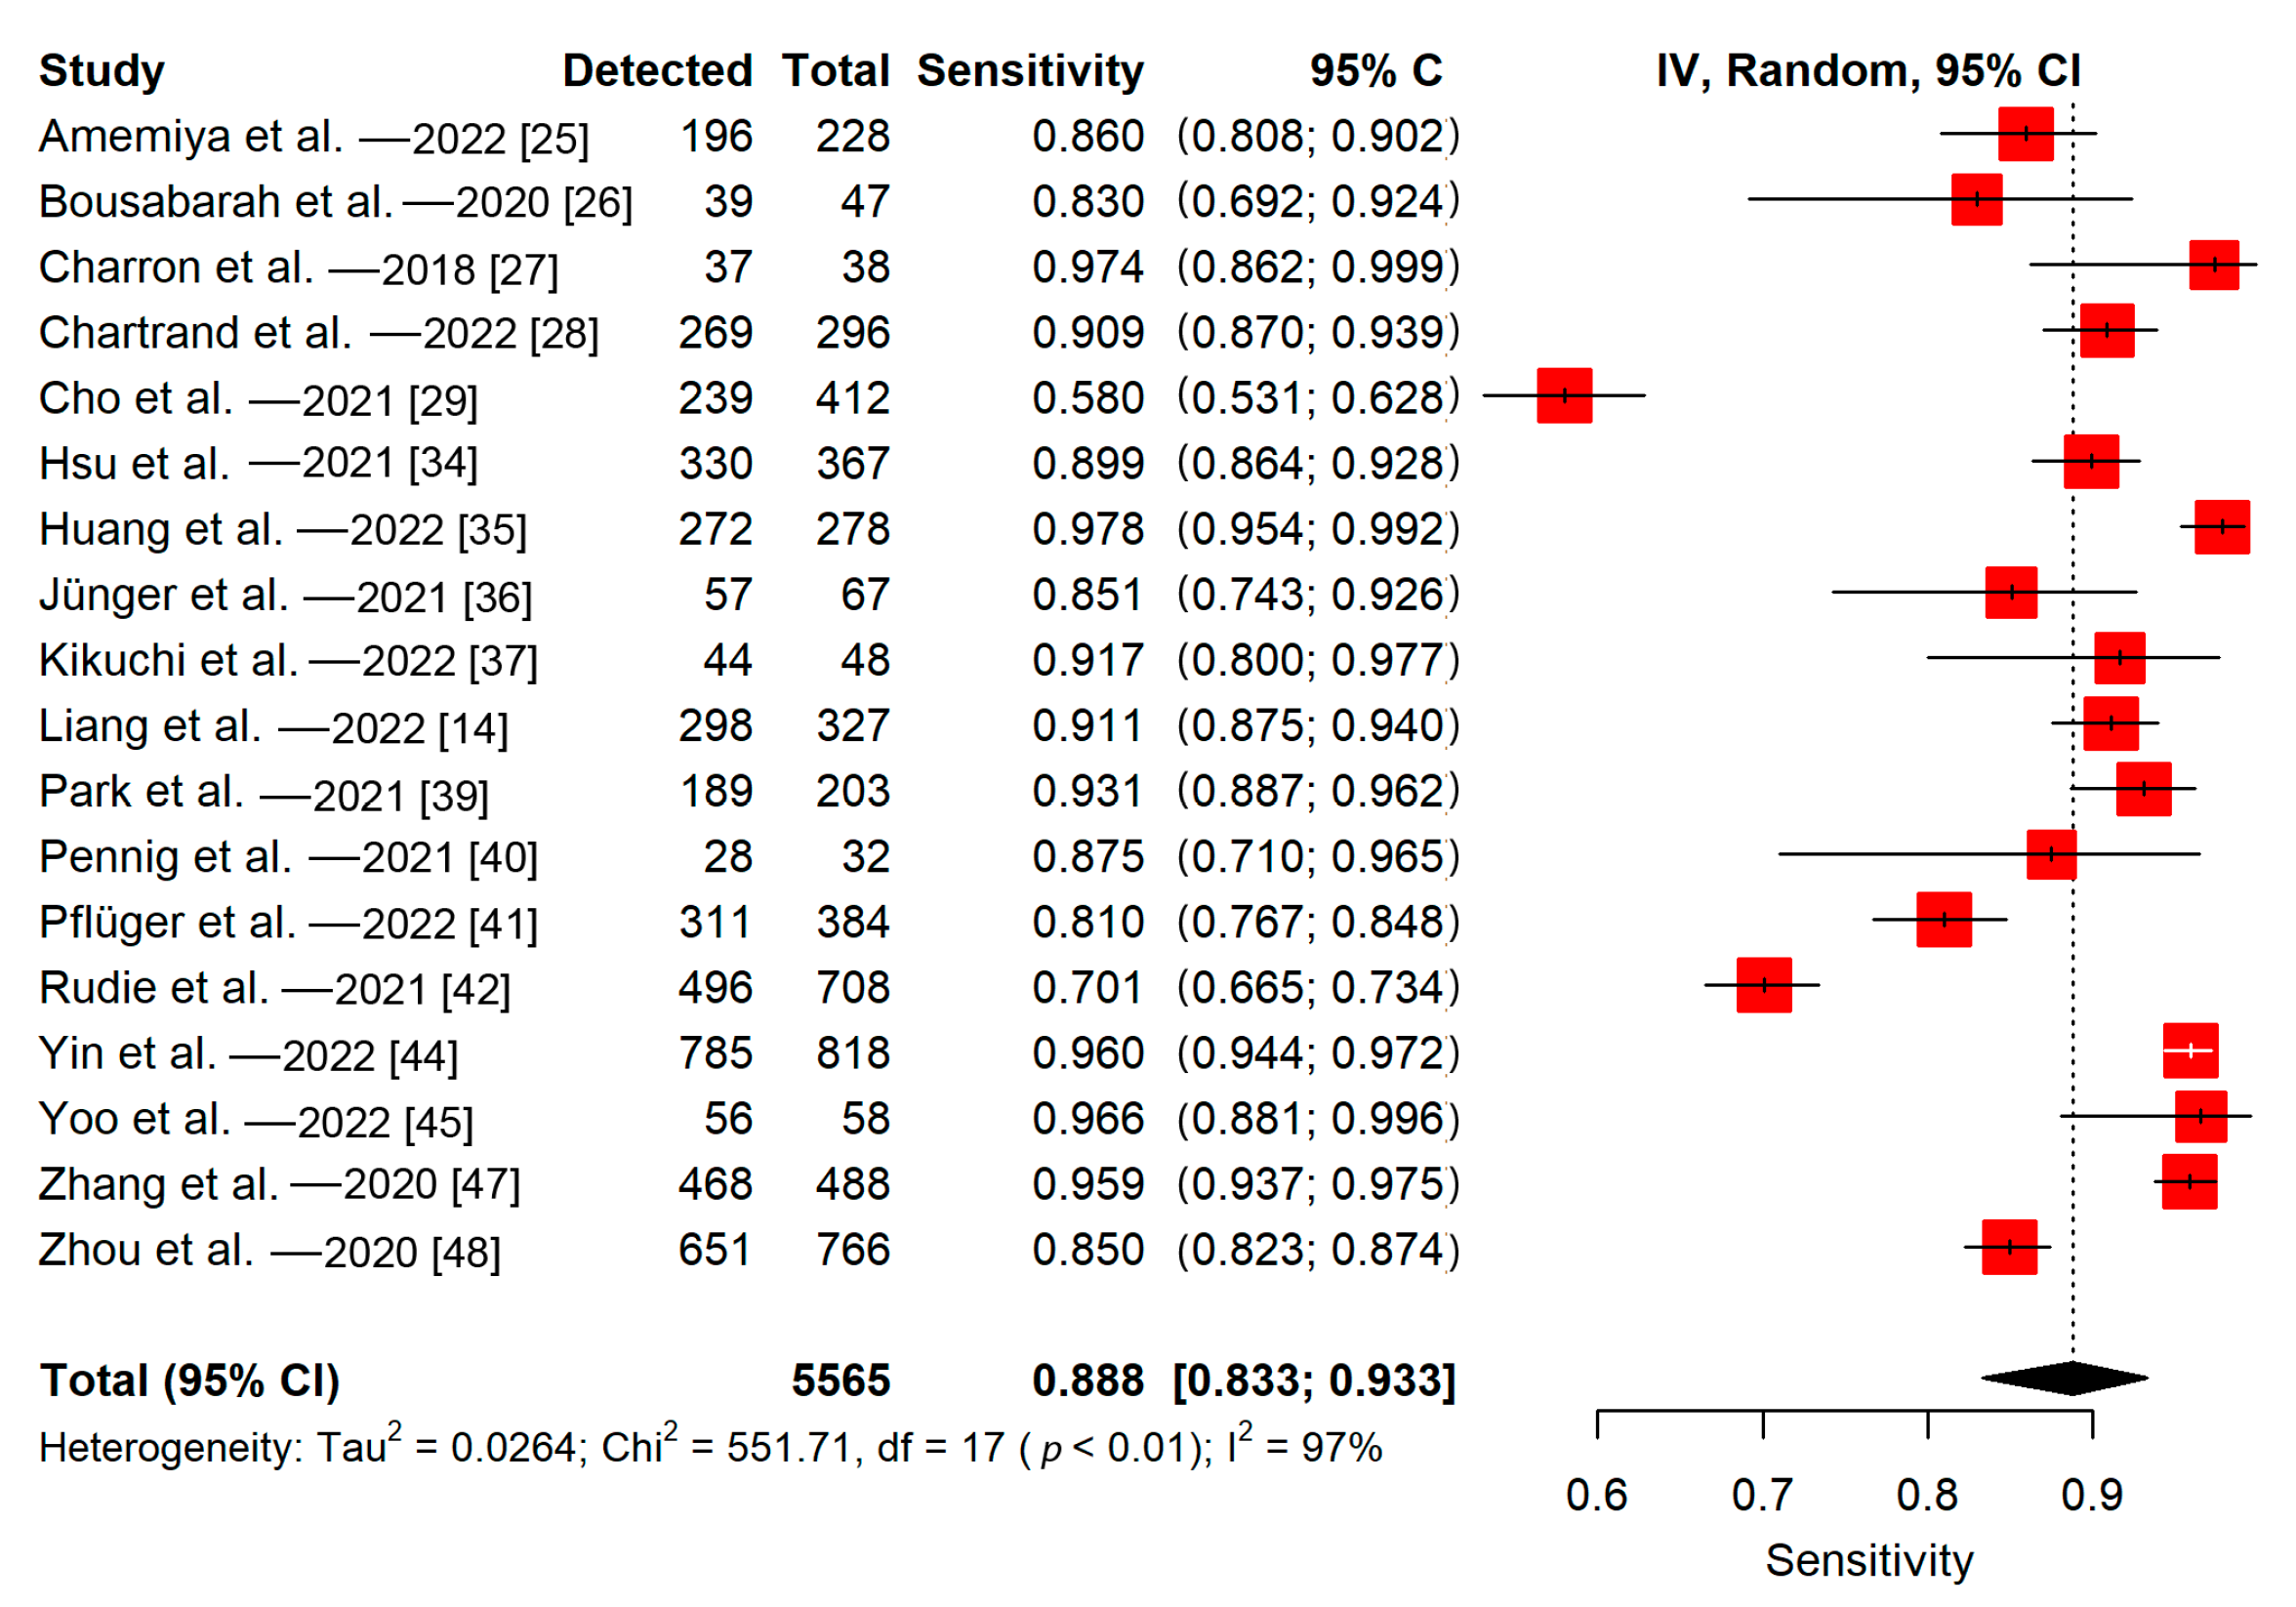
3.5.2. Lesion-Wise
4. Discussion
5. Conclusions
Supplementary Materials
Author Contributions
Funding
Conflicts of Interest
References
- Lin, X.; DeAngelis, L.M. Treatment of Brain Metastases. J. Clin. Oncol. 2015, 33, 3475–3484. [Google Scholar] [CrossRef]
- Sacks, P.; Rahman, M. Epidemiology of Brain Metastases. Neurosurg. Clin. N. Am. 2020, 31, 481–488. [Google Scholar] [CrossRef]
- Nayak, L.; Lee, E.Q.; Wen, P.Y. Epidemiology of Brain Metastases. Curr. Oncol. Rep. 2012, 14, 48–54. [Google Scholar] [CrossRef]
- Suh, J.H.; Kotecha, R.; Chao, S.T.; Ahluwalia, M.S.; Sahgal, A.; Chang, E.L. Current Approaches to the Management of Brain Metastases. Nat. Rev. Clin. Oncol. 2020, 17, 279–299. [Google Scholar] [CrossRef]
- Soffietti, R.; Abacioglu, U.; Baumert, B.; Combs, S.E.; Kinhult, S.; Kros, J.M.; Marosi, C.; Metellus, P.; Radbruch, A.; Villa Freixa, S.S.; et al. Diagnosis and Treatment of Brain Metastases from Solid Tumors: Guidelines from the European Association of Neuro-Oncology (EANO). Neuro-Oncol. 2017, 19, 162–174. [Google Scholar] [CrossRef]
- Sze, G.; Milano, E.; Johnson, C.; Heier, L. Detection of Brain Metastases: Comparison of Contrast-Enhanced MR with Unenhanced MR and Enhanced CT. AJNR Am. J. Neuroradiol. 1990, 11, 785–791. [Google Scholar]
- Davis, P.C.; Hudgins, P.A.; Peterman, S.B.; Hoffman, J.C. Diagnosis of Cerebral Metastases: Double-Dose Delayed CT vs. Contrast-Enhanced MR Imaging. AJNR Am. J. Neuroradiol. 1991, 12, 293–300. [Google Scholar]
- Yamamoto, M.; Serizawa, T.; Shuto, T.; Akabane, A.; Higuchi, Y.; Kawagishi, J.; Yamanaka, K.; Sato, Y.; Jokura, H.; Yomo, S.; et al. Stereotactic Radiosurgery for Patients with Multiple Brain Metastases (JLGK0901): A Multi-Institutional Prospective Observational Study. Lancet Oncol. 2014, 15, 387–395. [Google Scholar] [CrossRef]
- Gondi, V.; Bauman, G.; Bradfield, L.; Burri, S.H.; Cabrera, A.R.; Cunningham, D.A.; Eaton, B.R.; Hattangadi-Gluth, J.A.; Kim, M.M.; Kotecha, R.; et al. Radiation Therapy for Brain Metastases: An ASTRO Clinical Practice Guideline. Pract. Radiat. Oncol. 2022, 12, 265–282. [Google Scholar] [CrossRef]
- Growcott, S.; Dembrey, T.; Patel, R.; Eaton, D.; Cameron, A. Inter-Observer Variability in Target Volume Delineations of Benign and Metastatic Brain Tumours for Stereotactic Radiosurgery: Results of a National Quality Assurance Programme. Clin. Oncol. 2020, 32, 13–25. [Google Scholar] [CrossRef]
- Cho, S.J.; Sunwoo, L.; Baik, S.H.; Bae, Y.J.; Choi, B.S.; Kim, J.H. Brain Metastasis Detection Using Machine Learning: A Systematic Review and Meta-Analysis. Neuro-Oncol. 2021, 23, 214–225. [Google Scholar] [CrossRef]
- Chan, H.-P.; Samala, R.K.; Hadjiiski, L.M.; Zhou, C. Deep Learning in Medical Image Analysis. Adv. Exp. Med. Biol. 2020, 1213, 3–21. [Google Scholar] [CrossRef]
- Karabacak, M.; Ozkara, B.B.; Mordag, S.; Bisdas, S. Deep Learning for Prediction of Isocitrate Dehydrogenase Mutation in Gliomas: A Critical Approach, Systematic Review and Meta-Analysis of the Diagnostic Test Performance Using a Bayesian Approach. Quant. Imaging Med. Surg. 2022, 12, 4033–4046. [Google Scholar] [CrossRef]
- Liang, Y.; Lee, K.; Bovi, J.A.; Palmer, J.D.; Brown, P.D.; Gondi, V.; Tome, W.A.; Benzinger, T.L.S.; Mehta, M.P.; Li, X.A. Deep Learning-Based Automatic Detection of Brain Metastases in Heterogenous Multi-Institutional Magnetic Resonance Imaging Sets: An Exploratory Analysis of NRG-CC001. Int. J. Radiat. Oncol. Biol. Phys. 2022, 114, 529–536. [Google Scholar] [CrossRef] [PubMed]
- McInnes, M.D.F.; Moher, D.; Thombs, B.D.; McGrath, T.A.; Bossuyt, P.M.; the PRISMA-DTA Group; Clifford, T.; Cohen, J.F.; Deeks, J.J.; Gatsonis, C.; et al. Preferred Reporting Items for a Systematic Review and Meta-Analysis of Diagnostic Test Accuracy Studies: The PRISMA-DTA Statement. JAMA 2018, 319, 388–396. [Google Scholar] [CrossRef]
- Ouzzani, M.; Hammady, H.; Fedorowicz, Z.; Elmagarmid, A. Rayyan—A Web and Mobile App for Systematic Reviews. Syst. Rev. 2016, 5, 210. [Google Scholar] [CrossRef] [PubMed]
- Mongan, J.; Moy, L.; Kahn, C.E. Checklist for Artificial Intelligence in Medical Imaging (CLAIM): A Guide for Authors and Reviewers. Radiol. Artif. Intell. 2020, 2, e200029. [Google Scholar] [CrossRef] [PubMed]
- Whiting, P.F.; Rutjes, A.W.S.; Westwood, M.E.; Mallett, S.; Deeks, J.J.; Reitsma, J.B.; Leeflang, M.M.G.; Sterne, J.A.C.; Bossuyt, P.M.M. QUADAS-2 Group QUADAS-2: A Revised Tool for the Quality Assessment of Diagnostic Accuracy Studies. Ann. Intern. Med. 2011, 155, 529–536. [Google Scholar] [CrossRef] [PubMed]
- Dettori, J.R.; Norvell, D.C.; Chapman, J.R. Fixed-Effect vs Random-Effects Models for Meta-Analysis: 3 Points to Consider. Global Spine J. 2022, 12, 1624–1626. [Google Scholar] [CrossRef]
- Borenstein, M.; Hedges, L.V.; Higgins, J.P.T.; Rothstein, H.R. A Basic Introduction to Fixed-Effect and Random-Effects Models for Meta-Analysis. Res. Synth. Methods 2010, 1, 97–111. [Google Scholar] [CrossRef]
- Higgins, J.P.T.; Thompson, S.G.; Deeks, J.J.; Altman, D.G. Measuring Inconsistency in Meta-Analyses. BMJ 2003, 327, 557–560. [Google Scholar] [CrossRef] [PubMed]
- Groenwold, R.H.H.; Rovers, M.M.; Lubsen, J.; van der Heijden, G.J. Subgroup Effects despite Homogeneous Heterogeneity Test Results. BMC Med. Res. Methodol. 2010, 10, 43. [Google Scholar] [CrossRef] [PubMed]
- Egger, M.; Davey Smith, G.; Schneider, M.; Minder, C. Bias in Meta-Analysis Detected by a Simple, Graphical Test. BMJ 1997, 315, 629–634. [Google Scholar] [CrossRef] [PubMed]
- Balduzzi, S.; Rücker, G.; Schwarzer, G. How to Perform a Meta-Analysis with R: A Practical Tutorial. Evid. Based Ment. Health 2019, 22, 153–160. [Google Scholar] [CrossRef]
- Amemiya, S.; Takao, H.; Kato, S.; Yamashita, H.; Sakamoto, N.; Abe, O. Feature-Fusion Improves MRI Single-Shot Deep Learning Detection of Small Brain Metastases. J. Neuroimaging 2022, 32, 111–119. [Google Scholar] [CrossRef]
- Bousabarah, K.; Ruge, M.; Brand, J.-S.; Hoevels, M.; Rues, D.; Borggrefe, J.; Grose Hokamp, N.; Visser-Vandewalle, V.; Maintz, D.; Treuer, H.; et al. Deep Convolutional Neural Networks for Automated Segmentation of Brain Metastases Trained on Clinical Data. Radiat. Oncol. 2020, 15, 87. [Google Scholar] [CrossRef]
- Charron, O.; Lallement, A.; Jarnet, D.; Noblet, V.; Clavier, J.B.; Meyer, P. Automatic Detection and Segmentation of Brain Metastases on Multimodal MR Images with a Deep Convolutional Neural Network. Comput. Biol. Med. 2018, 95, 43–54. [Google Scholar] [CrossRef]
- Chartrand, G.; Emiliani, R.D.; Pawlowski, S.A.; Markel, D.A.; Bahig, H.; Cengarle-Samak, A.; Rajakesari, S.; Lavoie, J.; Ducharme, S.; Roberge, D. Automated Detection of Brain Metastases on T1-Weighted MRI Using a Convolutional Neural Network: Impact of Volume Aware Loss and Sampling Strategy. J. Magn. Reson. Imaging 2022, 56, 1885–1898. [Google Scholar] [CrossRef]
- Cho, J.; Kim, Y.J.; Sunwoo, L.; Lee, G.P.; Nguyen, T.Q.; Cho, S.J.; Baik, S.H.; Bae, Y.J.; Choi, B.S.; Jung, C.; et al. Deep Learning-Based Computer-Aided Detection System for Automated Treatment Response Assessment of Brain Metastases on 3D MRI. Front. Oncol. 2021, 11, 739639. [Google Scholar] [CrossRef]
- Deike-Hofmann, K.; Dancs, D.; Paech, D.; Schlemmer, H.P.; Maier-Hein, K.; Baumer, P.; Radbruch, A.; Gotz, M. Pre-Examinations Improve Automated Metastases Detection on Cranial MRI. Investig. Radiol. 2021, 56, 320–327. [Google Scholar] [CrossRef]
- Dikici, E.; Nguyen, X.V.; Bigelow, M.; Ryu, J.L.; Prevedello, L.M. Advancing Brain Metastases Detection in T1-Weighted Contrast-Enhanced 3D MRI Using Noisy Student-Based Training. Diagnostics 2022, 12, 2023. [Google Scholar] [CrossRef] [PubMed]
- Grovik, E.; Yi, D.; Iv, M.; Tong, E.; Nilsen, L.B.; Latysheva, A.; Saxhaug, C.; Jacobsen, K.D.; Hell, A.; Emblem, K.E.; et al. Handling Missing MRI Sequences in Deep Learning Segmentation of Brain Metastases: A Multicenter Study. NPJ Digit. Med. 2021, 4, 33. [Google Scholar] [CrossRef] [PubMed]
- Han, C.; Murao, K.; Noguchi, T.; Kawata, Y.; Uchiyama, F.; Rundo, L.; Nakayarna, H.; Satoh, S. Learning More with Less: Conditional PGGAN-Based Data Augmentation for Brain Metastases Detection Using Highly-Rough Annotation on MR Images. In Proceedings of the 28th ACM International Conference on Information and Knowledge Management (CIKM), Beijing, China, 3–7 November 2019; pp. 119–127. [Google Scholar] [CrossRef]
- Hsu, D.G.; Ballangrud, A.; Shamseddine, A.; Deasy, J.O.; Veeraraghavan, H.; Cervino, L.; Beal, K.; Aristophanous, M. Automatic Segmentation of Brain Metastases Using T1 Magnetic Resonance and Computed Tomography Images. Phys. Med. Biol. 2021, 66, 175014. [Google Scholar] [CrossRef] [PubMed]
- Huang, Y.X.; Bert, C.; Sommer, P.; Frey, B.; Gaipl, U.; Distel, L.V.; Weissmann, T.; Uder, M.; Schmidt, M.A.; Dorfler, A.; et al. Deep Learning for Brain Metastasis Detection and Segmentation in Longitudinal MRI Data. Med. Phys. 2022, 49, 5773–5786. [Google Scholar] [CrossRef] [PubMed]
- Jünger, S.T.; Hoyer, U.C.I.; Schaufler, D.; Laukamp, K.R.; Goertz, L.; Thiele, F.; Grunz, J.-P.; Schlamann, M.; Perkuhn, M.; Kabbasch, C.; et al. Fully Automated MR Detection and Segmentation of Brain Metastases in Non-Small Cell Lung Cancer Using Deep Learning. J. Magn. Reson. Imaging 2021, 54, 1608–1622. [Google Scholar] [CrossRef] [PubMed]
- Kikuchi, Y.; Togao, O.; Kikuchi, K.; Momosaka, D.; Obara, M.; Van Cauteren, M.; Fischer, A.; Ishigami, K.; Hiwatashi, A. A Deep Convolutional Neural Network-Based Automatic Detection of Brain Metastases with and without Blood Vessel Suppression. Eur. Radiol. 2022, 32, 2998–3005. [Google Scholar] [CrossRef] [PubMed]
- Kottlors, J.; Geissen, S.; Jendreizik, H.; Grose Hokamp, N.; Fervers, P.; Pennig, L.; Laukamp, K.; Kabbasch, C.; Maintz, D.; Schlamann, M.; et al. Contrast-Enhanced Black Blood MRI Sequence Is Superior to Conventional T1 Sequence in Automated Detection of Brain Metastases by Convolutional Neural Networks. Diagnostics 2021, 11, 1016. [Google Scholar] [CrossRef]
- Park, Y.W.; Jun, Y.; Lee, Y.; Han, K.; An, C.; Ahn, S.S.; Hwang, D.; Lee, S.K. Robust Performance of Deep Learning for Automatic Detection and Segmentation of Brain Metastases Using Three-Dimensional Black-Blood and Three-Dimensional Gradient Echo Imaging. Eur. Radiol. 2021, 31, 6686–6695. [Google Scholar] [CrossRef]
- Pennig, L.; Shahzad, R.; Caldeira, L.; Lennartz, S.; Thiele, F.; Goertz, L.; Zopfs, D.; Meisner, A.K.; Furtjes, G.; Perkuhn, M.; et al. Automated Detection and Segmentation of Brain Metastases in Malignant Melanoma: Evaluation of a Dedicated Deep Learning Model. AJNR Am. J. Neuroradiol. 2021, 42, 655–662. [Google Scholar] [CrossRef]
- Pfluger, I.; Wald, T.; Isensee, F.; Schell, M.; Meredig, H.; Schlamp, K.; Bernhardt, D.; Brugnara, G.; Heusel, C.P.; Debus, J.; et al. Automated Detection and Quantification of Brain Metastases on Clinical MRI Data Using Artificial Neural Networks. Neuro-Oncol. Adv. 2022, 4, vdac138. [Google Scholar] [CrossRef]
- Rudie, J.D.; Weiss, D.A.; Colby, J.B.; Rauschecker, A.M.; Laguna, B.; Braunstein, S.; Sugrue, L.P.; Hess, C.P.; Villanueva-Meyer, J.E. Three-Dimensional U-Net Convolutional Neural Network for Detection and Segmentation of Intracranial Metastases. Radiol.-Artif. Intell. 2021, 3, e200204. [Google Scholar] [CrossRef] [PubMed]
- Xue, J.; Wang, B.; Ming, Y.; Jiang, Z.; Wang, C.; Liu, X.; Chen, L.; Qu, J.; Xu, S.; Tang, X.; et al. Deep Learning-Based Detection and Segmentation-Assisted Management of Brain Metastases. Neuro-Oncol. 2020, 22, 505–514. [Google Scholar] [CrossRef] [PubMed]
- Yin, S.H.; Luo, X.; Yang, Y.D.; Shao, Y.; Ma, L.D.; Lin, C.P.; Yang, Q.X.; Wang, D.L.; Luo, Y.W.; Mai, Z.J.; et al. Development and Validation of a Deep-Learning Model for Detecting Brain Metastases on 3D Post-Contrast MRI: A Multi-Center Multi-Reader Evaluation Study. Neuro-Oncol. 2022, 24, 1559–1570. [Google Scholar] [CrossRef] [PubMed]
- Yoo, S.K.; Kim, T.H.; Kim, H.J.; Yoon, H.I.; Kim, J.S. Deep Learning-Based Automatic Detection and Segmentation of Brain Metastases for Stereotactic Ablative Radiotherapy Using Black-Blood Magnetic Resonance Imaging. Int. J. Radiat. Oncol. Biol. Phys. 2022, 114, e558. [Google Scholar] [CrossRef]
- Yoo, Y.J.; Ceccaldi, P.; Liu, S.Q.; Re, T.J.; Cao, Y.; Balter, J.M.; Gibson, E. Evaluating Deep Learning Methods in Detecting and Segmenting Different Sizes of Brain Metastases on 3D Post-Contrast T1-Weighted Images. J. Med. Imaging 2021, 8, 037001. [Google Scholar] [CrossRef]
- Zhang, M.; Young, G.S.; Chen, H.; Li, J.; Qin, L.; McFaline-Figueroa, J.R.; Reardon, D.A.; Cao, X.H.; Wu, X.; Xu, X.Y. Deep-Learning Detection of Cancer Metastases to the Brain on MRI. J. Magn. Reson. Imaging 2020, 52, 1227–1236. [Google Scholar] [CrossRef]
- Zhou, Z.J.; Saners, J.W.; Johnson, J.M.; Gule-Monroe, M.; Chen, M.; Briere, T.M.; Wang, Y.; Son, J.B.; Pagel, M.D.; Ma, J.; et al. MetNet: Computer-Aided Segmentation of Brain Metastases in Post-Contrast T1-Weighted Magnetic Resonance Imaging. Radiother. Oncol. 2020, 153, 189–196. [Google Scholar] [CrossRef]
- Ellingson, B.M.; Bendszus, M.; Boxerman, J.; Barboriak, D.; Erickson, B.J.; Smits, M.; Nelson, S.J.; Gerstner, E.; Alexander, B.; Goldmacher, G.; et al. Consensus Recommendations for a Standardized Brain Tumor Imaging Protocol in Clinical Trials. Neuro-Oncol. 2015, 17, 1188–1198. [Google Scholar] [CrossRef]
- Cochrane Handbook for Systematic Reviews of Interventions. Available online: https://training.cochrane.org/handbook (accessed on 17 October 2022).
- Ostrom, Q.T.; Wright, C.H.; Barnholtz-Sloan, J.S. Brain Metastases: Epidemiology. Handb. Clin. Neurol. 2018, 149, 27–42. [Google Scholar] [CrossRef]
- Le Rhun, E.; Guckenberger, M.; Smits, M.; Dummer, R.; Bachelot, T.; Sahm, F.; Galldiks, N.; de Azambuja, E.; Berghoff, A.S.; Metellus, P.; et al. EANO-ESMO Clinical Practice Guidelines for Diagnosis, Treatment and Follow-up of Patients with Brain Metastasis from Solid Tumours. Ann. Oncol. 2021, 32, 1332–1347. [Google Scholar] [CrossRef]
- Zhou, Z.; Sanders, J.W.; Johnson, J.M.; Gule-Monroe, M.K.; Chen, M.M.; Briere, T.M.; Wang, Y.; Son, J.B.; Pagel, M.D.; Li, J.; et al. Computer-Aided Detection of Brain Metastases in T1-Weighted MRI for Stereotactic Radiosurgery Using Deep Learning Single-Shot Detectors. Radiology 2020, 295, 407–415. [Google Scholar] [CrossRef] [PubMed]
- Dikici, E.; Ryu, J.L.; Demirer, M.; Bigelow, M.; White, R.D.; Slone, W.; Erdal, B.S.; Prevedello, L.M. Automated Brain Metastases Detection Framework for T1-Weighted Contrast-Enhanced 3D MRI. IEEE J. Biomed. Health Inform. 2020, 24, 2883–2893. [Google Scholar] [CrossRef]
- Suh, C.H.; Jung, S.C.; Kim, K.W.; Pyo, J. The Detectability of Brain Metastases Using Contrast-Enhanced Spin-Echo or Gradient-Echo Images: A Systematic Review and Meta-Analysis. J. Neurooncol. 2016, 129, 363–371. [Google Scholar] [CrossRef] [PubMed]
- Zakaria, R.; Das, K.; Bhojak, M.; Radon, M.; Walker, C.; Jenkinson, M.D. The Role of Magnetic Resonance Imaging in the Management of Brain Metastases: Diagnosis to Prognosis. Cancer Imaging 2014, 14, 8. [Google Scholar] [CrossRef] [PubMed]
- Cho, J.; Lee, K.; Shin, E.; Choy, G.; Do, S. How Much Data Is Needed to Train a Medical Image Deep Learning System to Achieve Necessary High Accuracy? arXiv 2015, arXiv:1511.06348. [Google Scholar] [CrossRef]
- Fang, Y.; Wang, J.; Ou, X.; Ying, H.; Hu, C.; Zhang, Z.; Hu, W. The Impact of Training Sample Size on Deep Learning-Based Organ Auto-Segmentation for Head-and-Neck Patients. Phys. Med. Biol. 2021, 66, 185012. [Google Scholar] [CrossRef]
- Jena, A.; Taneja, S.; Talwar, V.; Sharma, J.B. Magnetic Resonance (MR) Patterns of Brain Metastasis in Lung Cancer Patients: Correlation of Imaging Findings with Symptom. J. Thorac. Oncol. 2008, 3, 140–144. [Google Scholar] [CrossRef]
- Vuong, D.A.; Rades, D.; Vo, S.Q.; Busse, R. Extracranial Metastatic Patterns on Occurrence of Brain Metastases. J. Neurooncol. 2011, 105, 83–90. [Google Scholar] [CrossRef]
- Balestrino, R.; Rudà, R.; Soffietti, R. Brain Metastasis from Unknown Primary Tumour: Moving from Old Retrospective Studies to Clinical Trials on Targeted Agents. Cancers 2020, 12, 3350. [Google Scholar] [CrossRef]
- Ronneberger, O.; Fischer, P.; Brox, T. U-Net: Convolutional Networks for Biomedical Image Segmentation. In Proceedings of the Medical Image Computing and Computer-Assisted Intervention—MICCAI 2015; Navab, N., Hornegger, J., Wells, W.M., Frangi, A.F., Eds.; Springer International Publishing: Cham, Switzerland, 2015; pp. 234–241. [Google Scholar]
- Kamnitsas, K.; Ledig, C.; Newcombe, V.F.J.; Simpson, J.P.; Kane, A.D.; Menon, D.K.; Rueckert, D.; Glocker, B. Efficient Multi-Scale 3D CNN with Fully Connected CRF for Accurate Brain Lesion Segmentation. Med. Image Anal. 2017, 36, 61–78. [Google Scholar] [CrossRef]
- Nie, D.; Wang, L.; Adeli, E.; Lao, C.; Lin, W.; Shen, D. 3-D Fully Convolutional Networks for Multimodal Isointense Infant Brain Image Segmentation. IEEE Trans. Cybern. 2019, 49, 1123–1136. [Google Scholar] [CrossRef]
- Liu, X.; Faes, L.; Kale, A.U.; Wagner, S.K.; Fu, D.J.; Bruynseels, A.; Mahendiran, T.; Moraes, G.; Shamdas, M.; Kern, C.; et al. A Comparison of Deep Learning Performance against Health-Care Professionals in Detecting Diseases from Medical Imaging: A Systematic Review and Meta-Analysis. Lancet Digit. Health 2019, 1, e271–e297. [Google Scholar] [CrossRef] [PubMed]
- Aggarwal, R.; Sounderajah, V.; Martin, G.; Ting, D.S.W.; Karthikesalingam, A.; King, D.; Ashrafian, H.; Darzi, A. Diagnostic Accuracy of Deep Learning in Medical Imaging: A Systematic Review and Meta-Analysis. NPJ Digit. Med. 2021, 4, 65. [Google Scholar] [CrossRef] [PubMed]
- Bedrikovetski, S.; Dudi-Venkata, N.N.; Kroon, H.M.; Seow, W.; Vather, R.; Carneiro, G.; Moore, J.W.; Sammour, T. Artificial Intelligence for Pre-Operative Lymph Node Staging in Colorectal Cancer: A Systematic Review and Meta-Analysis. BMC Cancer 2021, 21, 1058. [Google Scholar] [CrossRef]
- Decharatanachart, P.; Chaiteerakij, R.; Tiyarattanachai, T.; Treeprasertsuk, S. Application of Artificial Intelligence in Chronic Liver Diseases: A Systematic Review and Meta-Analysis. BMC Gastroenterol. 2021, 21, 10. [Google Scholar] [CrossRef] [PubMed]
- Kim, H.Y.; Cho, S.J.; Sunwoo, L.; Baik, S.H.; Bae, Y.J.; Choi, B.S.; Jung, C.; Kim, J.H. Classification of True Progression after Radiotherapy of Brain Metastasis on MRI Using Artificial Intelligence: A Systematic Review and Meta-Analysis. Neuro-Oncol. Adv. 2021, 3, vdab080. [Google Scholar] [CrossRef]
- Huedo-Medina, T.B.; Sánchez-Meca, J.; Marín-Martínez, F.; Botella, J. Assessing Heterogeneity in Meta-Analysis: Q Statistic or I2 Index? Psychol. Methods 2006, 11, 193–206. [Google Scholar] [CrossRef]


| Study | Title/Abstract Score (n/2) | Introduction Score (n/2) | Methods Score (n/28) | Results Score (n/5) | Discussion Score (n/2) | Other Information Score (n/3) | Total Score (n/42) |
|---|---|---|---|---|---|---|---|
| Amemiya et al.—2022 [25] | 2 | 2 | 21 | 3 | 2 | 1 | 31 |
| Bousabarah et al.—2020 [26] | 2 | 2 | 18 | 2 | 2 | 1 | 27 |
| Charron et al.—2018 [27] | 1 | 2 | 17 | 0 | 2 | 1 | 23 |
| Chartrand et al.—2022 [28] | 2 | 2 | 18 | 1 | 2 | 1 | 26 |
| Cho et al.—2021 [29] | 2 | 2 | 19 | 2 | 2 | 1 | 28 |
| Deike-Hofmann et al.—2021 [30] | 1 | 2 | 17 | 2 | 2 | 1 | 25 |
| Dikici et al.—2022 [31] | 0 | 2 | 17 | 2 | 2 | 1 | 24 |
| Grøvik et al.—2021 [32] | 1 | 2 | 22 | 3 | 2 | 1 | 31 |
| Han et al.—2019 [33] | 0 | 2 | 13 | 1 | 1 | 1 | 18 |
| Hsu et al.—2021 [34] | 0 | 2 | 19 | 2 | 2 | 1 | 26 |
| Huang et al.—2022 [35] | 2 | 2 | 16 | 2 | 2 | 0 | 24 |
| Jünger et al.—2021 [36] | 2 | 2 | 19 | 2 | 2 | 1 | 28 |
| Kikuchi et al.—2022 [37] | 2 | 2 | 14 | 3 | 2 | 1 | 24 |
| Kottlors et al.—2021 [38] | 1 | 2 | 14 | 2 | 2 | 1 | 22 |
| Liang et al.—2022 [14] | 2 | 2 | 19 | 2 | 2 | 1 | 28 |
| Park et al.—2021 [39] | 2 | 2 | 18 | 3 | 2 | 1 | 28 |
| Pennig et al.—2021 [40] | 2 | 2 | 18 | 1 | 2 | 1 | 26 |
| Pflüger et al.—2022 [41] | 2 | 2 | 21 | 3 | 2 | 1 | 31 |
| Rudie et al.—2021 [42] | 2 | 2 | 21 | 2 | 2 | 1 | 30 |
| Xue et al.—2020 [43] | 2 | 2 | 20 | 3 | 2 | 1 | 30 |
| Yin et al.—2022 [44] | 2 | 2 | 20 | 3 | 2 | 1 | 30 |
| Yoo et al.—2022 [45] | 1 | 2 | 18 | 1 | 2 | 1 | 25 |
| Yoo et al.—2021 [46] | 2 | 2 | 17 | 1 | 2 | 0 | 24 |
| Zhang et al.—2020 [47] | 2 | 2 | 19 | 2 | 2 | 1 | 28 |
| Zhou et al.—2020 [48] | 1 | 2 | 19 | 2 | 2 | 1 | 27 |
| Study | Year | Design | No of Patients in the Training Set (M:F) | No of Patients in the Validation Set (M:F) | No of Patients in the Test Set (M:F) | No of Patients in the Other Sets (M:F) | No of Metastatic Lesions (Training/Validation/Test/Other Sets) | Mean or Median—Whole Volume or Longest Diameter of Lesions (Training/Validation/Test/Other Sets) | Reference Standard | Validation Method | Primary Tumor |
|---|---|---|---|---|---|---|---|---|---|---|---|
| Amemiya et al. [25] | 2022 | Single-center | 178 (96:82) | NA | 56 (30:26) | NA | 1249/NA/228/NA | 4.1/NA/10.4/NA mm—mean | Semi-automatic | Split training-test | Multiple |
| Bousabarah et al. [26] | 2020 | Single-center | 469 (244:225) | NA | 40 (26:14) | NA | 524/NA/47/NA | 1.29/NA/1.92/NA cm3—mean | Manual | Split training-test | Multiple |
| Charron et al. [27] | 2018 | Single-center | 164 (NR) | NA | 18 (NR) | NA | 374/NA/38/NA | 8.1 mm (whole sample)—mean | Manual | Split training-test | Multiple |
| Chartrand et al. [28] | 2022 | Single-center | 383 (NR) | 50 (NR) | 97 (NR) 1 | NA | 1460/NR/296/NA 2 | NR/NR/NR/NA | Manual | Split training-test | Multiple |
| Cho et al. [29] | 2021 | Single-center | 127 (61:66) | NA | 20 (12:8) | 47 (25:22) | 1298/NA/412/NR | 6.5/NA/6/NR mm—median | Manual | Split training-test | Multiple |
| Deike-Hofmann et al. [30] | 2021 | Single-center | 43 (35:8) | NA | NA | NA | 494/NA/NA/NA | 4.2/NA/NA/NA mm—median | Manual | Cross-validation | Single/Malignant melanoma |
| Dikici et al. [31] | 2022 | Single-center | 158 (M:F = 0.89) 3 | NA | NA | NA | 932/NA/NA/NA | 5.45/NA/NA/NA mm—mean | Manual | Cross-validation | Multiple |
| Grøvik et al. [32] | 2021 | Multi-center | 100 (29:71) | 10 (NR) 4 | 55 (NR) | NA | NR/NR/NR/NA | NR/NR/NR/NA | Manual | Split training-test | Multiple |
| Han et al. [33] | 2019 | Single-center | 126 (NR) 5 | 18 (NR) | 36 (NR) | NA | NR/NR/NR/NA | NR/NR/NR/NA | Manual | Split training-test | Multiple |
| Hsu et al. [34] | 2021 | Single-center | 409 (NR) | NA | 102 (NR) | NA | 1345/NA/367/NA | NR/NA/NR/NA | Manual | Split training-test | Multiple |
| Huang et al. [35] | 2022 | Single-center | 135 (NR) | 9 (NR) | 32 (NR) | NA | 1503/NR/278/NA | NR/NR/NR/NA | Manual | Split training-test | Multiple |
| Jünger et al. [36] | 2021 | Multi-center 6 | 66 (24:42) | NA | 17 (6:11) | 15 (5:10) | 248/NA/67/0 | 0.99/NA/0.96/NA cm3—mean | Manual | Split training-test | Single/NSCLC |
| Kikuchi et al. [37] | 2022 | Single-center | 50 (30:20) | NA | 34 (16:18) 7 | NA | 165/NA/48/NA | 4/NA/2.9/NA mm—median | Manual | Split training-test | Multiple |
| Kottlors et al. 8 [38] | 2021 | Single-center | 85 (52.3%:47.7%) 9 | NA | NA | NA | 47/NA/NA/NA | NR/NA/NA/NA | Manual | Cross-validation | Multiple |
| Liang et al. [14] | 2022 | Multi-center | 326 (127:150) 10 | NA | 81 (31:50) | NA | 1284/NA/327/NA | 15.9/NA/17.6/NA mm—median | Manual | Split training-test | Multiple |
| Park et al. [39] | 2021 | Single-center | 188 (98:90) | NA | 94 (55:39) 11 | NA | 917/NA/203/NA | 1.6/NA/1.9/NA cm3—mean | Manual | Split training-test | Multiple |
| Pennig et al. [40] | 2021 | Single-center | 55 (?) 12 | NA | 14 (NR) | NA | 103/NA/32/NA | 2.6/NA/1/NA cm3—mean | Manual | Split training-test | Single/Malignant melanoma |
| Pflüger et al. [41] | 2022 | Single-center | 246 (134:112) | NA | 62 (29:33) | 30 (15:15) | 1682/NA/384/155 | 1.23/NA/1.24/1.03 cm3—mean | Manual | Split training-test | Multiple |
| Rudie et al. [42] | 2021 | Single-center | 313 (127:186) | NA | 100 (48:52) | NA | 4494/NA/708/NA | 0.57/NA/0.50/NA cm3—mean | Manual | Split training-test | Multiple |
| Xue et al. [43] | 2020 | Multi-center | 1201 (684:517) | NA | NA | 251 (236:215) | NR/NA/NA/NR | 4.01/NA/NA/NR cm3—mean | Manual | Cross-validation | Multiple |
| Yin et al. 13 [44] | 2022 | Multi-center | 680 (374:306) | NA | 270 (144:2126) | 300 (161:139) | 9630/NA/818/1066 | 5.5/NA/7.5/5.8 mm—mean | Manual | Split training-test | Multiple |
| Yoo et al. [45] | 2022 | Single-center | 53 (29:24) | NA | 12 (6:6) | NA | 545/NA/58/NA | 0.592/NA/0.158/NA cm3—mean | Manual | Split training-test | Multiple |
| Yoo et al. [46] | 2021 | Single-center | 341 (NR) | 36 (NR) | 45 (NR) | NA | NR/NR/NR/NA 14 | NR/NR/NA/4.17 cm3—mean | Manual | Split training-test | Multiple |
| Zhang et al. [47] | 2020 | Single-center | 73 (NR) 15 | NA | 48 (NR) | NA | 1565/NA/488/NA | NR/NA/NR/NA | Manual | Split training-test | Multiple |
| Zhou et al. [48] | 2020 | Single-center | 748 (NR) 16 | NA | 186 (NR) | NA | 3131/NA/766/NA | NR/NA/NR/NA 17 | Manual | Split training-test | Multiple |
| Study | Slice Thickness | Scanning Sequences | Scanner | Tesla |
|---|---|---|---|---|
| Amemiya et al.—2022 [25] | 1 mm | 3D CE T1WI | SIEMENS MAGNETOM Skyra; SIEMENS MAGNETOM Avanto; GE Signa EXCITE HDxt x2; GE Premier; GE Signa EXCITE HDxt; GE Signa EXCITE HD; Toshiba Excelart Vantage; Phillips Ingenia CX | 3T; 1.5T; 3T; 3T; 1.5T; 1.5T; 1.5T; 3T |
| Bousabarah et al.—2020 [26] | NR | 2D/3D CE T1WI, 2D/3D T2WI, 2D/3D FLAIR | Philips Ingenia; Philips Ingenia; Philips Archieva; Philips Intera | 3T; 1.5T; 3T; 1.5T |
| Charron et al.—2018 [27] | 1.02 mm | 3D CE T1WI, 2D FLAIR | NR | 1.5T |
| Chartrand et al.—2022 [28] | 1, 1.50 or 2 mm | 3D CE T1WI | Philips Ingenia Elition; Philips Achieva; Siemens MAGNETOM® Aera; Siemens MAGNETOM® Avanto fit; GE SIGNA™ Explorer; GE Optima™ MR450w GEM; GE Discovery™ MR750; Philips Intera; Siemens MAGNETOM Skyra | 3T; 3T; 1.5T; 1.5T; 1.5T; 1.5T; 3T; 1.5T; 3T |
| Cho et al.—2021 [29] | 1 mm | 3D CE T1WI | Philips Intera; Philips Achieva; Philips Ingenia; SIEMENS Verio | 1.5T; 3T; 3T; 3T |
| Deike-Hofmann et al.—2021 [30] | 4 mm | 2D CE T1WI | SIEMENS MAGNETOM Symphony | 1.5T |
| Dikici et al.—2022 [31] | NR | 3D CE T1WI | NR | NR |
| Grøvik et al.—2021 [32] | 0.90 to 1.60 mm | 3D T1WI, 3D CE T1WI, 3D Black Blood, 3D CE FLAIR | GE TwinSpeed; GE SIGNA Explorer; GE SIGNA Architect; GE Discovery 750 and 750w; SIEMENS Skyra | 1.5T; 1.5T; 3T; 3T; 3T |
| Han et al.—2019 [33] | NR | 2D CE T1WI | NR | NR |
| Hsu et al.—2021 [34] | 1 to 1.98 mm | 3D CE T1WI | GE Discovery MR750w; GE Optima MR450w; GE Signa PET/MR; GE Signa HDxt; GE Signa Architect; GE Signa Artist; GE Signa Excite; Philips Ingenia; SIEMENS Aera | 3T; 1.5T; 3T; 1.5T; 3T; 1.5T; 1.5T; 3T; 1.5T |
| Huang et al.—2022 [35] | 1 mm | 3D CE T1WI | NR | NR |
| Jünger et al.—2021 [36] | 2 to 6 mm | 2D/3D T1WI, 2D/3D CE T1WI, 2D/3D T2WI, 2D/3D FLAIR | Philips Achieva; GE Optima; Philips Ingenia; Philips Intera; Philips Panorama; Siemens Aera; Siemens Amira; Siemens Avanto; Siemens Espree; Siemens Skyra; Siemens Symphony; Siemens Prisma | 1T or 1.5T or 3T |
| Kikuchi et al.—2022 [37] | 2 mm | 3D Black Blood | Philips Achieva; Philips Ingenia | 3T; 3T |
| Kottlors et al.—2021 [38] | 1 mm, 5 mm | 2D CE T1WI; 3D Black Blood | Philips Ingenia | 3T |
| Liang et al.—2022 [14] | 0.43 to 7.22 mm | 2D/3D CE T1WI; 2D/3D FLAIR | NR (The MR images were acquired on 14 types of scanners from 4 major vendors—Siemens, GE, Philips, and Toshiba). | NR |
| Park et al.—2021 [39] | 1 mm | 3D Black Blood, 3D GRE | Philips Achieva; Philips Ingenia; Philips Ingenia CX; Philips Ingenia Elition X | 3T; 3T; 3T; 3T |
| Pennig et al.—2021 [40] | 2.30 to 5.20 mm | 2D T1WI, 2D/3D CE T1WI, 2D T2WI, 2D FLAIR | Philips Achieva; Philips Gyroscan; Philips Ingenia; Philips Intera; Philips Panorama; SIEMENS Avanto; SIEMENS Biograph; GE Optima; GE Genesis Signa | 1T or 1.5T or 3T |
| Pflüger et al.—2022 [41] | 1 to 5 mm | 2D T1WI, 3D CE T1WI, 2D FLAIR | SIEMENS Magnetom Verio; SIEMENS Skyra; SIEMENS Trio TIM; SIEMENS Magnetom Avanto | 3T; 3T; 3T; 1.5T |
| Rudie et al.—2021 [42] | 1.50 mm | 3D T1WI, 3D CE T1WI | GE Signa HDxt; Philips Achieva; GE Discovery MR750 | 1.5T; 1.5T; 3T |
| Xue et al.—2020 [43] | 1.50 mm | 3D CE T1WI | SIEMENS MAGNETOM Skyra | 3T |
| Yin et al.—2022 [44] | 1 mm | 3D CE T1WI | MAGNETOM Aera; Discovery MR750; Discovery MR750W; SIGNA Pioneer; SIGNA Premier; SIGNA Architect; Ingenia CX; MAGNETOM Trio Tim; MAGNETOM Prisma; uMR560; uMR780; uMR790; Optima MR360; MAGNETOM Skyra; MAGNETOM Verio | 1.5T; 3T; 3T; 3T; 3T; 3T; 3T; 3T; 3T; 3T; 3T; 3T; 1.5T; 3T; 3T |
| Yoo et al.—2022 [45] | 1 mm | 3D CE T1WI | NR | NR |
| Yoo et al.—2021 [46] | 0.90 mm | 3D CE T1WI | SIEMENS MAGNETOM Skyra | 3T |
| Zhang et al.—2020 [47] | 0.89 to 3.84 mm | 3D CE T1WI | NR | 1.5T or 3T |
| Zhou et al.—2020 [48] | 1 mm | 3D CE T1WI | GE Signa HDxt; GE Discovery MR750w | 1.5T; 3T |
| Study | Detectability/Test Level | False Positive Rate | DL Algorithm | Data Augmentation |
|---|---|---|---|---|
| Studies with lesion-wise sensitivity reporting | ||||
| Amemiya et al.—2022 [25] | 0.86/lesion-wise | 4.3 per scan | Single-shot detector | Yes |
| Bousabarah et al.—2020 [26] | 0.82/lesion-wise | 0.35 per lesion | Conventional U-Net and modified U-Net | Yes |
| Charron et al.—2018 [27] | 0.98/lesion-wise | 14.2 per patient | DeepMedic | Yes |
| Chartrand et al.—2022 [28] | 0.909/lesion-wise | 0.66 per scan | 3D U-Net | Yes |
| Cho et al.—2021 [29] | 0.58/lesion-wise | 2.5 per scan | 3D U-Net | Yes |
| Han et al.—2019 [33] | 0.83/lesion-wise | 3.59 per slice | You Only Look Once v3 | Yes |
| Hsu et al.—2021 [34] | 0.90/lesion-wise | 3.4 per patient | Modified V-Net 3D | Yes |
| Huang et al.—2022 [35] | 0.975/lesion-wise | 6.97 per patient * | DeepMedic | Yes |
| Jünger et al.—2021 [36] | 0.851/lesion-wise | 1.5 per scan | DeepMedic | Yes |
| Kikuchi et al.—2022 [37] | 0.917/lesion-wise | 1.5 per case | DeepMedic | No |
| Liang et al.—2022 [14] | 0.91/lesion-wise | 1.7 per scan | U-Net | Yes |
| Park et al.—2021 [39] | 0.931/lesion-wise | 0.59 per patient | 3D U-Net | Yes |
| Pennig et al.—2021 [40] | 0.88/lesion-wise | 0.71 per scan | DeepMedic | Yes |
| Pflüger et al.—2022 [41] | 0.81/lesion-wise | 0.87 per scan | nnU-Net | No |
| Rudie et al.—2021 [42] | 0.70/lesion-wise | 0.46 per scan | 3D U-Net | Yes |
| Yin et al.—2022 [43] | 0.958/lesion-wise | 0.39 per scan | FPN | Yes |
| Yoo et al.—2022 [45] | 0.966/lesion-wise | 1.25 per patient | 2D U-Net | Yes |
| Yoo et al.—2021 [46] | 0.91/lesion-wise | 7.67 per patient | 3D U-Net | No |
| Zhang et al.—2020 [47] | 0.956/lesion-wise | 19.9 per scan | Faster R-CNN * | Yes |
| Zhou et al.—2020 [48] | 0.85/lesion-wise | 3 per patient | Single-shot detector | No |
| Studies with patient-wise or voxel-wise sensitivity reporting | ||||
| Deike-Hofmann et al.—2021 [30] | 0.727/patient-wise | 6.6 per case | U-Net | Yes |
| Dikici et al.—2022 [31] | 0.9/patient-wise | 8.44 per patient | CropNet and noisy student | Yes |
| Grovik et al.—2021 [32] | 0.671/voxel-wise | 12.3 per lesion | Input-level dropout model | No |
| Xue et al.—2019 [43] | 0.96/voxel-wise | Not reported | 3D FCN | No |
| Studies not included in the quantitative analysis | ||||
| Kottlors et al.—2021 [38] | NR | NR | CNN | Yes |
Disclaimer/Publisher’s Note: The statements, opinions and data contained in all publications are solely those of the individual author(s) and contributor(s) and not of MDPI and/or the editor(s). MDPI and/or the editor(s) disclaim responsibility for any injury to people or property resulting from any ideas, methods, instructions or products referred to in the content. |
© 2023 by the authors. Licensee MDPI, Basel, Switzerland. This article is an open access article distributed under the terms and conditions of the Creative Commons Attribution (CC BY) license (https://creativecommons.org/licenses/by/4.0/).
Share and Cite
Ozkara, B.B.; Chen, M.M.; Federau, C.; Karabacak, M.; Briere, T.M.; Li, J.; Wintermark, M. Deep Learning for Detecting Brain Metastases on MRI: A Systematic Review and Meta-Analysis. Cancers 2023, 15, 334. https://doi.org/10.3390/cancers15020334
Ozkara BB, Chen MM, Federau C, Karabacak M, Briere TM, Li J, Wintermark M. Deep Learning for Detecting Brain Metastases on MRI: A Systematic Review and Meta-Analysis. Cancers. 2023; 15(2):334. https://doi.org/10.3390/cancers15020334
Chicago/Turabian StyleOzkara, Burak B., Melissa M. Chen, Christian Federau, Mert Karabacak, Tina M. Briere, Jing Li, and Max Wintermark. 2023. "Deep Learning for Detecting Brain Metastases on MRI: A Systematic Review and Meta-Analysis" Cancers 15, no. 2: 334. https://doi.org/10.3390/cancers15020334
APA StyleOzkara, B. B., Chen, M. M., Federau, C., Karabacak, M., Briere, T. M., Li, J., & Wintermark, M. (2023). Deep Learning for Detecting Brain Metastases on MRI: A Systematic Review and Meta-Analysis. Cancers, 15(2), 334. https://doi.org/10.3390/cancers15020334