
Epidemiological Trends of Haematological Malignancies in Belgium 2004–2018: Older Patients Show the Greatest Improvement in Survival


Abstract
:Simple Summary
Abstract
1. Introduction
2. Materials and Methods
3. Results
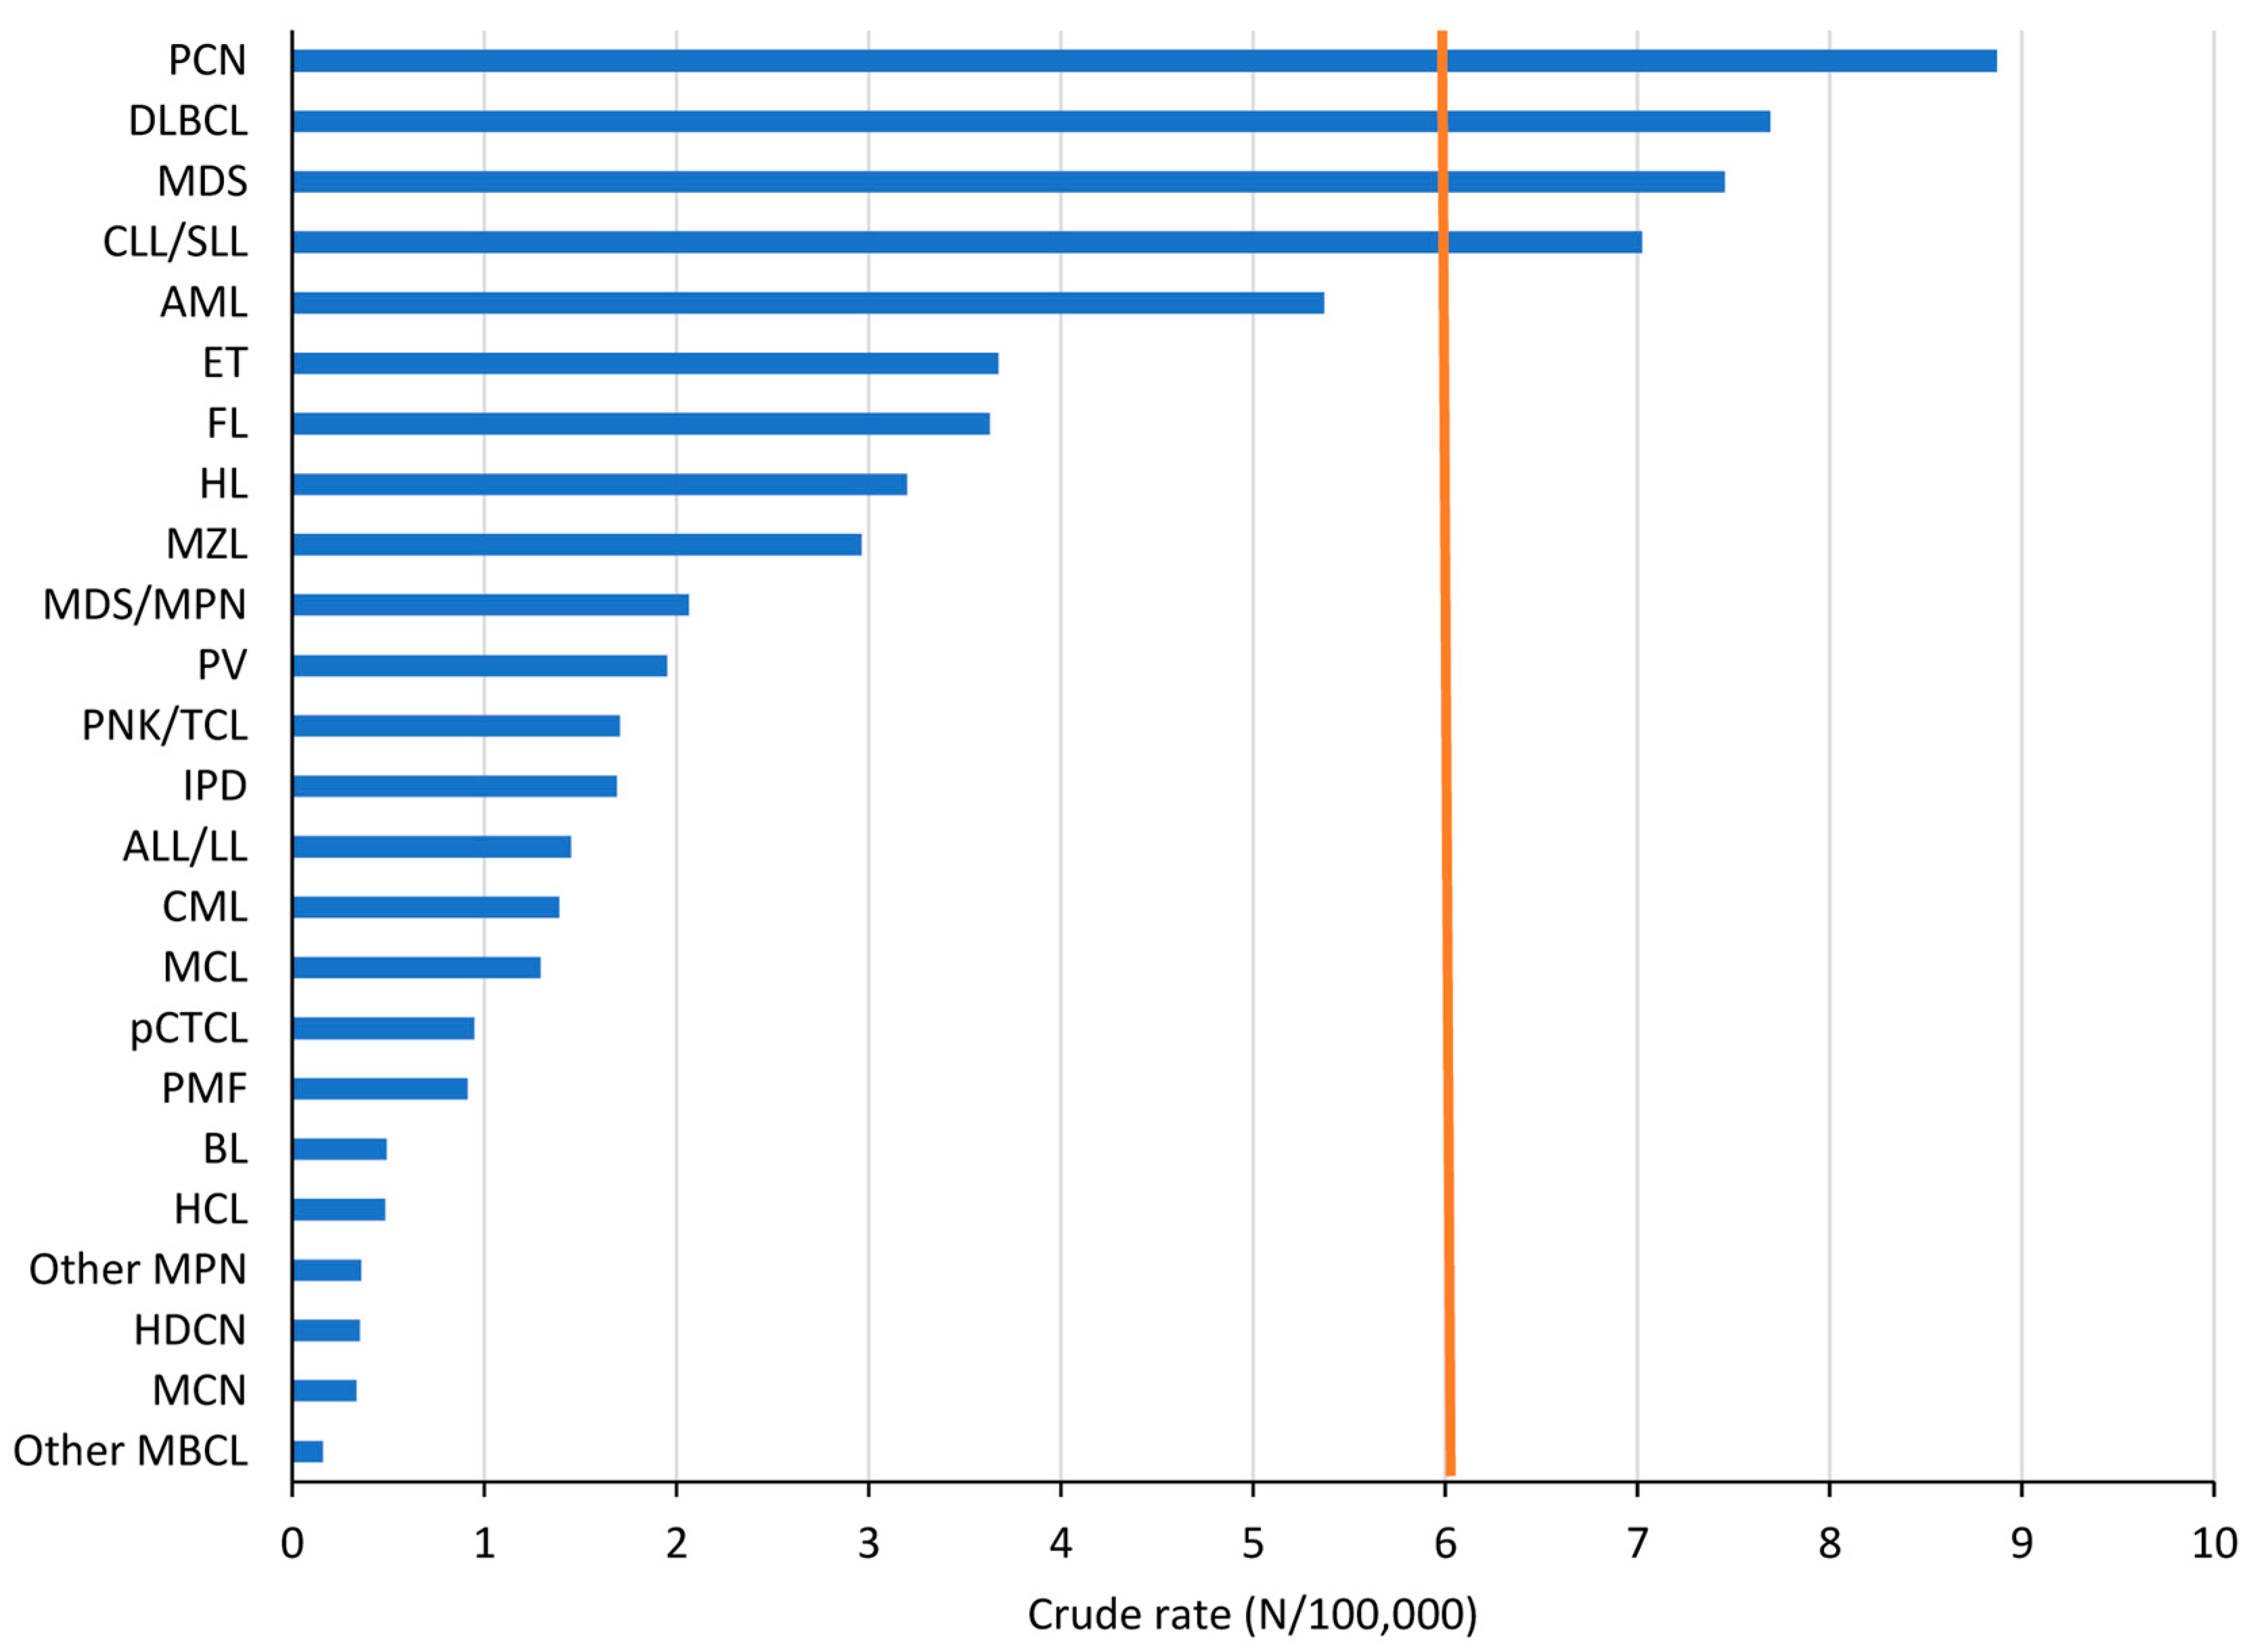
3.1. Incidence
3.2. Incidence Trends
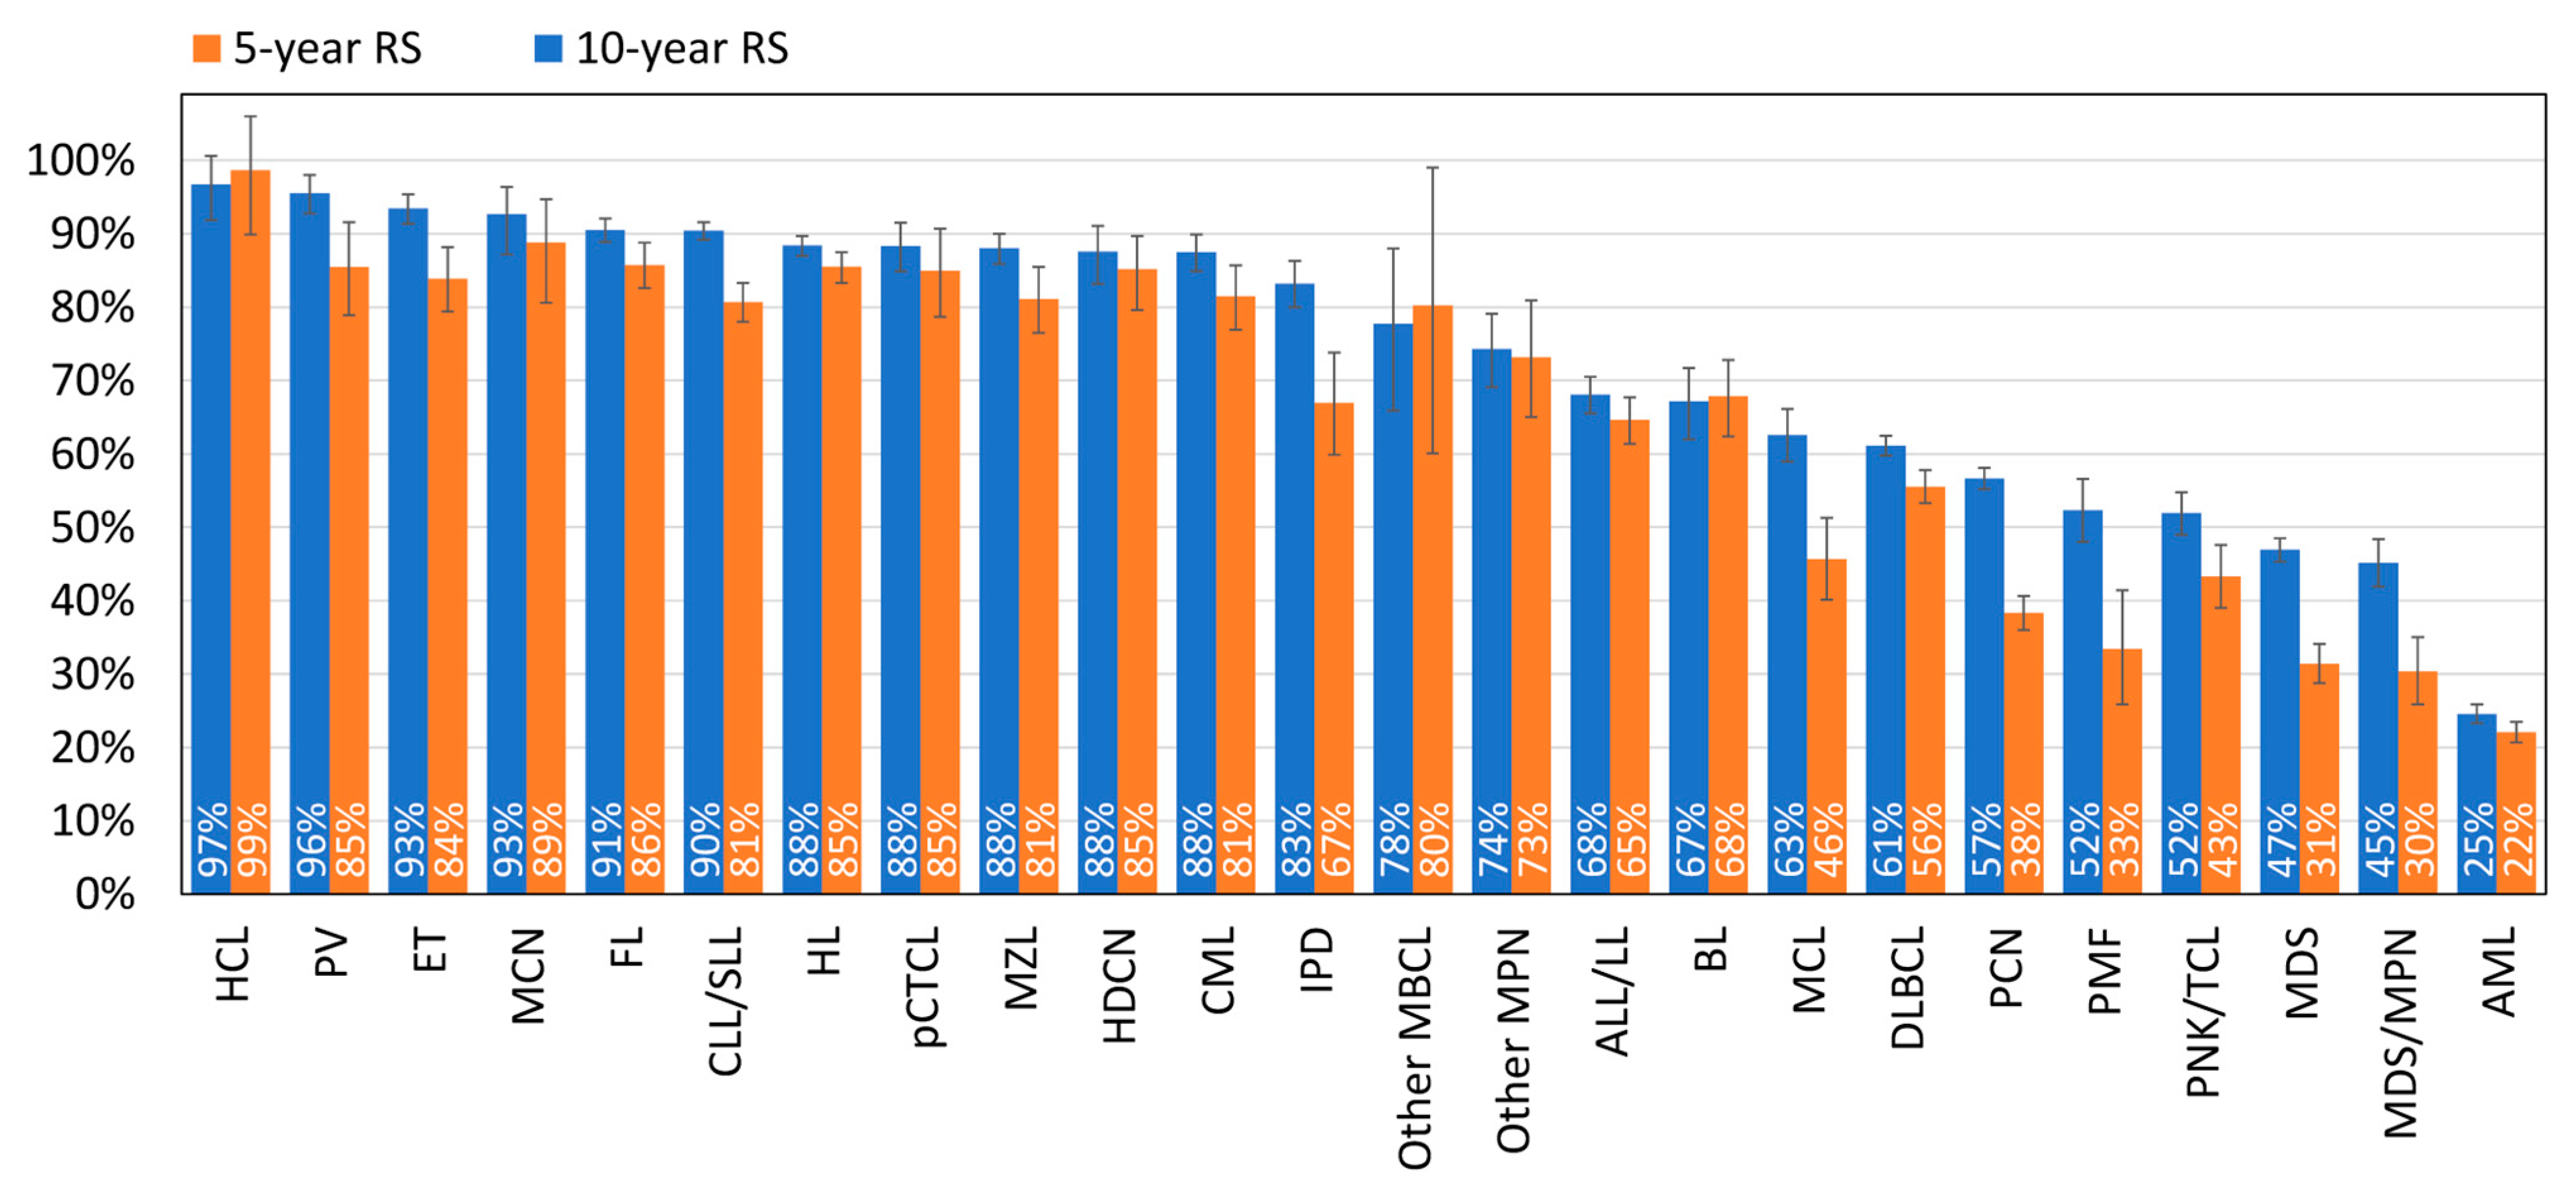
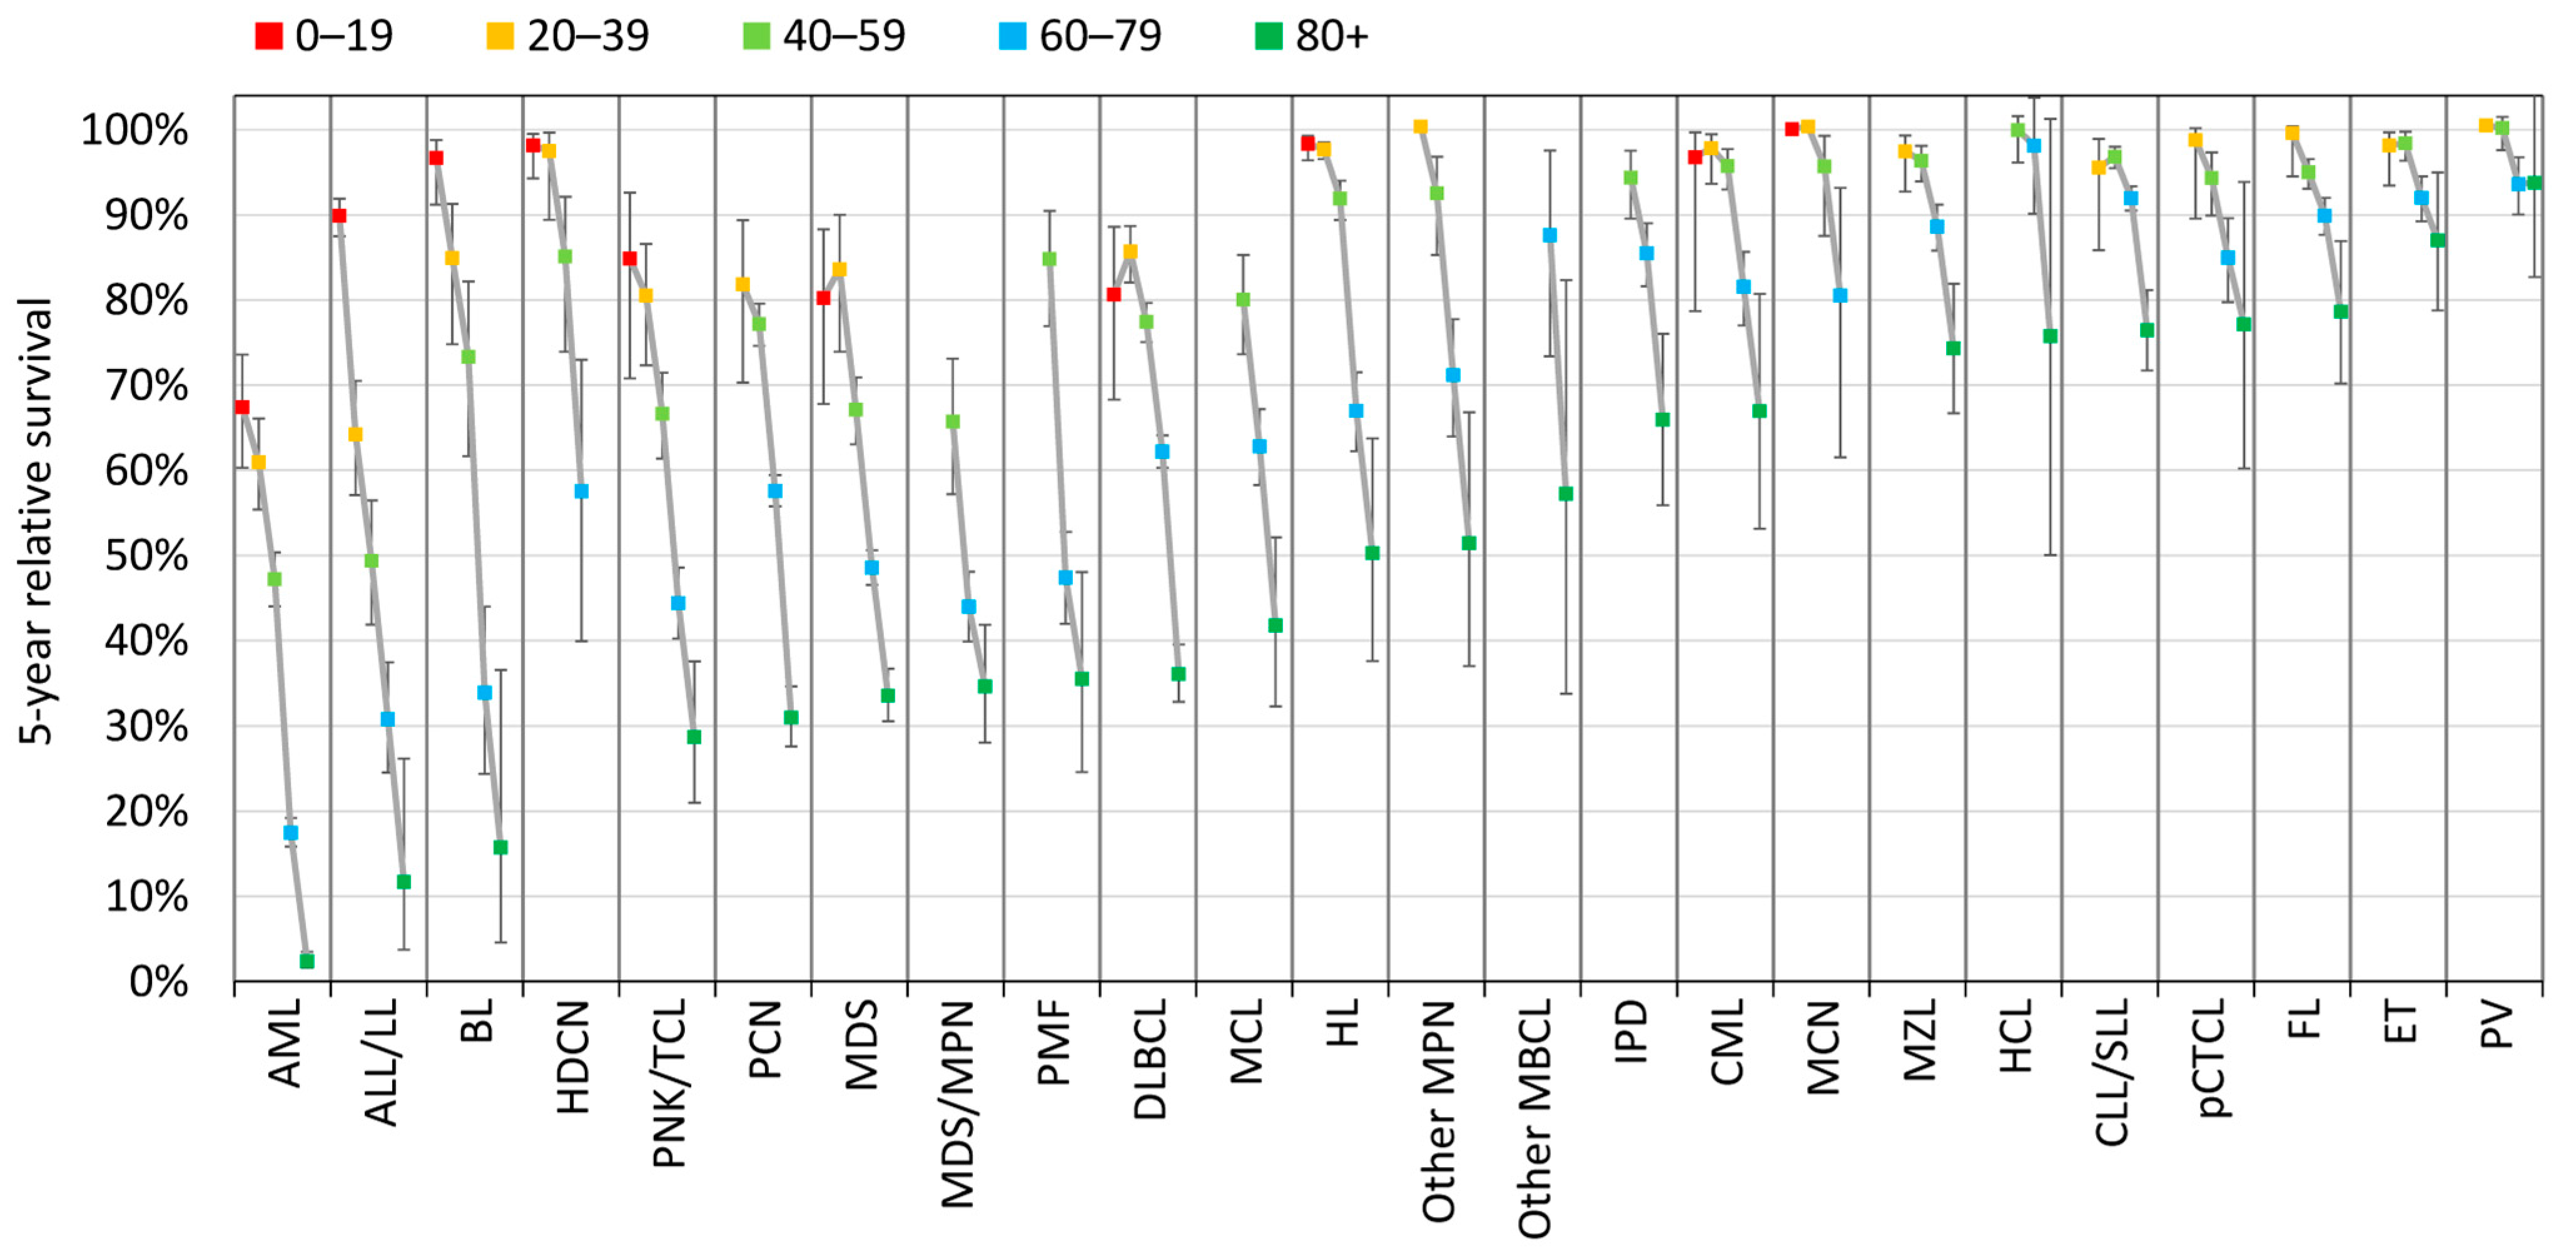
3.3. Survival
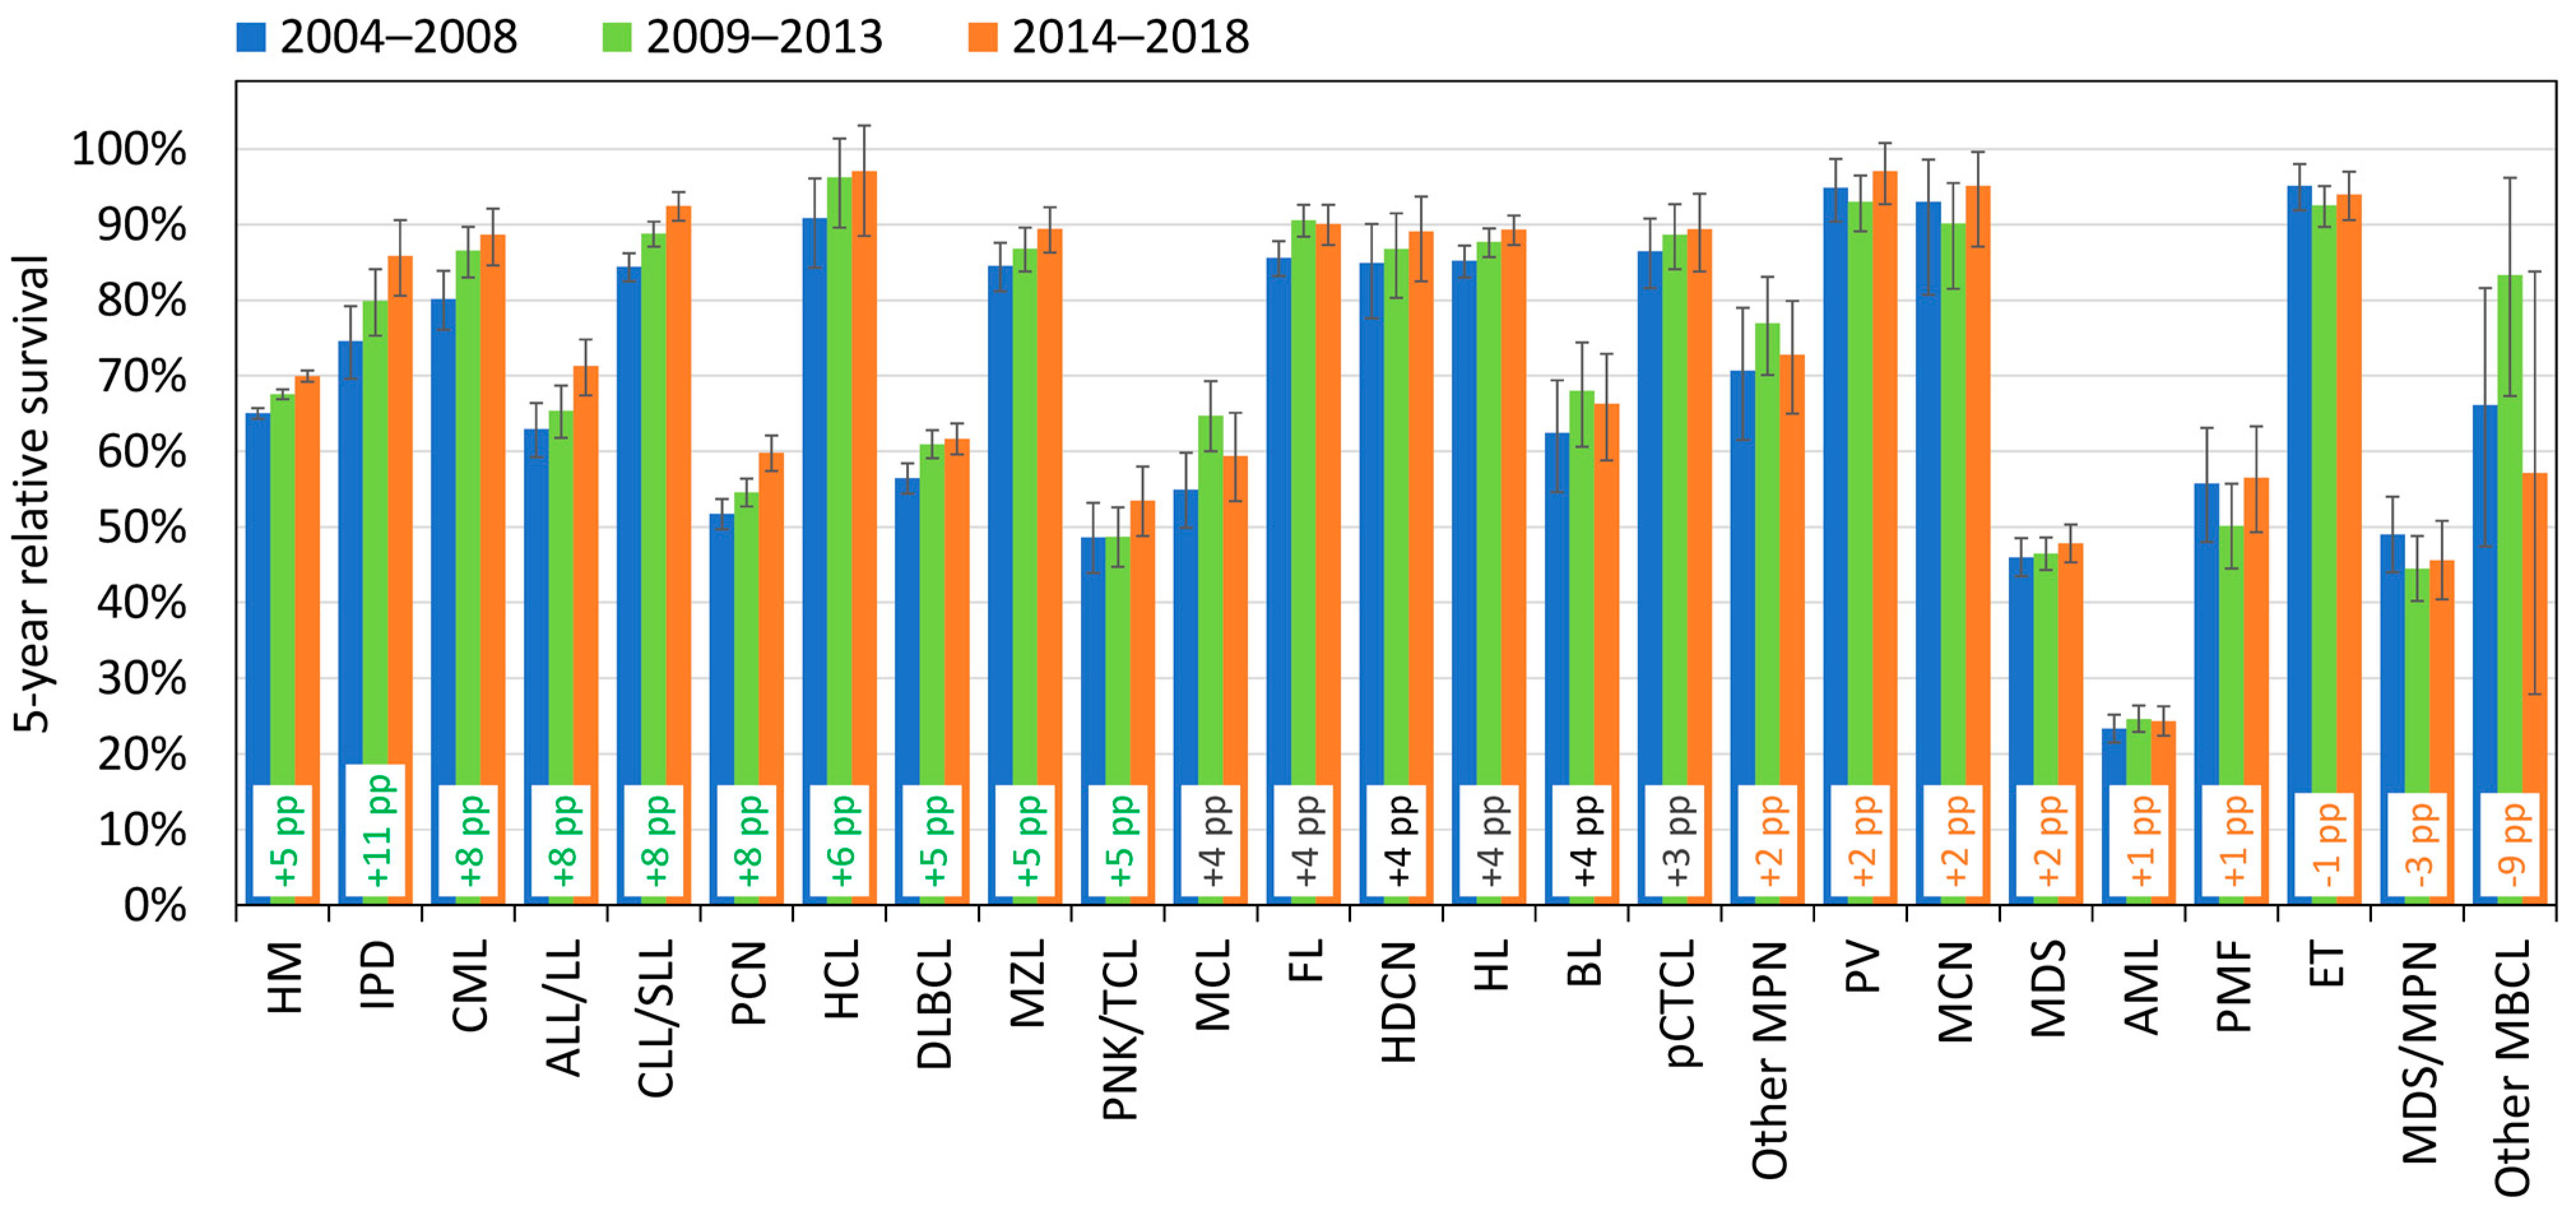
3.4. Survival Trends
4. Discussion
4.1. Incidence
4.2. Incidence Trends
4.3. Survival
4.4. Survival Trends
4.5. Strengths and Limitation of the Study
5. Conclusions
Supplementary Materials
Author Contributions
Funding
Institutional Review Board Statement
Informed Consent Statement
Data Availability Statement
Acknowledgments
Conflicts of Interest
References
- Belgian Cancer Registry. 2023. Available online: https://kankerregister.org/default.aspx?lang=EN (accessed on 1 July 2023).
- Swerdlow, S.H.; Campo, E.; Harris, L.N.; Jaffe, E.S.; Pileri, S.A.; Stein, H.; Thiele, J. WHO Classification of Tumours of Haematopoietic and Lymphoid Tissues, Revised 4th ed.; IARC Press: Lyon, France, 2017. [Google Scholar]
- Gatta, G.; van der Zwan, J.M.; Casali, P.G.; Siesling, S.; Dei Tos, A.P.; Kunkler, I.; Otter, R.; Licitra, L.; Mallone, S.; Tavilla, A.; et al. RARECARE working group. Rare cancers are not so rare: The rare cancer burden in Europe. Eur. J. Cancer 2011, 47, 2493–2511. [Google Scholar] [CrossRef]
- Jaffe, E.S.; Harris, N.L.; Vardiman, J.W.; Stein, H. WHO Classification of Tumours of Haematopoietic and Lymphoid Tissues, 3rd ed.; IARC Press: Lyon, France, 2001. [Google Scholar]
- Swerdlow, S.H.; Campo, E.; Harris, N.L.; Jaffe, E.S.; Pileri, S.A.; Stein, H. WHO Classification of Tumours of Haematopoietic and Lymphoid Tissues, 4th ed.; IARC Press: Lyon, France, 2008. [Google Scholar]
- HAEMACARE Working Group. Manual for coding and reporting haematological malignancies. Tumori 2010, 96, i-A32. [Google Scholar]
- Le Guyader-Peyrou, S.; Defossez, G.; Dantony, E.; Mounier, M.; Cornet, E.; Uhry, Z.; Cowppli-Bony, A.; Maynadié, M.; Troussard, X.; Delafosse, P.; et al. National Estimates of Cancer Incidence and Mortality in Metropolitan France between 1990 and 2018 a Study Based on Francim Network of Cancer Registries Volume 2—Hematological Malignancies; Study from the Cancer Registries of the Francim Network; Francim Network: Saint-Maurice, France, 2019. [Google Scholar]
- Chihara, D.; Ito, H.; Matsuda, T.; Shibata, A.; Katsumi, A.; Nakamura, S.; Tomotaka, S.; Morton, L.M.; Weisenburger, D.D.; Matsuo, K. Differences in incidence and trends of haematological malignancies in Japan and the United States. Br. J. Haematol. 2014, 164, 536–545. [Google Scholar] [CrossRef]
- Sanvisens, A.; Ameijide, A.; Carulla, M.; Marcos-Gragera, R.; en Representación de la Red Española de Registros de Cáncer (REDECAN). Estimates of the incidence of hematological neoplasms in Spain, 2021: Study of the Spanish Network of Cancer Registries (REDECAN). Estimaciones de la incidencia de las neoplasias hematológicas en España, 2021: Estudio de la Red Española de Registros de Cáncer (REDECAN). Med. Clin. 2022, 158, 284–290. [Google Scholar] [CrossRef]
- Villavicencio, A.; Solans, M.; Auñon-Sanz, C.; Roncero, J.M.; Marcos-Gragera, R. Population-based survival of lymphoid neoplasms: Twenty years of epidemiological data in the Girona province, Spain. Cancer Epidemiol. 2020, 69, 101841. [Google Scholar] [CrossRef]
- Smith, A.; Howell, D.; Patmore, R.; Jack, A.; Roman, E. Incidence of haematological malignancy by sub-type: A report from the Haematological Malignancy Research Network. Br. J. Cancer 2011, 105, 1684–1692. [Google Scholar] [CrossRef]
- Henau, K.; Van Eycken, E.; Silversmit, G.; Pukkala, E. Regional variation in incidence for smoking and alcohol related cancers in Belgium. Cancer Epidemiol. 2015, 39, 55–65. [Google Scholar] [CrossRef]
- Tambuyzer, T.; Henau, K.; Calay, F.; Van Gool, B.; Silversmit, G.; Van Eycken, L. Cancer Burden in Belgium 2004–2017; Belgian Cancer Registry: Brussels, Belgium, 2020. [Google Scholar]
- Ferlay, J.; Burkhard, C.; Whelan, S.; Parkin, D. Check and Conversion Programs for Cancer Registries; Technical Report No 42; IARC: Lyon, France, 2005. [Google Scholar]
- Henau, K.; Francart, J.; Silversmit, G.; Vandendael, T.; Pieters, G.; Xicluna, J.; Rosskamp, M.; De Schutter, H.; Slabbaert, M.; Van Damme, N.; et al. Methods and calculations. In Cancer Burden in Belgium 2004–2013; Belgian Cancer Registry: Brussels, Belgium, 2015. [Google Scholar]
- Ederer, F.; Axtell, L.M.; Cutler, S.J. The relative survival rate: A statistical methodology. Natl. Cancer Inst. Monogr. 1961, 6, 101–121. [Google Scholar]
- Noone, A.; Howlader, N.; Krapcho, M.; Miller, D.; Brest, A.; Yu, M.; Ruhl, J.; Tatalovich, Z.; Mariotto, A.; Lewis, D.; et al. SEER Cancer Statistics Review, 1975–2015, National Cancer Institute. Bethesda, MD. Based on November 2017 SEER Data Submission, Posted to the SEER Web Site, April 2018. [Online]. Available online: https://seer.cancer.gov/csr/1975_2015/ (accessed on 1 July 2023).
- Adzersen, K.H.; Friedrich, S.; Becker, N. Are epidemiological data on lymphoma incidence comparable? Results from an application of the coding recommendations of WHO, InterLymph, ENCR and SEER to a cancer registry dataset. J. Cancer Res. Clin. Oncol. 2016, 142, 167–175. [Google Scholar] [CrossRef]
- Levy, G.; Mambet, C.; Pecquet, C.; Bailly, S.; Havelange, V.; Diaconu, C.C.; Constantinescu, S.N. Targets in MPNs and potential therapeutics. Int. Rev. Cell Mol. Biol. 2022, 366, 41–81. [Google Scholar] [CrossRef]
- Hultcrantz, M.; Ravn Landtblom, A.; Andréasson, B.; Samuelsson, J.; Dickman, P.W.; Kristinsson, S.Y.; Björkholm, M.; Andersson, T.M. Incidence of myeloproliferative neoplasms—Trends by subgroup and age in a population-based study in Sweden. J. Intern. Med. 2020, 287, 448–454. [Google Scholar] [CrossRef]
- Verstovsek, S.; Yu, J.; Scherber, R.M.; Verma, S.; Dieyi, C.; Chen, C.C.; Parasuraman, S. Changes in the incidence and overall survival of patients with myeloproliferative neoplasms between 2002 and 2016 in the United States. Leuk. Lymphoma 2022, 63, 694–702. [Google Scholar] [CrossRef]
- Krok-Schoen, J.L.; Fisher, J.L.; Stephens, J.A.; Mims, A.; Ayyappan, S.; Woyach, J.A.; Rosko, A.E. Incidence and survival of hematological cancers among adults ages ≥75 years. Cancer Med. 2018, 7, 3425–3433. [Google Scholar] [CrossRef]
- Pulte, D.; Jansen, L.; Brenner, H. Incidence and survival estimates for patients with myelodysplastic syndrome in the early 21st century: No evidence of improvement over time. Leuk. Lymphoma 2022, 63, 1964–1969. [Google Scholar] [CrossRef]
- Teras, L.R.; DeSantis, C.E.; Cerhan, J.R.; Morton, L.M.; Jemal, A.; Flowers, C.R. 2016 US lymphoid malignancy statistics by World Health Organization subtypes. CA Cancer J. Clin. 2016, 66, 443–459. [Google Scholar] [CrossRef]
- Ocias, L.F.; Larsen, T.S.; Vestergaard, H.; Friis, L.S.; Abildgaard, N.; Frederiksen, H.; Academy of Geriatric Cancer Research (AgeCare). Trends in hematological cancer in the elderly in Denmark, 1980–2012. Acta Oncol. 2016, 55 (Suppl. 1), 98–107. [Google Scholar] [CrossRef]
- Mounier, M.; Romain, G.; Callanan, M.; Alla, A.D.; Boussari, O.; Maynadié, M.; Colonna, M.; Jooste, V. Flexible Modeling of Net Survival and Cure by AML Subtype and Age: A French Population-Based Study from FRANCIM. J. Clin. Med. 2021, 10, 1657. [Google Scholar] [CrossRef]
- Monnereau, A.; Dantony, E.; Mounier, M.; Troussard, X.; Maynadie, M.; Cornet, E.; Orazio, S.; Lafay, L.; Lecoffre, C.; Remontet, L.; et al. Is survival of major lymphoid malignancies subtypes still increasing in the French population? In Proceedings of the ENCR 2021 Meeting Abstract Poster, Virtual Event, 16–18 November 2021. [Google Scholar]
- Mounier, M.; Uhry, Z.; Monnereau, A.; Maynadie, M.; Troussard, X.; Cornet, E.; Orazio, S.; De Brauer, C.; De Maria, F.; Bossard, N.; et al. Survival of myeloid malignancies in France from 1989 to 2018 in general population: What’s new? In Proceedings of the GRELL 2021 Meeting Abstract Poster, Virtual Event, 12–14 May 2021. [Google Scholar]
- Hemminki, K.; Hemminki, J.; Försti, A.; Sud, A. Survival trends in hematological malignancies in the Nordic countries through 50 years. Blood Cancer J. 2022, 12, 150. [Google Scholar] [CrossRef]
- Follows, G.A.; Barrington, S.F.; Bhuller, K.S.; Culligan, D.J.; Cutter, D.J.; Gallop-Evans, E.; Kassam, S.; Osborne, W.; Sadullah, S.; Townsend, W.; et al. British Society for Haematology. Guideline for the first-line management of Classical Hodgkin Lymphoma—A British Society for Haematology guideline. Br. J. Haematol. 2022, 197, 558–572. [Google Scholar] [CrossRef]
- Coiffier, B.; Lepage, E.; Briere, J.; Herbrecht, R.; Tilly, H.; Bouabdallah, R.; Morel, P.; Van Den Neste, E.; Salles, G.; Gaulard, P.; et al. CHOP chemotherapy plus rituximab compared with CHOP alone in elderly patients with diffuse large-B-cell lymphoma. N. Eng. J. Med. 2002, 346, 235–242. [Google Scholar] [CrossRef]
- Chang-Chan, D.Y.; Ríos-Tamayo, R.; Rodríguez Barranco, M.; Redondo-Sánchez, D.; González, Y.; Marcos-Gragera, R.; Sánchez, M.J. Trends of incidence, mortality and survival of multiple myeloma in Spain. A twenty-three-year population-based study. Clin. Transl. Oncol. 2021, 23, 1429–1439. [Google Scholar] [CrossRef]
- Daneels, W.; Rosskamp, M.; Macq, G.; Saadoon, E.I.; De Geyndt, A.; Offner, F.; Poirel, H.A. Real-World Estimation of First- and Second-Line Treatments for Diffuse Large B-Cell Lymphoma Using Health Insurance Data: A Belgian Population-Based Study. Front. Oncol. 2022, 12, 824704. [Google Scholar] [CrossRef]
- Smith, A.; Crouch, S.; Lax, S.; Li, J.; Painter, D.; Howell, D.; Patmore, R.; Jack, A.; Roman, E. Lymphoma incidence, survival and prevalence 2004-2014: Sub-type analyses from the UK’s Haematological Malignancy Research Network. Br. J. Cancer 2015, 112, 1575–1584. [Google Scholar] [CrossRef]
- Guevara, M.; Molinuevo, A.; Salmerón, D.; Marcos-Gragera, R.; Carulla, M.; Chirlaque, M.D.; Rodríguez Camblor, M.; Alemán, A.; Rojas, D.; Vizcaíno Batllés, A.; et al. Cancer Survival in Adults in Spain: A Population-Based Study of the Spanish Network of Cancer Registries (REDECAN). Cancers 2022, 14, 2441. [Google Scholar] [CrossRef]
- Hamaker, M.E.; Prins, M.C.; Stauder, R. The relevance of a geriatric assessment for elderly patients with a haematological malignancy—A systematic review. Leuk. Res. 2014, 38, 275–283. [Google Scholar] [CrossRef]


| Haematological Malignancies (HMs) | N | CR | ESR 1976 | ESR- 2013 | WSR | WSR-Males | WSR-Females | M/F Ratio | Median Age |
|---|---|---|---|---|---|---|---|---|---|
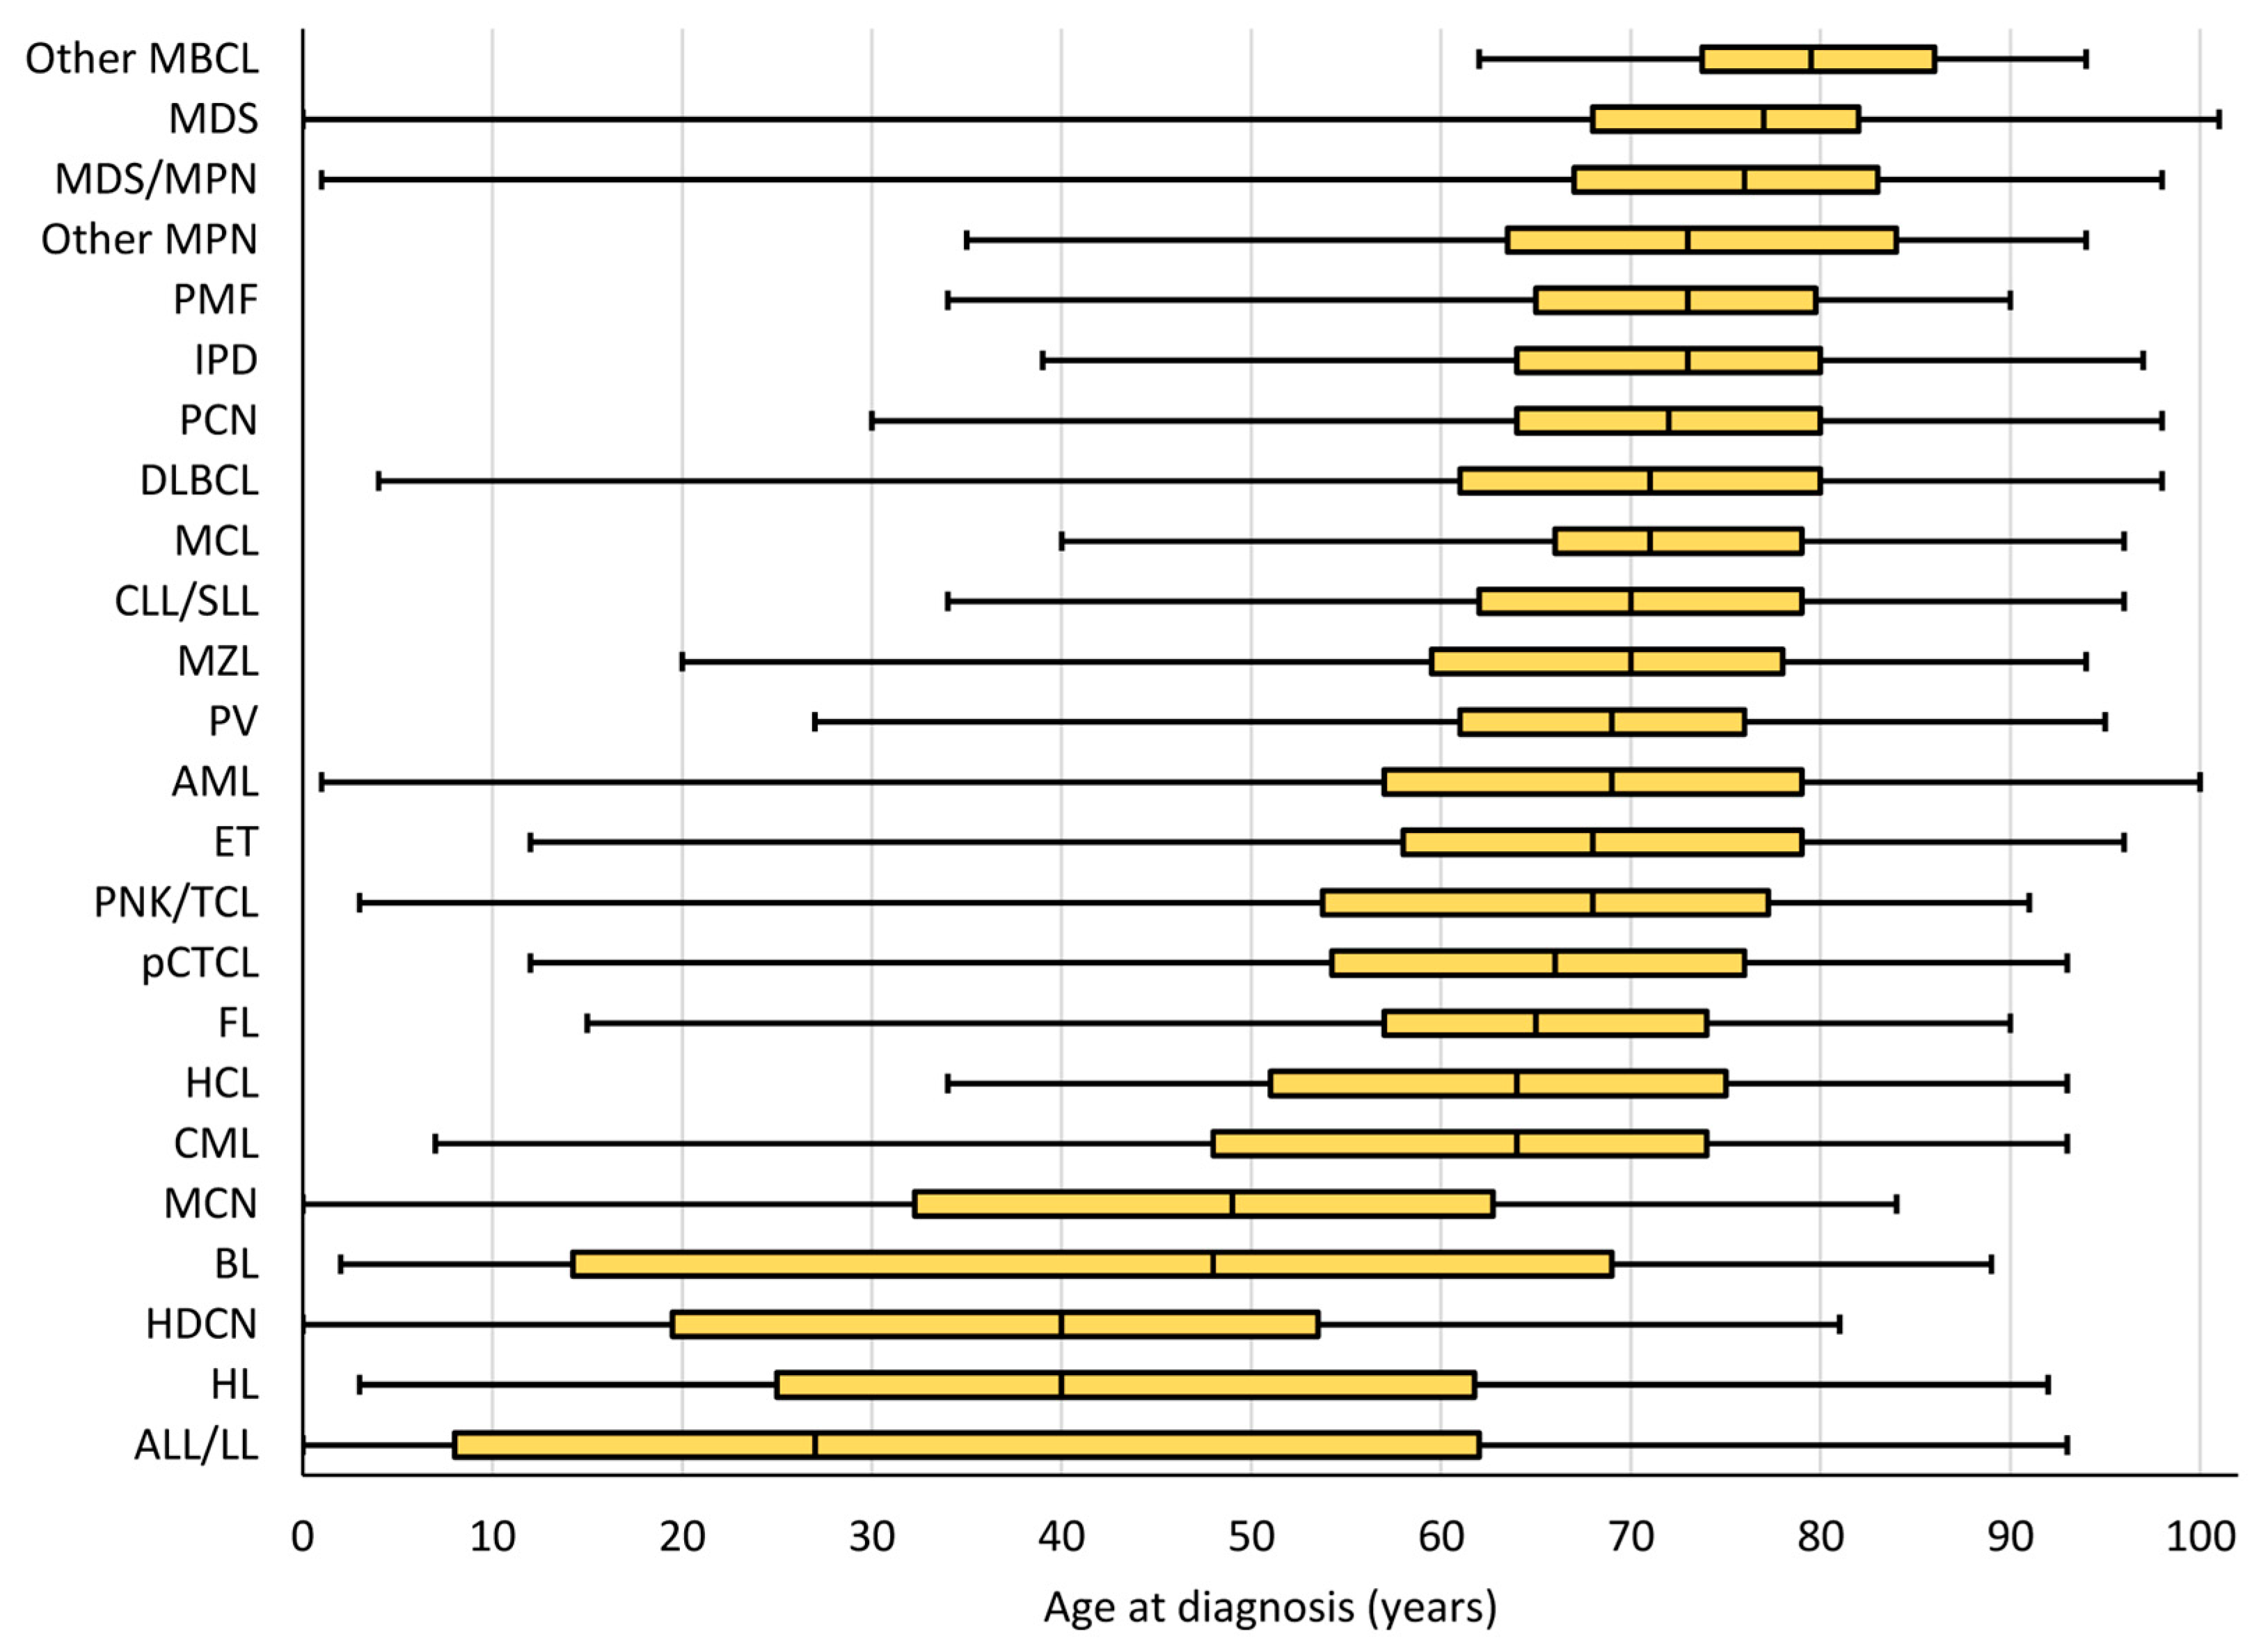
| All HMs | 7562 | 66.5 | 46.8 | 67.7 | 34.3 | 39.9 | 29.4 | 1.4 | 70 |
| Hodgkin Lymphoma (HL) | 364 | 3.2 | 3.1 | 3.2 | 3.0 | 3.4 | 2.6 | 1.3 | 40 |
| B-cell chronic lymphocytic leukaemia/small lymphocytic lymphoma (CLL/SLL) | 799 | 7.0 | 4.8 | 7.1 | 3.3 | 4.1 | 2.5 | 1.6 | 70 |
| Hairy cell leukaemia (HCL) | 55 | 0.5 | 0.4 | 0.5 | 0.3 | 0.5 | 0.1 | 8.1 | 64 |
| Other Mature B-cell leukaemia and related lymphoma (Other MBCL) | 18 | 0.2 | 0.1 | 0.2 | 0.0 | 0.1 | 0.0 | 3.0 | 79.5 |
| Immunoproliferative disease (IPD) | 192 | 1.7 | 1.1 | 1.7 | 0.7 | 1.0 | 0.5 | 2.1 | 73 |
| Plasma cell neoplasm (PCN) | 1009 | 8.9 | 5.8 | 9.1 | 3.8 | 4.7 | 3.1 | 1.5 | 72 |
| Marginal zone lymphoma (MZL) | 337 | 3.0 | 2.1 | 3.0 | 1.4 | 1.6 | 1.3 | 1.2 | 70 |
| Follicular lymphoma and related lymphoma (FL) | 413 | 3.6 | 2.7 | 3.7 | 1.9 | 2.0 | 1.8 | 1.1 | 65 |
| Mantle cell lymphoma (MCL) | 147 | 1.3 | 0.8 | 1.3 | 0.6 | 0.9 | 0.2 | 4.2 | 71 |
| Diffuse large B-cell lymphoma and related large B-cell lymphoma (DLBCL) | 875 | 7.7 | 5.2 | 7.8 | 3.7 | 4.2 | 3.3 | 1.3 | 71 |
| Burkitt lymphoma/leukaemia (BL) | 56 | 0.5 | 0.5 | 0.5 | 0.5 | 0.6 | 0.4 | 1.8 | 48 |
| Primary cutaneous T-cell lymphoma (pCTCL) | 108 | 0.9 | 0.7 | 1.0 | 0.6 | 0.8 | 0.3 | 2.5 | 66 |
| Peripheral NK/T-cell lymphoma (PNK/TCL) | 194 | 1.7 | 1.3 | 1.8 | 1.0 | 1.0 | 0.9 | 1.1 | 68 |
| Precursor lymphoid neoplasm or acute lymphoblastic leukaemia/lymphoma(ALL/LL) | 165 | 1.5 | 1.5 | 1.4 | 1.8 | 1.8 | 1.7 | 1.0 | 27 |
| Acute myeloid leukaemia and related precursor neoplasm(AML) | 611 | 5.4 | 3.8 | 5.4 | 2.8 | 3.0 | 2.7 | 1.1 | 69 |
| Chronic myeloid leukaemia (CML) | 158 | 1.4 | 1.1 | 1.4 | 0.9 | 0.9 | 0.8 | 1.2 | 64 |
| Polycythaemia vera (PV) | 222 | 2.0 | 1.4 | 2.0 | 1.0 | 1.2 | 0.8 | 1.5 | 69 |
| Essential thrombocythaemia (ET) | 418 | 3.7 | 2.6 | 3.7 | 1.9 | 1.6 | 2.1 | 0.7 | 68 |
| Primary myelofibrosis (PMF) | 104 | 0.9 | 0.6 | 0.9 | 0.4 | 0.5 | 0.3 | 2.0 | 73 |
| Other MPN and related neoplasm (Other MPN) | 41 | 0.4 | 0.2 | 0.4 | 0.2 | 0.2 | 0.1 | 2.0 | 73 |
| Mast cell neoplasm (MCN) | 38 | 0.3 | 0.3 | 0.3 | 0.3 | 0.2 | 0.3 | 0.6 | 49 |
| Myelodysplastic syndrome (MDS) | 848 | 7.5 | 4.4 | 7.6 | 2.8 | 3.5 | 2.3 | 1.5 | 77 |
| Myelodysplastic/myeloproliferative neoplasm (MDS/MPN) | 235 | 2.1 | 1.2 | 2.1 | 0.8 | 1.0 | 0.7 | 1.5 | 76 |
| Histiocytic and dendritic cell neoplasm (HDCN) | 40 | 0.4 | 0.4 | 0.4 | 0.4 | 0.6 | 0.2 | 3.6 | 40 |
| Belgium 2004–2018 | Males | Females | Males and Females | |||
|---|---|---|---|---|---|---|
| Trend by age group (years) | AAPC (%) | 95%CI | AAPC (%) | 95%CI | AAPC (%) | 95%CI |
| 0–14 | −0.1 | [−1.7; 1.5] | 0.4 | [−1.3; 2.2] | 0.1 | [−1.2, 1.4] |
| 15–29 | 1.0 | [0.2; 1.9] | 1.2 | [−0.1; 2.5] | 1.1 | [0.3, 1.9] |
| 30–44 | 1.1 | [0.5; 1.7] | 0.5 | [−0.6; 1.6] | 0.8 | [0.3, 1.4] |
| 45–59 | 0.6 | [−0.3; 1.6] | 1.1 | [0.4; 1.7] | 0.8 | [0.1, 1.5] |
| 60–69 | 1.3 | [0.9; 1.8] | 1.4 | [1.0; 1.8] | 1.4 | [1.1, 1.7] |
| 70–79 | 2.5 | [2.1; 3.0] | 3.0 | [2.5; 3.6] | 2.9 | [2.4, 3.3] |
| 80+ | 3.0 | [2.2; 3.9] | 3.1 | [2.1; 4.0] | 3.2 | [2.4, 4.0] |
| Trend by subtype | AAPC (%) | 95%CI | AAPC (%) | 95%CI | AAPC (%) | 95%CI |
| HL | 1.2 | [0.2; 2.3] | 1.3 | [0.4; 2.1] | 1.2 | [0.7; 1.8] |
| CLL/SLL | 0.0 | [−0.5; 0.4] | 0.1 | [−1.0; 1.2] | 0.0 | [−0.6; 0.6] |
| HCL | 0.8 | [−0.7; 2.4] | −1.6 | [−6.0; 3.0] | −0.1 | [−1.3; 1.0] |
| IPD | 1.3 | [0.0; 2.6] | 1.9 | [−0.1; 3.9] | 1.2 | [0.3; 2.1] |
| PCN | 1.4 | [0.8; 2.0] | 1.0 | [0.1; 2.0] | 1.2 | [0.6; 1.8] |
| MZL | 3.1 | [1.5; 4.7] | 2.9 | [1.5; 4.3] | 2.1 | [1.1; 3.2] |
| FL | 0.0 | [−0.6; 0.5] | 0.2 | [−0.9; 1.3] | 0.1 | [−0.6; 0.7] |
| MCL | 0.3 | [−0.8; 1.5] | −0.7 | [−2.4; 1.0] | 0.0 | [−0.8; 0.9] |
| DLBCL | 0.4 | [−0.2; 1.0] | 0.5 | [0.0; 1.1] | 0.5 | [0.1; 0.9] |
| BL | 1.6 | [−1.3; 4.5] | 1.2 | [−4.8; 7.5] | 1.4 | [−0.9; 3.7] |
| pCTCL | 0.8 | [−0.5; 2.2] | −1.1 | [−3.6; 1.4] | 0.3 | [−1.0; 1.6] |
| PNK/TCL | 2.3 | [0.7; 3.9] | 3.9 | [1.6; 6.2] | 2.9 | [1.5; 4.4] |
| ALL/LL | −0.1 | [−2.1; 2.0] | −0.1 | [−1.9; 1.7] | 0.0 | [−1.6; 1.5] |
| AML | 1.1 | [−0.1; 2.2] | 1.4 | [0.4; 2.6] | 1.3 | [0.4; 2.2] |
| CML | 1.5 | [0.0; 3.1] | 1.5 | [−0.9; 3.9] | 1.5 | [0.4; 2.6] |
| PV | 6.3 | [3.8; 8.9] | 7.0 | [5.9; 8.1] | 6.0 | [4.8; 7.2] |
| ET | 4.8 | [3.8; 5.7] | 7.0 | [5.6; 8.3] | 6.0 | [5.2; 6.7] |
| PMF | 6.8 | [4.9; 8.7] | 4.8 | [1.7; 8.0] | 5.8 | [4.5; 7.2] |
| Other MPN | 1.2 | [−4.2; 7.0] | −1.2 | [−5.7; 3.6] | −0.8 | [−5.4; 4.0] |
| MCN | 9.7 | [2.1; 17.9] | 13.4 | [9.2; 17.7] | 11.2 | [6.4; 16.3] |
| MDS | 2.3 | [1.2; 3.5] | 3.8 | [2.6; 5.0] | 3.3 | [2.4; 4.2] |
| MDS/MPN | 3.4 | [2.0; 4.8] | 2.4 | [0.5; 4.3] | 3.0 | [1.9; 4.2] |
| HDCN | 2.7 | [−0.7; 6.2] | −0.4 | [−5.6; 5.0] | 1.5 | [−1.5; 4.7] |
| All Ages | 0–14 | 15–19 | 20–39 | 40–59 | 60–79 | 80+ | |||||||||||||||
|---|---|---|---|---|---|---|---|---|---|---|---|---|---|---|---|---|---|---|---|---|---|
| HM Subtype | 04–08 | 14–18 | Δ pp | 04–08 | 14–18 | Δ pp | 04–08 | 14–18 | Δ pp | 04–08 | 14–18 | Δ pp | 04–08 | 14–18 | Δ pp | 04–08 | 14–18 | Δ pp | 04–08 | 14–18 | Δ pp |
| IPD | 75% | 86% | +11 | - | - | - | - | - | - | - | - | - | 88% | 99% | +11 | 79% | 87% | +9 | 39% | 72% | +33 |
| CML | 80% | 89% | +8 | - | - | - | - | - | - | 96% | 99% | +3 | 93% | 97% | +4 | 73% | 84% | +11 | 46% | 62% | +16 |
| ALL/LL | 63% | 71% | +8 | 89% | 93% | +4 | 69% | 88% | +20 | 57% | 74% | +17 | 44% | 52% | +7 | 15% | 37% | +22 | - | - | - |
| CLL/SLL | 84% | 92% | +8 | - | - | - | - | - | - | 93% | 95% | +1 | 93% | 97% | +4 | 84% | 94% | +10 | 69% | 81% | +12 |
| PCN | 52% | 60% | +8 | - | - | - | - | - | - | - | - | - | 71% | 82% | +11 | 50% | 61% | +11 | 27% | 33% | +6 |
| HCL | 91% | 97% | +6 | - | - | - | - | - | - | - | - | - | 102% | 99% | −2 | 86% | 105% | +18 | - | - | - |
| DLBCL | 56% | 62% | +5 | - | - | - | - | - | - | 83% | 88% | +5 | 71% | 78% | +6 | 54% | 64% | +9 | 30% | 36% | +6 |
| MZL | 85% | 89% | +5 | - | - | - | - | - | - | 96% | 99% | +3 | 95% | 98% | +3 | 83% | 92% | +9 | 62% | 70% | +8 |
| PNK/TCL | 49% | 53% | +5 | - | - | - | - | - | - | 69% | 83% | +14 | 55% | 71% | +16 | 39% | 48% | +9 | 27% | 26% | −1 |
| MCL | 55% | 59% | +4 | - | - | - | - | - | - | - | - | - | 74% | 81% | +6 | 52% | 59% | +7 | 28% | 40% | +11 |
| FL | 86% | 90% | +4 | - | - | - | - | - | - | 97% | 99% | +2 | 93% | 95% | +1 | 86% | 90% | +4 | 49% | 76% | +28 |
| HDCN | 85% | 89% | +4 | 96% | 100% | +4 | - | - | - | - | - | - | - | - | - | - | - | - | - | - | - |
| HL | 85% | 89% | +4 | 99% | 100% | +1 | 96% | 96% | +0 | 96% | 98% | +2 | 88% | 93% | +5 | 60% | 70% | +10 | 21% | 66% | +45 |
| BL | 62% | 66% | +4 | 94% | 100% | +6 | - | - | - | 59% | 80% | +21 | - | - | - | 31% | 41% | +9 | - | - | - |
| pCTCL | 86% | 89% | +3 | - | - | - | - | - | - | 96% | 100% | +5 | 92% | 94% | +3 | 82% | 90% | +9 | 84% | 59% | −25 |
| Other MPN | 71% | 73% | +2 | - | - | - | - | - | - | - | - | - | 92% | 91% | −1 | 67% | 76% | +8 | 48% | 42% | −6 |
| PV | 95% | 97% | +2 | - | - | - | - | - | - | - | - | - | 100% | 100% | +0 | 94% | 95% | +1 | 86% | 101% | +15 |
| MCN | 93% | 95% | +2 | - | - | - | - | - | - | - | - | - | - | - | - | - | - | - | - | - | - |
| MDS | 46% | 48% | +2 | - | - | - | - | - | - | 76% | 88% | +13 | 56% | 70% | +14 | 47% | 50% | +3 | 34% | 36% | +1 |
| AML | 23% | 24% | +1 | 53% | 70% | +17 | - | - | - | 53% | 59% | +7 | 44% | 47% | +3 | 14% | 19% | +5 | 1% | 2% | +1 |
| PMF | 56% | 56% | +1 | - | - | - | - | - | - | - | - | - | 80% | 86% | +7 | 51% | 51% | +0 | 33% | 46% | +13 |
| ET | 95% | 94% | −1 | - | - | - | - | - | - | 99% | 99% | +0 | 97% | 100% | +3 | 95% | 94% | −1 | 91% | 83% | −8 |
| MDS/ MPN | 49% | 46% | −3 | - | - | - | - | - | - | - | - | - | 69% | 64% | −5 | 48% | 44% | −4 | 29% | 38% | +9 |
| Other MBCL | 66% | 57% | −9 | - | - | - | - | - | - | - | - | - | - | - | - | - | - | - | - | - | - |
| HM | 65% | 70% | +5 | 89% | 92% | +3 | 86% | 90% | +4 | 85% | 91% | +6 | 79% | 85% | +6 | 61% | 69% | +8 | 39% | 47% | +8 |
| Δ pp: Percentage point difference | Colour scale: | Δ pp 5–9 | Δ pp 10–14 | Δ pp 10–14 | Δ pp 10–14 | ||||||||||||||||
Disclaimer/Publisher’s Note: The statements, opinions and data contained in all publications are solely those of the individual author(s) and contributor(s) and not of MDPI and/or the editor(s). MDPI and/or the editor(s) disclaim responsibility for any injury to people or property resulting from any ideas, methods, instructions or products referred to in the content. |
© 2023 by the authors. Licensee MDPI, Basel, Switzerland. This article is an open access article distributed under the terms and conditions of the Creative Commons Attribution (CC BY) license (https://creativecommons.org/licenses/by/4.0/).
Share and Cite
Henau, K.; Tambuyzer, T.; Van Gool, B.; Van Eycken, L.; Poirel, H.A. Epidemiological Trends of Haematological Malignancies in Belgium 2004–2018: Older Patients Show the Greatest Improvement in Survival. Cancers 2023, 15, 4388. https://doi.org/10.3390/cancers15174388
Henau K, Tambuyzer T, Van Gool B, Van Eycken L, Poirel HA. Epidemiological Trends of Haematological Malignancies in Belgium 2004–2018: Older Patients Show the Greatest Improvement in Survival. Cancers. 2023; 15(17):4388. https://doi.org/10.3390/cancers15174388
Chicago/Turabian StyleHenau, Kris, Tim Tambuyzer, Bart Van Gool, Liesbet Van Eycken, and Hélène A. Poirel. 2023. "Epidemiological Trends of Haematological Malignancies in Belgium 2004–2018: Older Patients Show the Greatest Improvement in Survival" Cancers 15, no. 17: 4388. https://doi.org/10.3390/cancers15174388
APA StyleHenau, K., Tambuyzer, T., Van Gool, B., Van Eycken, L., & Poirel, H. A. (2023). Epidemiological Trends of Haematological Malignancies in Belgium 2004–2018: Older Patients Show the Greatest Improvement in Survival. Cancers, 15(17), 4388. https://doi.org/10.3390/cancers15174388