Article

Single Nucleotide Polymorphisms in the Vitamin D Metabolic Pathway as Survival Biomarkers in Colorectal Cancer

by
Carmen Pérez-Durán
1,
Noelia Márquez-Pete
2,3,*,
José María Gálvez-Navas
3,4,5,6,*,
Yasmin Cura
2,3,
Susana Rojo-Tolosa
2,6,7,
Laura Elena Pineda-Lancheros
2,3,
MCarmen Ramírez-Tortosa
6,
Carlos García-Collado
2,3,
María del Mar Maldonado-Montoro
2,
Jesús María Villar-del-Moral
1,
Cristina Pérez-Ramírez
3,6,† and
Alberto Jiménez-Morales
2,3,†
1
General Surgery and Digestive System Service, University Hospital Virgen de las Nieves, Avda. de las Fuerzas Armadas 2, 18004 Granada, Spain
2
Pharmacogenetics Unit, Pharmacy Service, University Hospital Virgen de las Nieves, Avda. de las Fuerzas Armadas 2, 18004 Granada, Spain
3
Biosanitary Research Institute ibs.GRANADA, Avda. de Madrid 15, 18012 Granada, Spain
4
Centro de Investigación Biomédica en Red en Epidemiología y Salud Pública (CIBERESP), 28029 Madrid, Spain
5
Cancer Registry of Granada, Andalusian School of Public Health, Cuesta del Observatorio 4, 18011 Granada, Spain
6
Department of Biochemistry and Molecular Biology II, Faculty of Pharmacy, Campus Universitario de Cartuja, University of Granada, 18011 Granada, Spain
7
Pneumology Service, University Hospital Virgen de las Nieves, Avda. de las Fuerzas Armadas 2, 18004 Granada, Spain
*
Authors to whom correspondence should be addressed.
These authors contributed equally to this work.
Cancers 2023, 15(16), 4077; https://doi.org/10.3390/cancers15164077
Submission received: 25 June 2023 / Revised: 29 July 2023 / Accepted: 10 August 2023 / Published: 12 August 2023
(This article belongs to the Section Cancer Biomarkers)

Abstract

:

Simple Summary

Colorectal cancer is one of the leading neoplasms in mortality worldwide. Recent studies suggest that vitamin D might influence the development of colorectal cancer and its prognosis. Furthermore, vitamin D activity might be influenced by the presence of single nucleotide polymorphisms in the genes involved in its metabolism. Thus, the aim of this study was to evaluate the influence of 13 SNPs in the vitamin D metabolic pathway on colorectal cancer survival. The results of the study showed that variants in VDR, CYP24A1, and GC genes are associated with a lower survival rate.

Abstract

Several studies have suggested that single nucleotide polymorphisms (SNPs) related to vitamin D metabolism may affect CRC carcinogenesis and survival. The aim of this study was to evaluate the influence of 13 SNPs involved in the vitamin D metabolic pathway on CRC survival. We conducted an observational retrospective cohort study, which included 127 Caucasian CRC patient from the south of Spain. SNPs in VDR, CYP27B1, CYP2R1, CYP24A1, and GC genes were analyzed by real-time polymerase chain reaction. Progression-free survival (PFS) and overall survival (OS) were assessed. Cox regression analysis adjusted for metastasis, age of diagnosis, stage (IIIB, IV or IVB), ECOG score (2–4), lymph node involvement, adjuvant chemotherapy, and no family history of CRC showed that the VDR ApaI (p = 0.036), CYP24A1 rs6068816 (p < 0.001), and GC rs7041 (p = 0.006) were associated with OS in patients diagnosed with CRC, and CYP24A1 rs6068816 (p < 0.001) was associated with PFS adjusted for metastasis, age of diagnosis, stage (IIIB, IV or IVB), ECOG score (2–4), lymph node involvement, adjuvant chemotherapy, and no primary tumor resection. The rest of the SNPs showed no association with CRC survival. Thus, the SNPs mentioned above may have a key role as prognostic biomarkers of CRC.

1. Introduction

Colorectal cancer (CRC) is one of the leading causes of cancer mortality worldwide (9.4%) [1]. It has a prevalence of 11.9% and an incidence of around 8%, and it is the most common cancer after lung, breast, and prostate cancer [1,2]. According to the latest cancer statistics, there are expected to be more than 153,020 new cases and 52,550 deaths from CRC in the United States in 2023 [2].
CRC involves the uncontrolled growth of malignant cells in the colon and rectum, with the ability to invade other tissues and create metastases [3]. The main risk factor for CRC is age, with 90% of cases being diagnosed in people over the age of 50 [3]. Similarly, overweight and obesity, smoking, excessive alcohol consumption, and physical inactivity, as well as consumption of certain foods such as processed meats, could influence the development of CRC [4]. Scientific advances are focusing on looking for new predictive biomarkers related to CRC risk and survival [5,6]. With respect to this, recent studies have shown a strong association between blood vitamin D levels and the risk of developing CRC [7,8].
Vitamin D is synthesized endogenously from 7-dehydrocholesterol after exposure to sunlight or via direct ingestion in the diet [9]. It is subsequently hydroxylated in position 25 by action of the hepatic enzyme 25-hydroxylase (CYP2R1), converting it to calcidiol (25(OH)D), the main circulating form in the blood. Next, the enzyme 1α-hydroxylase (CYP27B1) performs a second hydroxylation (in position 1) and converts the 25(OH)D to 1,25-dihydroxyvitamin D [1,25(OH)2D3], either in the kidney, where it is released into circulation, or in specific target organs [9]. Circulating 1,25(OH)2D3 is broken down by CYP24A1 into calcitroic acid and other water-soluble products that are inactive and are excreted in the bile or urine [9]. The two active metabolites of vitamin D bind to the vitamin D binding protein (VDBP or DBP), previously known as group-specific component (GC), facilitating its transport [10]. In the target tissues, 1,25(OH)2D3 interacts with the vitamin D receptor (VDR), which binds to the retinoid X receptor (RXR), forming a heterodimeric complex; this is translocated to the nucleus, where it interacts with the VDR response elements (VDRE), at multiple genomic loci [9]. For all these reasons, VDR is key to the performance of the biological actions of 1,25(OH)2D3 [8]. Furthermore, vitamin D has proven to have an inhibitory effect on angiogenesis and to arrest the G0/G1 cell cycle, induce apoptosis, increase cell differentiation, and inhibit various signaling pathways in tumor cells [11]. It is estimated that vitamin D contributes to the expression of 3–5% of genes, notably including those related to cancer (for example, MYC, BAK1, BAX, cyclin D1/2/3, GFM1/2) (Figure S1) [6,11].
The involvement of this biomolecule in the expression of tumor genes could be linked to the action of the VDR, since high expression of the VDR gene has been observed in the small intestine and colon [7]. Thus, vitamin D would be involved in the initiation and development of carcinogenesis in both organs [5,6,9]. Therefore, single-nucleotide polymorphisms (SNPs) have been described in genes involved in vitamin D metabolism (VDR, CYP2R1, CYP27B1, CYP24A1, and GC) which could substantially affect serum vitamin D levels or modify its action [12,13]. Moreover, there is scientific evidence relating the presence of SNPs in the genes that participate in vitamin D metabolism to CRC survival [14,15,16].
On the basis of the foregoing, we have carried out this study to assess the SNP-type variants in the genes involved in the vitamin D metabolic pathway, with an allelic frequency higher than 1%: GC rs7041 (A > C), CYP2R1 rs10741657 (A > G), CYP27B1 rs10877012 (G > T), rs4646536 (A > G), rs3782130 (G > C), and rs703842 (A > G), VDR rs1544410 (BsmI) (C > T), rs731236 (TaqI) (A > G), rs7975232 (ApaI) (C > A), rs2228570 (FokI) (A > G), and rs11568820 (Cdx2) (C > T), and CYP24A1 rs6068816 (C > T) and rs4809957 (A > G), as recorded in the dbSNP database, with the object of ascertaining their impact on the survival of Caucasian patients from southern Spain diagnosed with CRC [17].

2. Materials and Methods

2.1. Study Design

We conducted an observational retrospective cohort study.

2.2. Ethic Statement

The study was carried out with the approval of the Ethics and Research Committee of the Sistema Andaluz de Salud (SAS: Andalusian Health System) in accordance with the Declaration of Helsinki (code: 1322-N-20). The subjects participating in the study signed an informed consent for the collection and genetic analysis of the saliva samples and their donation to the Andalusian Public Health Service’s Biobank. The samples were identified by alphanumeric codes.

2.3. Study Population

The study was conducted at the Hospital Universitario Virgen de las Nieves (HUVN) in Granada, Spain. A total of 127 Caucasian patients originally from southern Spain were diagnosed with colon cancer in the Oncology Department of the HUVN between 2009 and 2022 and in follow-up until February 2022. The inclusion criteria for the study subjects were age over 18 years, diagnosed with colon cancer (stages I–IV), with adequate organ function, with disease assessable by computed tomography, with no previous treatment and available clinical data. The patients were treated in accordance with the National Comprehensive Cancer Network (NCCN) guidelines [18].

2.4. Sociodemographic and Clinical Variables

The sociodemographic and clinical data were collected by reviewing the clinical histories. The sociodemographic and clinical variables collected were sex, family history of cancer and CRC, smoking status, drinking status, body mass index (BMI), type of CRC, age of cancer diagnosis, ECOG score, tumor size, histopathology, lymph node involvement, histological grade, metastasis, stage, TNM stage, primary tumor resection, and adjuvant chemotherapy. The patients were classified as smokers if they had smoked or were smoking 100 or more cigarettes in the course of their lives, ex-smokers if they had smoked 100 or more cigarettes in their lives but did not currently smoke, and nonsmokers if they had never smoked or had smoked less than 100 cigarettes in their lives. Individuals were classified by standard drink units (SDUs) as nondrinkers if they were teetotalers or did not consume alcohol regularly, as drinkers if their alcohol consumption was greater than 4 SDUs per day in men and greater than 2.5 SDUs in women, and as ex-drinkers if they did not drink currently but their alcohol consumption had been greater than 4 SDUs per day in men and greater than 2.5 SDUs in women [19]. Information on tumor histology and stage (tumor size, lymph node involvement, metastasis), whether the primary tumor had been resected, and the adjuvant chemotherapy treatment was also collected. The AJCC guide to staging system criteria was used for tumor classification [20].

2.5. Genetic Variables

2.5.1. DNA Isolation

Following the patients’ inclusion and signing of the informed consent, saliva samples were collected with buccal swabs (OCR-100 Kit). The DNA was extracted using the QIAamp DNA Mini extraction kit (Qiagen GmbH, Hilden, Germany), following the specifications provided by the manufacturer for purifying DNA from saliva, and stored at −40 °C. The DNA concentration and purity were measured using a NanoDrop 2000 UV spectrophotometer with the absorbance ratio at 280/260 and 280/230.

2.5.2. Detection of Gene Polymorphisms

The polymorphisms were analyzed by real-time polymerase chain reaction (PCR) using TaqMan probes (ABI Applied Biosystems, 7300 Real-Time PCR System). The polymorphisms analyzed and their assay IDs used are shown in Table 1. The genetic variables were determined with QuantStudio 12K Flex software (96 wells). The determination of the genetic variants was performed between the Pharmacogenetics Unit of the HUVN and the Department of Biochemistry and Molecular Biology II of the University of Granada. The criteria established for quality control of the SNPs were (1) missing genotype rate per SNP < 0.05; (2) minor allele frequency (MAF) > 0.01; (3) p-value in Hardy-Weinberg equilibrium test > 0.05; (4) missing genotype rate between cases and controls < 0.05. Variants included in the study were selected according to their frequency in the Caucasian population and previous results of similar studies in the scientific literature.

2.6. Survival Variables

Progression-free survival (PFS) and overall survival (OS) were the variables used for analysis of the patients’ survival. Overall survival was defined as the time that elapsed from cancer diagnosis to death or last follow-up. Progression-free survival was calculated as the time from the start of therapy (for patients who received adjuvant therapy) or the time from the primary tumor resection (for subjects who did not receive adjuvant therapy) to last follow-up, death, or progression. The data on mortality were collected from the clinical histories.

2.7. Statistical Analysis

The descriptive analysis was performed using R 4.2.2 software [21]. The quantitative variables were expressed as the mean (±standard deviation) for those that complied with normality and as the median and percentiles (25 and 75) for the variables that did not follow a normal distribution. Normality was confirmed with the Shapiro–Wilk test.
For the analysis of association between survival and the sociodemographic, clinical, and genetic variables, we used the Kaplan–Meier method and a log-rank test. To perform the multivariate analysis, we used the Cox regression model (backward elimination method) and obtained the adjusted hazard ratio (HR) and the 95% confidence interval (95% CI) for the possible survival prognosis factors. All the tests were 2-tailed, and a probability of 0.05 or less was considered statistically significant.
The Hardy–Weinberg equilibrium and the MAFs were determined, and Lewontin’s D prime (D′) and the linkage disequilibrium coefficient (R2) were calculated. The linkage disequilibrium (LD) for each polymorphism was calculated with the PLINK genome association analysis program and Haploview 4.2 [22,23]. Haplotype survival analysis was performed using Thesias software 3.1, which applied Cox regression analysis [24].

3. Results

3.1. Patient Characteristics

The study included 127 patients from southern Spain diagnosed with colorectal cancer. The patients’ sociodemographic, clinical, and physio-pathological characteristics are shown in Table 2. The median follow-up was 35.8 (17.9–94.9) months for all CRC patients. Out of all the patients, 66.93% (85/127) were men; the mean age of CRC diagnosis was 62.52 ± 10.55 years, 44.09% (56/127) were nonsmokers, and 78.74% (100/127) had a BMI greater than 24. A total of 70.08% (89/127) of the patients were diagnosed with colon cancer, 55.91% (71/127) with stage I, II, or IIIA, and with surgery as first-line treatment in 93.70% of cases (119/127). Median OS and PFS for all patients were 82.3 (62.1-NR) (Figure S2) and 73.3 (41.0-NR) (Figure S3) months, respectively (Table 2).

3.2. Influence of Clinical-Pathological Characteristics on Survival

3.2.1. Overall Survival

Median OS was higher in patients with a family history of CRC (plog-rank = 0.020, 134.5 vs. 62.1 months; Table S1; Figure S4), with a lower age of CRC diagnosis (plog-rank < 0.001; Table S1), and an ECOG score of 0–1 (plog-rank = 0.001, 114.9 vs. 36.3 months; Table S1; Figure S5), without metastasis (plog-rank = 0.001, 134.5 vs. 56.2 months; Table S1; Figure S6), with stage I, II, or IIIA (plog-rank = 0.001, 134.5 vs. 52.1 months; Table S1; Figure S7), fewer lymph nodes affected (plog-rank = 0.001, 108.5 months for 1–3 vs. 30.6 months for >4; Table S1; Figure S8), and with adjuvant fluoropyrimidine and oxaliplatin chemotherapy (plog-rank = 0.003, 134.5 vs. 41.5 months for fluoropyrimidine + biologic, 41.9 months for fluoropyrimidine, and 30.2 months without adjuvant chemotherapy; Table S1; Figure S9).

3.2.2. Progression-Free Survival

A higher PFS value was found in patients with a lower age of CRC diagnosis (plog-rank = 0.001; Table S2), ECOG score 0–1 (plog-rank < 0.001, 105.8 vs. 18.6 months; Table S2; Figure S10), no lymph node involvement (plog-rank = 0.020, NR vs. 41 months; Table S2; Figure S11), absence of metastasis (plog-rank < 0.001, 125.9 vs. 19.8 months; Table S2; Figure S12), in stages I, II, or IIIA (plog-rank < 0.001, 125 vs. 35 months; Table S2; Figure S13), with fewer lymph nodes affected (plog-rank < 0.001, 63.3 months for 1–3 vs. 18.6 months for <4; Table S2; Figure S14), primary tumor surgically resected (plog-rank = 0.008, 105.2 vs. 14.1 months; Table S2; Figure S15), and with adjuvant fluoropyrimidine and oxaliplatin chemotherapy (plog-rank < 0.001, 125.4 vs. 38.1 months for fluoropyrimidine and 23.7 months for fluoropyrimidine + biologic; Table S2; Figure S16). Furthermore, we found a tendency toward association between higher median PFS and a history of CRC (plog-rank = 0.080, 125.9 vs. 55.1 months for subjects with no history of CRC; Table S2; Figure S17).

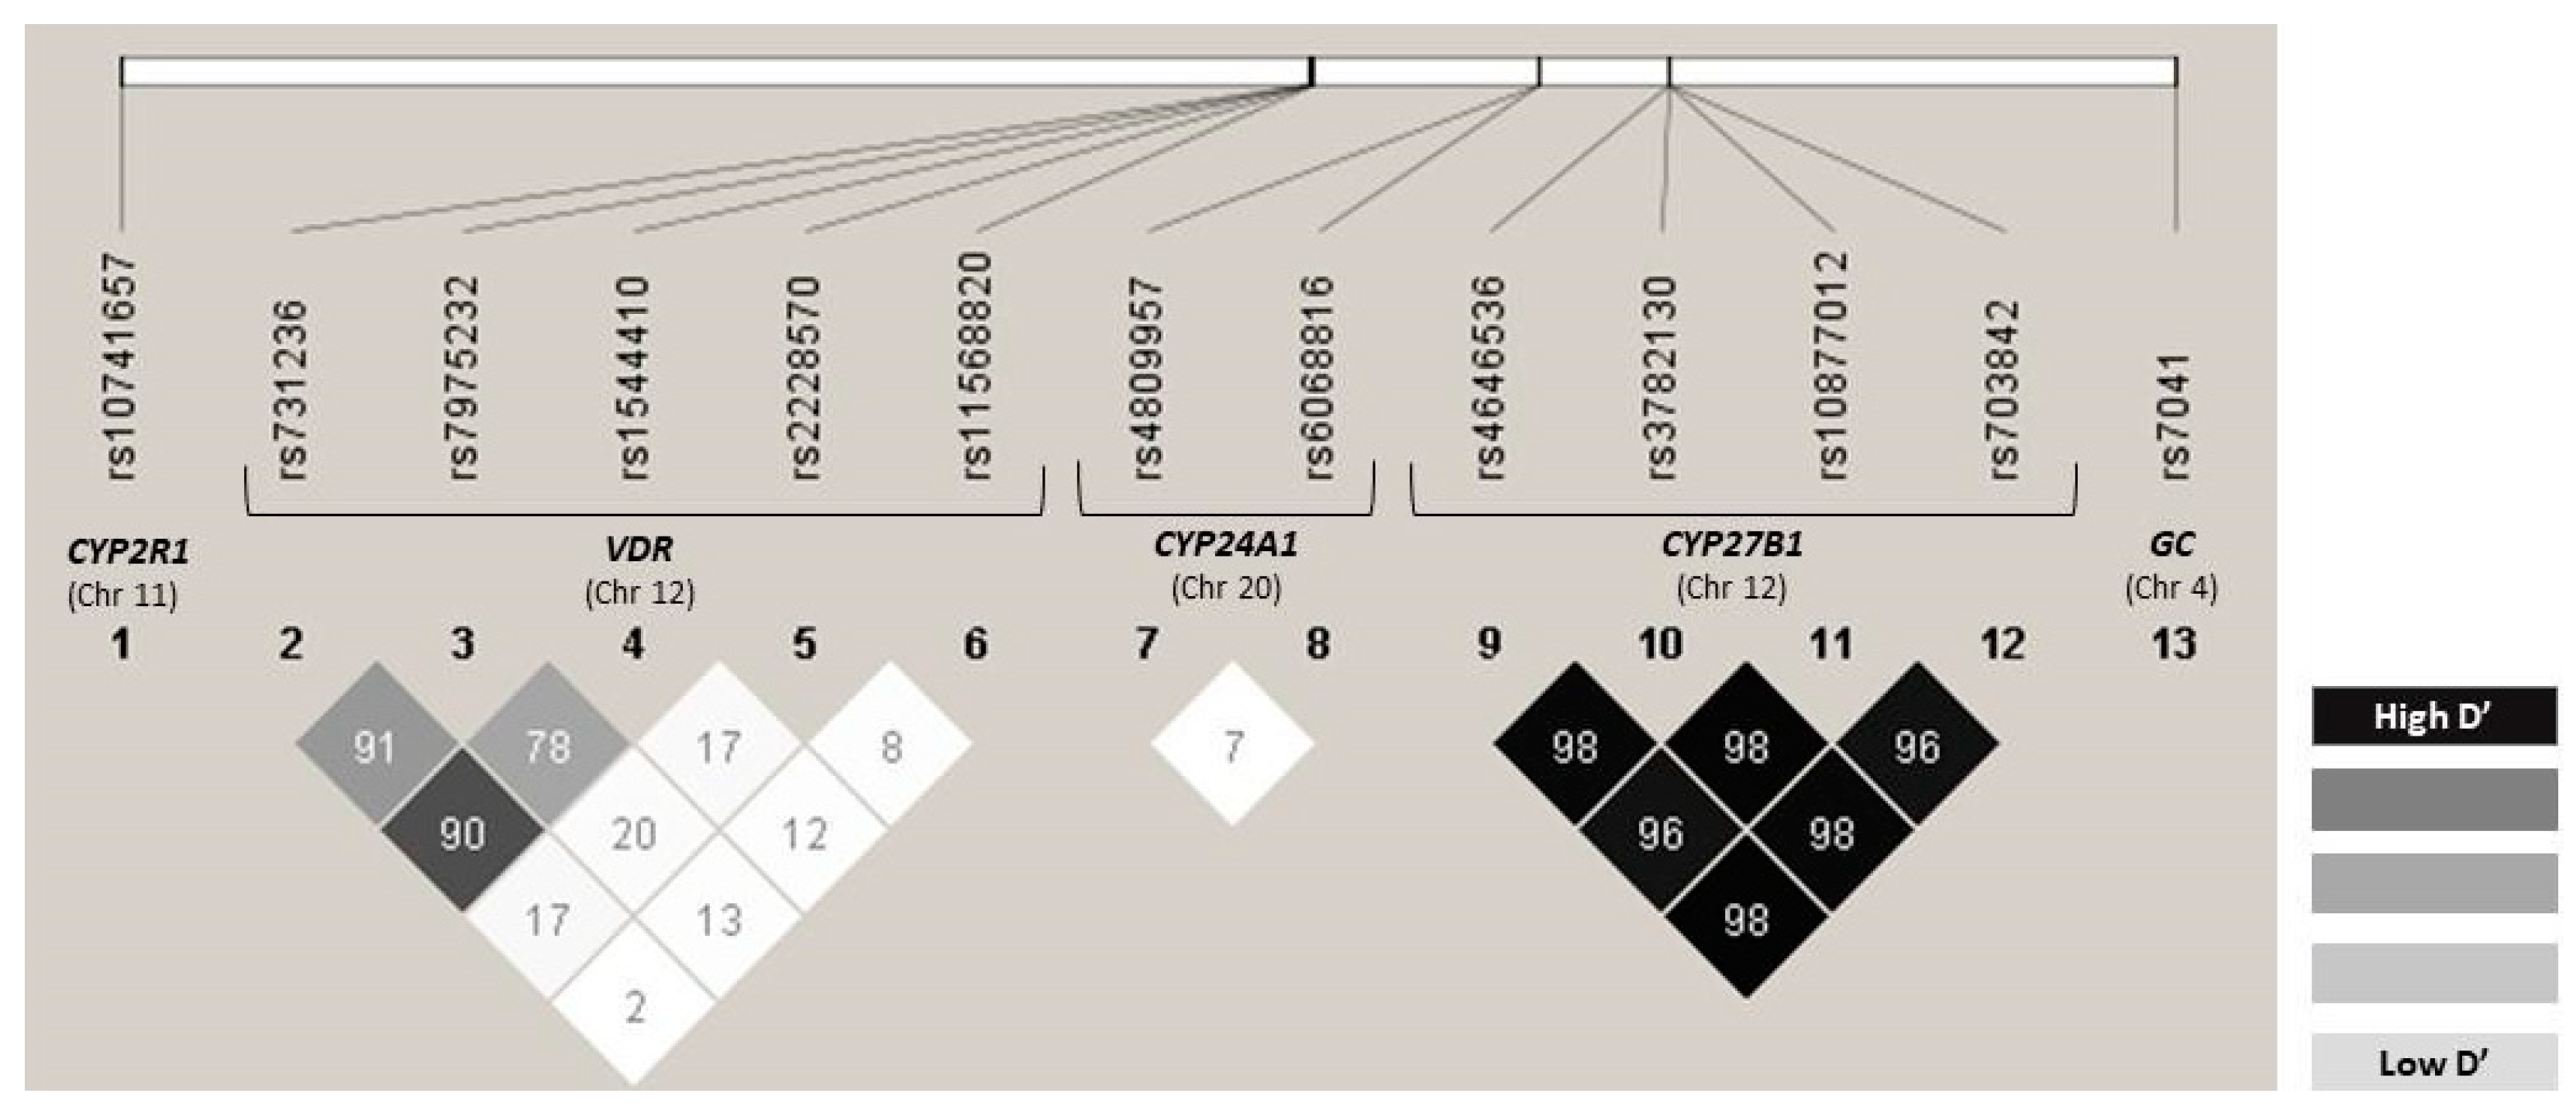
3.3. Genotypes and Haplotypes Distribution

All the polymorphisms show MAFs greater than 1%, and none of them were excluded from the analysis (Table S3). The values of the expected genotype frequencies, as well as the values of the Hardy–Weinberg equilibrium model for OS and PFS, are shown in Tables S4 and S5, respectively. The SNPs that did not comply with the Hardy–Weinberg equilibrium for OS and PFS were GC rs7041 (OS: p = 0.039; PFS: p = 0.007), VDR rs1544410 (OS: p = 0.006; PFS: p = 0.007), VDR rs2228570 (PFS: p = 0.034), VDR rs7975232 (OS: p = 0.047; PFS: p = 0.047), VDR rs731236 (OS: p = 0.016; PFS: p = 0.017), and CYP24A1 rs6068816 (p = 0.003; PFS: p = 0.003). No significant differences were found between the MAFs described for the Iberian population and the frequencies obtained in our population for the SNPs studied: GC rs7041-A: 0.492 vs. 0.435 (p = 0.965), VDR rs1544410-T: 0.445 vs. 0.439 (p = 0.993), VDR rs2228570-A: 0.343 vs. 0.327 (p = 0.981), VDR rs7975232-C: 0.421 vs. 0.430 (p = 0.989), VDR rs731236-G: 0.402 vs. 0.430 (p = 0.968), CYP24A1 rs6068816-T: 0.189 vs. 0.107 (p = 0.870) [6]. The linkage disequilibrium values (D’ and R2) are shown in Table S6. Specifically, the SNPs VDR rs1544410/rs7975232, VDR rs1544410/rs731236, VDR rs7975232/rs731236, CYP27B1 rs3782130/rs4646536, CYP27B1 rs3782130/rs703842, CYP27B1 rs3782130/rs10877012, CYP27B1 rs4646536/rs703842, CYP27B1 rs4646536/rs10877012, CYP27B1 rs703842/rs10877012 are in strong linkage disequilibrium (Figure 1). The SNP rs1544410, rs7975232, and rs731236 were included in VDR haplotype block, and rs3782130, rs4646536, rs703842, and rs10877012 were included in CYP27B1 haplotype. Haplotype frequency estimation values are given in Tables S7 and S8. The most frequent VDR haplotype was TAG (total frequency = 0.3766), and for CYP27B1 block GAAG was the more frequent haplotype (total frequency = 0.7165).

3.4. Influence of Gene Polymorphisms and Haplotypes on Survival

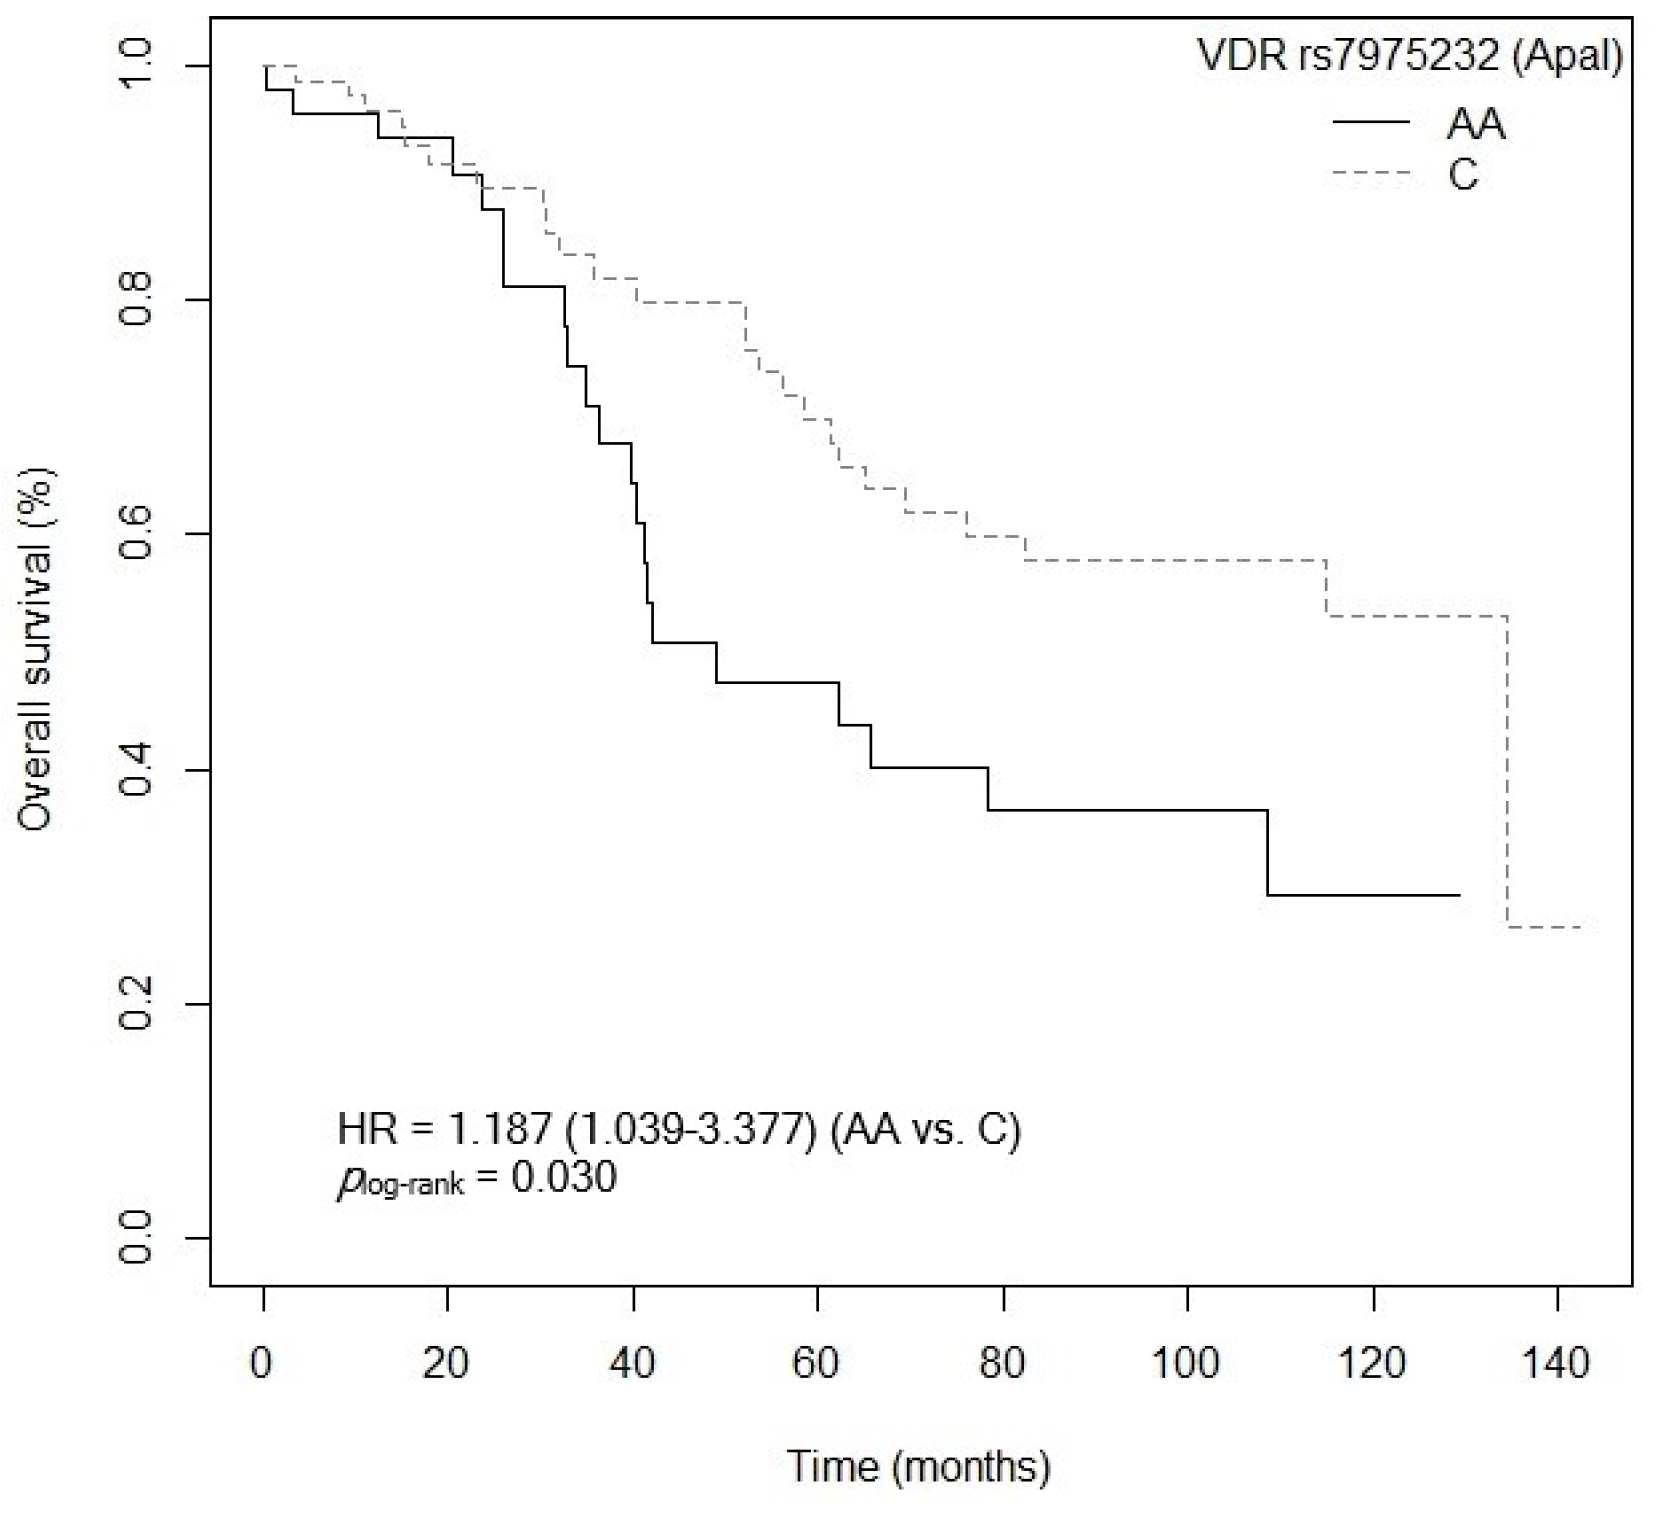
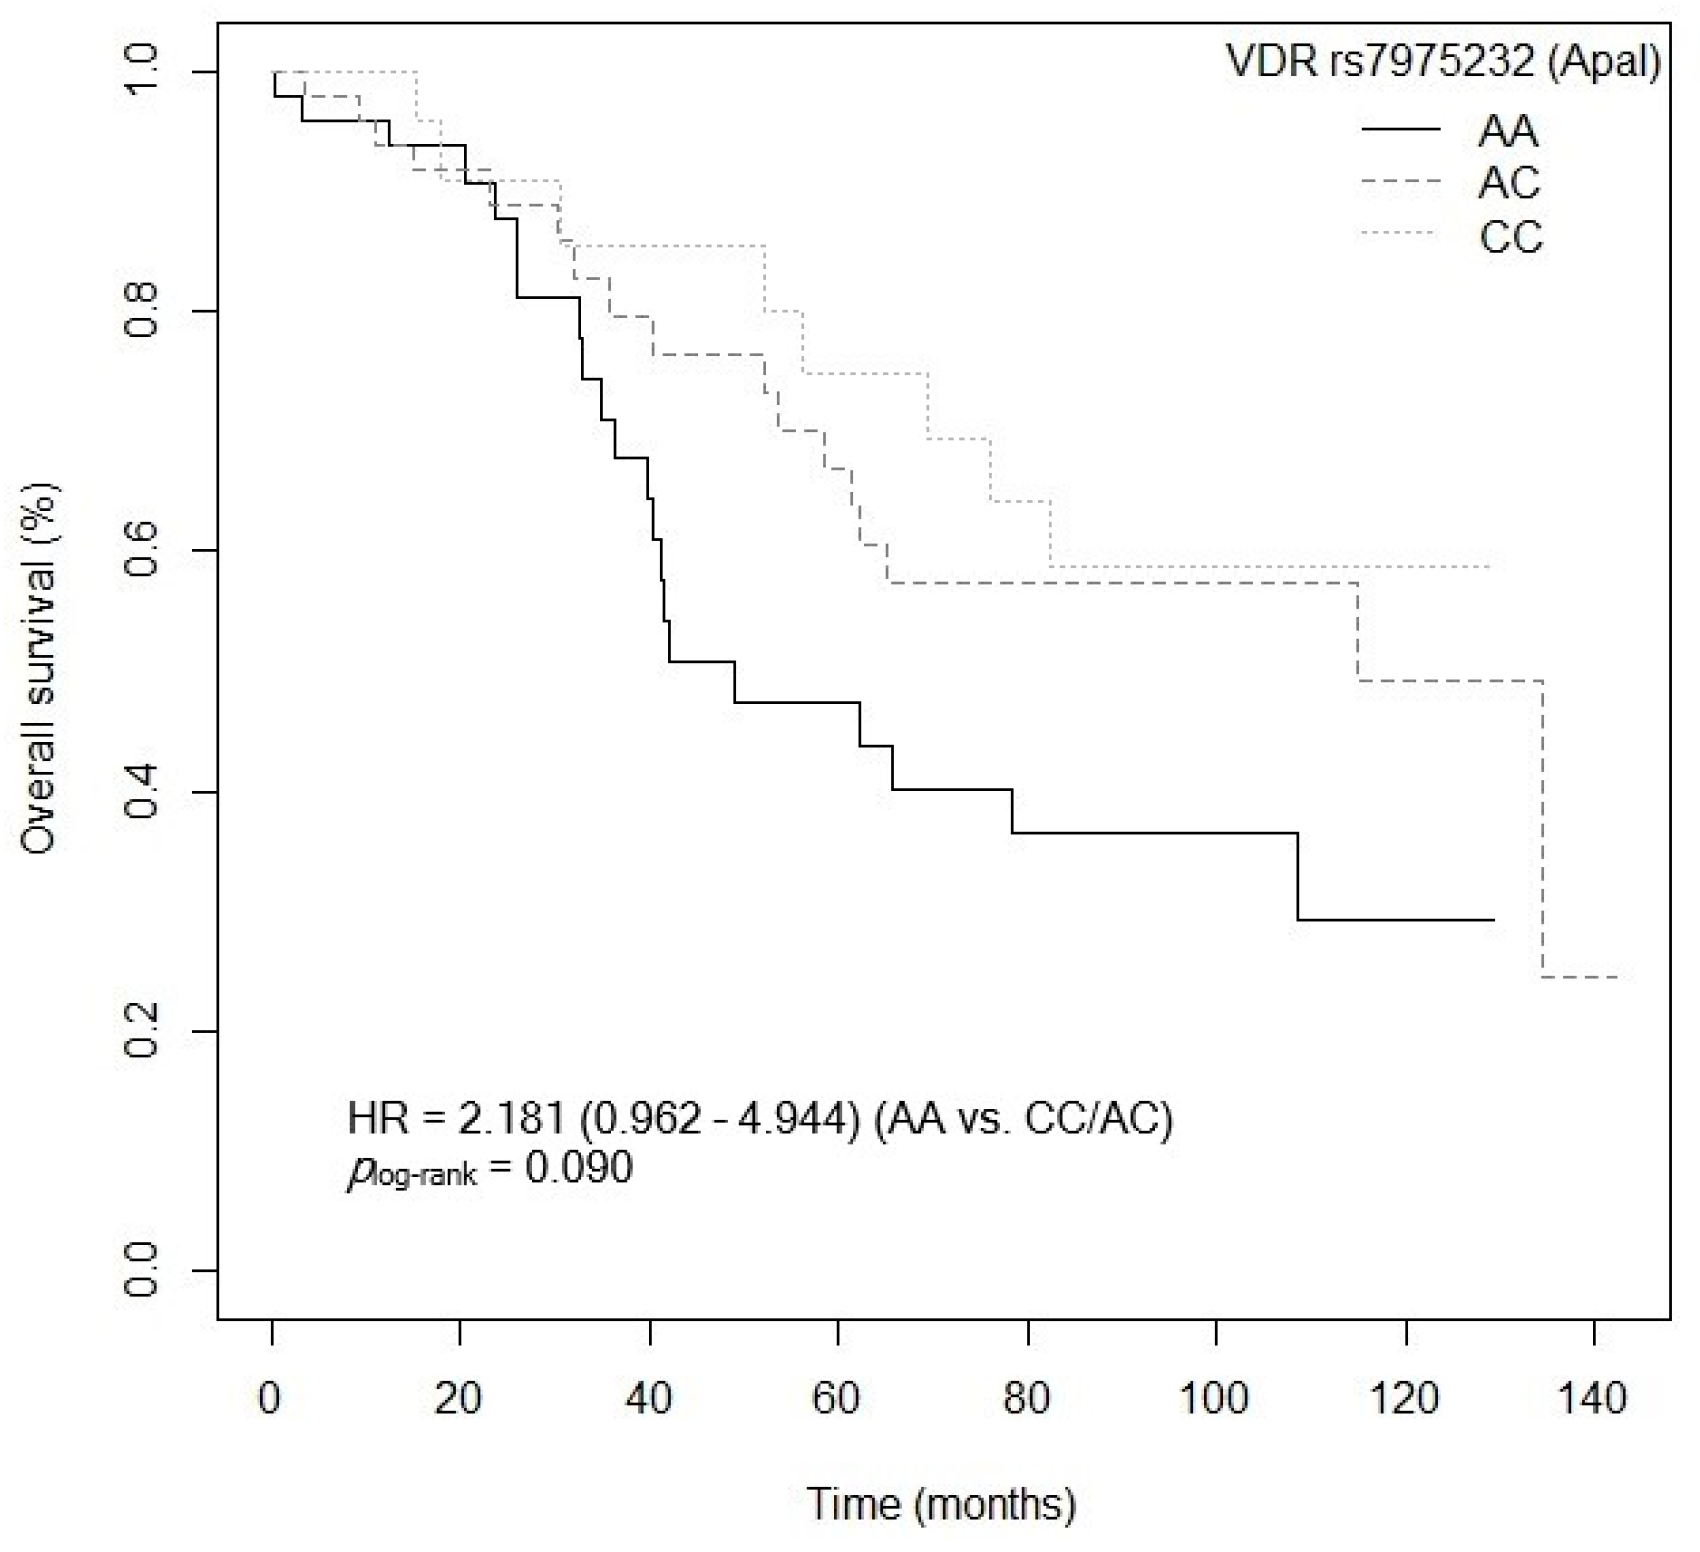
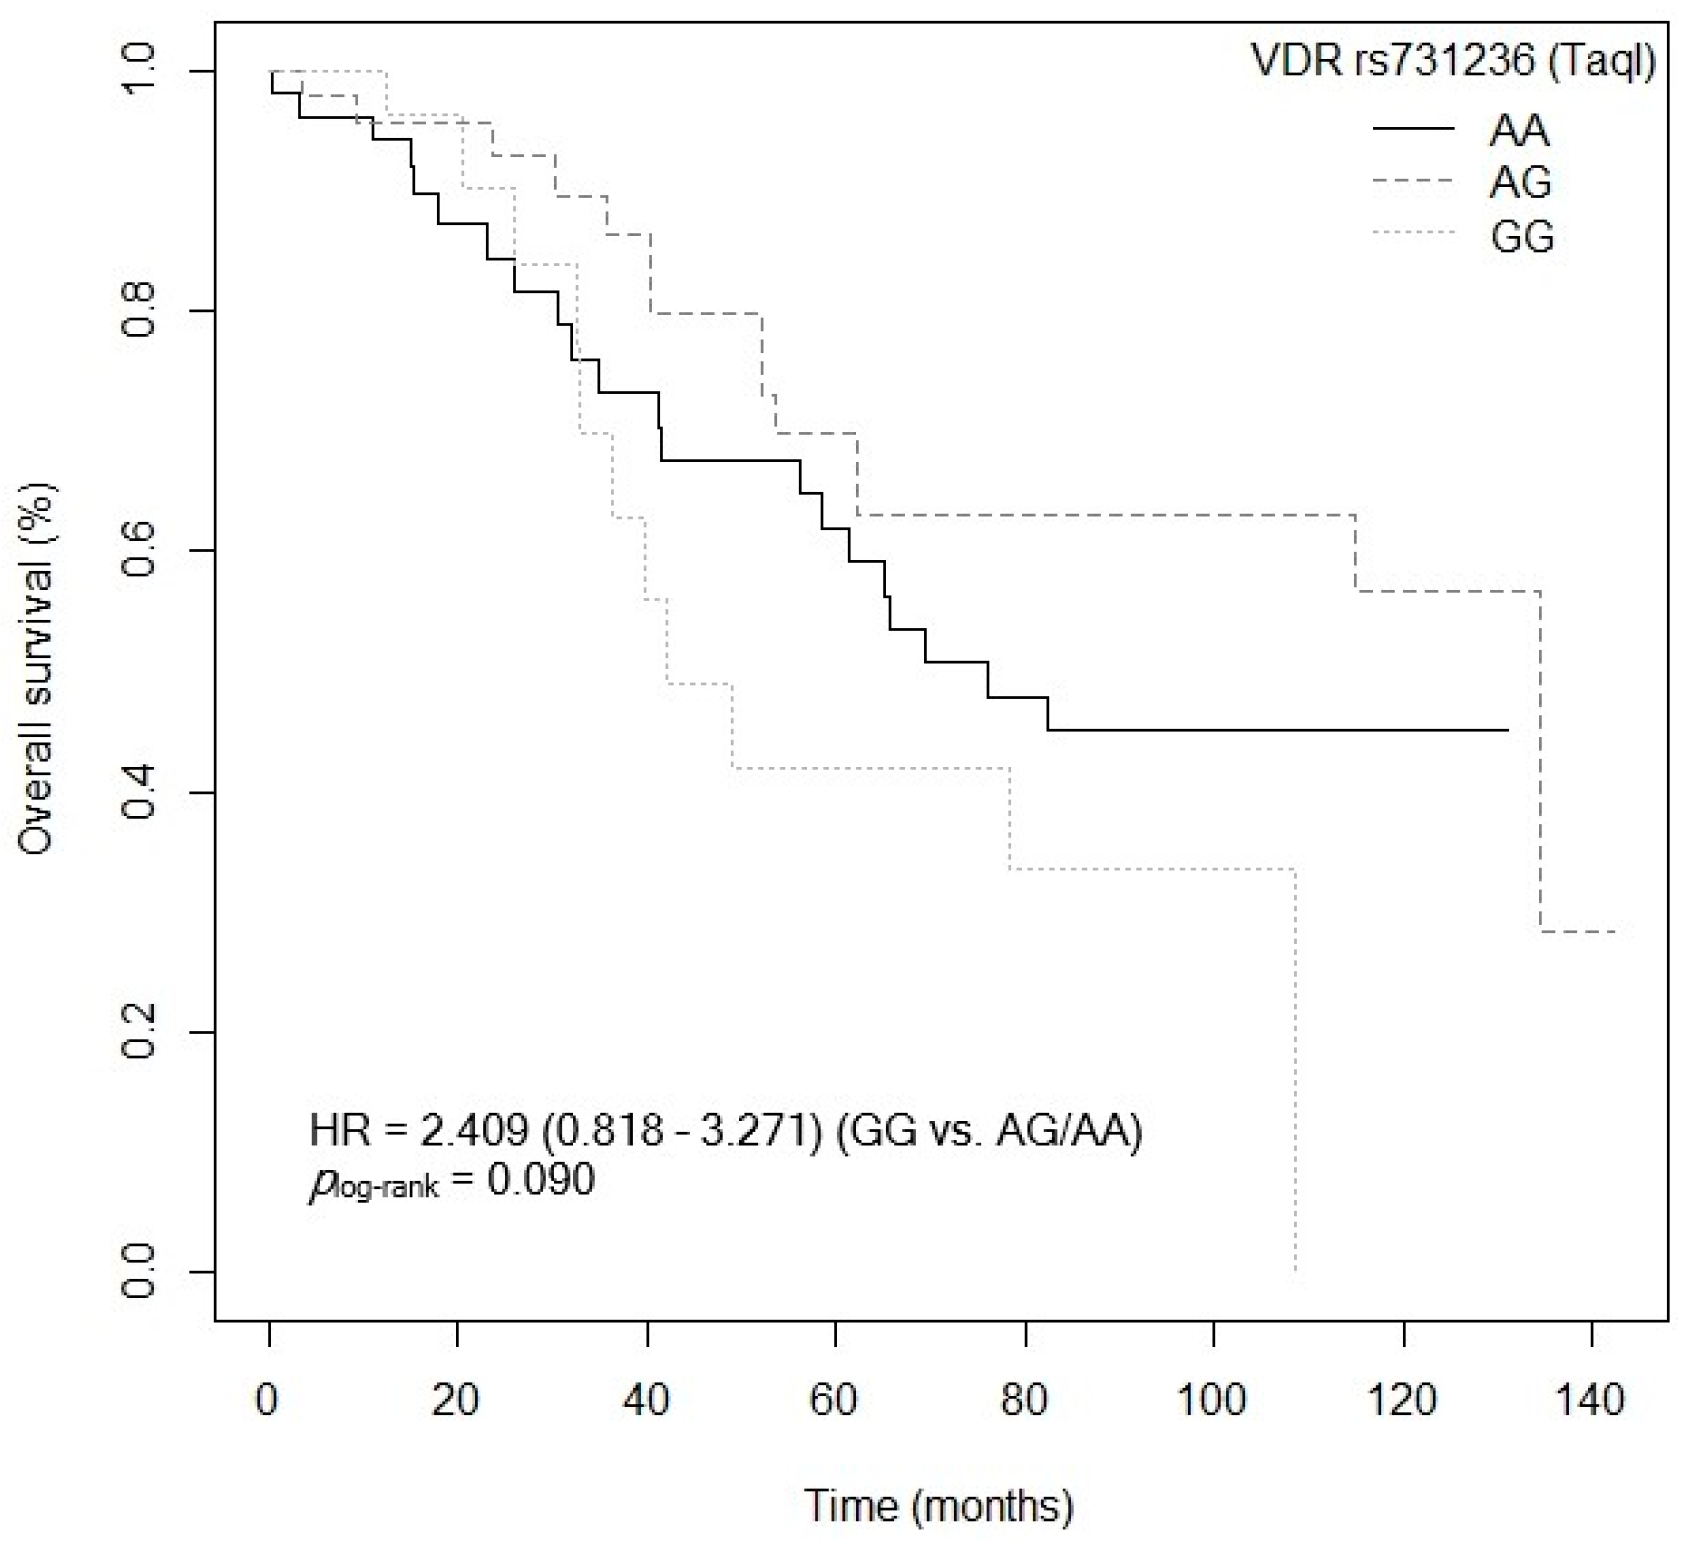
3.4.1. Overall Survival

The bivariate analysis showed an association between OS and the VDR rs7975232 (ApaI) polymorphism. Specifically, patients carrying the VDR rs7975232 (ApaI)-AA genotype showed lower survival when compared to carriers of the VDR rs7975232 (ApaI)-C allele (p = 0.037, HR = 1.187, 95% CI = 1.039–3.377; Table S9). The Kaplan–Meier graph with the OS curves for the VDR rs7975232 (ApaI)-AA vs. C genotype is shown in Figure 2 (plog-rank = 0.030). Median OS was 134.5 months (95% CI = 69.3–NR) for the VDR rs7975232 (ApaI)-C allele compared to 48.9 months (95% CI = 39.6–NR) for patients carrying the VDR rs7975232 (ApaI)-C genotype. Similarly, a tendency was found toward association between OS and the VDR rs7975232 (ApaI)-AA vs. CC/AC genotypes (p = 0.062, HR = 2.181, 95% CI = 0.962–4.944; Table S9). The Kaplan–Meier graph with the OS curves for the VDR rs7975232 (ApaI)-AA vs. CC/AC genotypes is shown in Figure 3 (plog-rank = 0.090). Median OS was 114.9 months (95% CI = 61.3–NR) for the VDR rs7975232 (ApaI)-AC genotype, compared to 48.9 months (95% CI = 39.6–NR) for patients with the VDR rs7975232 (ApaI)-AA genotype. Along the same lines, we found a tendency toward association between the VDR rs731236 (TaqI) SNP and OS. Patients with the VDR rs731236 (TaqI)-GG genotype showed lower survival than carriers of the VDR rs731236 (TaqI)-AG genotype (p = 0.034, HR = 2.409, 95% CI = 0.818–3.271; Table S9). The Kaplan–Meier graph with the OS curves for the VDR rs731236 (TaqI)-GG vs. AG/AA genotype is shown in Figure 4 (plog-rank = 0.090). Median OS was 134.5 months (95% CI = 62.3–NR) for the VDR rs731236 (TaqI)-AG genotype compared to 41.9 months (95% CI = 36.3–NR) and 75.9 months (95% CI = 58.5–NR) for patients carrying VDR rs731236 (TaqI)-GG and AA, respectively. Furthermore, the same tendency toward an association was found when the VDR rs731236 (TaqI)-A allele was compared to the VDR rs731236 (TaqI)-GG genotype (GG vs. A: p = 0.087, HR = 1.825, 95% CI = 0.915–3.637; Table S9). The Kaplan–Meier graph of the OS curves for the VDR rs731236 (TaqI)-GG vs. A genotype is shown in Figure 5 (plog-rank = 0.080). Median OS was 134.5 months (95% CI = 62.3–NR) for the VDR rs731236 (TaqI)-A allele compared to 41.9 months (95% CI = 36.3–NR) for patients carrying VDR rs731236 (TaqI)-GG. Moreover, we found a tendency toward association between the CYP24A1 rs6068816 SNP and the risk of lower OS. Specifically, patients with the CYP24A1 rs6068816-TT genotype showed lower survival than carriers of the CYP24A1 rs6068816-C allele (p = 0.067, HR = 2.244, 95% CI = 0.946–5.327; Table S9). Figure 6 shows the Kaplan–Meier graph of the OS curves for this association tendency (plog-rank = 0.060). Median OS was 108.5 months (95% CI = 62.3–NR) for the CYP24A1 rs6068816-C allele compared to 61.3 months (95% CI = 23.7–NR) for the CYP24A1 rs6068816-TT genotype. Finally, the GC rs7041 SNP showed an impact on OS in our patients. For example, individuals with the GC rs7041-C allele show lower OS than carriers of the GC rs7041-AA genotype (p = 0.020, HR = 2.914, 95% CI = 1.149–7.393; Table S9). The Kaplan–Meier graph of the OS curves is shown in Figure 7 (plog-rank = 0.020). Median OS was 65.5 months (95% CI = 53.5–NR) for subjects with the GC rs7041-C allele, compared to 69.3 months (95% CI = 56.2–NR) for those carrying the GC rs7041-A allele. In addition, when we studied the association between OS and the GC rs7041-AC vs. AA/CC genotypes, we found that individuals carrying the GC rs7041-AC genotype showed lower survival (p = 0.009, HR = 3.514, 95% CI = 1.359–9.088; Table S9) than carriers of the GC rs7041-CC and AA genotypes. The Kaplan–Meier graph of the OS curves is shown in Figure 8 (plog-rank = 0.010). Median OS was 61.3 months (95% CI = 41.9–NR) for subjects with the GC rs7041-AC genotype, compared to 114.5 months (95% CI = 65.0–NR) for those carrying the GC rs7041-CC genotype. Regarding the overall survival haplotype analysis, the frequencies of VDR and CYP27B1 haplotypes in censored and non-censored patients are shown in Tables S10 and S11, respectively. Likewise, the results of Cox regression analysis for haplotypes and overall survival revealed no significant findings related to VDR block (Table S12) (al p-value > 0.05). As for the CYP27B1 haplotype analysis, only an association analysis could be performed due to its low frequency in our patients. This analysis showed no significant association between the CGGT haplotype and overall survival in our patients (p = 0.473, HRR = 0.84, 95% CI = 0.54–1.33, CGGG vs. CGGT). The Cox regression analysis adjusted for no family history of CRC, stage (IIIB, IV, or IVB), adjuvant chemotherapy, lymph node involvement, ECOG score (2–4), metastasis, and age of diagnosis showed that the CYP24A1 rs6068816-TT (p = < 0.001, HR = 6.237, 95% CI = 2.297–16.936; Table 3) and GC rs7041-C (p = 0.006, HR = 4.939, 95% CI = 1.578–15.457; Table 3) and VDR rs7975232 (ApaI)-AA (p = 0.036, HR = 1.974, 95% CI = 1.045–3.731; Table 3) SNPs were the independent variables associated with OS in patients diagnosed with CRC (plog-rank < 0.001) (Table 3).

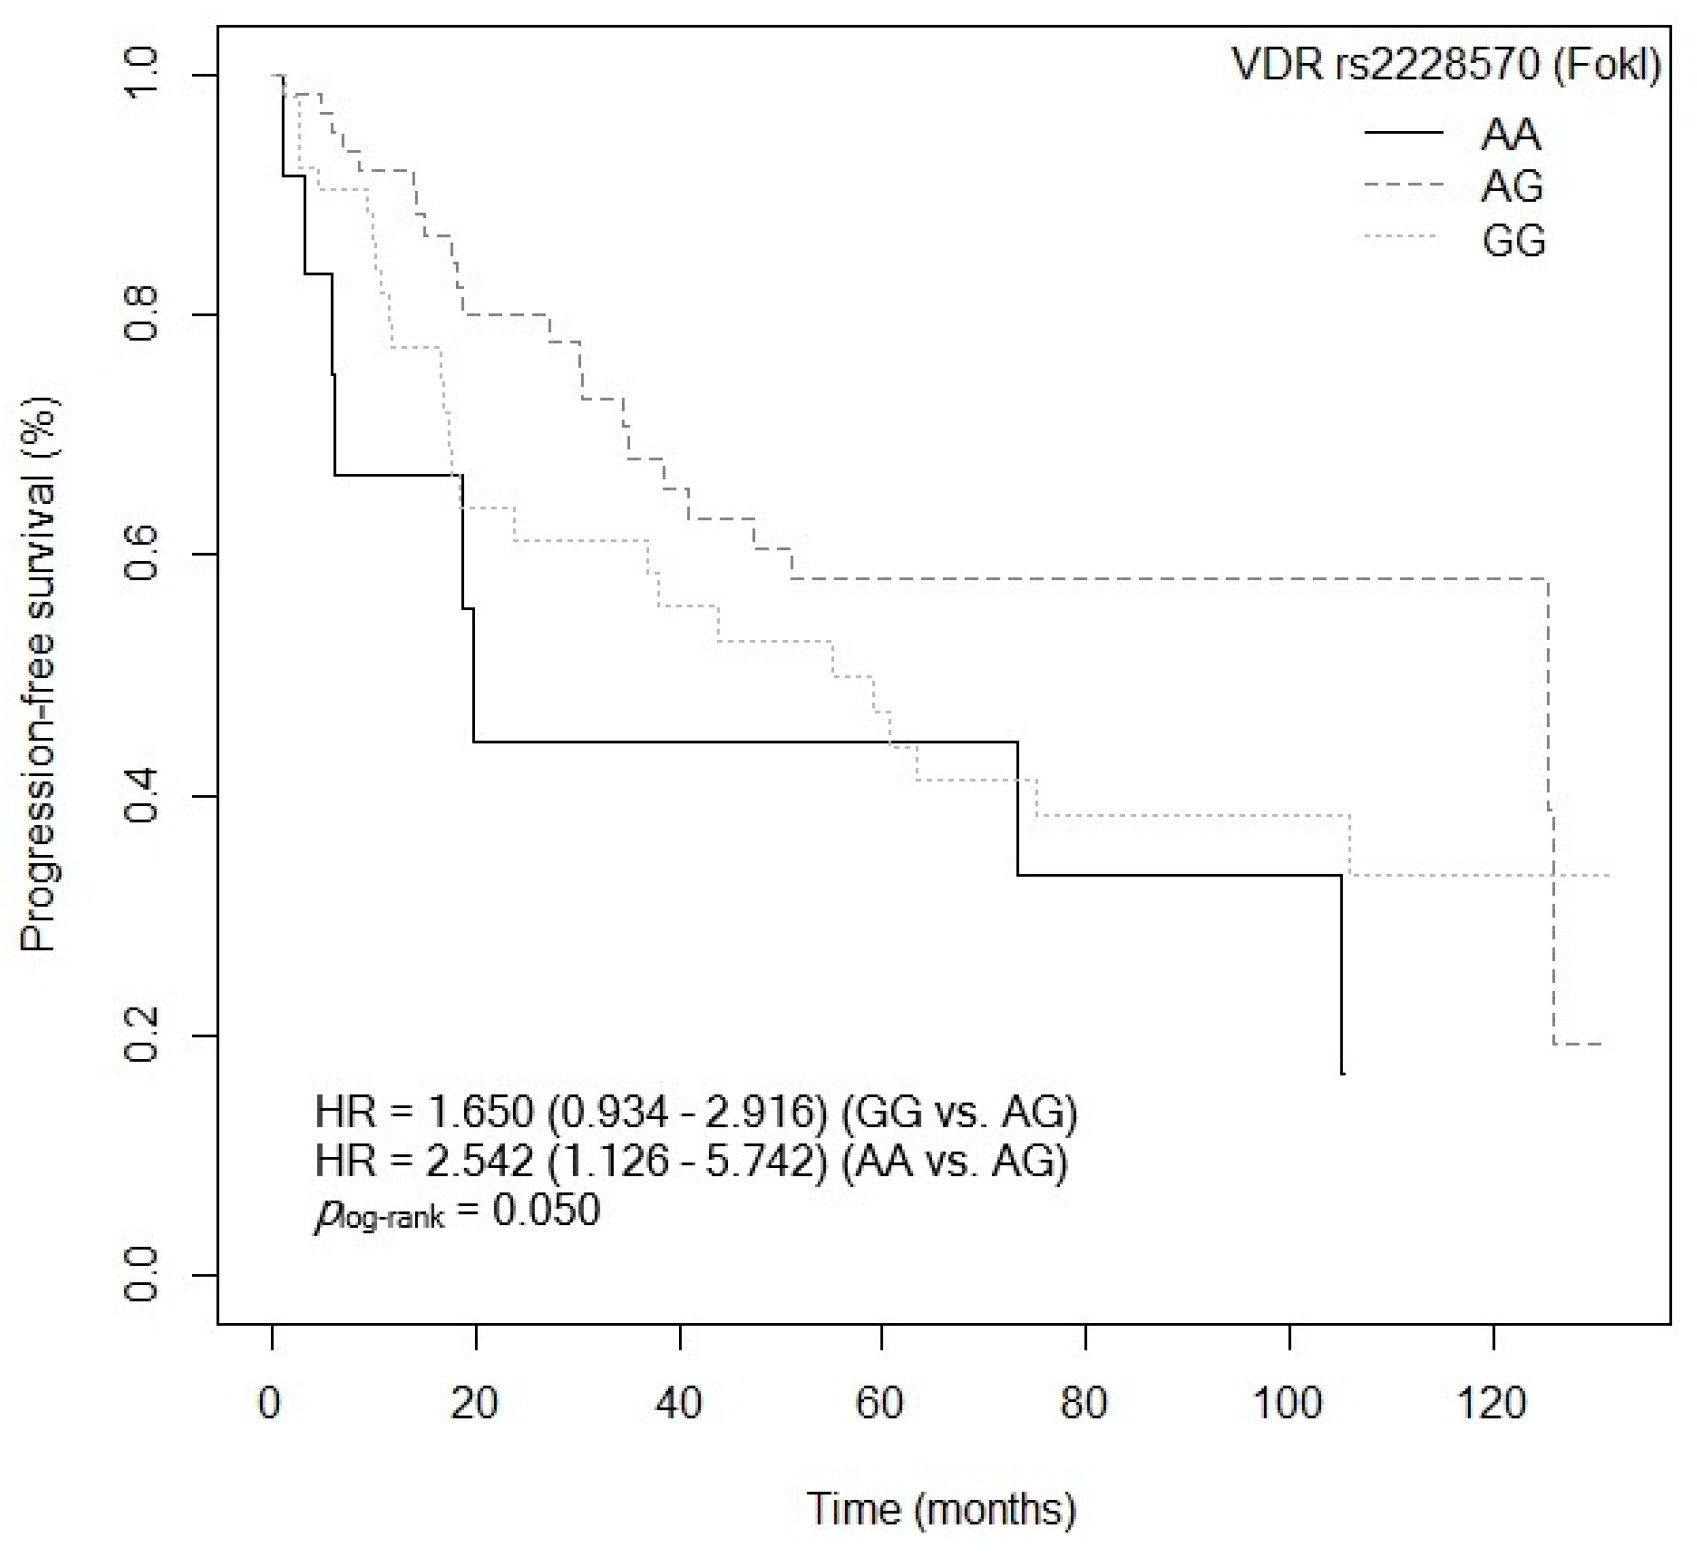
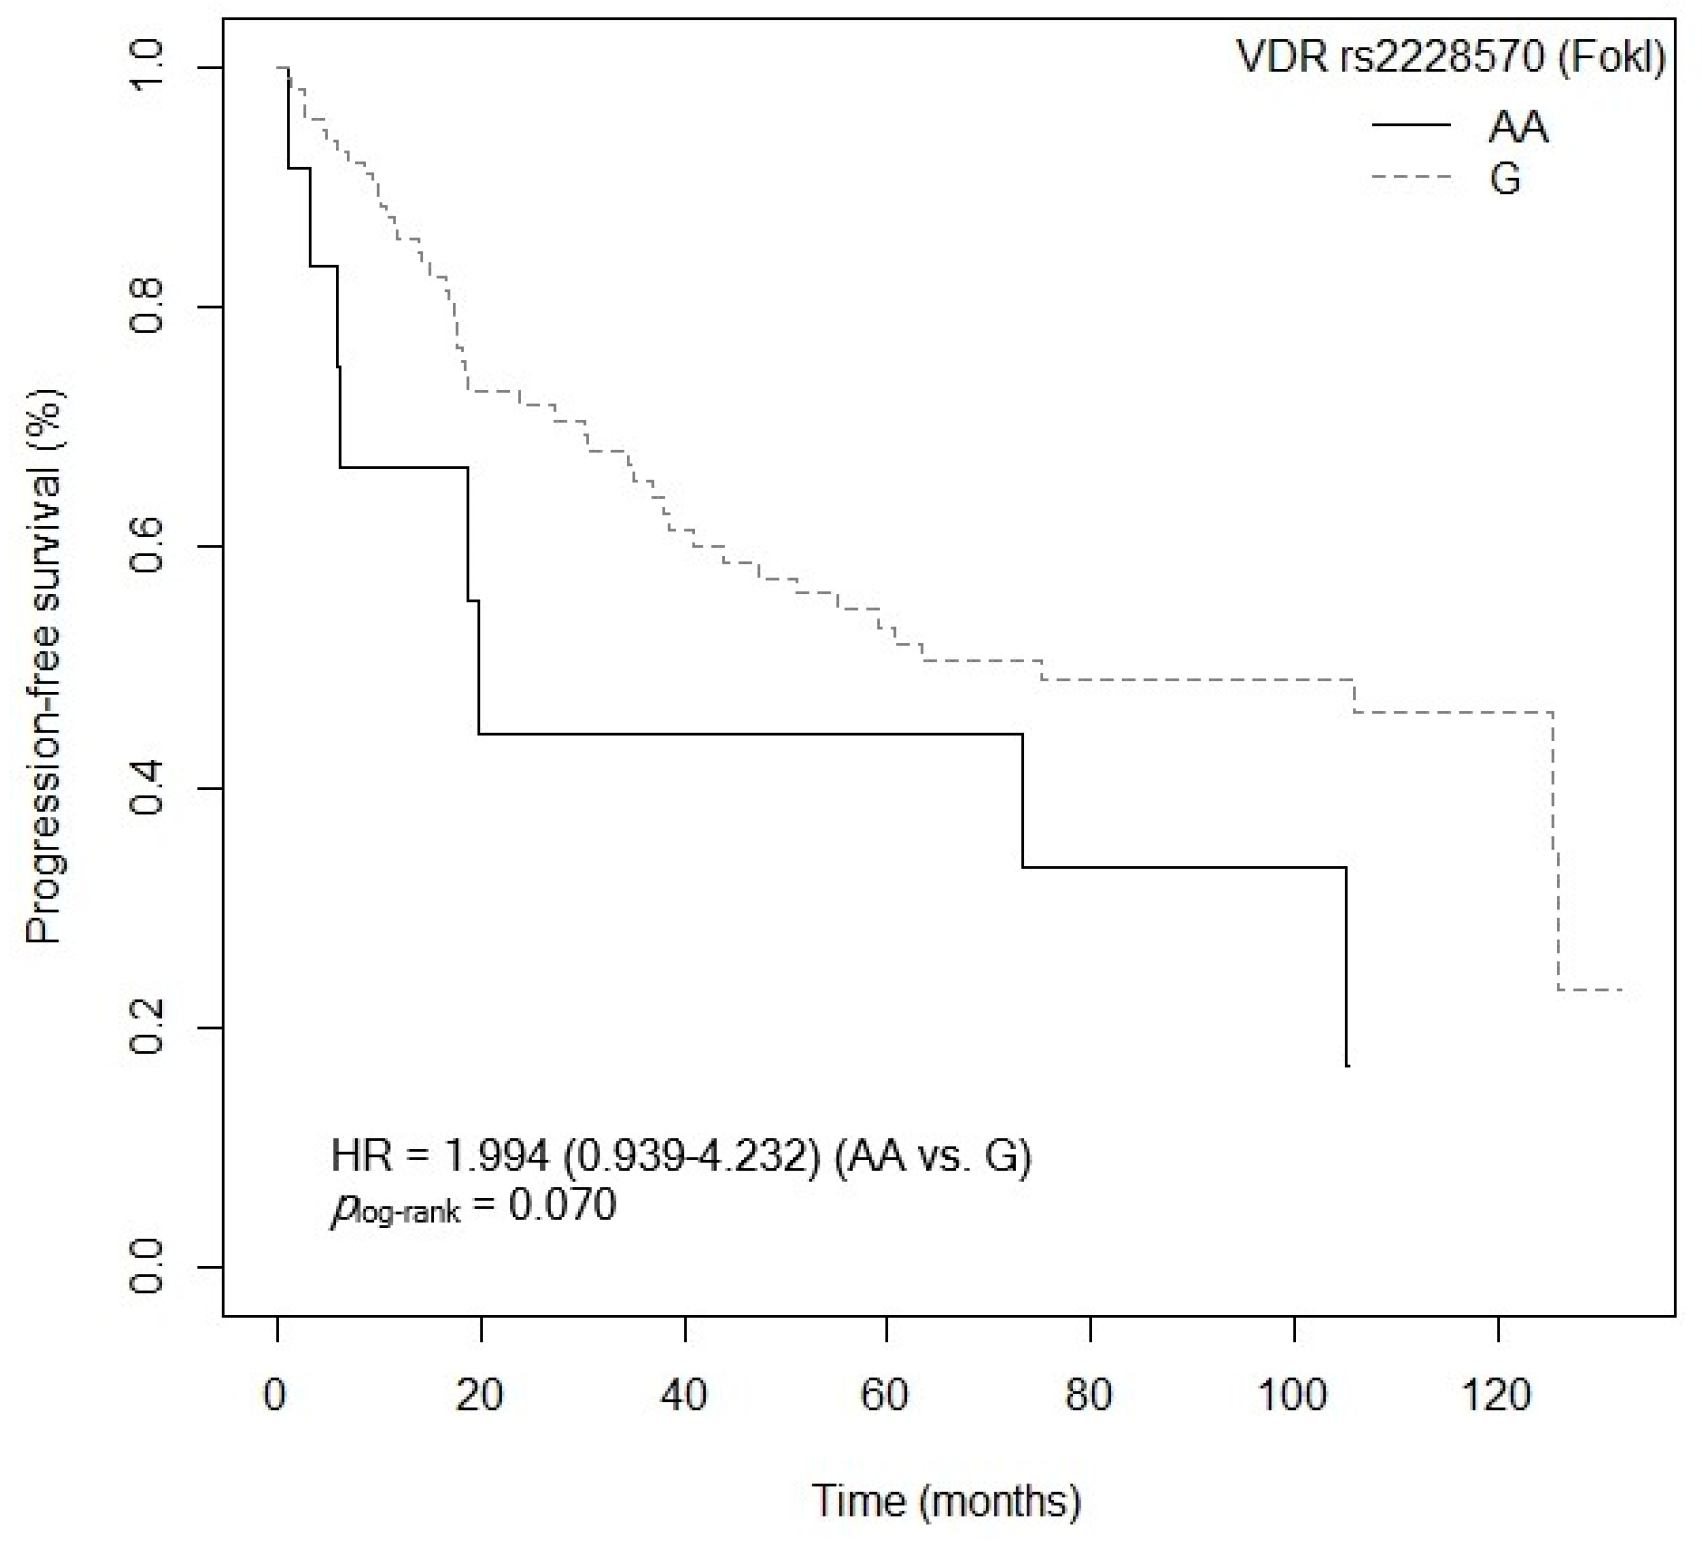
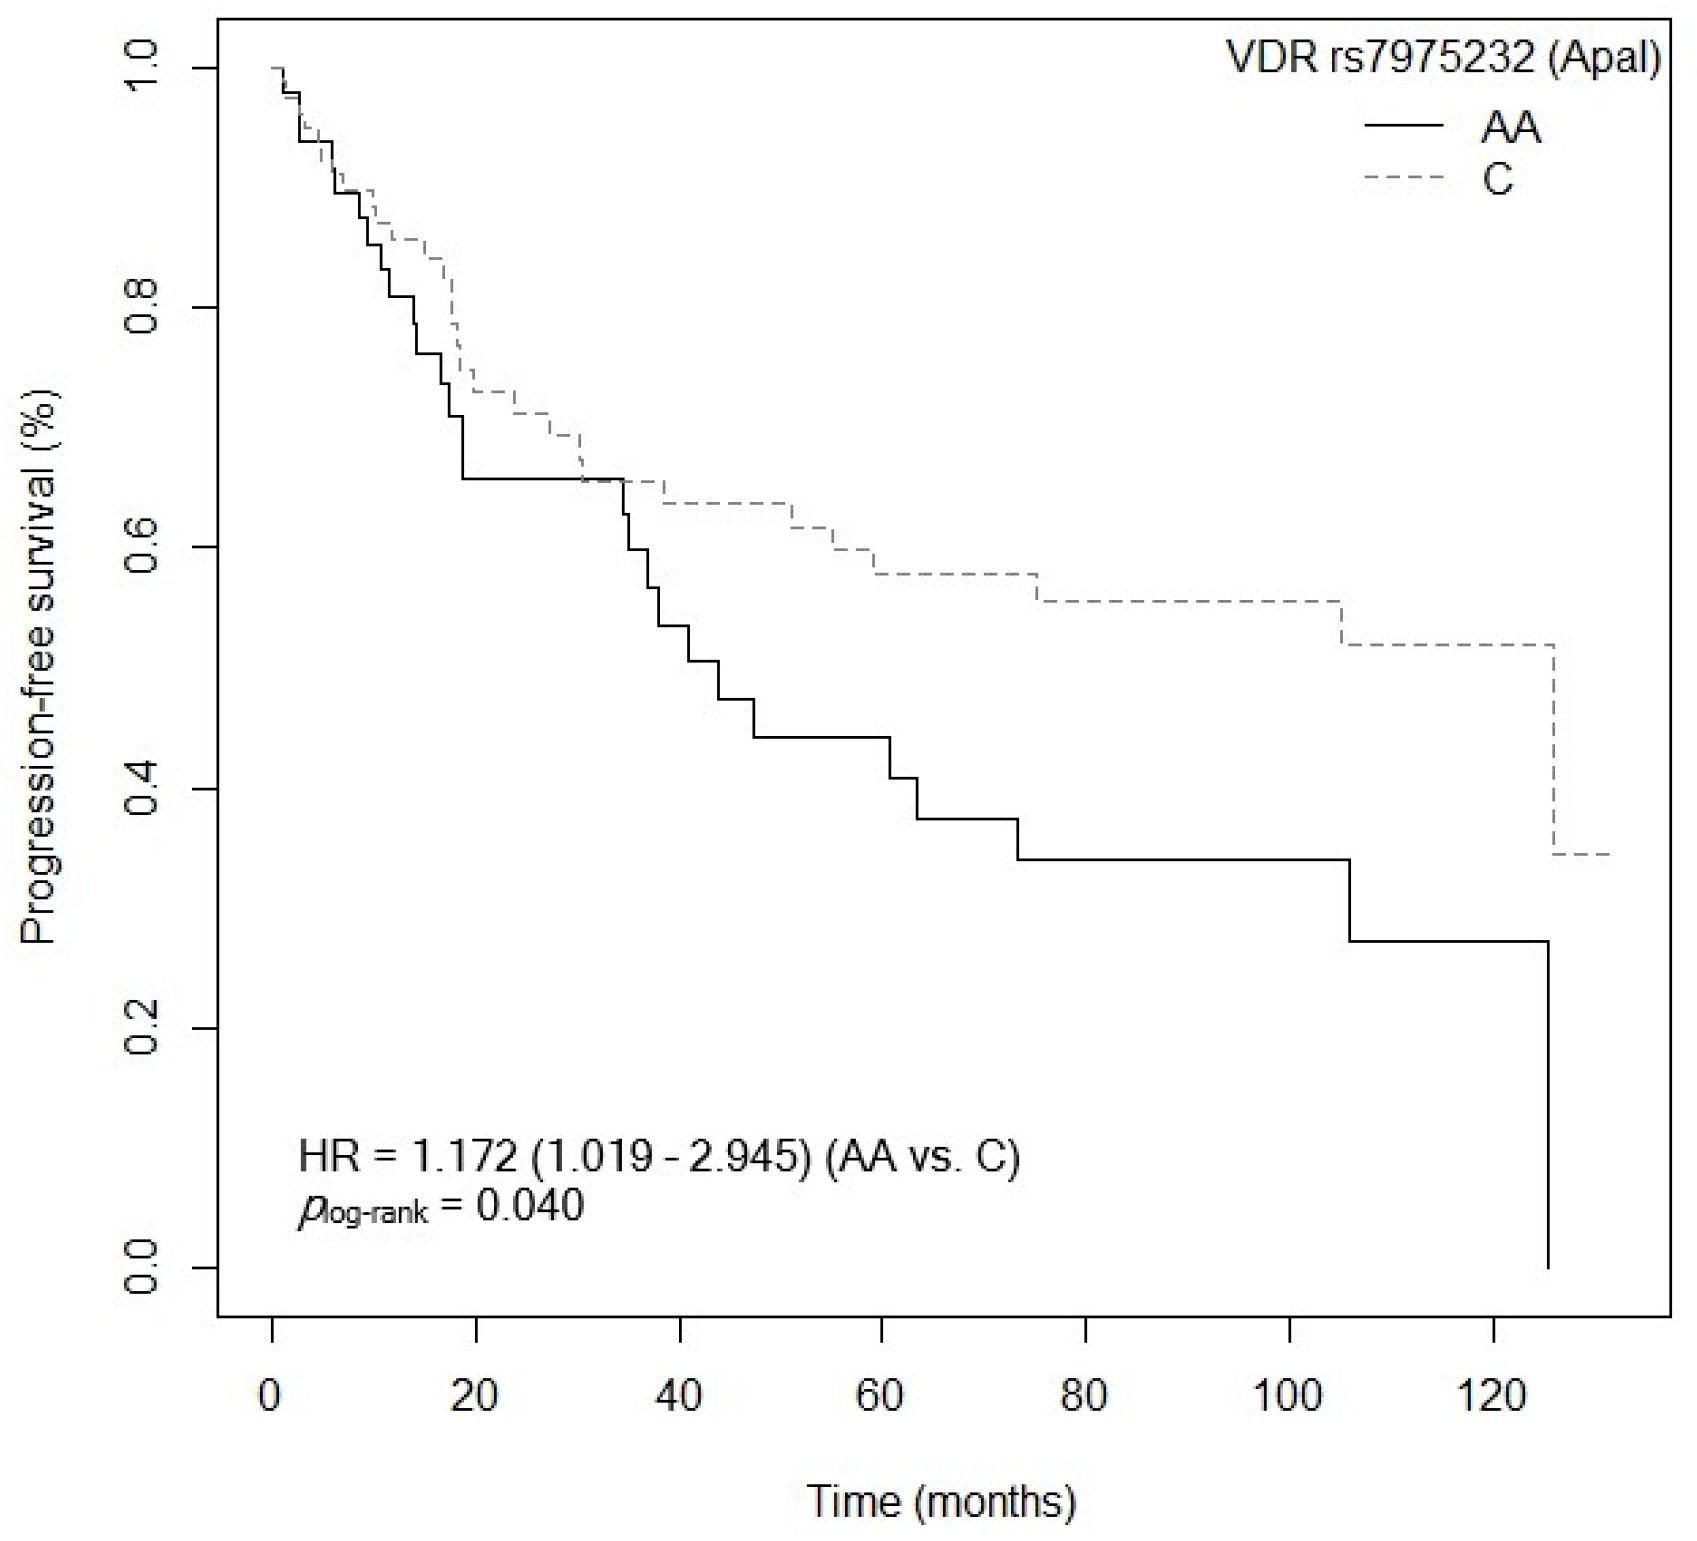
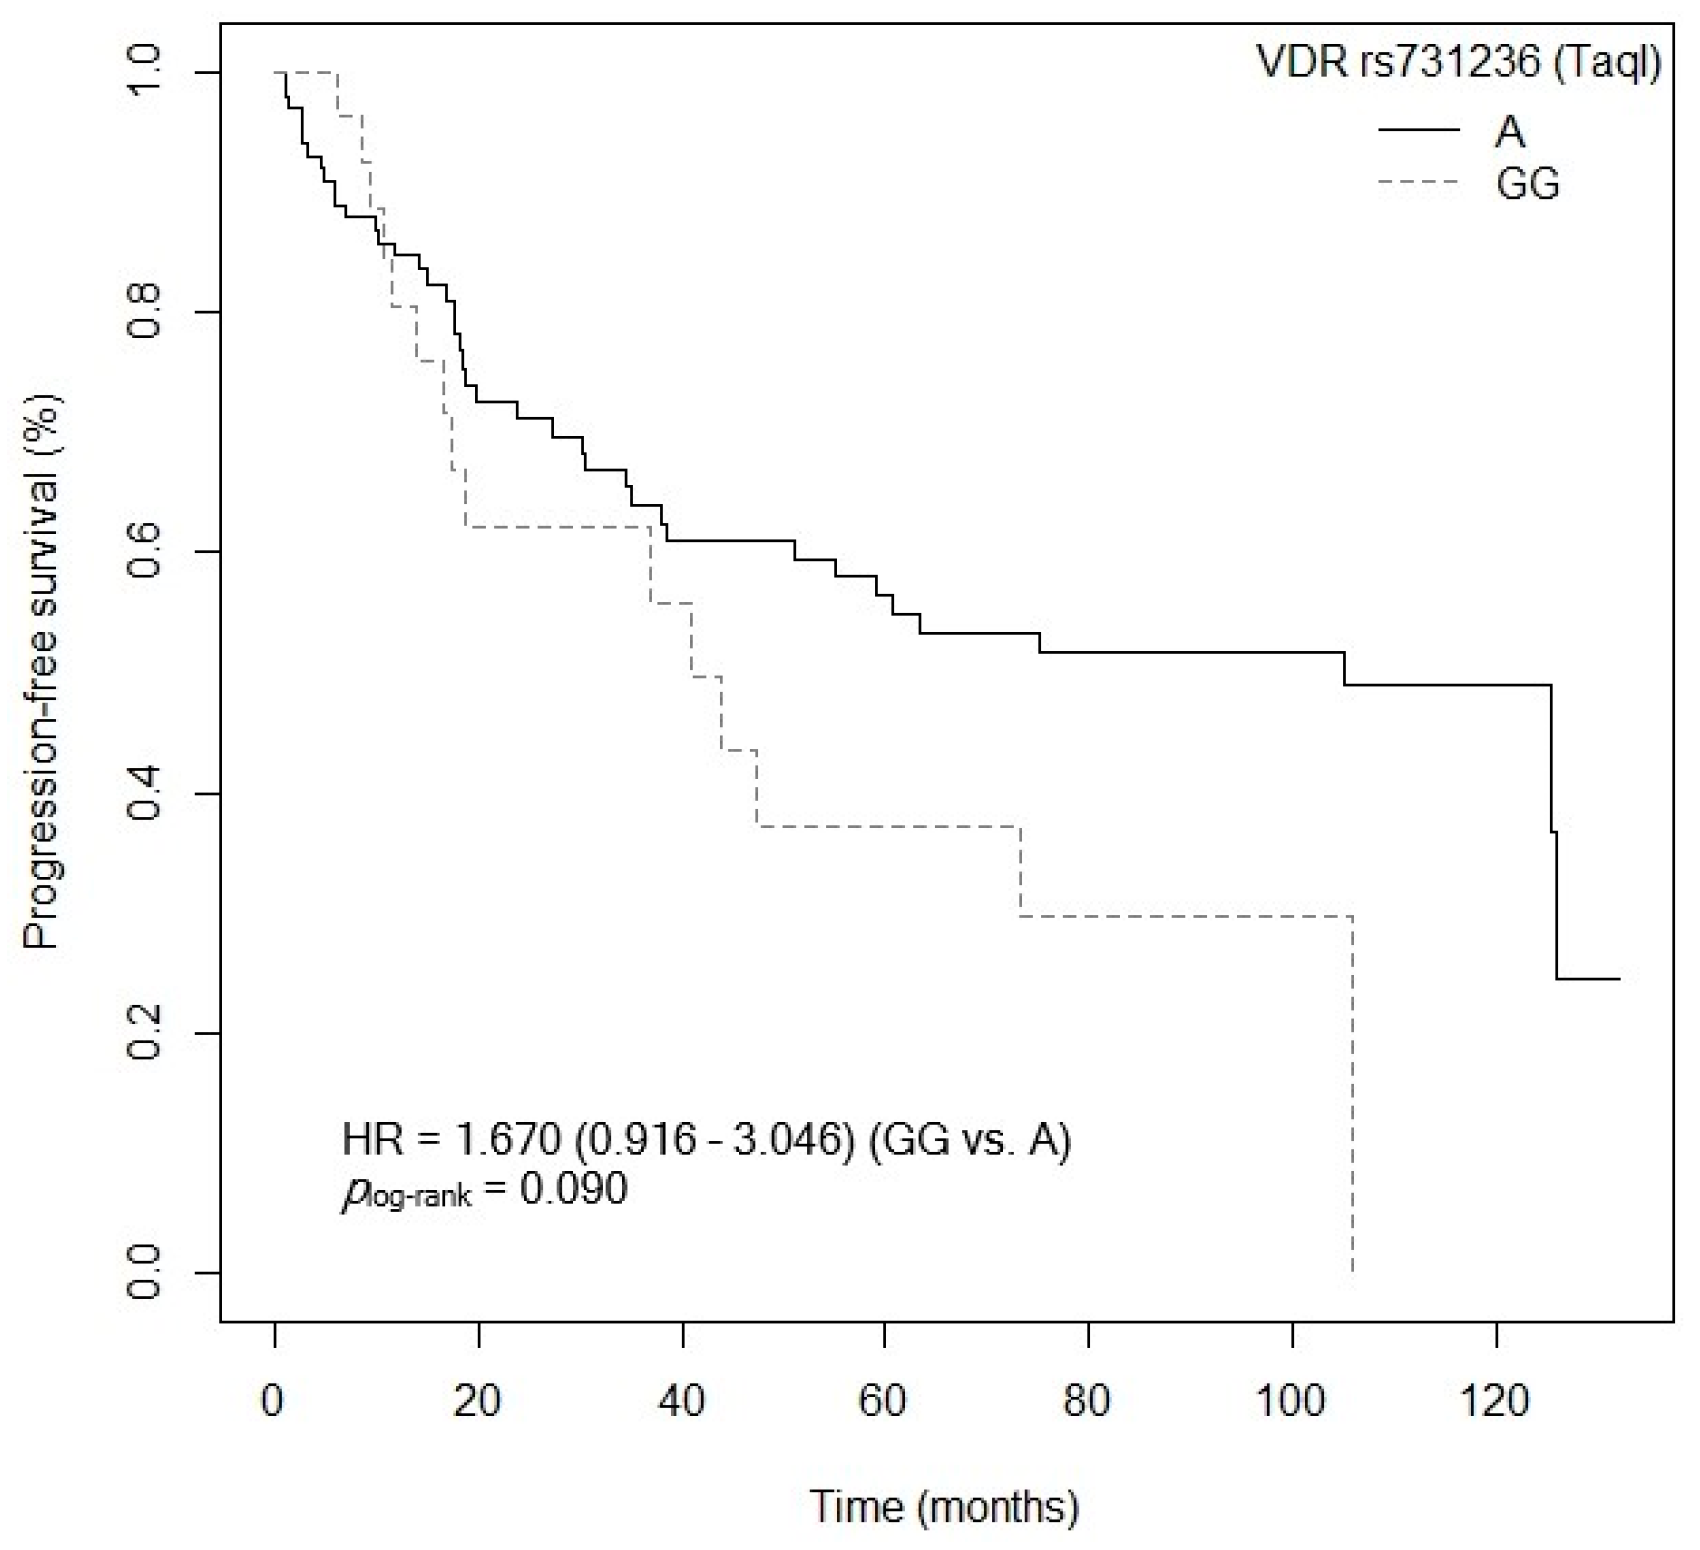
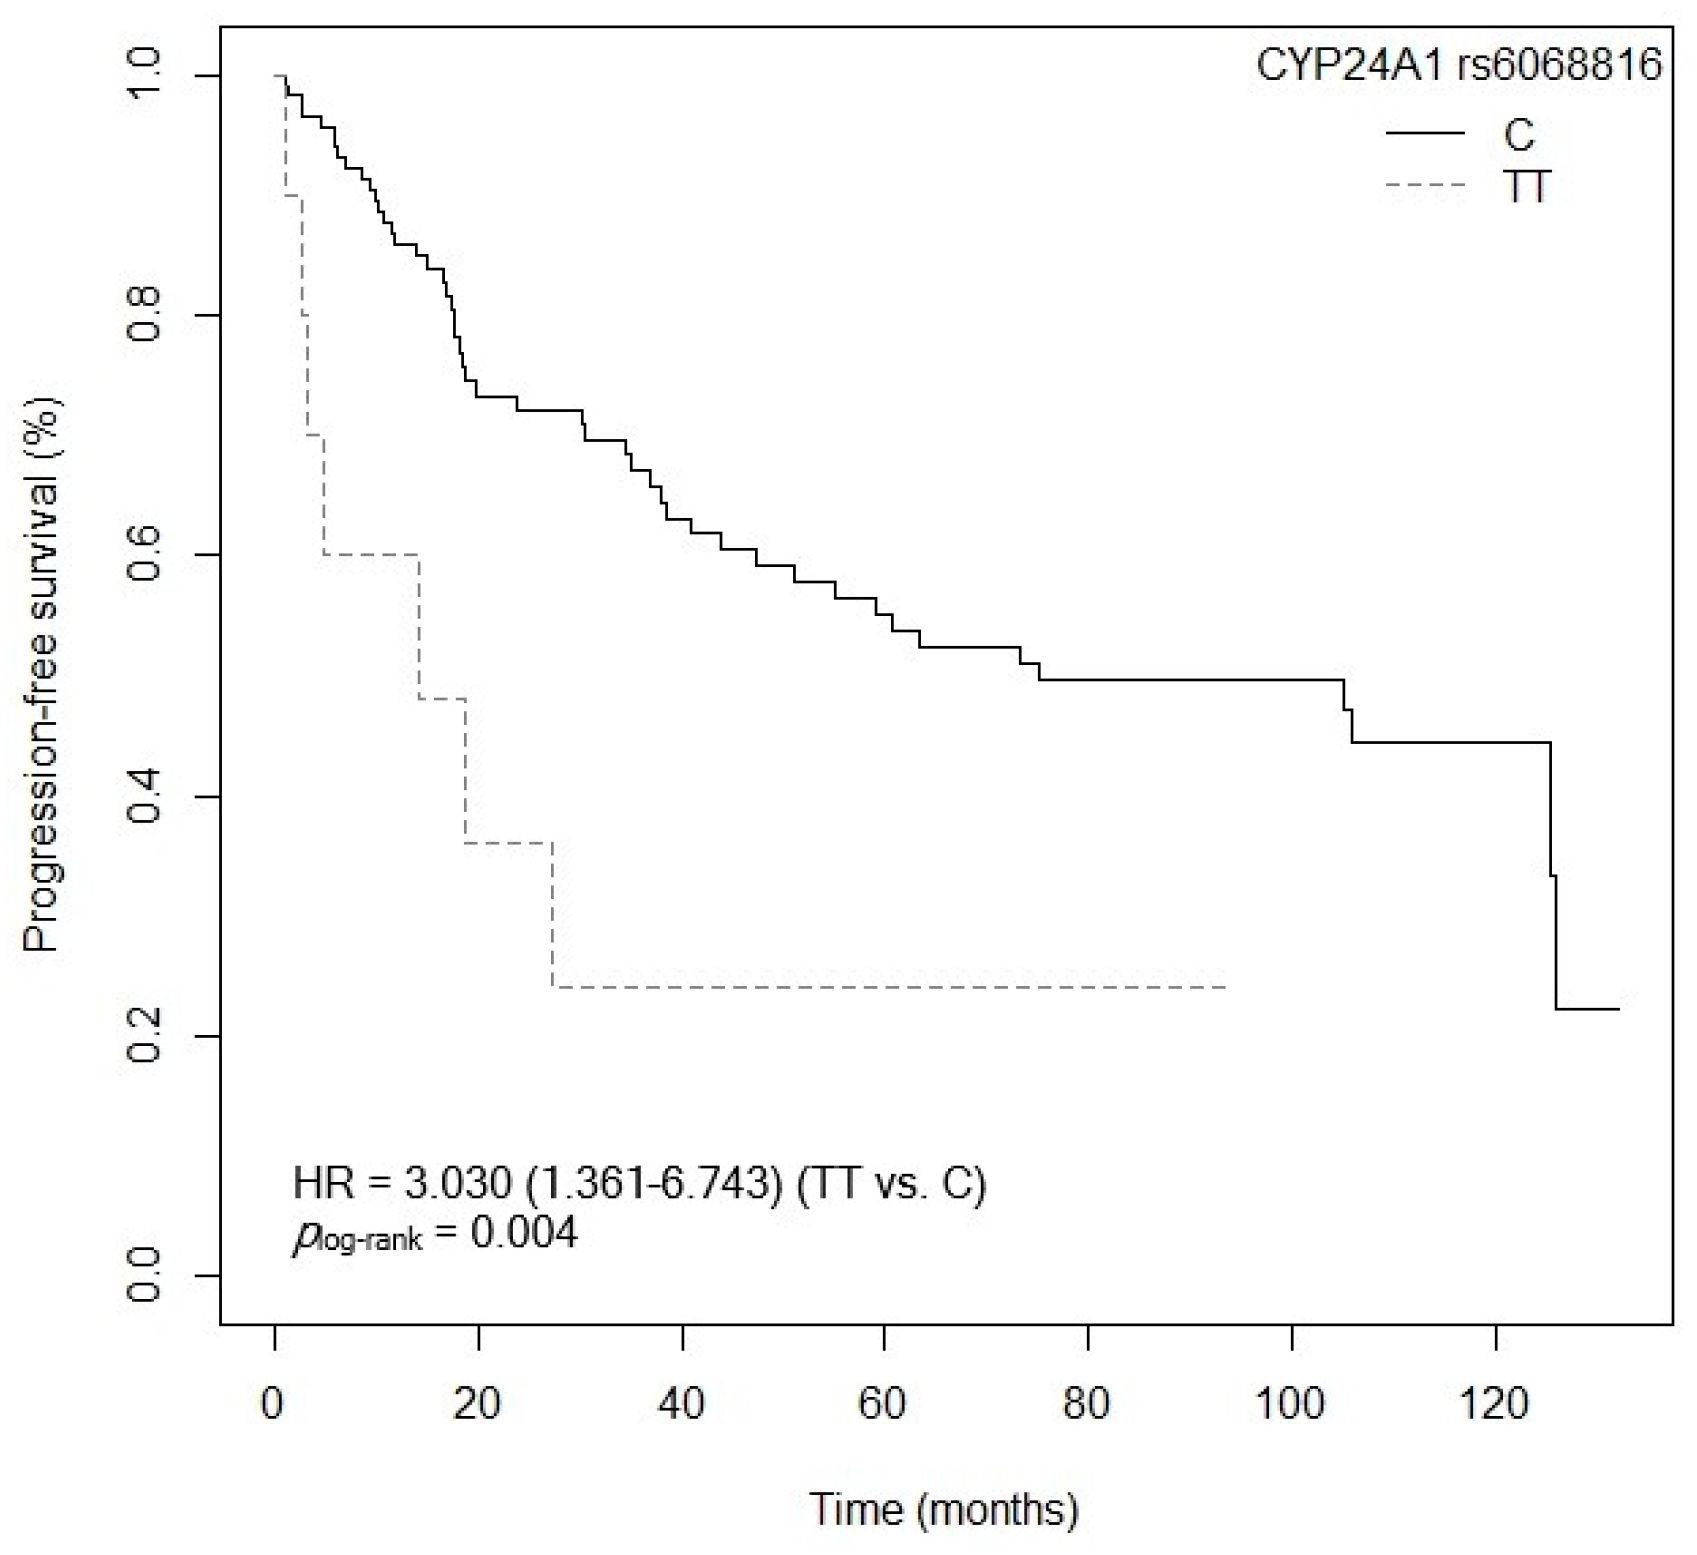
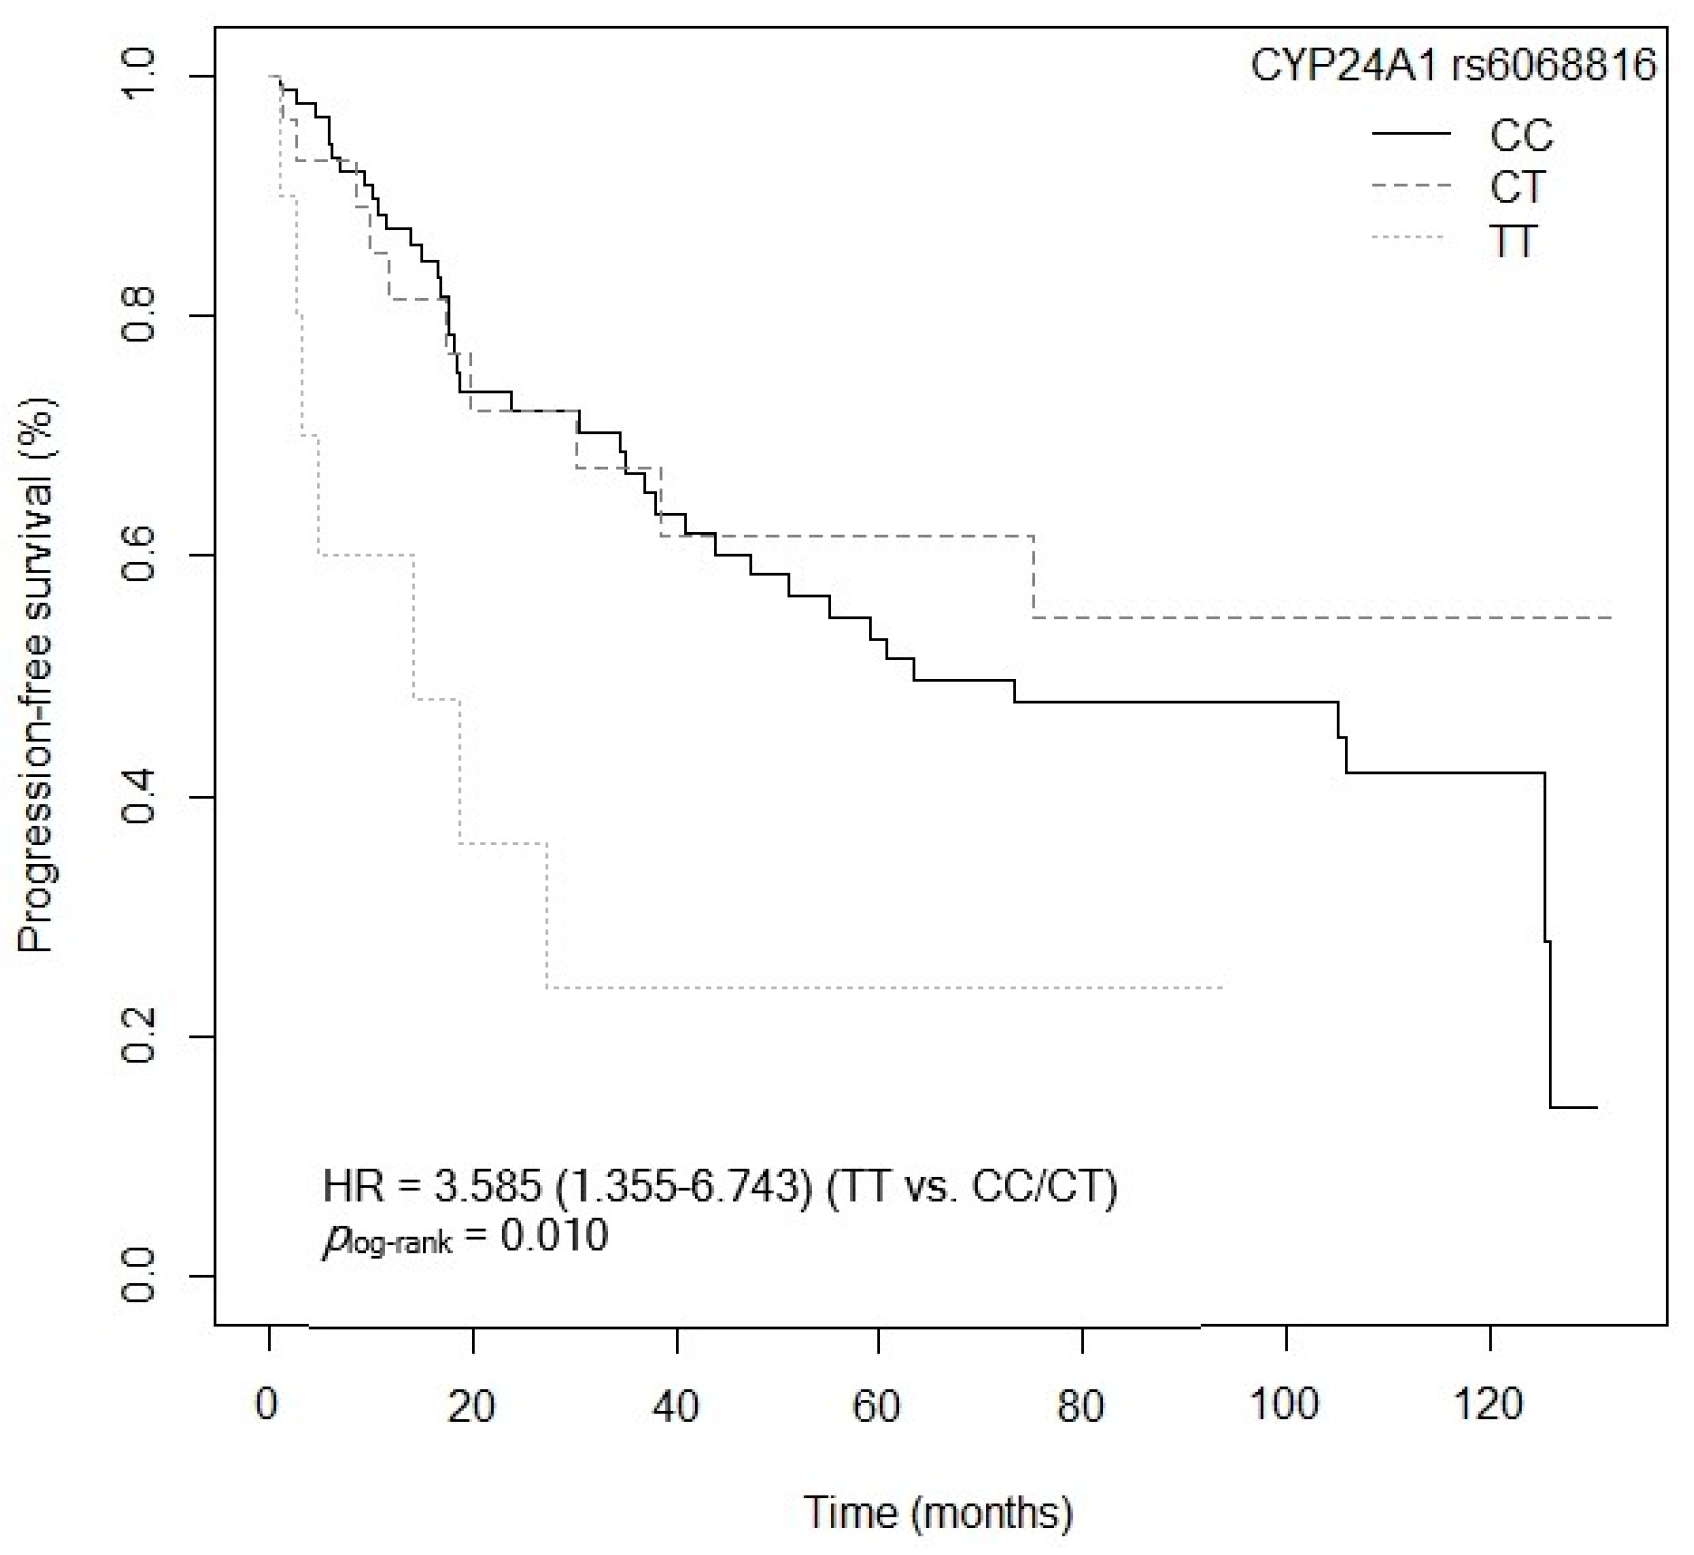
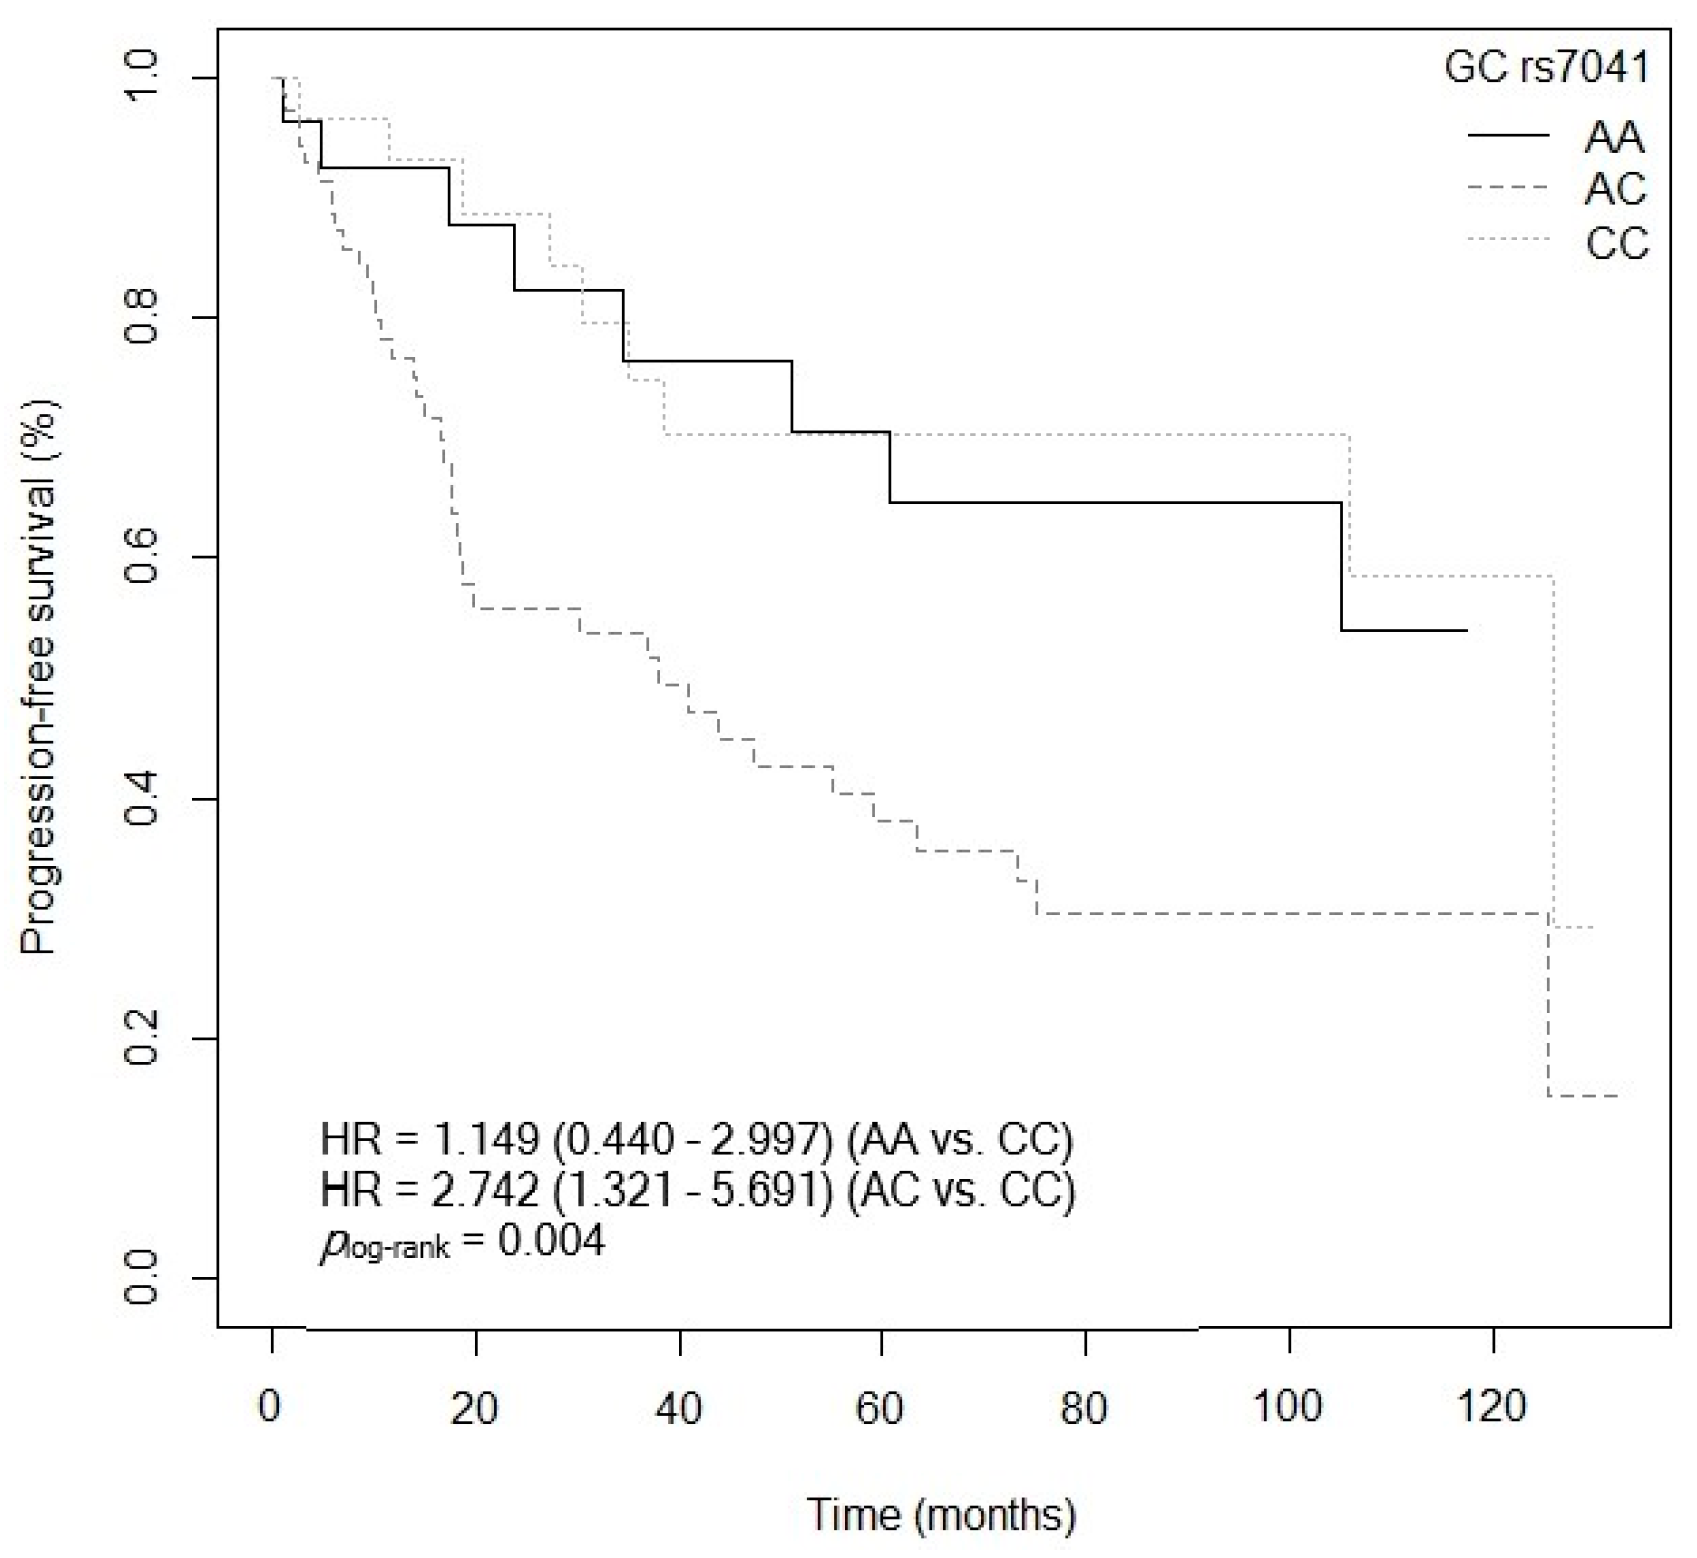
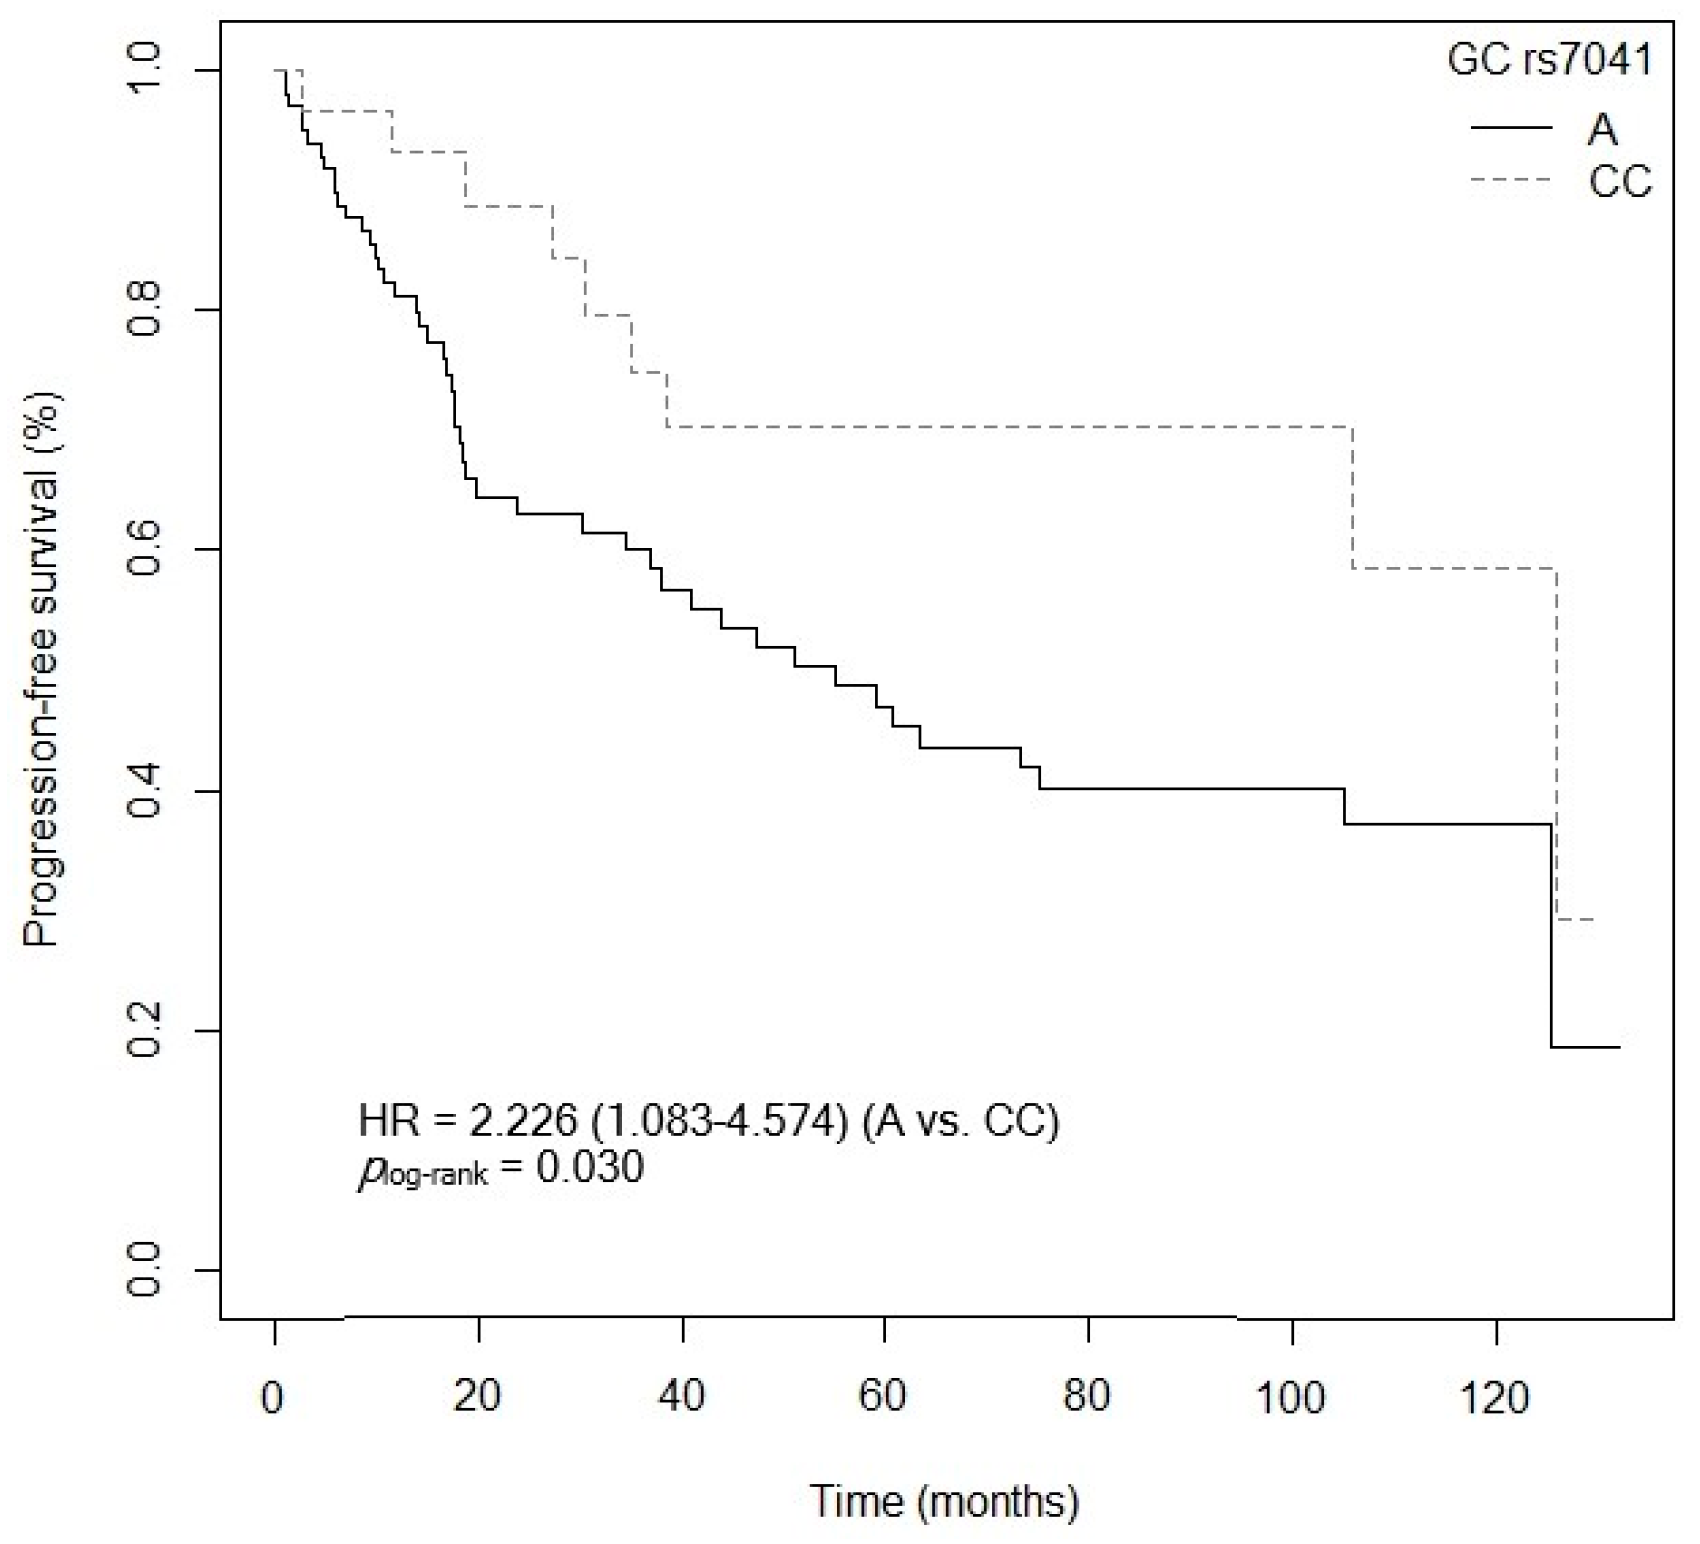
3.4.2. Progression-Free Survival

Three of the five SNPs of the VDR gene analyzed showed an association with PFS after the bivariate analysis was performed. First, patients carrying the VDR rs2228570 (FokI)-GG and AA genotypes showed a higher risk of progression compared to carriers of the VDR rs2228570 (FokI)-AG genotype (GG: p = 0.085, HR = 1.650, 95% CI = 0.934–2.916; AA: p = 0.025, HR = 2.542, 95% CI = 1.126–5.742; Table S13). Figure 9 shows the Kaplan–Meier graph with the PFS curves (plog-rank = 0.050). Median survival was 125.4 months (95% CI = 47.4–NR) for patients carrying the VDR rs2228570 (FokI)-AG genotype, compared to 55.1 months (95% CI = 23.7–NR) and 19.8 months (95% CI = 6.23–NR) for patients carrying the VDR rs2228570 (FokI)-GG and AA genotypes, respectively. Similarly, a tendency was found toward an association between the VDR rs2228570 (FokI)-AA genotype and higher risk of progression, when compared to the VDR rs2228570 (FokI)-G allele (p = 0.072, HR = 1.994, 95% CI = 0.939–4.232; Table S13). The Kaplan–Meier graph with the PFS curves for the VDR rs2228570 (FokI)-AA vs. G allele is shown in Figure 10 (plog-rank = 0.070). Median PFS for patients carrying the VDR rs2228570 (FokI)-G allele was 75.0 months (95% CI = 43.8–NR), compared to 19.8 months (95% CI = 6.23–NR) for patients carrying the VDR rs2228570 (FokI)-AA genotype. Second, the VDR rs7975232 (ApaI) polymorphism was also found to be associated with PFS. The VDR rs7975232 (ApaI)-AA genotype showed a higher risk of progression than the VDR rs7975232 (ApaI)-C allele (p = 0.042, HR = 1.172, 95% CI = 1.019–2.945; Table S13). Figure 11 shows the Kaplan–Meier graph with the PFS curves for this association (plog-rank = 0.040). Patients carrying the VDR rs7975232 (ApaI)-AA genotype had a median PFS of 43.8 months (95% CI = 34.5–NR), compared to 125.9 months (95% CI = 55.1–NR) for carriers of the VDR rs7975232 (ApaI)-C allele. Finally, we found a tendency toward association between the VDR rs731236 (TaqI)-GG genotype and higher risk of progression in our patients, compared to the VDR rs731236 (TaqI)-A allele (p = 0.094, HR = 1.670, 95% CI = 0.916–3.046; Table S13). The Kaplan–Meier graph with the PFS curves for this SNP is shown in Figure 12 (plog-rank = 0.090). Median PFS for subjects carrying the VDR rs731236 (TaqI)-GG genotype was 41.0 months (95% CI = 18.6–NR), compared to 105.0 months (95% CI = 51.1–NR) for carriers of the VDR rs731236 (TaqI)-A allele. Moreover, the CYP24A1 rs6068816-TT genotype showed a higher risk of progression when compared to the CYP24A1 rs6068816-C allele (p = 0.006, HR = 3.030, 95% CI = 1.361–6.743; Table S13). The Kaplan–Meier graph with the PFS curves for this association is shown in Figure 13 (plog-rank = 0.004). Median PFS for subjects with the CYP24A1 rs6068816-C allele was 75 months (95% CI = 47.4–NR), compared to 14.2 months (95% CI = 3.1–NR) for patients carrying the CYP24A1 rs6068816-TT genotype. Furthermore, when the CYP24A1 rs6068816-TT vs. CC/CT genotypes were compared, it was found that patients carrying the CYP24A1 rs6068816-TT genotype showed a higher risk of progression (p = 0.010, HR = 3.585, 95% CI = 1.355–6.743; Table S13) than those with the CYP24A1 rs6068816-CC and CT genotypes. The Kaplan–Meier graph with the PFS curves for this association is shown in Figure 14 (plog-rank = 0.010). Median PFS for subjects with the CYP24A1 rs6068816-CC genotype was 63.3 months (95% CI = 43.8–NR), compared to 14.2 months (95% CI = 3.1–NR) for patients carrying the CYP24A1 rs6068816-TT genotype. Similarly, individuals with the GC rs7041-AC and AA genotypes showed a higher risk of progression when compared to carriers of the GC rs7041-CC genotype (AA: p = 0.777, HR = 1.149, 95% CI = 0.440–2.997; AC: p = 0.007, HR = 2.742; 95% CI = 1.321–5.691; Table S13). The Kaplan–Meier graph with the PFS curves for this SNP is shown in Figure 15 (plog-rank = 0.004). Median PFS for patients with the GC rs7041-CC genotype was 125.9 months (95% CI = 105.8–NR) compared to 55.1 months (95% CI = 37.0–NR) and 38.1 months (95% CI = 18.5–73.3) for carriers of the GC rs7041-AA and AC genotypes, respectively. Furthermore, when the GC rs7041-A allele was analyzed in comparison to the GC rs7041-CC genotype, a higher risk of progression was found in subjects carrying the GC rs7041-A allele (p = 0.029, HR = 2.226, 95% CI = 1.083–4.574; Table S13). The Kaplan–Meier graph with the PFS curves for this association is shown in Figure 16 (plog-rank = 0.030). Median PFS for patients carrying the GC rs7041-CC genotype was 125.9 months (95% CI = 105.8–NR) compared to 55.1 months (95% CI = 37.0–NR) for carriers of the GC rs7041-A allele. The frequencies of VDR and CYP27B1 haplotypes in censored and non-censored patients are shown in Tables S14 and S15, respectively, for haplotype analysis of progression-free survival. Also, the results of Cox regression analysis for haplotypes and progression-free survival showed no significant results in relation to VDR (Table S16) (all p-value > 0.05). As for the CYP27B1 haplotype analysis, only an association analysis could be performed due to its low frequency in our patients. This analysis showed no significant association between the CGGT haplotype and overall survival in our patients (p = 0.927, HRR = 0.98, 95% CI = 0.67–1.44, CGGG vs. CGGT). The Cox regression analysis of PFS adjusted for age of diagnosis, ECOG score (2–4), lymph node involvement, metastasis, stage (IIIB, IV, or IVB), no primary tumor resection and adjuvant chemotherapy showed that the CYP24A1 rs6068816-TT (p < 0.001, HR = 6.095, 95% CI = 2.413–15.388; Table 4) is associated and VDR rs7975232 (ApaI)-AA (p = 0.066, HR = 1.692, 95% CI = 1.402–2.092; Table 4) has a tendency to PFS in our patients (plog-rank < 0.001) (Table 4).

4. Discussion

Various studies have highlighted the possible association of the polymorphisms involved in the vitamin D metabolic pathway with CRC survival, through influencing the disease progression mechanism [15,25,26,27]. One of the molecules that contribute to vitamin D metabolism is VDR, which participates in cell interaction and gene regulation processes [28,29,30]. Currently, several SNPs in the VDR gene that could be related to CRC have been identified [31]. Our study included 127 Caucasian patients (from Spain) diagnosed with CRC. After performing the multivariate analysis, we found a significant association between patients carrying the mutated VDR rs7975232 (ApaI)-AA genotype and lower OS and PFS compared to carriers of the rs7975232 (ApaI)-C allele. In line with our results, we found a meta-analysis conducted in 1588 patients of various ethnicities (from the United States, Taiwan, and China) diagnosed with cancer, in which the VDR rs7975232 (ApaI)-AA genotype was associated with lower overall survival (p = 0.0001, HR = 1.77, 95% CI = 0.79–2.75, I2 = 0.95; AA vs. CC), as well as with an increased risk of progression of the disease in patients (p < 0.05, HR = 1.29, 95% CI = 1.02–1.56, I2 = 0; AA vs. CC) [14]. For the VDR rs731236 (TaqI) SNP, our results showed a tendency toward an association between carriers of the VDR rs731236 (TaqI)-GG genotype and lower OS and PFS compared to those carrying the wild-type VDR rs731236 (TaqI)-A allele. A study conducted in 1759 Caucasian patients (from Germany) diagnosed with breast cancer showed that the mutated homozygous genotype VDR rs731236 (TaqI)-GG had three times more risk of death from the disease than the VDR rs731236 (TaqI)-AA genotype in the study cohort (ptrend = 0.023, HR = 2.80, 95% CI = 1.10–7.20; GG vs. AA) [32]. In contrast to our results, a study carried out in 893 Caucasian patients (from Italy) diagnosed with metastatic CRC under treatment with various chemotherapy regimens (FOLFIRI + cetuximab [n = 278]/bevacizumab [n = 522]/irinotecan ± cetuximab [n = 93]) showed that for the FOLFIRI + bevacizumab cohort, OS was lower in patients carrying the VDR rs731236 (TaqI)-AA/AG genotypes (23.7 vs. 28.8 months, p = 0.046, HR = 0.62, 95% CI = 0.39–0.99; GG vs. AA/AG) [33]. Another of the VDR SNPs that have been investigated is VDR rs2228570 (FokI). Specifically, the wild-type VDR rs2228570 (FokI)-AA genotype was found to be associated with lower PFS when compared to the VDR rs2228570 (FokI)-GG and AG genotypes. A study conducted by Fedirko et al. in 1095 Caucasian patients (from Europe) diagnosed with CRC found no significant association between this SNP and cancer survival in the patients analyzed (p = 0.270, HR = 0.81, 95% CI = 0.60–1.10) [34]. Another study performed in Caucasian patients (294 cases) (from the United States) diagnosed with advanced non-small-cell lung cancer (NSCLC) showed that carriers of the VDR rs2228570 (FokI)-AA and AG genotypes had a higher risk of death (p = 0.040, HR = 1.32, 95% CI = 0.98–1.77; AG vs. GG and p = 0.04, HR = 1.41, 95% CI = 0.96–2.07; AA vs. GG) [35]. As for the VDR rs11568820 (Cdx2) SNP, a clinical trial in 155 Asian patients (from Japan) diagnosed with NSCLC showed that individuals carrying the VDR rs11568820 (Cdx2)-TT/CT genotypes showed higher OS after 5 years (p = 0.040, HR = 0.41, 95% CI = 0.18–0.97; TT/CT vs. CC) [36]. In contrast to these results, another study in 194 Caucasian patients (from Spain) diagnosed with NSCLC associated the VDR rs11568820 (Cdx2)-TT genotype with lower overall survival in the patients (p = 0.013, HR = 7.43, 95% CI =1.53–36.15; TT vs. CC/CT) [25]. In our study, however, we found no association between this polymorphism and the survival of the patients included in the cohort. The last SNP included in this study of the VDR gene is VDR rs1544410 (BsmI). A meta-analysis that included 44,165 Caucasian patients (from the United Kingdom), from 64 studies, diagnosed with cancer, associated the mutated genotypes VDR rs1544410 (BsmI)-TT and CT with lower patient survival compared to the wild-type VDR rs1544410 (BsmI)-CC genotype (p < 0.050, HR=1.40, 95% CI = 1.05–1.75, I2 = 0.85; TT/CT vs. CC) [14]. In our study, we found no significant results between the VDR rs1544410 (BsmI) SNP and OS and PFS in CRC. The results obtained after analysis of the SNPs located in VDR show an association between the altered alleles and lower survival in CRC. These polymorphisms could give rise to a modified receptor, affecting its interaction with vitamin D [37]. Both vitamin D metabolism and the actions of the VDR would therefore be reduced, which could favor tumor progression [37,38,39].
The CYP24A1 gene, located on the long arm of chromosome 20 (20q13.2), encodes the 24-hydroxylase enzyme, responsible for catalyzing calcitriol in its inactive forms [40]. There are currently few studies that examine the relationship between the CYP24A1 rs6068816 and rs4809957 SNPs and CRC, with contradictory results [41,42]. As regards the CYP24A1 rs6068816 SNP, our study has shown an association between the mutated genotype CYP24A1 rs6068816-TT and low OS and PFS values after the multivariate analysis, compared to the CYP24A1 rs6068816-C allele. Along the same lines, a study carried out in 146 Caucasian patients (from Spain) diagnosed with NSCLC associated the CYP24A1 rs6068816-TT genotype with lower survival (p = 0.005, HR = 3.75, 95% CI = 1.49–9.41; TT vs. C) and greater progression of the disease in non-resected patients (p = 0.018, HR = 2.99, 95% CI = 1.21–7.45; TT vs. C) [25]. On the other hand, Gong et al. showed that the wild-type AA genotype of the CYP24A1 rs4809957 SNP conferred a worse CRC prognosis in an Asian population (524 cases/595 controls) (p < 0.050, HR = 2.38, 95% CI = 1.30–4.37; AA vs. GG) [43]. However, in our study we found no significant association between CYP24A1 rs4809957 and OS and PFS. The CYP24A1 rs4809957 and rs6068816 SNPs, located in intronic regions, could affect the mRNA splicing process in transcription and translation [43]. Specifically, these SNPs have been related to increased expression of CYP24A, and therefore a larger quantity of enzyme [44]. This would result in an increase in enzyme activity and greater metabolization of calcitriol, reducing its plasma levels as well as its antineoplastic activity [41]. Patients carrying mutated alleles could therefore have a worse prognosis in respect of CRC survival [41,44,45].
Another of the enzymes involved in the vitamin D metabolic pathway is CYP27B1, which catalyzes the conversion of 25-hydroxyvitamin D into its active form (1,25-dihydroxyvitamin D) in the liver [11]. In the gene responsible for encoding this enzyme, some polymorphisms have been found that could influence its synthesis and function. However, in our study we did not find any association between the SNPs studied in the CYP27B1 gene and survival in CRC. In line with our results, a study conducted in 893 Caucasian patients (from Italy and the United States) diagnosed with metastatic CRC found no association between the CYP27B1 rs703842 SNP and OS (p = 0.940) and PFS (p = 0.280) in its patients [33]. As for the CYP27B1 rs3782130 SNP, this was previously studied in patients with NSCLC without finding any association with overall survival [25,46]. Gong et al. carried out a study in Asian patients (from China) diagnosed with CRC (528 cases/605 controls) in which they associated the wild-type CYP27B1 rs4646536-AA genotype with a worse disease prognosis (plog-rank = 0.010; AA vs. GG and AG) [43]. On CYP27B1 rs10877012, a study conducted in 542 Asian patients (from China) diagnosed with NSCLC found no association between CYP27B1 rs10877012 and OS (p = 0.695; GG/TG vs. TT) [46]. Some studies have associated greater expression of the CYP27B1 gene, as well as greater histological differentiation of the tumor, with an increase in OS in patients diagnosed with lung cancer; however, this mechanism is not entirely clear [47,48].
One of the main metabolites in the vitamin D pathway is calcidiol, which is synthesized by 25-hydroxylase. This enzyme is encoded by the CYP2R1 gene, located in the 11p15.2 region [49]. In our study, we did not find an association between the CYP2R1 rs10741657 SNP and CRC survival. In line with our results, a study in 194 Caucasian patients (from Spain) diagnosed with NSCLC found no association when it investigated this SNP and OS (p > 0.050) [25]. Some studies have related the mutated genotype CYP2R1 rs10741657-GG to alterations in vitamin D plasma levels and a worse cancer prognosis, due to malfunctioning of the 25-hydroxylase enzyme caused by this SNP [50,51].
The VDBP peptide sequence consists of 458 amino acids, arranged in three domains (I, II, and III), which can be glycosylated to a variable degree depending on various SNPs [52]. The GC gene, located on chromosome 4, responsible for synthesizing it, has a SNP, GC rs7041, located on exon 11 (which encodes domain III), that could be involved in the formation of the three main types of VDBP (GCF, GCS, and GC2) [52]. Our results show that individuals carrying the mutated allele GC rs7041-C have lower OS compared to those carrying the GC rs7041-AA genotype. Moreover, OS and PFS were lower in patients with the GC rs7041-AC genotype. In line with our results is the project carried out by Pibiri et al. in a Caucasian and African American population (from the United States) diagnosed with CRC (961 cases/838 controls), in which it was observed that the GC rs7041-C allele was associated with a worse CRC prognosis, affecting survival unfavorably (p = 0.059, HR = 0.77, 95% CI = 0.58–1.01; AA vs. C) [53]. The presence of the mutated allele GC rs7041-C could give rise to altered VDBP molecules or to a reduction in its synthesis and lower plasma levels [52,54]. Consequently, the transport of active vitamin D metabolites, and therefore vitamin D levels, could be impaired [52,54]. The disruption of this transport mechanism could be one of the causes of worse CRC prognosis in our patients [52,54,55].
This is the first study in which the VDR rs11568820 (Cdx2), CYP24A1 rs6068816, and CYP2R1 rs10741657 SNPs are related to survival in patients with CRC. One of its strengths is that it was conducted in a cohort of patients diagnosed with CRC at the same hospital, following the same protocols, ensuring the uniformity of the study population. However, the inconsistency of our results with the ones reported from some prior studies might be due to the number of patients included in the study cohorts and the different origins of the participants. Thus, future studies with larger cohorts are needed to establish and be able to detect other variants related to CRC survival. We can therefore state that we found an association between the SNPs involved in the mechanism of action of vitamin D and OS and PFS in CRC. Specifically, our results could suggest that the VDR rs7975232 (Apal), VDR rs731236 (TaqI), VDR rs2228570 (FokI), CYP24A1 rs6068816, and GC rs7041 SNPs could act as predictors of survival in patients diagnosed with CRC. Validation of these SNPs in an independent cohort are needed to be used, in the future, as predictive biomarkers for the prognosis of the disease.

5. Conclusions

The VDR rs7975232 (ApaI)-AA as well as GC rs7041-C and CYP24A1 rs6068816-TT polymorphisms could be a risk factor for lower OS as well as CYP24A1 rs6068816-TT for PFS in Caucasian patients diagnosed with CRC; however, further research performed in higher populations is needed to demonstrate it. Moreover, patients carrying the VDR rs2228570 (FokI) SNP could have lower PFS. We did not find any relationship between the CYP2R1 rs10741657, CYP27B1 rs10877012, CYP27B1 rs4646536, CYP27B1 rs3782130, CYP27B1 rs703842, CYP24A1 rs4809957, VDR rs1544410 (BsmI), or VDR rs11568820 (Cdx2) SNPs and CRC survival.

Supplementary Materials

The following supporting information can be downloaded at: https://www.mdpi.com/article/10.3390/cancers15164077/s1, Figure S1: Diagram of vitamin D metabolic pathway; Figure S2: Kaplan–Meier plot OS global; Figure S3: Kaplan–Meier plot PFS global; Figure S4: Kaplan–Meier plot of overall survival curves with family history of CRC in 127 patients with CRC; Figure S5: Kaplan–Meier plot of overall survival curves with ECOG score in 127 patients with CRC; Figure S6: Kaplan–Meier plot overall survival curves with metastasis in 127 patients with CRC; Figure S7: Kaplan–Meier plot of overall survival curves with stage in 127 patients with CRC; Figure S8: Kaplan–Meier plot of overall survival curves with number of lymph node involvement in 127 patients with CRC; Figure S9: Kaplan–Meier plot of overall survival with adjuvant chemotherapy in 127 patients with CRC; Figure S10: Kaplan–Meier plot of progression-free survival curves with ECOG score in 127 patients with CRC; Figure S11: Kaplan–Meier plot of progression-free survival curves with lymph node involvement in 127 patients with CRC; Figure S12: Kaplan–Meier plot of progression-free survival curves with metastasis in 127 patients with CRC; Figure S13: Kaplan–Meier plot of progression-free survival curves with stage in 127 patients with CRC; Figure S14: Kaplan–Meier plot of progression-free survival curves with number of lymph node involvement in 127 patients with CRC; Figure S15: Kaplan–Meier plot of progression-free survival curves with surgery in 127 patients with CRC; Figure S16: Kaplan–Meier plot of progression-free survival curves with adjuvant chemotherapy in 127 patients with CRC; Figure S17: Kaplan–Meier plot of progression-free survival curves with family history of CRC in 127 patients with CRC; Table S1: Influence of clinical–pathological characteristics on overall survival of 127 CRC patients; Table S2: Influence of clinical–pathological characteristics on progression-free survival of 127 CRC patients; Table S3: Minor allele frequencies of SNPs; Table S4: Hardy–Weinberg Equilibrium (OS); Table S5: Hardy–Weinberg Equilibrium (PFS); Table S6: Linkage disequilibrium of SNPs; Table S7: Frequencies of the VDR haplotypes in 127 CRC patients; Table S8: Frequencies of the CYP27B1 haplotypes in 127 CRC patients; Table S9: Influence of gene polymorphisms on overall survival of 127 CRC patients; Table S10: Distribution of VDR haplotypes in overall survival in 127 CRC patients (censored/uncensored); Table S11: Distribution of CYP27B1 haplotypes in overall survival in 127 CRC patients (censored/uncensored); Table S12: Associations between VDR haplotypes and overall survival in 127 CRC patients; Table S13: Influence of gene polymorphisms on progression-free survival of 127 CRC patients; Table S14: Distribution of VDR haplotypes in progression-free survival in 127 CRC patients (censored/uncensored); Table S15: Distribution of CYP27B1 haplotypes in progression-free survival in 127 CRC patients (censored/uncensored); Table S16: Associations between VDR haplotypes and progression-free survival in 127 CRC patients.

Author Contributions

Conceptualization, C.P.-D. and C.P.-R.; methodology, C.P.-D. and Y.C.; software, N.M.-P. and J.M.G.-N.; validation, S.R.-T., Y.C. and L.E.P.-L.; formal analysis, N.M.-P., S.R.-T. and L.E.P.-L.; investigation, C.P.-D. and J.M.G.-N.; resources, C.P.-D. and J.M.V.-d.-M.; data curation, N.M.-P. and J.M.G.-N.; writing—original draft preparation, C.P.-D. and C.G.-C.; writing—review and editing, N.M.-P. and J.M.G.-N.; visualization, M.d.M.M.-M.; supervision, M.R.-T. and J.M.V.-d.-M.; project administration, A.J.-M. and C.P.-R.; funding acquisition, A.J.-M. All authors have read and agreed to the published version of the manuscript.

Funding

ERDF funds (EU) from the Instituto de Salud Carlos III (PT13/0010/0039) supported by co-funding grants from the Biobank of the University Hospital Virgen de las Nieves.

Institutional Review Board Statement

The study was conducted in accordance with the Declaration of Helsinki, and approved by the Ethics and Research Committee of the Sistema Andaluz de Salud (protocol code: 1322-N-20, approved on 29 April 2021).

Informed Consent Statement

Informed consent was obtained from all subjects involved in the study. Written informed consent has been obtained from the patients to publish this paper.

Data Availability Statement

Data unavailable due to privacy and ethical restrictions.

Acknowledgments

The results of this study are part of the doctoral dissertation presented by Carmen Pérez Durán at the University of Granada.

Conflicts of Interest

The authors declare no conflict of interest.

References

  1. Ferlay, J.; Colombet, M.; Soerjomataram, I.; Parkin, D.M.; Piñeros, M.; Znaor, A.; Bray, F. Cancer statistics for the year 2020: An overview. Int. J. Cancer 2021, 149, 778–789. [Google Scholar] [CrossRef]
  2. Siegel, R.L.; Wagle, N.S.; Cercek, A.; Smith, R.A.; Jemal, A. Colorectal cancer statistics, 2023. CA A Cancer J. Clin. 2023, 73, 233–254. [Google Scholar] [CrossRef] [PubMed]
  3. Meester, R.G.S.; Peterse, E.F.P.; Knudsen, A.B.; de Weerdt, A.C.; Chen, J.C.; Lietz, A.P.; Dwyer, A.; Ahnen, D.J.; Siegel, R.L.; Smith, R.A.; et al. Optimizing colorectal cancer screening by race and sex: Microsimulation analysis II to inform the American Cancer Society colorectal cancer screening guideline. Cancer 2018, 124, 2974–2985. [Google Scholar] [CrossRef] [PubMed]
  4. Simon, K.; Balchen, V. Colorectal cancer development and advances in screening. Clin. Interv. Aging 2016, 11, 967–976. [Google Scholar] [CrossRef] [PubMed] [Green Version]
  5. Song, M.; Garrett, W.S.; Chan, A.T. Nutrients, Foods, and Colorectal Cancer Prevention. Gastroenterology 2015, 148, 1244–1260.e16. [Google Scholar] [CrossRef] [Green Version]
  6. Takeshige, N.; Yin, G.; Ohnaka, K.; Kono, S.; Ueki, T.; Tanaka, M.; Maehara, Y.; Okamura, T.; Ikejiri, K.; Maekawa, T.; et al. Associations between Vitamin D Receptor (VDR) Gene Polymorphisms and Colorectal Cancer Risk and Effect Modifications of Dietary Calcium and Vitamin D in a Japanese Population. Asian Pac. J. Cancer Prev. 2015, 16, 2019–2026. [Google Scholar] [CrossRef] [Green Version]
  7. Feldman, D.; Krishnan, A.V.; Swami, S.; Giovannucci, E.; Feldman, B.J. The role of vitamin D in reducing cancer risk and progression. Nat. Rev. Cancer 2014, 14, 342–357. [Google Scholar] [CrossRef]
  8. Mahendra, A.; Karishma; Choudhury, B.K.; Sharma, T.; Bansal, N.; Bansal, R.; Gupta, S. Vitamin D and gastrointestinal cancer. J. Lab. Physician 2018, 10, 1–5. [Google Scholar] [CrossRef]
  9. Mondul, A.M.; Weinstein, S.J.; Layne, T.M.; Albanes, D. Vitamin D and Cancer Risk and Mortality: State of the Science, Gaps, and Challenges. Epidemiol. Rev. 2017, 39, 28–48. [Google Scholar] [CrossRef] [Green Version]
  10. Nasiri, H.; Forouzandeh, M.; Rasaee, M.; Rahbarizadeh, F. Modified salting-out method: High-yield, high-quality genomic DNA extraction from whole blood using laundry detergent. J. Clin. Lab. Anal. 2005, 19, 229–232. [Google Scholar] [CrossRef]
  11. Christakos, S.; Dhawan, P.; Verstuyf, A.; Verlinden, L.; Carmeliet, G. Vitamin D: Metabolism, Molecular Mechanism of Action, and Pleiotropic Effects. Physiol. Rev. 2016, 96, 365–408. [Google Scholar] [CrossRef] [PubMed] [Green Version]
  12. Wang, X.; Wang, D.; Liu, J.; Feng, M.; Wu, X. A novel CpG-methylation-based nomogram predicts survival in colorectal cancer. Epigenetics 2020, 15, 1213–1227. [Google Scholar] [CrossRef] [PubMed]
  13. Yu, K.; Yang, J.; Jiang, Y.; Song, R.; Lu, Q. Vitamin D Receptor BsmI Polymorphism and Colorectal Cancer Risk: An Updated Analysis. Asian Pac. J. Cancer Prev. 2014, 15, 4801–4807. [Google Scholar] [CrossRef] [Green Version]
  14. Vaughan-Shaw, P.G.; O’Sullivan, F.; Farrington, S.M.; Theodoratou, E.; Campbell, H.; Dunlop, M.G.; Zgaga, L. The impact of vitamin D pathway genetic variation and circulating 25-hydroxyvitamin D on cancer outcome: Systematic review and meta-analysis. Br. J. Cancer 2017, 116, 1092–1110. [Google Scholar] [CrossRef]
  15. Ferrer-Mayorga, G.; Larriba, M.J.; Crespo, P.; Muñoz, A. Mechanisms of action of vitamin D in colon cancer. J. Steroid Biochem. Mol. Biol. 2019, 185, 1–6. [Google Scholar] [CrossRef] [PubMed]
  16. Zgaga, L.; Theodoratou, E.; Farrington, S.M.; Din, F.V.N.; Ooi, L.Y.; Glodzik, D.; Johnston, S.; Tenesa, A.; Campbell, H.; Dunlop, M.G. Plasma Vitamin D Concentration Influences Survival Outcome After a Diagnosis of Colorectal Cancer. J. Clin. Oncol. 2014, 32, 2430–2439. [Google Scholar] [CrossRef]
  17. Thakkinstian, A.; McEvoy, M.; Minelli, C.; Gibson, P.; Hancox, B.; Duffy, D.; Thompson, J.; Hall, I.; Kaufman, J.; Leung, T.-F.; et al. Systematic Review and Meta-Analysis of the Association between β2-Adrenoceptor Polymorphisms and Asthma: A HuGE Review. Am. J. Epidemiol. 2005, 162, 201–211. [Google Scholar] [CrossRef] [Green Version]
  18. Weiss, J.M.; Gupta, S.; Burke, C.A.; Axell, L.; Chen, L.-M.; Chung, D.C.; Clayback, K.M.; Dallas, S.; Felder, S.; Gbolahan, O.; et al. NCCN Guidelines® Insights: Genetic/Familial High-Risk Assessment: Colorectal.; Version 1.2021: Featured Updates to the NCCN Guidelines. J. Natl. Compr. Cancer Netw. 2021, 19, 1122–1132. [Google Scholar] [CrossRef]
  19. Ochoa Mangado, E.; Madoz-Gúrpide, A.; Vicente Muelas, N. Diagnóstico y tratamiento de la dependencia de alcohol. Med. Segur. Trab. 2009, 55, 26–40. [Google Scholar] [CrossRef] [Green Version]
  20. Edge, S.B.; Byrd, D.R.; Compton, C.C.; Fritz, A.G.; Greene, F.L.; Trotti, A. AJCC Cancer Staging Manual, 7th ed.; Springer: New York, NY, USA, 2010; pp. 347–376. ISBN 978-0-387-88440-0. [Google Scholar]
  21. R Core Team. R: A Language and Environment for Statistical Computing; R Foundation for Statistical Computing: Vienna, Austria, 2013; ISBN 3-900051-07-0. Available online: http://www.R-project.org/ (accessed on 25 April 2023).
  22. Purcell, S.; Neale, B.; Todd-Brown, K.; Thomas, L.; Ferreira, M.A.R.; Bender, D.; Maller, J.; Sklar, P.; de Bakker, P.I.W.; Daly, M.J.; et al. PLINK: A Tool Set for Whole-Genome Association and Population-Based Linkage Analyses. Am. J. Hum. Genet. 2007, 81, 559–575. [Google Scholar] [CrossRef] [Green Version]
  23. Barrett, J.C.; Fry, B.; Maller, J.; Daly, M.J. Haploview: Analysis and visualization of LD and haplotype maps. Bioinformatics 2005, 21, 263–265. [Google Scholar] [CrossRef] [PubMed] [Green Version]
  24. Tregouet, D.-A.; Tiret, L. Cox proportional hazards survival regression in haplotype-based association analysis using the Stochastic-EM algorithm. Eur. J. Hum. Genet. 2004, 12, 971–974. [Google Scholar] [CrossRef] [PubMed] [Green Version]
  25. Pineda Lancheros, L.E.; Pérez Ramírez, C.; Sánchez Martín, A.; Gálvez Navas, J.M.; Martínez Martínez, F.; Ramírez Tortosa, M.C.; Jiménez Morales, A. Impact of Genetic Polymorphisms on the Metabolic Pathway of Vitamin D and Survival in Non-Small Cell Lung Cancer. Nutrients 2021, 13, 3783. [Google Scholar] [CrossRef] [PubMed]
  26. He, Y.; Timofeeva, M.; Zhang, X.; Xu, W.; Li, X.; Din, F.V.N.; Svinti, V.; Farrington, S.M.; Campbell, H.; Dunlop, M.G.; et al. Colorectal cancer risk variants rs10161980 and rs7495132 are associated with cancer survival outcome by a recessive mode of inheritance. Int. J. Cancer 2021, 148, 2774–2778. [Google Scholar] [CrossRef]
  27. Song, N.; Kim, K.; Shin, A.; Park, J.W.; Chang, H.J.; Shi, J.; Cai, Q.; Kim, D.Y.; Zheng, W.; Oh, J.H. Colorectal cancer susceptibility loci and influence on survival. Genes Chromosom. Cancer 2018, 57, 630–637. [Google Scholar] [CrossRef]
  28. Dou, R.; Ng, K.; Giovannucci, E.L.; Manson, J.E.; Qian, Z.R.; Ogino, S. Vitamin D and colorectal cancer: Molecular, epidemiological and clinical evidence. Br. J. Nutr. 2016, 115, 1643–1660. [Google Scholar] [CrossRef] [Green Version]
  29. Jeon, S.-M.; Shin, E.-A. Exploring vitamin D metabolism and function in cancer. Exp. Mol. Med. 2018, 50, 1–14. [Google Scholar] [CrossRef] [Green Version]
  30. Latacz, M.; Rozmus, D.; Fiedorowicz, E.; Snarska, J.; Jarmołowska, B.; Kordulewska, N.; Savelkoul, H.; Cieślińska, A. Vitamin D Receptor (VDR) Gene Polymorphism in Patients Diagnosed with Colorectal Cancer. Nutrients 2021, 13, 200. [Google Scholar] [CrossRef]
  31. Zmuda, J.M.; Cauley, J.A.; Ferrell, R.E. Molecular Epidemiology of Vitamin D Receptor Gene Variants. Epidemiol. Rev. 2000, 22, 203–217. [Google Scholar] [CrossRef] [Green Version]
  32. Perna, L.; Butterbach, K.; Haug, U.; Schöttker, B.; Müller, H.; Arndt, V.; Holleczek, B.; Burwinkel, B.; Brenner, H. Vitamin D Receptor Genotype rs731236 (Taq1) and Breast Cancer Prognosis. Cancer Epidemiol. Biomark. Prev. 2013, 22, 437–442. [Google Scholar] [CrossRef] [Green Version]
  33. Berger, M.D.; Stintzing, S.; Heinemann, V.; Cao, S.; Yang, D.; Sunakawa, Y.; Matsusaka, S.; Ning, Y.; Okazaki, S.; Miyamoto, Y.; et al. A Polymorphism within the Vitamin D Transporter Gene Predicts Outcome in Metastatic Colorectal Cancer Patients Treated with FOLFIRI/Bevacizumab or FOLFIRI/Cetuximab. Clin. Cancer Res. 2018, 24, 784–793. [Google Scholar] [CrossRef] [PubMed] [Green Version]
  34. Fedirko, V.; Riboli, E.; Tjønneland, A.; Ferrari, P.; Olsen, A.; Bueno-De-Mesquita, H.B.; van Duijnhoven, F.J.; Norat, T.; Jansen, E.H.; Dahm, C.C.; et al. Prediagnostic 25-Hydroxyvitamin D, VDR and CASR Polymorphisms, and Survival in Patients with Colorectal Cancer in Western European Populations. Cancer Epidemiol. Biomark. Prev. 2012, 21, 582–593. [Google Scholar] [CrossRef] [PubMed]
  35. Heist, R.S.; Zhou, W.; Wang, Z.; Liu, G.; Neuberg, D.; Su, L.; Asomaning, K.; Hollis, B.W.; Lynch, T.J.; Wain, J.C.; et al. Circulating 25-Hydroxyvitamin D, VDR Polymorphisms, and Survival in Advanced Non–Small-Cell Lung Cancer. J. Clin. Oncol. 2008, 26, 5596–5602. [Google Scholar] [CrossRef] [Green Version]
  36. Akiba, T.; Morikawa, T.; Odaka, M.; Nakada, T.; Kamiya, N.; Yamashita, M.; Yabe, M.; Inagaki, T.; Asano, H.; Mori, S.; et al. Vitamin D Supplementation and Survival of Patients with Non–small Cell Lung Cancer: A Randomized, Double-Blind, Placebo-Controlled Trial. Clin. Cancer Res. 2018, 24, 4089–4097. [Google Scholar] [CrossRef] [Green Version]
  37. Chakraborty, M.; Arora, M.; Ramteke, A.; Yadav, V.; Naaz, H.; Muntakhab, M.; Tripathi, P.; Chandran, K.N. FokI polymorphism of Vitamin D receptor gene and deficiency of serum Vitamin D increases the risk of breast cancer in North Indian women. Endocrine 2023, 81, 168–174. [Google Scholar] [CrossRef]
  38. Nam, S.E.; Jin, T.; Park, K.S.; Saindane, M.; Noh, W.C.; Yoo, Y.B.; Park, W.S.; Yun, I.J. Vitamin D receptor (VDR) mRNA overexpression is associated with poor prognosis in breast carcinoma. Ann. Surg. Treat. Res. 2022, 103, 183–194. [Google Scholar] [CrossRef]
  39. Messaritakis, I.; Koulouridi, A.; Boukla, E.; Sfakianaki, M.; Vogiatzoglou, K.; Karagianni, M.; Gouvas, N.; Tsiaoussis, J.; Xynos, E.; Athanasakis, E.; et al. Investigation of Microbial Translocation, TLR and VDR Gene Polymorphisms, and Recurrence Risk in Stage III Colorectal Cancer Patients. Cancers 2022, 14, 4407. [Google Scholar] [CrossRef]
  40. Wang, P.; Zhang, H.; Zhang, Z.; Qin, L.; Li, B. Association of the CYP24A1-rs2296241 polymorphism of the vitamin D catabolism enzyme with hormone-related cancer risk: A meta-analysis. OncoTargets Ther. 2015, 8, 1175–1183. [Google Scholar] [CrossRef] [Green Version]
  41. Chen, X.-Q.; Mao, J.-Y.; Li, W.-B.; Li, J.; Yang, H.; Qian, J.-M.; Li, J.-N. Association between CYP24A1 polymorphisms and the risk of colonic polyps and colon cancer in a Chinese population. World J. Gastroenterol. 2017, 23, 5179–5186. [Google Scholar] [CrossRef]
  42. Yi, C.; Huang, C.; Wang, H.; Wang, C.; Dong, L.; Gu, X.; Feng, X.; Chen, B. Association study between CYP24A1 gene polymorphisms and cancer risk. Pathol.-Res. Pract. 2020, 216, 152735. [Google Scholar] [CrossRef] [PubMed]
  43. Gong, C.; Long, Z.; Yu, Y.; Zhu, L.; Tian, J.; Li, S.; Li, J.; Yu, H.; Chi, Q.; Piao, D.; et al. Dietary factors and polymorphisms in vitamin D metabolism genes: The risk and prognosis of colorectal cancer in northeast China. Sci. Rep. 2017, 7, 8827. [Google Scholar] [CrossRef] [Green Version]
  44. Zeng, R.; Li, H.; Jia, L.; Lee, S.H.; Jiang, R.; Zhang, Y.; Hu, X.; Ye, T.; Wang, X.; Yan, X.; et al. Association of CYP24A1 with survival and drug resistance in clinical cancer patients: A meta-analysis. BMC Cancer 2022, 22, 1317. [Google Scholar] [CrossRef]
  45. Chen, G.; Kim, S.H.; King, A.N.; Zhao, L.; Simpson, R.U.; Christensen, P.J.; Wang, Z.; Thomas, D.G.; Giordano, T.J.; Lin, L.; et al. CYP24A1 Is an Independent Prognostic Marker of Survival in Patients with Lung Adenocarcinoma. Clin. Cancer Res. 2011, 17, 817–826. [Google Scholar] [CrossRef] [PubMed] [Green Version]
  46. Kong, J.; Xu, F.; Qu, J.; Wang, Y.; Gao, M.; Yu, H.; Qian, B. Genetic polymorphisms in the vitamin D pathway in relation to lung cancer risk and survival. Oncotarget 2015, 6, 2573–2582. [Google Scholar] [CrossRef] [PubMed] [Green Version]
  47. Latacz, M.; Snarska, J.; Kostyra, E.; Fiedorowicz, E.; Savelkoul, H.F.J.; Grzybowski, R.; Cieślińska, A. Single Nucleotide Polymorphisms in 25-Hydroxyvitamin D3 1-Alpha-Hydroxylase (CYP27B1) Gene: The Risk of Malignant Tumors and Other Chronic Diseases. Nutrients 2020, 12, 801. [Google Scholar] [CrossRef] [Green Version]
  48. Ramagopalan, S.V.; Heger, A.; Berlanga, A.J.; Maugeri, N.J.; Lincoln, M.R.; Burrell, A.; Handunnetthi, L.; Handel, A.E.; Disanto, G.; Orton, S.-M.; et al. A ChIP-seq defined genome-wide map of vitamin D receptor binding: Associations with disease and evolution. Genome Res. 2010, 20, 1352–1360. [Google Scholar] [CrossRef] [PubMed] [Green Version]
  49. Dong, A.N.; Tan, B.H.; Pan, Y.; Ong, C.E. The CYP2R1 Enzyme: Structure, Function, Enzymatic Properties and Genetic Polymorphism. J. Pharm. Pharm. Sci. 2021, 24, 94–112. [Google Scholar] [CrossRef]
  50. Nissen, J.; Rasmussen, L.B.; Ravn-Haren, G.; Andersen, E.W.; Hansen, B.; Andersen, R.; Mejborn, H.; Madsen, K.H.; Vogel, U. Common Variants in CYP2R1 and GC Genes Predict Vitamin D Concentrations in Healthy Danish Children and Adults. PLoS ONE 2014, 9, e89907. [Google Scholar] [CrossRef] [Green Version]
  51. Slater, N.A.; Rager, M.L.; Havrda, D.E.; Harralson, A.F. Genetic Variation in CYP2R1 and GC Genes Associated with Vitamin D Deficiency Status. J. Pharm. Pract. 2017, 30, 31–36. [Google Scholar] [CrossRef]
  52. Rozmus, D.; Ciesielska, A.; Płomiński, J.; Grzybowski, R.; Fiedorowicz, E.; Kordulewska, N.; Savelkoul, H.; Kostyra, E.; Cieślińska, A. Vitamin D Binding Protein (VDBP) and Its Gene Polymorphisms—The Risk of Malignant Tumors and Other Diseases. Int. J. Mol. Sci. 2020, 21, 7822. [Google Scholar] [CrossRef]
  53. Pibiri, F.; Kittles, R.A.; Sandler, R.S.; Keku, T.O.; Kupfer, S.S.; Xicola, R.M.; Llor, X.; Ellis, N.A. Genetic variation in vitamin D-related genes and risk of colorectal cancer in African Americans. Cancer Causes Control 2014, 25, 561–570. [Google Scholar] [CrossRef] [PubMed]
  54. Chun, R.F. New perspectives on the vitamin D binding protein. Cell Biochem. Funct. 2012, 30, 445–456. [Google Scholar] [CrossRef] [PubMed]
  55. Weinstein, S.J.; Mondul, A.M.; Layne, T.M.; Yu, K.; Huang, J.; Stolzenberg-Solomon, R.Z.; Ziegler, R.G.; Purdue, M.P.; Huang, W.-Y.; Abnet, C.C.; et al. Prediagnostic Serum Vitamin D, Vitamin D Binding Protein Isoforms, and Cancer Survival. JNCI Cancer Spectr. 2022, 6, pkac019. [Google Scholar] [CrossRef] [PubMed]
Figure 1. LD D’ plot for SNPs located in VDR gene, CYP24A1 gene, and CYP27B1 gene in the whole population. Numbers inside the squares are the D’ values expressed as a percent.
Cancers 15 04077 g001
Figure 2. Kaplan–Meier plot of overall survival curves with the C allele of the VDR rs7975232 (ApaI) polymorphisms in 127 patients with CRC.
Cancers 15 04077 g002
Figure 3. Kaplan–Meier plot of overall survival curves with the AA genotype of the VDR rs7975232 (ApaI) polymorphisms in 127 patients with CRC.
Cancers 15 04077 g003
Figure 4. Kaplan–Meier plot of overall survival curves with the GG genotype of the VDR rs731236 (TaqI) polymorphisms in 127 patients with CRC.
Cancers 15 04077 g004
Figure 5. Kaplan–Meier plot of overall survival curves with the A allele of the VDR rs731236 (TaqI) polymorphisms in 127 patients with CRC.
Cancers 15 04077 g005
Figure 6. Kaplan–Meier plot of overall survival curves with the C allele of the CYP24A1 rs6068816 polymorphisms in 127 patients with CRC.
Cancers 15 04077 g006
Figure 7. Kaplan–Meier plot of overall survival curves with the C allele of the GC rs7041 polymorphisms in 127 patients with CRC.
Cancers 15 04077 g007
Figure 8. Kaplan–Meier plot of overall survival curves with the AC genotype of the GC rs7041 SNP in 127 patients with CRC.
Cancers 15 04077 g008
Figure 9. Kaplan–Meier plot of progression-free survival curves with the AG genotype if the VDR rs2228570 (FokI) polymorphism in 127 patients with CRC.
Cancers 15 04077 g009
Figure 10. Kaplan–Meier plot of progression-free survival curves with the G allele of the VDR rs2228570 (FokI) polymorphism in 127 patients with CRC.
Cancers 15 04077 g010
Figure 11. Kaplan–Meier plot of progression-free survival curves with the AA genotype of the VDR rs7975232 (ApaI) polymorphism in 127 patients with CRC.
Cancers 15 04077 g011
Figure 12. Kaplan–Meier plot of progression-free survival curves with the GG genotype of the VDR rs731236 (TaqI) polymorphism in 127 patients with CRC.
Cancers 15 04077 g012
Figure 13. Kaplan–Meier plot of progression-free survival curves with the TT genotype in the dominant model of the CYP24A1 rs6068816 polymorphism in 127 patients with CRC.
Cancers 15 04077 g013
Figure 14. Kaplan–Meier plot of progression-free survival curves with the TT genotype in the genotypic model of the CYP24A1 rs6068816 polymorphism in 127 patients with CRC.
Cancers 15 04077 g014
Figure 15. Kaplan–Meier plot of progression-free survival curves with the CC genotype of the GC rs7041 polymorphism in 127 patients with CRC.
Cancers 15 04077 g015
Figure 16. Kaplan–Meier plot of progression-free survival curves with the A allele of the GC rs7041 polymorphism in 127 patients with CRC.
Cancers 15 04077 g016
Table 1. Gene SNPs and their TaqMan Assay IDs.
GenedbSNP IDLocationAllelesAssay ID
VDR
(12q13.11)
rs1544410
(BsmI)
Intron 8C > TC___8716062_20
rs11568820
(Cdx2)
Intron 1C > TC___2880808_10
rs2228570
(FokI)
Exon 2A > GC__12060045_20
rs7975232
(ApaI)
Intron 8C > AC__28977635_10
rs731236
(TaqI)
Exon 9A > GC___2404008_10
CYP27B1
(12q14.1)
rs4646536Intron 6A > GC__25623453_10
rs37821305′ PromoterG > CANGZRHH 1
rs108770125′ UTRG > TC__26237740_10
rs7038423′ UTRA > G AN9HX2K 1
CYP24A1
(20q13.2)
rs6068816Exon 6C > TC__25620091_20
rs48099573′ UTRA > GC___3120981_20
CYP2R1
(11p15.2)
rs107416575′ UTRA > GC___2958430_10
GC
(4q13.3)
rs7041Exon 11A > CC___3133594_30
1 The SNPs were analyzed using custom assays by ThermoFisher Scientific (Waltham, MA, USA). SNP: single nucleotide polymorphism; UTR: untranslated region.
Table 2. Sociodemographic, clinical, and physio-pathological characteristics of 127 CRC patients.
VariableBaseline
N %Mean ± Standard Deviation
Sex127100
  Female 4233.07-
  Male8566.93-
Family history of cancer
  Yes 6450.39-
  No6349.61-
Family history of CRC
  Yes 2721.26-
  No10078.74-
Smoking status
  Smokers2721.26-
  Ex-smokers4434.65-
  Nonsmokers5644.09-
Drinking status
  Drinkers2418.90-
  Ex-drinkers75.51-
  Nondrinkers9675.59-
Body mass index (BMI)
  <242721.26-
  >2410078.74-
Type of CRC
  Colon8970.08-
  Rectum3829.92-
Age of diagnosis127-62.52 ± 10.55
ECOG score
  0–111691.34-
  2.4118.66-
Histopathology
  ADC10784.25-
  Mucinous ADC2015.75-
Tumor size127-4.40 (3.00–5.50)
Lymph node involvement
  Yes9272.44-
  No3527.56-
Number of lymph node involvement
  None3527.56-
  16148.03-
  23124.41-
Histological grade
  Grade 1 1814.17-
  Grade 29474.02-
  Grade 31511.81-
Metastasis
  Yes3628.35-
  No9171.65-
Stage
  I, II, or IIIA7155.91-
  IIIB, IV, or IVB5644.09-
TNM stage
  I/II118.66-
  III/IV11691.34-
Primary tumor resection
  Yes11993.70-
  No86.30-
Adjuvant chemotherapy
  Fluoropyrimidines3527.56-
  Fluoropyrimidines + Oxiplatin7055.12-
  Fluoropyrimidines + Biological drugs1914.96-
  None32.36-
Survival
  PFS127-73.3 (41.0-NR)
  OS127-82.3 (62.1-NR)
ADC: adenocarcinoma; CRC: colorectal cancer; ECOG: Eastern Cooperative Oncology Group; OS: overall survival; PFS: progression-free survival; TNM: Classification of Malignant Tumors. Qualitative variables are shown as number (percentage, %). Quantitative variables with a normal distribution are shown as mean ± standard deviation. Quantitative variables with a non-normal distribution are shown as p50 (p25–p75).
Table 3. Influence of gene polymorphisms and clinical–pathological characteristics on overall survival of 127 CRC patients.
Overall Survival
Independent VariablesHR (CI95%)p-Value
Family history of CRC (No)1.442 (0.268–1.792)0.449
Stage (IIIB, IV, or IVB)1.130 (0.311–4.104)0.852
Adjuvant chemotherapy (Fluoropyrimidines)1.455 (0.595–3.558)0.411
Adjuvant chemotherapy (Fluoropyrimidines + biologics drugs)4.248 (1.655–10.904)0.003
Adjuvant chemotherapy (None)5.148 (0.507–52.332)0.166
Lymph node involvement (Yes)1.503 (0.751–3.006)0.249
ECOG score (2–4)1.342 (0.505–3.568)0.555
Metastasis (yes)1.360 (0.335–5.548)0.664
Age of CRC diagnosis1.067 (1.029–1.107)<0.001
CYP24A1 rs6068816 (TT vs. C)6.237 (2.297–16.936)<0.001
GC rs7041 (C vs. AA)4.939 (1.578–15.457)0.006
VDR rs7975232 (ApaI) (AA vs. C)1.974 (1.045–3.731)0.036
p-value (log-rank) < 0.001. HR: hazard ratio; CI95%: 95% confidence interval. Bold means the result is significant.
Table 4. Influence of gene polymorphisms and clinical–pathological characteristics on progression-free survival of 127 CRC patients.
Overall Survival
Independent VariablesHR (CI95%)p-Value
Age of CRC diagnosis1.055 (1.023–1.090)0.001
ECOG score (2–4)1.029 (0.412–2.577)0.950
Lymph node involvement (Yes)1.994 (0.982–4.049)0.056
Metastasis (yes)3.142 (1.096–9.004)0.033
Stage (IIIB, IV, or IVB)1.268 (0.452–3.556)0.651
Primary tumor resection (No)1.271 (0.311–1.992)0.613
Adjuvant chemotherapy (Fluoropyrimidines)2.306 (1.059–5.019)0.035
Adjuvant chemotherapy (Fluoropyrimidines + biologics drugs)1.861 (0.823–4.208)0.135
Adjuvant chemotherapy (None)1.870 (0.231–15.143)0.557
CYP24A1 rs6068816 (TT vs. C)6.095 (2.413–15.398)<0.001
GC rs7041 (A vs. CC)1.543 (1.143–1.935)0.268
VDR rs2228570 (FokI) (G vs. AA)1.003 (0.412–2.420)0.999
VDR rs7975232 (ApaI) (AA vs. C)1.692 (1.402–2.092)0.066
p-value (log-rank) < 0.001. HR: hazard ratio; CI95%: 95% confidence interval. Bold means the result is significant.
Disclaimer/Publisher’s Note: The statements, opinions and data contained in all publications are solely those of the individual author(s) and contributor(s) and not of MDPI and/or the editor(s). MDPI and/or the editor(s) disclaim responsibility for any injury to people or property resulting from any ideas, methods, instructions or products referred to in the content.

