
Disturbed Plasma Lipidomic Profiles in Females with Diffuse Large B-Cell Lymphoma: A Pilot Study

 ,
,  ,
,  ,
,  and
and
Abstract
Simple Summary
Abstract
1. Introduction
2. Materials and Methods
2.1. Patients and Control Samples
2.2. Plasma Lipid Analysis
2.2.1. Lipid Standards and Materials
2.2.2. Untargeted 4-Dimensional (4D) Lipidomics by Reversed Phase Ultra-High-Pressure LC (UHPLC)-Tims-Tof-MS
2.2.3. Targeted Analysis of Plasma Lipids by LC-MRM
2.3. Data Analysis
3. Results
3.1. Characteristics of DLBCL Patients and Healthy Controls
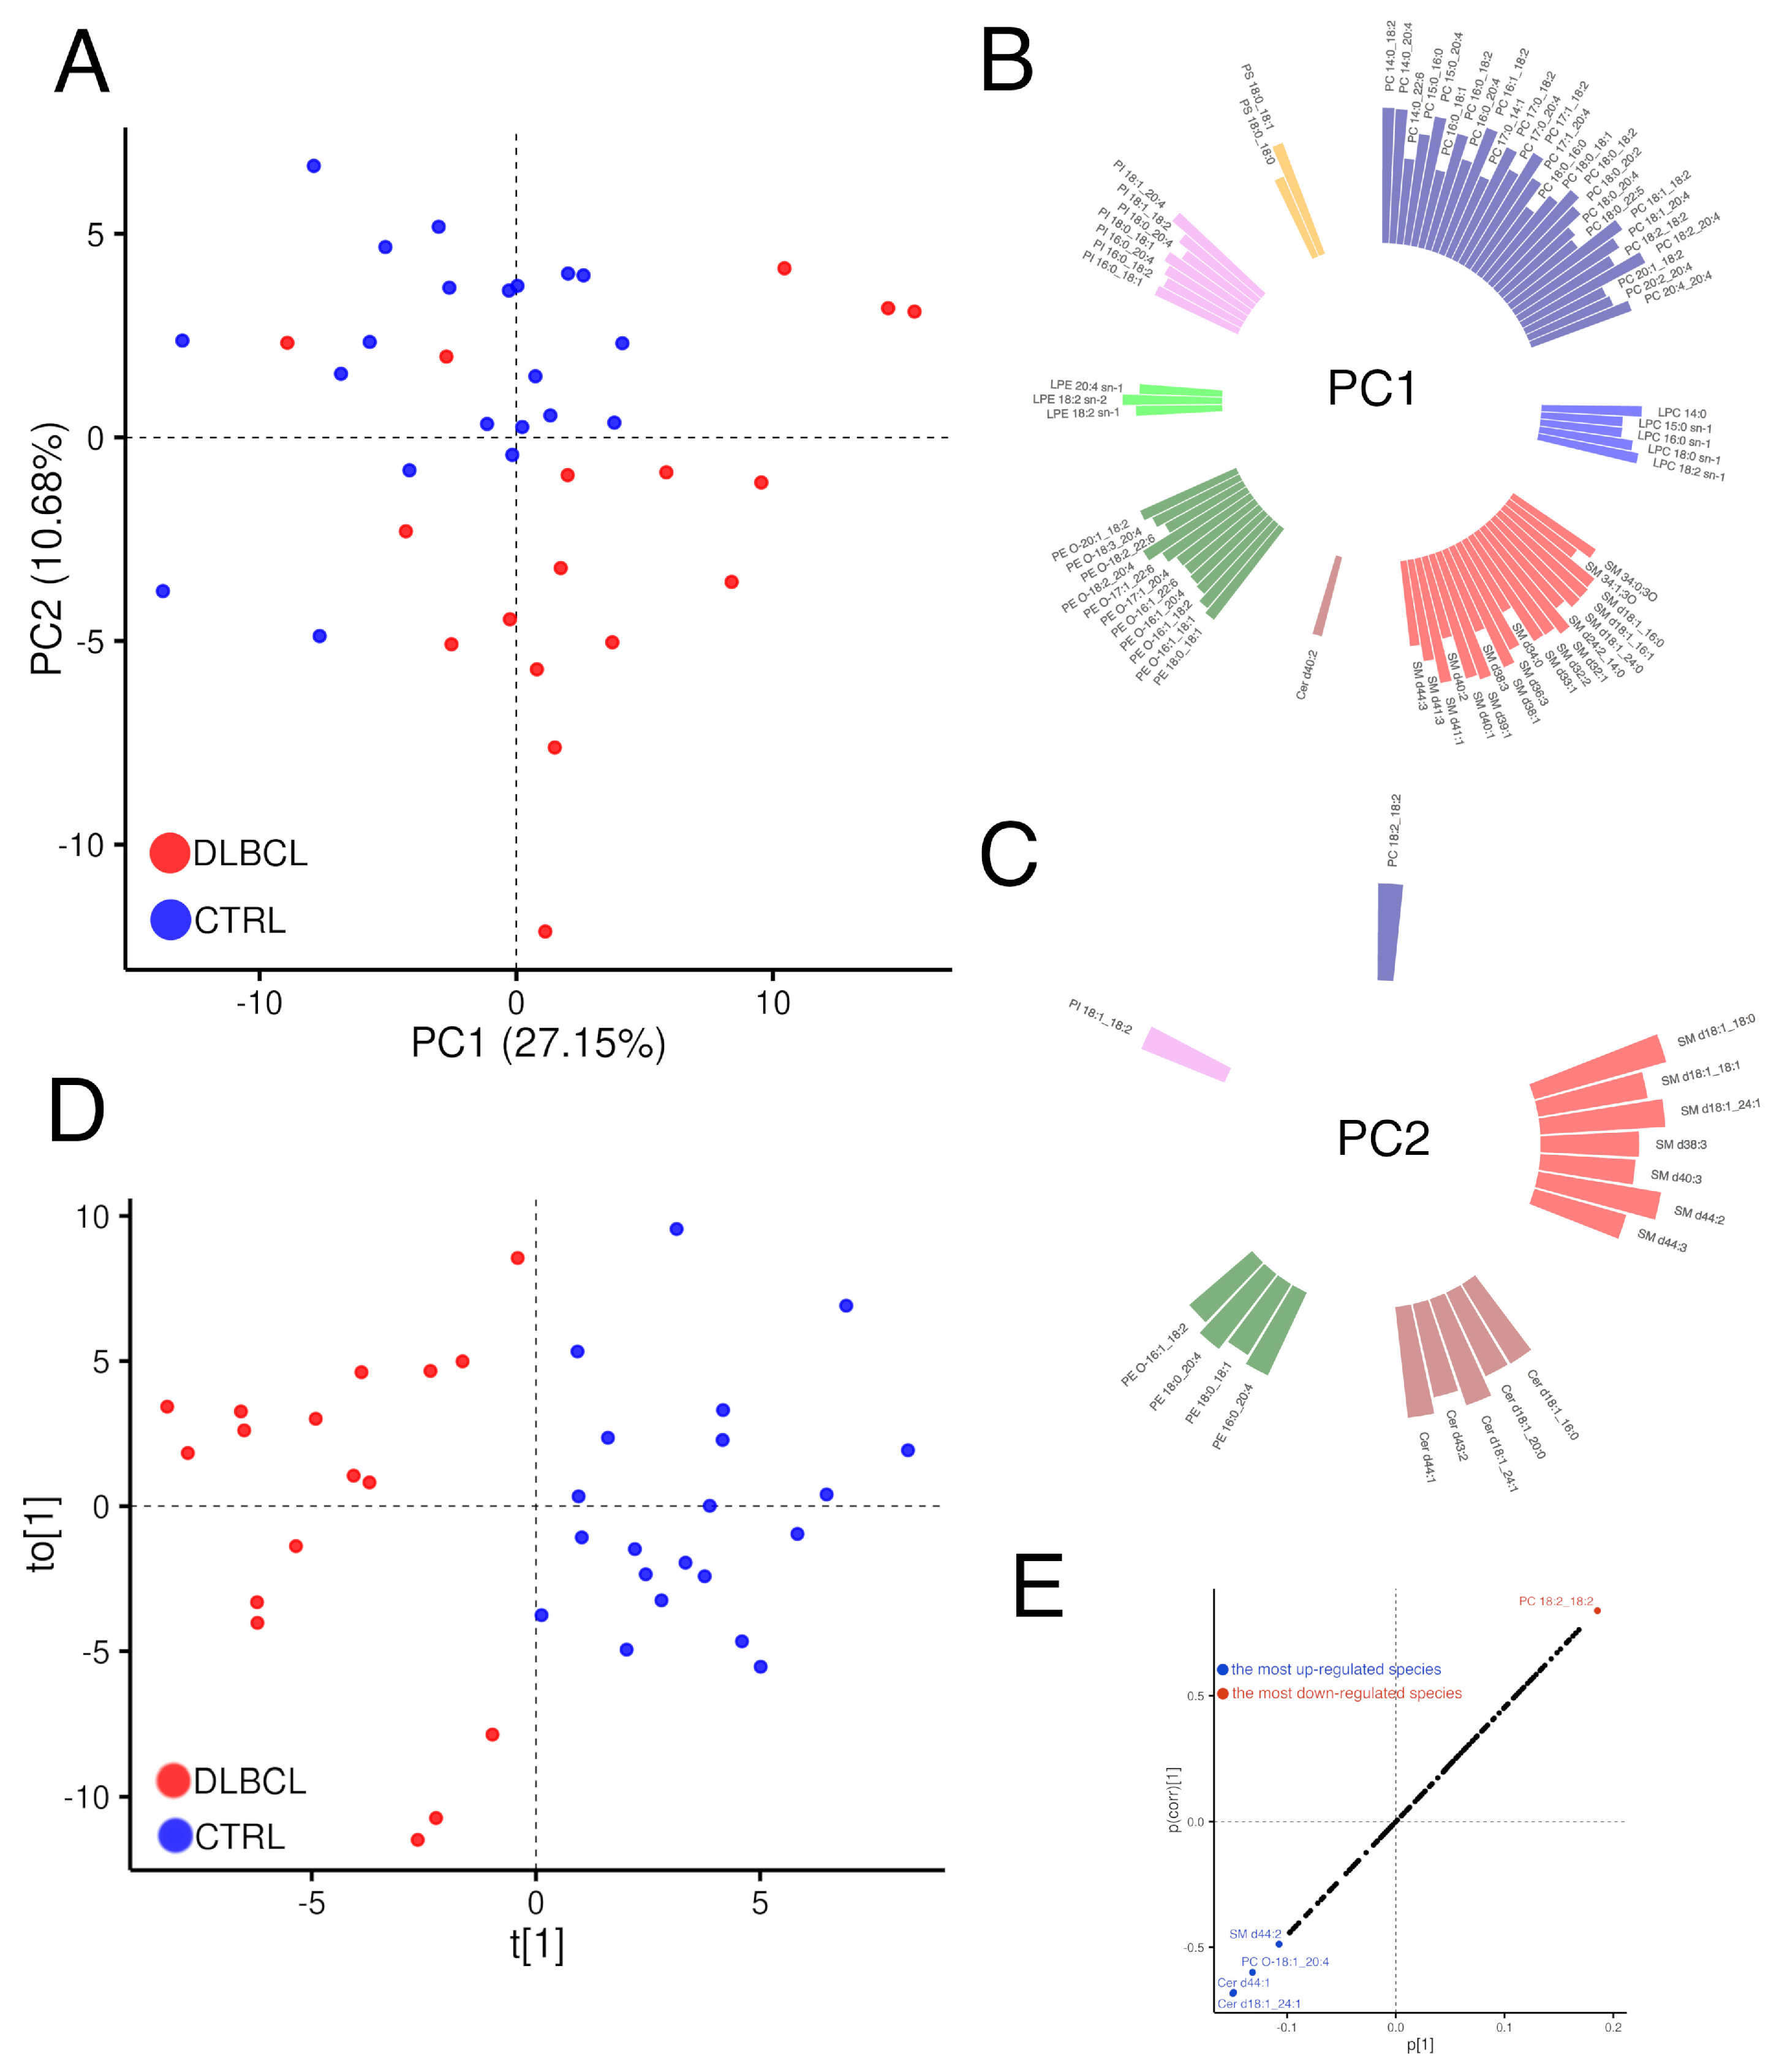
3.2. Plasma Lipidomic Landscape in Females with DLBCL
3.2.1. Overview of Changes in the Plasma Lipidome
3.2.2. Modelling Plasma Lipidomic Profile in Female Patients with DLBCL
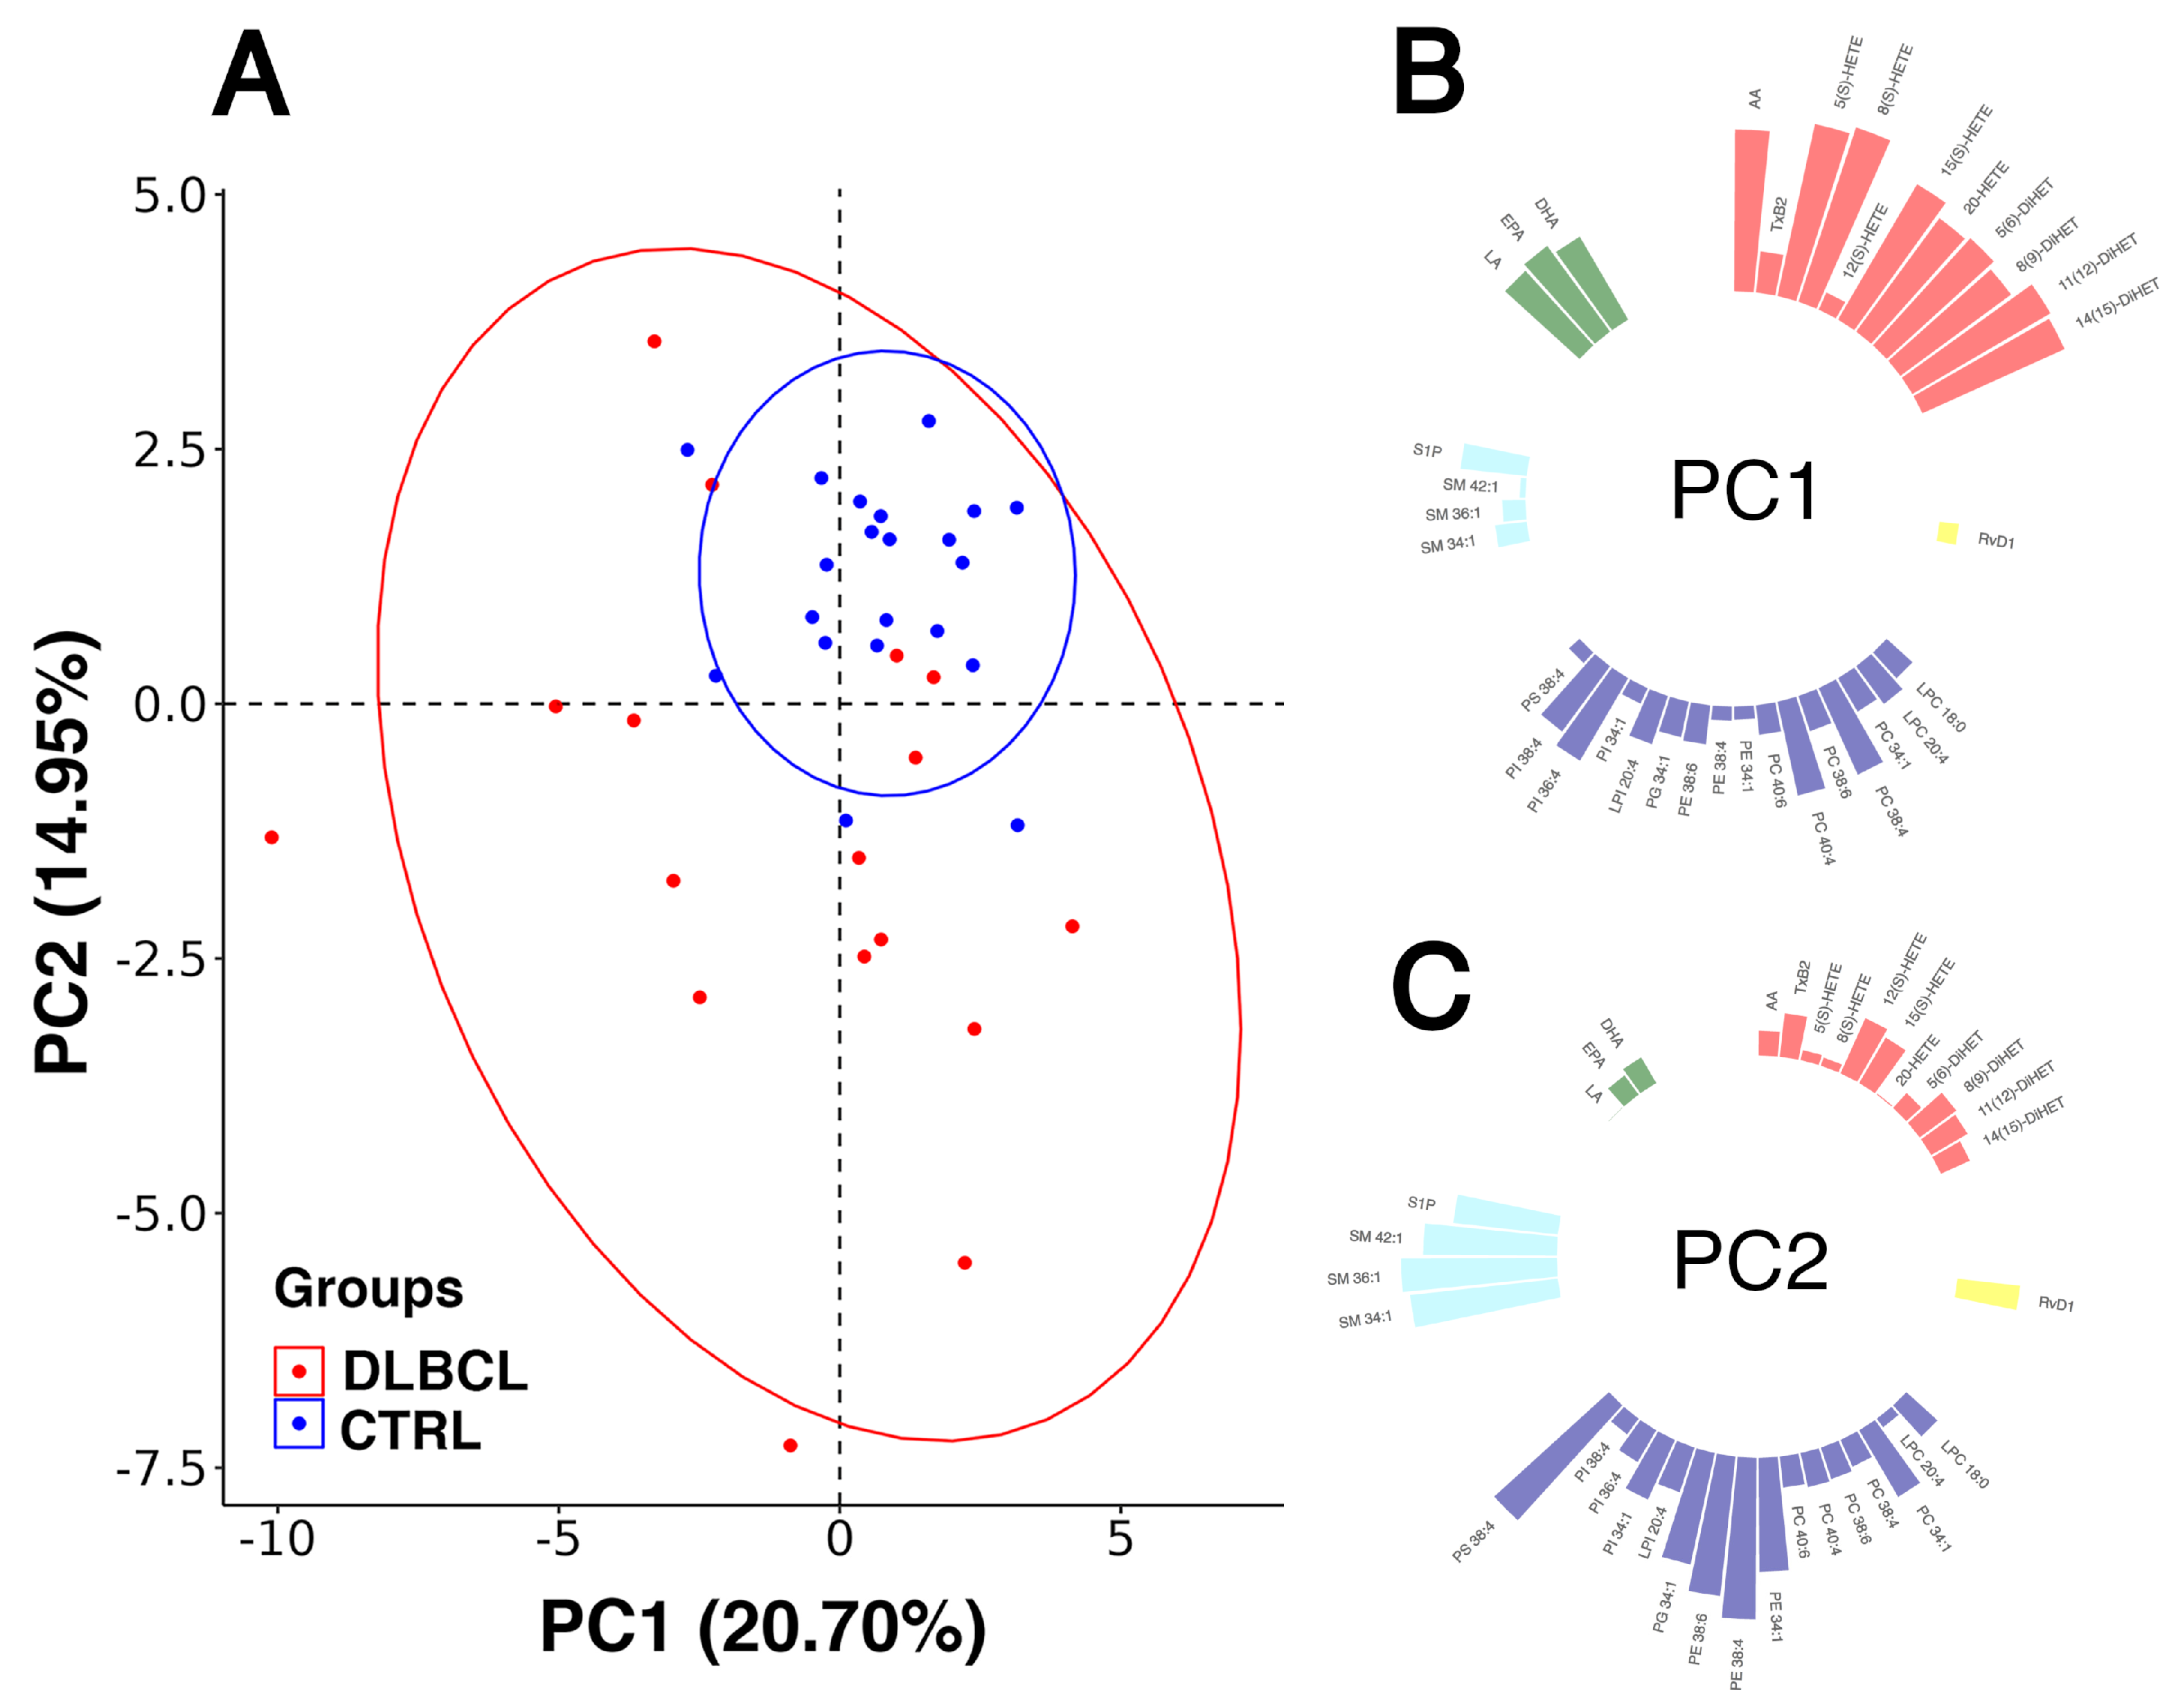
3.3. Inflamatory Lipidomic Profile in Females with DLBCL
3.3.1. Overview of Changes in the Inflammatory Lipidome of Plasma in DLBCL
3.3.2. Modelling Plasma Lipid Mediators in Female Patients with DLBCL
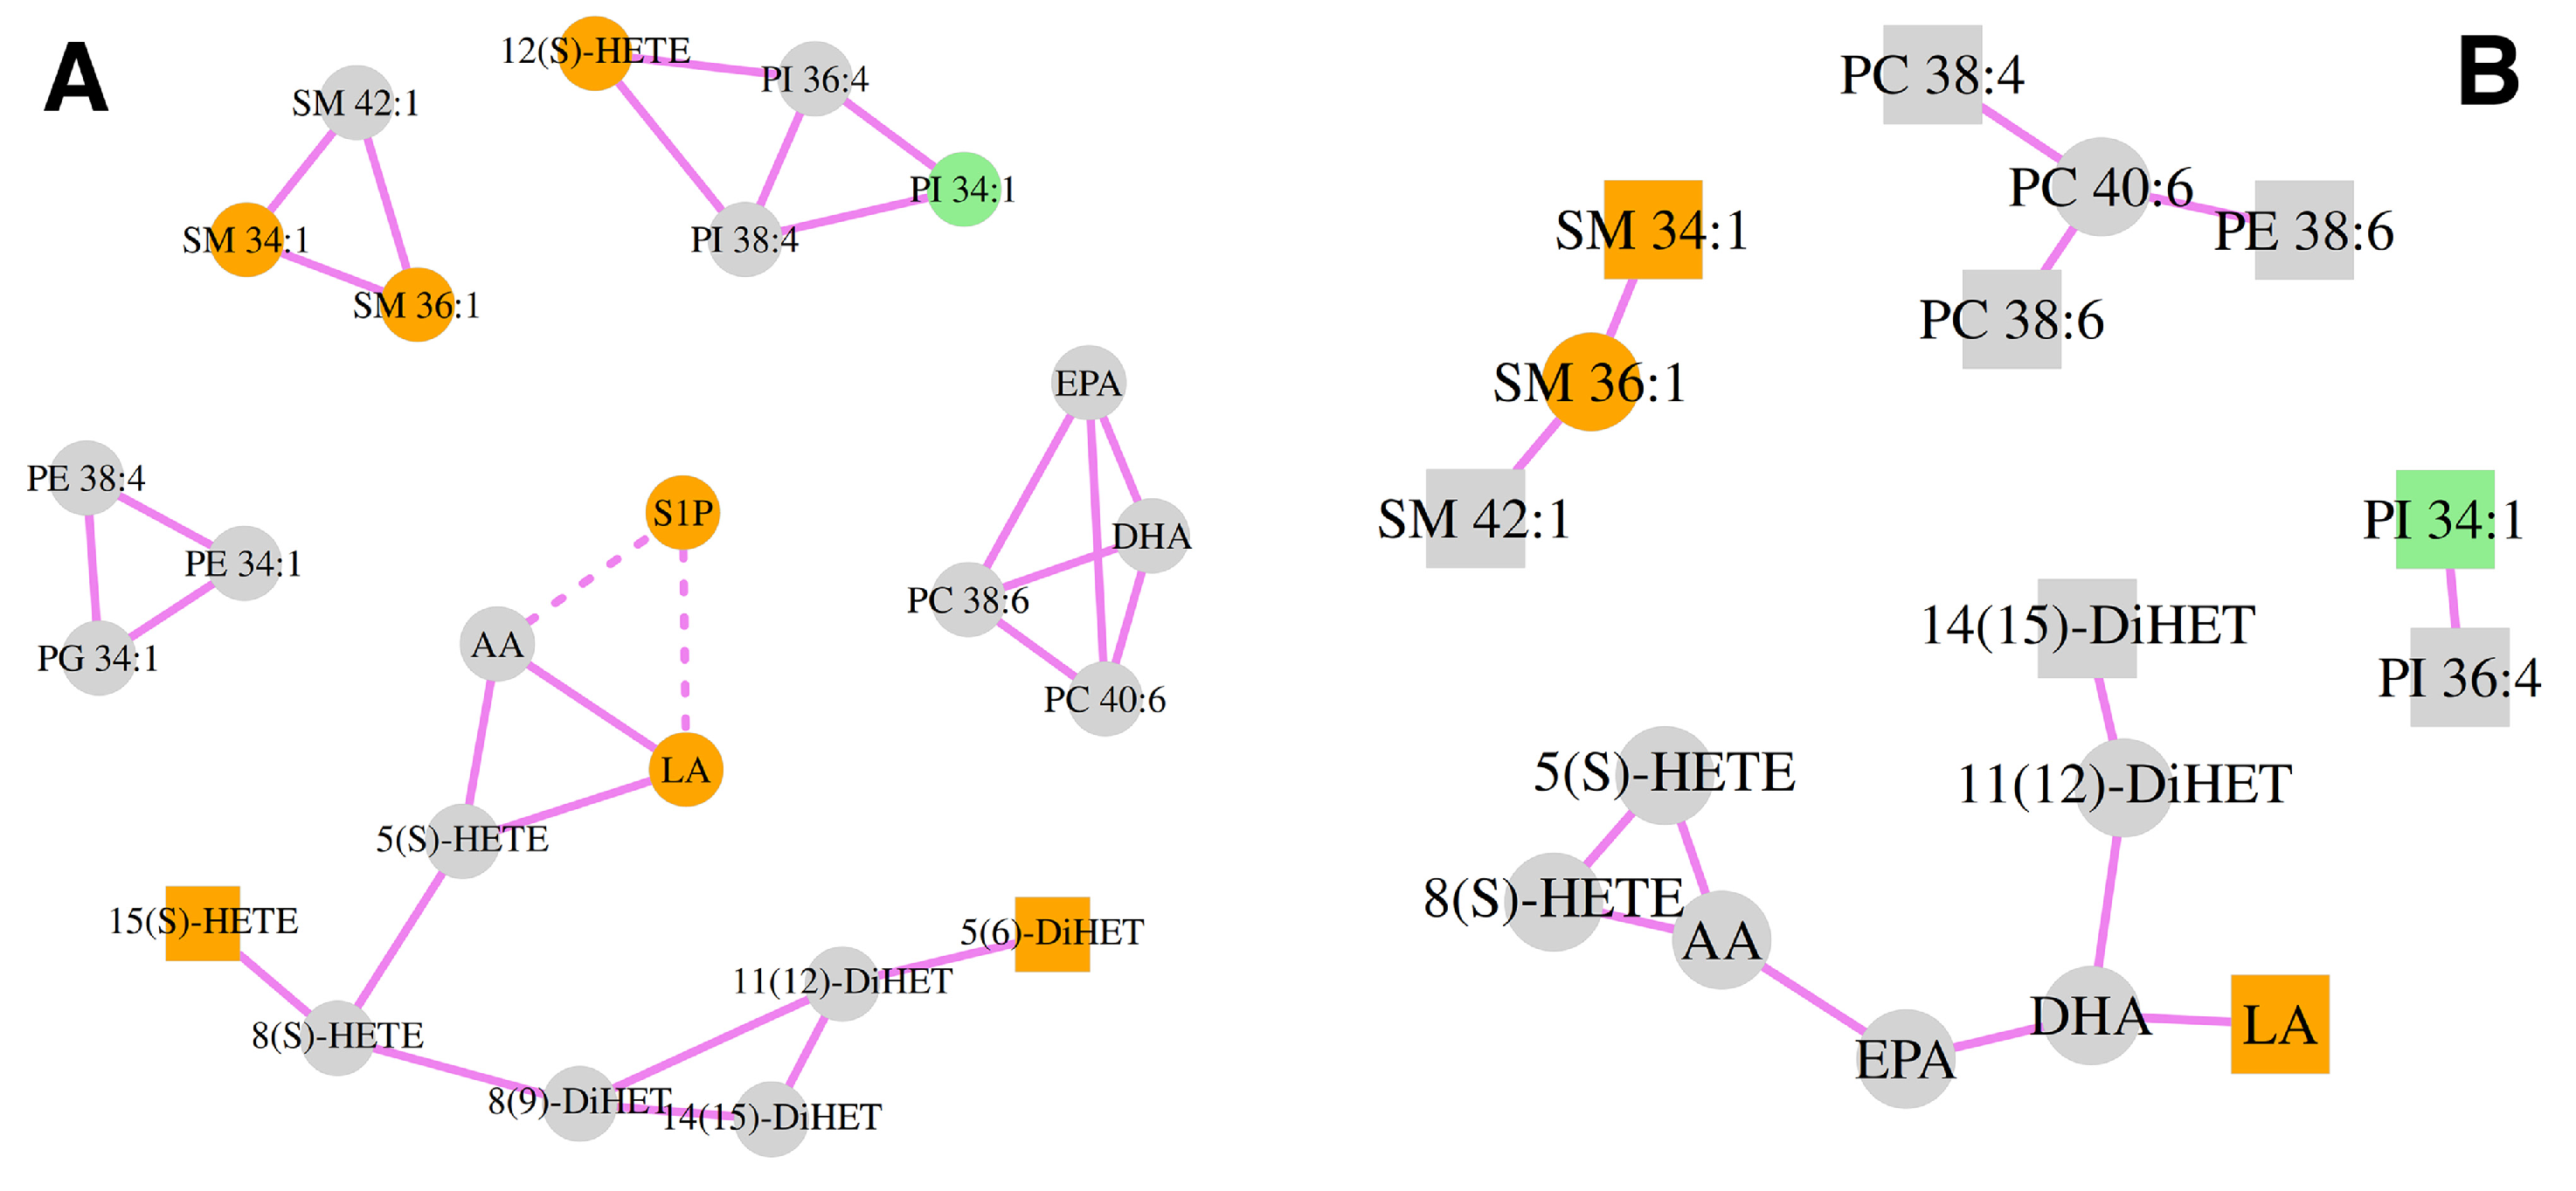
3.4. Correlation Analysis of the Lipid Mediators and Precursors
4. Discussion
5. Conclusions
Supplementary Materials
Author Contributions
Funding
Institutional Review Board Statement
Informed Consent Statement
Data Availability Statement
Acknowledgments
Conflicts of Interest
References
- Mafra, A.; Laversanne, M.; Gospodarowicz, M.; Klinger, P.; De Paula Silva, N.; Pineros, M.; Steliarova-Foucher, E.; Bray, F.; Znaor, A. Global Patterns of non-Hodgkin Lymphoma in 2020. Int. J. Cancer 2022, 151, 1474–1481. [Google Scholar] [CrossRef]
- Thandra, K.C.; Barsouk, A.; Saginala, K.; Padala, S.A.; Barsouk, A.; Rawla, P. Epidemiology of Non-Hodgkin’s Lymphoma. Med. Sci. 2021, 9, 5. [Google Scholar] [CrossRef] [PubMed]
- Sehn, L.H.; Salles, G. Diffuse Large B-Cell Lymphoma. N. Engl. J. Med. 2021, 384, 842–858. [Google Scholar] [CrossRef] [PubMed]
- Linet, M.S.; Brown, L.M.; Mbulaiteye, S.M.; Check, D.; Ostroumova, E.; Landgren, A.; Devesa, S.S. International Long-Term Trends and Recent Patterns in the Incidence of Leukemias and Lymphomas Among Children and Adolescents Ages 0–19 Years. Int. J. Cancer 2016, 138, 1862–1874. [Google Scholar] [CrossRef] [PubMed]
- Swerdlow, S.H.; Campo, E.; Harris, N.L.; Jaffe, E.S.; Pileri, S.A.; Stein, H.; Thiele, J.; Vardiman, J.W. WHO Classification of Tumours of Haematopoietic and Lymphoid Tissues; International Agency for Research on Cancer (IARC): Lyon-Cedex, France, 2017; Volume 4. [Google Scholar]
- Cerhan, J.R.; Kricker, A.; Paltiel, O.; Flowers, C.R.; Wang, S.S.; Monnereau, A.; Blair, A.; Dal Maso, L.; Kane, E.V.; Nieters, A.; et al. Medical History, Lifestyle, Family History, and Occupational Risk Factors for Diffuse Large B-Cell Lymphoma: The InterLymph Non-Hodgkin Lymphoma Subtypes Project. J. Natl. Cancer Inst. Monogr. 2014, 2014, 15–25. [Google Scholar] [CrossRef] [PubMed]
- Susanibar-Adaniya, S.; Barta, S.K. 2021 Update on Diffuse large B Cell Lymphoma: A Review of Current Data and Potential Applications on Risk Stratification and Management. Am. J. Hematol. 2021, 96, 617–629. [Google Scholar] [CrossRef]
- Solimando, A.G.; Annese, T.; Tamma, R.; Ingravallo, G.; Maiorano, E.; Vacca, A.; Specchia, G.; Ribatti, D. New Insights into Diffuse Large B-Cell Lymphoma Pathobiology. Cancers 2020, 12, 1869. [Google Scholar] [CrossRef]
- Alizadeh, A.A.; Eisen, M.B.; Davis, R.E.; Ma, C.; Lossos, I.S.; Rosenwald, A.; Boldrick, J.C.; Sabet, H.; Tran, T.; Yu, X.; et al. Distinct Types of Diffuse Large B-Cell Lymphoma Identified by Gene Expression Profiling. Nature 2000, 403, 503–511. [Google Scholar] [CrossRef]
- Caro, P.; Kishan, A.U.; Norberg, E.; Stanley, I.A.; Chapuy, B.; Ficarro, S.B.; Polak, K.; Tondera, D.; Gounarides, J.; Yin, H.; et al. Metabolic Signatures Uncover Distinct Targets in Molecular Subsets of Diffuse Large B Cell Lymphoma. Cancer Cell 2012, 22, 547–560. [Google Scholar] [CrossRef]
- Ta, R.; Yang, D.; Hirt, C.K.; Drago, T.; Flavin, R. Molecular Diagnostic Review of Diffuse Large B-Cell Lymphoma and Its Tumor Microenvironment. Diagnostics 2022, 12, 1087. [Google Scholar] [CrossRef]
- Poletto, S.; Novo, M.; Paruzzo, L.; Frascione, P.M.M.; Vitolo, U. Treatment Strategies for Patients with Diffuse Large B-Cell Lymphoma. Cancer Treat. Rev. 2022, 110, 102443. [Google Scholar] [CrossRef] [PubMed]
- Butler, L.M.; Perone, Y.; Dehairs, J.; Lupien, L.E.; de Laat, V.; Talebi, A.; Loda, M.; Kinlaw, W.B.; Swinnen, J.V. Lipids and Cancer: Emerging Roles in Pathogenesis, Diagnosis and Therapeutic Intervention. Adv. Drug Deliv. Rev. 2020, 159, 245–293. [Google Scholar] [CrossRef] [PubMed]
- Beloribi-Djefaflia, S.; Vasseur, S.; Guillaumond, F. Lipid Metabolic Reprogramming in Cancer Cells. Oncogenesis 2016, 5, e189. [Google Scholar] [CrossRef]
- Broadfield, L.A.; Pane, A.A.; Talebi, A.; Swinnen, J.V.; Fendt, S.M. Lipid Metabolism in Cancer: New Perspectives and Emerging Mechanisms. Dev. Cell 2021, 56, 1363–1393. [Google Scholar] [CrossRef]
- Martin-Perez, M.; Urdiroz-Urricelqui, U.; Bigas, C.; Benitah, S.A. The Role of Lipids in Cancer Progression and Metastasis. Cell Metab. 2022, 34, 1675–1699. [Google Scholar] [CrossRef]
- Fu, Y.; Zou, T.; Shen, X.; Nelson, P.J.; Li, J.; Wu, C.; Yang, J.; Zheng, Y.; Bruns, C.; Zhao, Y.; et al. Lipid Metabolism in Cancer Progression and Therapeutic Strategies. MedComm 2021, 2, 27–59. [Google Scholar] [CrossRef] [PubMed]
- Pang, Y.; Lu, T.; Xu-Monette, Z.Y.; Young, K.H. Metabolic Reprogramming and Potential Therapeutic Targets in Lymphoma. Int. J. Mol. Sci. 2023, 24, 5493. [Google Scholar] [CrossRef]
- Norberg, E.; Lako, A.; Chen, P.H.; Stanley, I.A.; Zhou, F.; Ficarro, S.B.; Chapuy, B.; Chen, L.; Rodig, S.; Shin, D.; et al. Differential Contribution of the Mitochondrial Translation Pathway to The survival of Diffuse Large B-Cell Lymphoma Subsets. Cell Death Differ. 2017, 24, 251–262. [Google Scholar] [CrossRef]
- Wang, F.; Lu, L.; Chen, H.; Yue, Y.; Sun, Y.; Yan, F.; He, B.; Lin, R.; Gu, W. Altered Serum Lipid Levels are Associated with Prognosis of Diffuse Large B Cell Lymphoma and Influenced by Utility of Rituximab. Ann. Hematol. 2023, 102, 393–402. [Google Scholar] [CrossRef]
- Pedersen, K.M.; Çolak, Y.; Bojesen, S.E.; Nordestgaard, B.G. Low High-Density Lipoprotein and Increased Risk of Several Cancers: 2 Population-Based Cohort Studies Including 116,728 Individuals. J. Hematol. Oncol. 2020, 13, 129. [Google Scholar] [CrossRef]
- Yu, T.; Luo, D.; Luo, C.; Xu-Monette, Z.Y.; Yu, L. Prognostic and Therapeutic Value of Serum Lipids and a new IPI Score System Based on Apolipoprotein A-I in Diffuse Large B-Cell Lymphoma. Am. J. Cancer Res. 2023, 13, 475–484. [Google Scholar] [PubMed]
- Stephenson, D.J.; Hoeferlin, L.A.; Chalfant, C.E. Lipidomics in Translational Research and the Clinical Significance of Lipid-Based Biomarkers. Transl. Res. 2017, 189, 13–29. [Google Scholar] [CrossRef] [PubMed]
- Pan, M.; Qin, C.; Han, X. Lipid Metabolism and Lipidomics Applications in Cancer Research. Adv. Exp. Med. Biol. 2021, 1316, 1–24. [Google Scholar] [CrossRef] [PubMed]
- Sagini, K.; Urbanelli, L.; Buratta, S.; Emiliani, C.; Llorente, A. Lipid Biomarkers in Liquid Biopsies: Novel Opportunities for Cancer Diagnosis. Pharmaceutics 2023, 15, 437. [Google Scholar] [CrossRef] [PubMed]
- Chen, X.; Chen, H.; Dai, M.; Ai, J.; Li, Y.; Mahon, B.; Dai, S.; Deng, Y. Plasma Lipidomics Profiling Identified Lipid Biomarkers in Distinguishing Early-Stage Breast Cancer from Benign Lesions. Oncotarget 2016, 7, 36622–36631. [Google Scholar] [CrossRef]
- Wolrab, D.; Jirasko, R.; Peterka, O.; Idkowiak, J.; Chocholouskova, M.; Vankova, Z.; Horejsi, K.; Brabcova, I.; Vrana, D.; Studentova, H.; et al. Plasma Lipidomic Profiles of Kidney, Breast and Prostate Cancer Patients Differ from Healthy Controls. Sci. Rep. 2021, 11, 20322. [Google Scholar] [CrossRef]
- Yu, Z.; Chen, H.; Ai, J.; Zhu, Y.; Li, Y.; Borgia, J.A.; Yang, J.S.; Zhang, J.; Jiang, B.; Gu, W.; et al. Global Lipidomics Identified Plasma Lipids as Novel Biomarkers for Early Detection of Lung Cancer. Oncotarget 2017, 8, 107899–107906. [Google Scholar] [CrossRef]
- Lee, G.B.; Lee, J.C.; Moon, M.H. Plasma Lipid Profile Comparison of Five Different Cancers By Nanoflow Ultrahigh Performance Liquid Chromatography-Tandem Mass Spectrometry. Anal. Chim. Acta 2019, 1063, 117–126. [Google Scholar] [CrossRef]
- Perttula, K.; Schiffman, C.; Edmands, W.M.B.; Petrick, L.; Grigoryan, H.; Cai, X.; Gunter, M.J.; Naccarati, A.; Polidoro, S.; Dudoit, S.; et al. Untargeted Lipidomic Features Associated with Colorectal Cancer in a Prospective Cohort. BMC Cancer 2018, 18, 996. [Google Scholar] [CrossRef]
- Lin, H.M.; Huynh, K.; Kohli, M.; Tan, W.; Azad, A.A.; Yeung, N.; Mahon, K.L.; Mak, B.; Sutherland, P.D.; Shepherd, A.; et al. Aberrations in Circulating Ceramide Levels are Associated with Poor Clinical Outcomes Across Localised and Metastatic Prostate Cancer. Prostate Cancer Prostatic Dis. 2021, 24, 860–870. [Google Scholar] [CrossRef]
- Liu, Z.C.; Wu, W.H.; Huang, S.; Li, Z.W.; Li, X.; Shui, G.H.; Lam, S.M.; Li, B.W.; Li, Z.X.; Zhang, Y.; et al. Plasma Lipids Signify the Progression of Precancerous Gastric Lesions to Gastric Cancer: A Prospective Targeted Lipidomics Study. Theranostics 2022, 12, 4671–4683. [Google Scholar] [CrossRef] [PubMed]
- Wolrab, D.; Jirasko, R.; Cifkova, E.; Horing, M.; Mei, D.; Chocholouskova, M.; Peterka, O.; Idkowiak, J.; Hrnciarova, T.; Kuchar, L.; et al. Lipidomic Profiling of Human Serum Enables Detection of Pancreatic Cancer. Nat. Commun. 2022, 13, 124. [Google Scholar] [CrossRef] [PubMed]
- Cheng, F.; Wen, Z.; Feng, X.; Wang, X.; Chen, Y. A Serum Lipidomic Strategy Revealed Potential Lipid Biomarkers for Early-Stage Cervical Cancer. Life Sci. 2020, 260, 118489. [Google Scholar] [CrossRef] [PubMed]
- Buas, M.F.; Drescher, C.W.; Urban, N.; Li, C.I.; Bettcher, L.; Hait, N.C.; Moysich, K.B.; Odunsi, K.; Raftery, D.; Yan, L. Quantitative Global Lipidomics Analysis of Patients with Ovarian Cancer Versus Benign Adnexal Mass. Sci. Rep. 2021, 11, 18156. [Google Scholar] [CrossRef]
- Cheng, F.; Fan, W.; Gui, L.; Liu, Y.; Ling, Y.; Huang, R.; Wen, Z.; Chen, Y. Serum Lipidomic Profiling by UHPLC-MS/MS may be Able to Detect Early-Stage Endometrial Cancer. Anal. Bioanal. Chem. 2023, 415, 1841–1854. [Google Scholar] [CrossRef]
- Zhou, J.; Ji, N.; Wang, G.; Zhang, Y.; Song, H.; Yuan, Y.; Yang, C.; Jin, Y.; Zhang, Z.; Zhang, L.; et al. Metabolic Detection of Malignant Brain Gliomas Through Plasma Lipidomic Analysis and Support Vector Machine-Based Machine Learning. EBioMedicine 2022, 81, 104097. [Google Scholar] [CrossRef]
- Pabst, T.; Kortz, L.; Fiedler, G.M.; Ceglarek, U.; Idle, J.R.; Beyoglu, D. The Plasma Lipidome in Acute Myeloid Leukemia at Diagnosis in Relation to Clinical Disease Features. BBA Clin. 2017, 7, 105–114. [Google Scholar] [CrossRef]
- Leuti, A.; Fazio, D.; Fava, M.; Piccoli, A.; Oddi, S.; Maccarrone, M. Bioactive Lipids, Inflammation and Chronic Diseases. Adv. Drug Deliv. Rev. 2020, 159, 133–169. [Google Scholar] [CrossRef]
- Liu, X.; Yin, L.; Shen, S.; Hou, Y. Inflammation and Cancer: Paradoxical Roles in Tumorigenesis and Implications in IMMUNOTHERAPIES. Genes. Dis. 2023, 10, 151–164. [Google Scholar] [CrossRef]
- Calder, P.C. Eicosanoids. Essays Biochem. 2020, 64, 423–441. [Google Scholar] [CrossRef]
- Hanna, V.S.; Hafez, E.A.A. Synopsis of Arachidonic Acid Metabolism: A review. J. Adv. Res. 2018, 11, 23–32. [Google Scholar] [CrossRef] [PubMed]
- Dore, E.; Boilard, E. Roles of Secreted Phospholipase A(2) Group IIA in Inflammation and Host Defense. Biochim. Biophys. Acta Mol. Cell Biol. Lipids 2019, 1864, 789–802. [Google Scholar] [CrossRef] [PubMed]
- Quinville, B.M.; Deschenes, N.M.; Ryckman, A.E.; Walia, J.S. A Comprehensive Review: Sphingolipid Metabolism and Implications of Disruption in Sphingolipid Homeostasis. Int. J. Mol. Sci. 2021, 22, 5793. [Google Scholar] [CrossRef] [PubMed]
- Tan, S.T.; Ramesh, T.; Toh, X.R.; Nguyen, L.N. Emerging roles of lysophospholipids in health and disease. Prog. Lipid Res. 2020, 80, 101068. [Google Scholar] [CrossRef] [PubMed]
- Epand, R.M. Features of the Phosphatidylinositol Cycle and its Role in Signal Transduction. J. Membr. Biol. 2017, 250, 353–366. [Google Scholar] [CrossRef] [PubMed]
- Hait, N.C.; Maiti, A. The Role of Sphingosine-1-Phosphate and Ceramide-1-Phosphate in Inflammation and Cancer. Mediat. Inflamm. 2017, 2017, 4806541. [Google Scholar] [CrossRef]
- Kay, J.G.; Fairn, G.D. Distribution, Dynamics and Functional Roles of Phosphatidylserine within the Cell. Cell Commun. Signal 2019, 17, 126. [Google Scholar] [CrossRef]
- Pyne, N.J.; Pyne, S. Recent Advances in the Role of Sphingosine 1-Phosphate in Cancer. FEBS Lett. 2020, 594, 3583–3601. [Google Scholar] [CrossRef]
- Lupino, L.; Perry, T.; Margielewska, S.; Hollows, R.; Ibrahim, M.; Care, M.; Allegood, J.; Tooze, R.; Sabbadini, R.; Reynolds, G.; et al. Sphingosine-1-Phosphate Signalling Drives an Angiogenic Transcriptional Programme in Diffuse Large B Cell Lymphoma. Leukemia 2019, 33, 2884–2897. [Google Scholar] [CrossRef]
- Gil-de-Gomez, L.; Balgoma, D.; Montero, O. Lipidomic-Based Advances in Diagnosis and Modulation of Immune Response to Cancer. Metabolites 2020, 10, 332. [Google Scholar] [CrossRef]
- Tamma, R.; Ranieri, G.; Ingravallo, G.; Annese, T.; Oranger, A.; Gaudio, F.; Musto, P.; Specchia, G.; Ribatti, D. Inflammatory Cells in Diffuse Large B Cell Lymphoma. J. Clin. Med. 2020, 9, 2418. [Google Scholar] [CrossRef]
- Luo, X.; Zhao, X.; Cheng, C.; Li, N.; Liu, Y.; Cao, Y. The Implications of Signaling Lipids in Cancer Metastasis. Exp. Mol. Med. 2018, 50, 1–10. [Google Scholar] [CrossRef]
- Carbone, P.P.; Kaplan, H.S.; Musshoff, K.; Smithers, D.W.; Tubiana, M. Report of the Committee on Hodgkin’s Disease Staging Classification. Cancer Res. 1971, 31, 1860–1861. [Google Scholar]
- Sehn, L.H.; Berry, B.; Chhanabhai, M.; Fitzgerald, C.; Gill, K.; Hoskins, P.; Klasa, R.; Savage, K.J.; Shenkier, T.; Sutherland, J.; et al. The Revised International Prognostic Index (R-IPI) is a Better Predictor of Outcome Than the Standard IPI for Patients with Diffuse Large B-Cell Lymphoma Treated with R-CHOP. Blood 2007, 109, 1857–1861. [Google Scholar] [CrossRef]
- Lerner, R.; Baker, D.; Schwitter, C.; Neuhaus, S.; Hauptmann, T.; Post, J.M.; Kramer, S.; Bindila, L. Four-dimensional Trapped Ion Mobility Spectrometry Lipidomics for High Throughput Clinical Profiling of Human Blood Samples. Nat. Commun. 2023, 14, 937. [Google Scholar] [CrossRef] [PubMed]
- Lerner, R.; Post, J.; Loch, S.; Lutz, B.; Bindila, L. Targeting Brain and Peripheral Plasticity of the Lipidome in Acute Kainic Acid-Induced Epileptic Seizures in Mice Via Quantitative Mass Spectrometry. Biochim. Biophys. Acta Mol. Cell Biol. Lipids 2017, 1862, 255–267. [Google Scholar] [CrossRef] [PubMed]
- Matyash, V.; Liebisch, G.; Kurzchalia, T.V.; Shevchenko, A.; Schwudke, D. Lipid Extraction by Methyl-Tert-Butyl Ether For High-Throughput Lipidomics. J. Lipid Res. 2008, 49, 1137–1146. [Google Scholar] [CrossRef] [PubMed]
- Lerner, R.; Post, J.M.; Ellis, S.R.; Vos, D.R.N.; Heeren, R.M.A.; Lutz, B.; Bindila, L. Simultaneous Lipidomic and Transcriptomic Profiling in Mouse Brain Punches of Acute Epileptic Seizure Model Compared to Controls. J. Lipid Res. 2018, 59, 283–297. [Google Scholar] [CrossRef]
- Lerner, R.; Pascual Cuadrado, D.; Post, J.M.; Lutz, B.; Bindila, L. Broad Lipidomic and Transcriptional Changes of Prophylactic PEA Administration in Adult Mice. Front. Neurosci. 2019, 13, 527. [Google Scholar] [CrossRef]
- Pascual Cuadrado, D.; Todorov, H.; Lerner, R.; Islami, L.; Bindila, L.; Gerber, S.; Lutz, B. Long-Term Molecular Differences Between Resilient and Susceptible Mice After a Single Traumatic Exposure. Br. J. Pharmacol. 2022, 179, 4161–4180. [Google Scholar] [CrossRef]
- Post, J.M.; Lerner, R.; Schwitter, C.; Lutz, B.; Lomazzo, E.; Bindila, L. Lipidomics and Transcriptomics in Neurological Diseases. J. Vis. Exp. 2022, e59423. [Google Scholar] [CrossRef]
- Witten, D.M.; Tibshirani, R. A Comparison of Fold-Change and the T-Statistic for Microarray Data Analysis. Analysis 2007, 1776, 58–85. [Google Scholar]
- Hao, Y.; Li, D.; Xu, Y.; Ouyang, J.; Wang, Y.; Zhang, Y.; Li, B.; Xie, L.; Qin, G. Investigation of Lipid Metabolism Dysregulation and the Effects on Immune Microenvironments in Pan-Cancer Using Multiple Omics Data. BMC Bioinform. 2019, 20, 195. [Google Scholar] [CrossRef] [PubMed]
- Huynh, K.; Barlow, C.K.; Jayawardana, K.S.; Weir, J.M.; Mellett, N.A.; Cinel, M.; Magliano, D.J.; Shaw, J.E.; Drew, B.G.; Meikle, P.J. High-Throughput Plasma Lipidomics: Detailed Mapping of the Associations with Cardiometabolic Risk Factors. Cell Chem. Biol. 2019, 26, 71–84.e4. [Google Scholar] [CrossRef] [PubMed]
- Gao, R.; Liang, J.H.; Wang, L.; Zhu, H.Y.; Wu, W.; Cao, L.; Fan, L.; Li, J.Y.; Yang, T.; Xu, W. Low Serum Cholesterol Levels Predict Inferior Prognosis and Improve NCCN-IPI Scoring in DIFFUSE LARGE B CELL LYMPHOMA. Int. J. Cancer 2018, 143, 1884–1895. [Google Scholar] [CrossRef] [PubMed]
- Cvetkovic, Z.; Vucic, V.; Cvetkovic, B.; Petrovic, M.; Ristic-Medic, D.; Tepsic, J.; Glibetic, M. Abnormal Fatty Acid Distribution of the Serum Phospholipids of Patients with Non-Hodgkin Lymphoma. Ann. Hematol. 2010, 89, 775–782. [Google Scholar] [CrossRef]
- Miao, Y.; Medeiros, L.J.; Li, Y.; Li, J.; Young, K.H. Genetic Alterations and their Clinical Implications in DLBCL. Nat. Rev. Clin. Oncol. 2019, 16, 634–652. [Google Scholar] [CrossRef]
- Cutmore, N.H.; Krupka, J.A.; Hodson, D.J. Genetic Profiling in Diffuse Large B-Cell Lymphoma: The Promise and the Challenge. Mod. Pathol. 2023, 36, 100007. [Google Scholar] [CrossRef]
- Fernandes Messias, M.C.; Mecatti, G.C.; Figueiredo Angolini, C.F.; Eberlin, M.N.; Credidio, L.; Real Martinez, C.A.; Rodrigues Coy, C.S.; de Oliveira Carvalho, P. Plasma Lipidomic Signature of Rectal Adenocarcinoma Reveals Potential Biomarkers. Front. Oncol. 2017, 7, 325. [Google Scholar] [CrossRef]
- Koundouros, N.; Poulogiannis, G. Reprogramming of Fatty Acid Metabolism in Cancer. Br. J. Cancer 2020, 122, 4–22. [Google Scholar] [CrossRef]
- Yamamoto, K.; Miki, Y.; Sato, H.; Murase, R.; Taketomi, Y.; Murakami, M. Secreted Phospholipase A(2) Specificity on Natural Membrane Phospholipids. Methods Enzymol. 2017, 583, 101–117. [Google Scholar] [CrossRef] [PubMed]
- Kudo, K.; Miki, Y.; Carreras, J.; Nakayama, S.; Nakamoto, Y.; Ito, M.; Nagashima, E.; Yamamoto, K.; Higuchi, H.; Morita, S.Y.; et al. Secreted Phospholipase A(2) Modifies Extracellular Vesicles and Accelerates B Cell Lymphoma. Cell Metab. 2022, 34, 615–633.e8. [Google Scholar] [CrossRef] [PubMed]
- Hashemi Goradel, N.; Najafi, M.; Salehi, E.; Farhood, B.; Mortezaee, K. Cyclooxygenase-2 in Cancer: A review. J. Cell Physiol. 2019, 234, 5683–5699. [Google Scholar] [CrossRef] [PubMed]
- Gao, S.; Hu, J.; Li, Y. Targeting of the Alox12-12-HETE in Blast Crisis Chronic Myeloid Leukemia Inhibits Leukemia Stem/Progenitor Cell Function. Cancer Manag. Res. 2020, 12, 12509–12517. [Google Scholar] [CrossRef]
- Liu, Y.; Chen, C.; Xu, Z.; Scuoppo, C.; Rillahan, C.D.; Gao, J.; Spitzer, B.; Bosbach, B.; Kastenhuber, E.R.; Baslan, T.; et al. Deletions Linked to TP53 Loss Drive Cancer Through p53-Independent Mechanisms. Nature 2016, 531, 471–475. [Google Scholar] [CrossRef]
- Chu, B.; Kon, N.; Chen, D.; Li, T.; Liu, T.; Jiang, L.; Song, S.; Tavana, O.; Gu, W. ALOX12 is Required for p53-Mediated Tumour Suppression Through a Distinct Ferroptosis Pathway. Nat. Cell Biol. 2019, 21, 579–591. [Google Scholar] [CrossRef]
- Sousa-Pimenta, M.; Estevinho, M.M.; Sousa Dias, M.; Martins, A.; Estevinho, L.M. Oxidative Stress and Inflammation in B-Cell Lymphomas. Antioxidants 2023, 12, 936. [Google Scholar] [CrossRef]
- Claesson, H.E.; Griffiths, W.J.; Brunnstrom, A.; Schain, F.; Andersson, E.; Feltenmark, S.; Johnson, H.A.; Porwit, A.; Sjoberg, J.; Bjorkholm, M. Hodgkin Reed-Sternberg Cells Express 15-Lipoxygenase-1 and are Putative Producers of Eoxins In Vivo: Novel Insight into the Inflammatory Features of Classical Hodgkin Lymphoma. FEBS J. 2008, 275, 4222–4234. [Google Scholar] [CrossRef]
- Basil, M.C.; Levy, B.D. Specialized Pro-Resolving Mediators: Endogenous Regulators of Infection and Inflammation. Nat. Rev. Immunol. 2016, 16, 51–67. [Google Scholar] [CrossRef]
- Qi, L.; Pan, X.; Chen, X.; Liu, P.; Chen, M.; Zhang, Q.; Hang, X.; Tang, M.; Wen, D.; Dai, L.; et al. COX-2/PGE2 Upregulation Contributes to the Chromosome 17p-Deleted Lymphoma. Oncogenesis 2023, 12, 5. [Google Scholar] [CrossRef]
- Hazar, B.; Ergin, M.; Seyrek, E.; Erdoğan, S.; Tuncer, I.; Hakverdi, S. Cyclooxygenase-2 (Cox-2) Expression in Lymphomas. Leuk. Lymphoma 2004, 45, 1395–1399. [Google Scholar] [CrossRef]
- Eberlin, L.S.; Gabay, M.; Fan, A.C.; Gouw, A.M.; Tibshirani, R.J.; Felsher, D.W.; Zare, R.N. Alteration of the Lipid Profile in Lymphomas Induced by MYC Overexpression. Proc. Natl. Acad. Sci. USA 2014, 111, 10450–10455. [Google Scholar] [CrossRef]
- Guo, W.; Wang, X.; Li, Y.; Bai, O. Function and Regulation of Lipid Signaling in Lymphomagenesis: A Novel Target in Cancer Research and Therapy. Crit. Rev. Oncol. Hematol. 2020, 154, 103071. [Google Scholar] [CrossRef]
- Danilova, O.V.; Dumont, L.J.; Levy, N.B.; Lansigan, F.; Kinlaw, W.B.; Danilov, A.V.; Kaur, P. FASN and CD36 Predict Survival in Rituximab-Treated Diffuse Large B-Cell Lymphoma. J. Hematop. 2013, 6, 11–18. [Google Scholar] [CrossRef]
- Uddin, S.; Hussain, A.R.; Siraj, A.K.; Manogaran, P.S.; Al-Jomah, N.A.; Moorji, A.; Atizado, V.; Al-Dayel, F.; Belgaumi, A.; El-Solh, H.; et al. Role of Phosphatidylinositol 3’-Kinase/AKT Pathway in Diffuse Large B-cell Lymphoma Survival. Blood 2006, 108, 4178–4186. [Google Scholar] [CrossRef] [PubMed]
- Zhong, X.; Liu, Z.; Luo, Q.; Li, J.; Zhang, W.; Shuang, Y. Upregulation of Fatty Acid Synthase in MYC and BCL-2 Double-Expressor Lymphoma. Oncol. Lett. 2021, 21, 245. [Google Scholar] [CrossRef] [PubMed]
- Kapadia, B.; Nanaji, N.M.; Bhalla, K.; Bhandary, B.; Lapidus, R.; Beheshti, A.; Evens, A.M.; Gartenhaus, R.B. Fatty Acid Synthase Induced S6Kinase Facilitates USP11-eIF4B Complex Formation for Sustained Oncogenic Translation in DLBCL. Nat. Commun. 2018, 9, 829. [Google Scholar] [CrossRef] [PubMed]
- Zhang, J.; Grubor, V.; Love, C.L.; Banerjee, A.; Richards, K.L.; Mieczkowski, P.A.; Dunphy, C.; Choi, W.; Au, W.Y.; Srivastava, G.; et al. Genetic Heterogeneity of Diffuse Large B-cell Lymphoma. Proc. Natl. Acad. Sci. USA 2013, 110, 1398–1403. [Google Scholar] [CrossRef] [PubMed]
- Quehenberger, O.; Armando, A.M.; Brown, A.H.; Milne, S.B.; Myers, D.S.; Merrill, A.H.; Bandyopadhyay, S.; Jones, K.N.; Kelly, S.; Shaner, R.L.; et al. Lipidomics Reveals a Remarkable Diversity of Lipids in Human Plasma. J. Lipid Res. 2010, 51, 3299–3305. [Google Scholar] [CrossRef]
- Calvillo-Robledo, A.; Cervantes-Villagrana, R.D.; Morales, P.; Marichal-Cancino, B.A. The Oncogenic Lysophosphatidylinositol (LPI)/GPR55 Signaling. Life Sci. 2022, 301, 120596. [Google Scholar] [CrossRef]
- Falasca, M.; Ferro, R. Role of the Lysophosphatidylinositol/GPR55 Axis in Cancer. Adv. Biol. Regul. 2016, 60, 88–93. [Google Scholar] [CrossRef] [PubMed]
- Hong, H.; Yoon, B.; Ghil, S. Interactions Between Lysophosphatidylinositol Receptor GPR55 and Sphingosine-1-Phosphate Receptor S1P(5) in Live Cells. Biochem. Biophys. Res. Commun. 2021, 570, 53–59. [Google Scholar] [CrossRef] [PubMed]
- Wang, P.; Yuan, Y.; Lin, W.; Zhong, H.; Xu, K.; Qi, X. Roles of Sphingosine-1-Phosphate Signaling in Cancer. Cancer Cell Int. 2019, 19, 295. [Google Scholar] [CrossRef] [PubMed]
- Hanyu, T.; Nagahashi, M.; Ichikawa, H.; Ishikawa, T.; Kobayashi, T.; Wakai, T. Expression of Phosphorylated Sphingosine Kinase 1 is Associated with Diffuse Type and Lymphatic Invasion in Human Gastric Cancer. Surgery 2018, 163, 1301–1306. [Google Scholar] [CrossRef]
- Nagahashi, M.; Tsuchida, J.; Moro, K.; Hasegawa, M.; Tatsuda, K.; Woelfel, I.A.; Takabe, K.; Wakai, T. High Levels of Sphingolipids in Human Breast Cancer. J. Surg. Res. 2016, 204, 435–444. [Google Scholar] [CrossRef] [PubMed]
- Yuza, K.; Nakajima, M.; Nagahashi, M.; Tsuchida, J.; Hirose, Y.; Miura, K.; Tajima, Y.; Abe, M.; Sakimura, K.; Takabe, K.; et al. Different Roles of Sphingosine Kinase 1 and 2 in Pancreatic Cancer Progression. J. Surg. Res. 2018, 232, 186–194. [Google Scholar] [CrossRef]
- Bayerl, M.G.; Bruggeman, R.D.; Conroy, E.J.; Hengst, J.A.; King, T.S.; Jimenez, M.; Claxton, D.F.; Yun, J.K. Sphingosine Kinase 1 Protein and mRNA are Overexpressed in non-Hodgkin Lymphomas and are Attractive Targets for Novel Pharmacological Interventions. Leuk. Lymphoma 2008, 49, 948–954. [Google Scholar] [CrossRef]
- Itoh, M.; Kitano, T.; Watanabe, M.; Kondo, T.; Yabu, T.; Taguchi, Y.; Iwai, K.; Tashima, M.; Uchiyama, T.; Okazaki, T. Possible Role of Ceramide as an Indicator of Chemoresistance: Decrease of the Ceramide Content via Activation of Glucosylceramide Synthase and Sphingomyelin Synthase in Chemoresistant Leukemia. Clin. Cancer Res. 2003, 9, 415–423. [Google Scholar]
- Hori, A.; Ishida, F.; Nakazawa, H.; Yamaura, M.; Morita, S.; Uehara, T.; Honda, T.; Hidaka, H. Serum Sphingomyelin Species Profile is Altered in Hematologic Malignancies. Clin. Chim. Acta 2021, 514, 29–33. [Google Scholar] [CrossRef]
- Beyene, H.B.; Olshansky, G.; AA, T.S.; Giles, C.; Huynh, K.; Cinel, M.; Mellett, N.A.; Cadby, G.; Hung, J.; Hui, J.; et al. High-Coverage Plasma Lipidomics Reveals Novel Sex-Specific Lipidomic Fingerprints of Age and BMI: Evidence from Two Large Population Cohort Studies. PLoS Biol. 2020, 18, e3000870. [Google Scholar] [CrossRef]


| Characteristics | Levels | Normal Values | |
|---|---|---|---|
| DLBCL | CTRL | ||
| Age | 59 (36–69) | 49 (30–64) | |
| BMI | 23.8 (19.4–32.2) | 22.6 (19.6–29.5) | 19.0–29.0 |
| Triglycerides (mmol/L) | 1.3 (0.6–2.6) | <1.7 | |
| Total cholesterol (mmol/L) | 4.6 (1.4–6.8) | 3.9–5.2 | |
| AST (IU/L) | 17 (11–28) | <40 | |
| ALT (IU/L) | 17 (6–36) | <41 | |
| GGT (IU/L) | 17 (10–43) | 8–61 | |
| ALP (U/L) | 70 (39–116) | 40–130 | |
| LDH | 337 (246–633) | <250 |
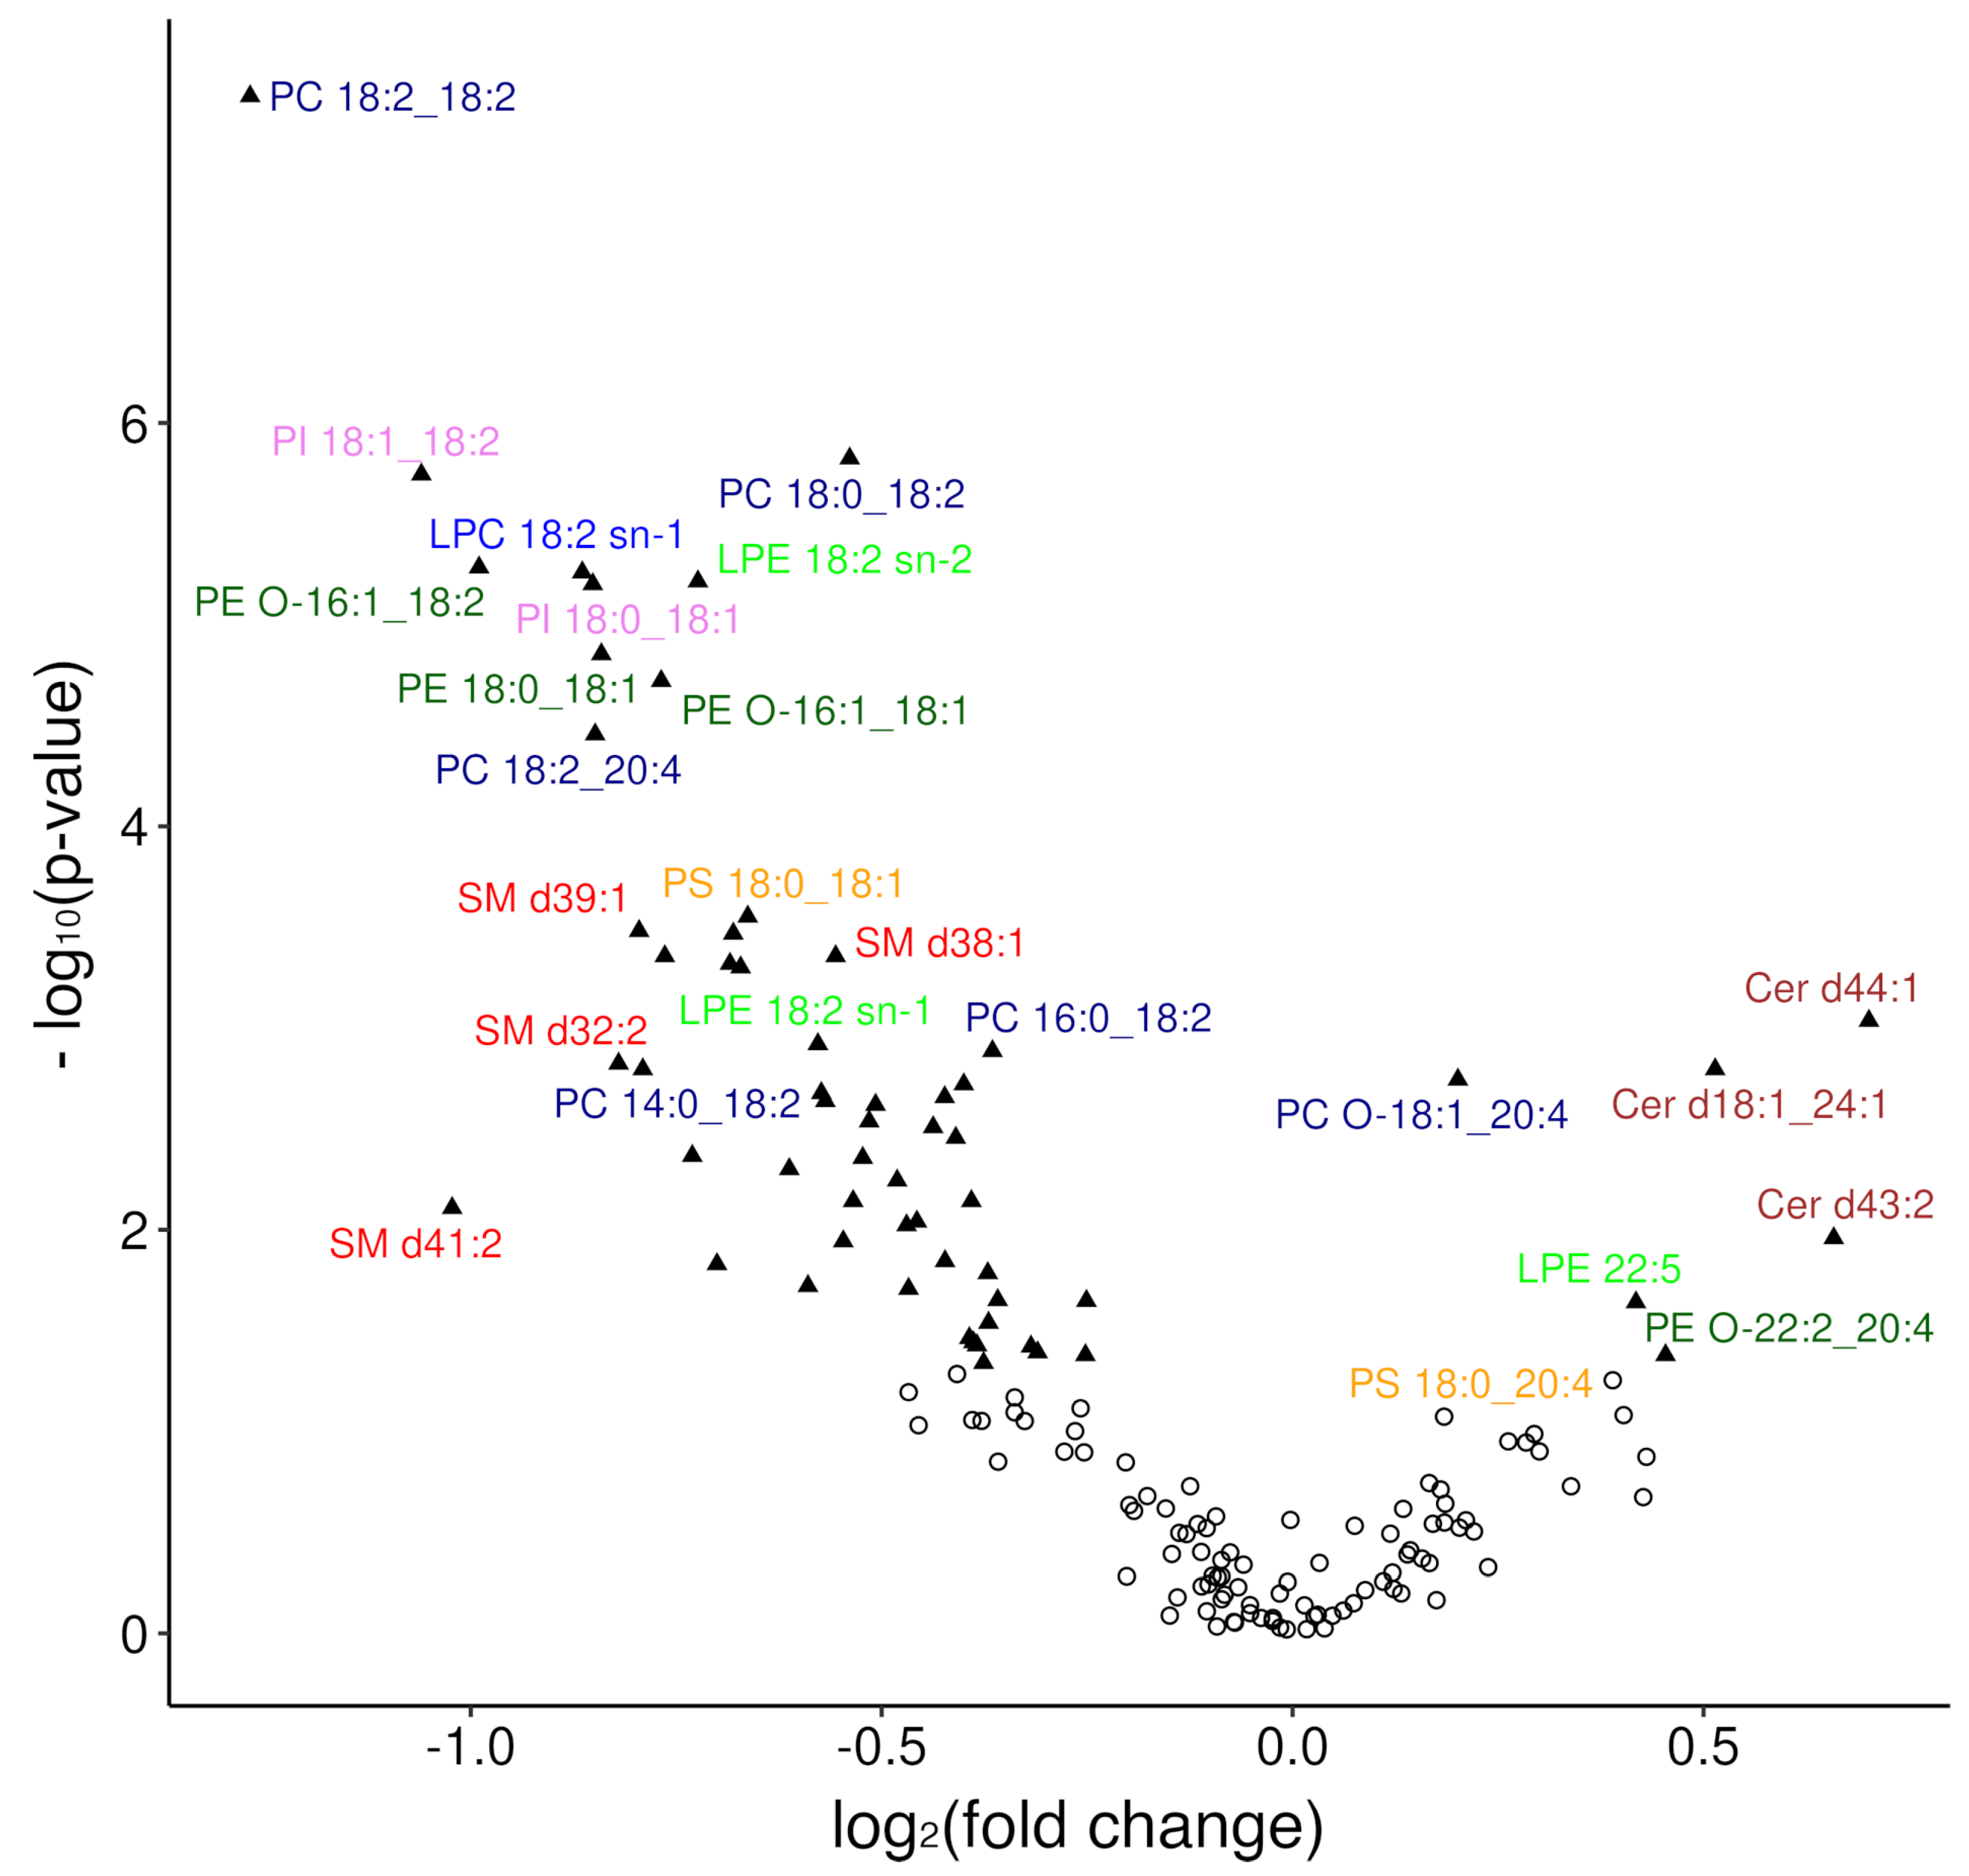
| Lipid Species | p-Value | Sig. | FC | Trend |
|---|---|---|---|---|
| PC 18:2_18:2 | 2.4 × 10⁻⁸ | **** | 0.42 | ↓ |
| PC 18:0_18:2 | 1.5 × 10⁻⁶ | **** | 0.69 | ↓ |
| PI 18:1_18:2 | 1.8 × 10⁻⁶ | **** | 0.48 | ↓ |
| PE O-16:1_18:2 | 5.2 × 10⁻⁶ | **** | 0.5 | ↓ |
| LPC 18:2 sn-1 | 5.5 × 10⁻⁶ | **** | 0.55 | ↓ |
| LPE 18:2 sn-2 | 6.1 × 10⁻⁶ | **** | 0.61 | ↓ |
| PI 18:0_18:1 | 6.3 × 10⁻⁶ | **** | 0.55 | ↓ |
| PE 18:0_18:1 | 1.4 ×10⁻⁵ | **** | 0.56 | ↓ |
| PE O-16:1_18:1 | 1.9 × 10⁻⁵ | **** | 0.59 | ↓ |
| PC 18:2_20:4 | 3.5 × 10⁻⁵ | **** | 0.56 | ↓ |
| PS 18:0_18:1 | 0.00028 | *** | 0.63 | ↓ |
| SM d39:1 | 0.00033 | *** | 0.58 | ↓ |
| SM d32:1 | 0.00034 | *** | 0.62 | ↓ |
| SM d38:1 | 0.00044 | *** | 0.68 | ↓ |
| PE O-17:1_18:2 | 0.00044 | *** | 0.59 | ↓ |
| Cer d40:2 | 0.00048 | *** | 0.62 | ↓ |
| PI 16:0_18:1 | 0.00051 | *** | 0.63 | ↓ |
| Cer d44:1 | 0.00092 | *** | 1.63 | ↑ |
| LPE 18:2 sn-1 | 0.0012 | ** | 0.67 | ↓ |
| PC 16:0_18:2 | 0.0013 | ** | 0.78 | ↓ |
| SM d32:2 | 0.0015 | ** | 0.57 | ↓ |
| PC 14:0_18:2 | 0.0016 | ** | 0.58 | ↓ |
| Cer d18:1_24:1 | 0.0016 | ** | 1.43 | ↑ |
| PC O-18:1_20:4 | 0.0018 | ** | 1.15 | ↑ |
| PC 17:0_18:2 | 0.0019 | ** | 0.76 | ↓ |
| LPE 18:1 sn-1 | 0.0021 | ** | 0.67 | ↓ |
| PC 18:1_18:2 | 0.0022 | ** | 0.75 | ↓ |
| PC 16:1_18:2 | 0.0023 | ** | 0.67 | ↓ |
| SM 34:0;O3 | 0.0024 | ** | 0.7 | ↓ |
| PI 18:1_20:4 | 0.0029 | ** | 0.7 | ↓ |
| PE O-20:1_18:2 | 0.0031 | ** | 0.74 | ↓ |
| PC 18:0_18:1 | 0.0035 | ** | 0.75 | ↓ |
| PE O-17:1_22:6 | 0.0043 | ** | 0.6 | ↓ |
| SM d33:1 | 0.0044 | ** | 0.7 | ↓ |
| PC 19:0_18:2 | 0.005 | ** | 0.65 | ↓ |
| PC 20:4_20:4 | 0.0057 | ** | 0.72 | ↓ |
| SM d24:2_14:0 | 0.0072 | ** | 0.76 | ↓ |
| PE O-18:3_20:4 | 0.0072 | ** | 0.69 | ↓ |
| SM d41:2 | 0.0078 | ** | 0.49 | ↓ |
| PE O-16:1_20:4 | 0.0091 | ** | 0.73 | ↓ |
| PI 16:0_18:2 | 0.0095 | ** | 0.72 | ↓ |
| Cer d43:2 | 0.011 | * | 1.58 | ↑ |
| PE O-17:1_20:4 | 0.0114 | * | 0.69 | ↓ |
| SM d36:3 | 0.0143 | * | 0.75 | ↓ |
| PC 14:0_20:4 | 0.0148 | * | 0.62 | ↓ |
| SM d18:1_16:1 | 0.0164 | * | 0.77 | ↓ |
| PC 14:0_22:6 | 0.019 | * | 0.67 | ↓ |
| PE O-18:2_20:4 | 0.0196 | * | 0.72 | ↓ |
| PI 18:0_18:2 | 0.0223 | * | 0.78 | ↓ |
| SM d34:0 | 0.0225 | * | 0.84 | ↓ |
| LPE 22:5 | 0.0229 | * | 1.34 | ↑ |
| LPE 20:4 sn-1 | 0.0289 | * | 0.77 | ↓ |
| PE O-18:2_22:6 | 0.0344 | * | 0.76 | ↓ |
| PE 18:1_18:2 | 0.0361 | * | 0.76 | ↓ |
| PC 15:0_20:4 | 0.0374 | * | 0.77 | ↓ |
| SM d40:1 | 0.0379 | * | 0.8 | ↓ |
| SM d35:2 | 0.0405 | * | 0.81 | ↓ |
| SM 34:1;O3 | 0.0418 | * | 0.84 | ↓ |
| PE O-22:2_20:4 | 0.0418 | * | 1.37 | ↑ |
| PC 17:1_18:2 | 0.0457 | * | 0.77 | ↓ |
| Lipid Species | VIP | q-Value | FC | Change Trend | n1 | n2 |
|---|---|---|---|---|---|---|
| S1P | 2.113 | 0.00007 | 1.85 | ↑ | 0 | 2 |
| SM 36:1 | 2.032 | 0.00140 | 2.10 | ↑ | 2 | 2 |
| SM 34:1 | 1.938 | 0.00467 | 1.77 | ↑ | 1 | 2 |
| PI 34:1 | 1.673 | 0.01131 | 0.62 | ↓ | 1 | 2 |
| SM 42:1 | 1.423 | ns | 1.25 | ↑ | 1 | 2 |
| PS 38:4 | 1.400 | 0.03456 | 1.49 | ↑ | 0 | 0 |
| LPI 20:4 | 1.370 | 0.03456 | 1.45 | ↑ | 0 | 0 |
| 12(S)-HETE | 1.180 | 0.02170 | 3.15 | ↑ | 0 | 2 |
| LA | 1.151 | 0.03325 | 1.46 | ↑ | 1 | 3 |
| RvD1 | 1.098 | ns | 1.34 | ↑ | 0 | 0 |
| PE 38:6 | 1.091 | ns | 1.34 | ↑ | 1 | 0 |
| 15(S)-HETE | 1.025 | 0.08225 | 1.45 | ↑ | 0 | 1 |
| TxB2 | 0.970 | ns | 3.12 | ↑ | 0 | 0 |
| 20-HETE | 0.917 | 0.07350 | 1.45 | ↑ | 0 | 0 |
| PE 38:4 | 0.905 | ns | 1.19 | ↑ | 0 | 2 |
| 5(S)-HETE | 0.843 | ns | 1.30 | ↑ | 2 | 3 |
| 8(S)-HETE | 0.522 | ns | 1.15 | ↑ | 2 | 3 |
| AA | 0.363 | ns | 1.13 | ↑ | 3 | 3 |
Disclaimer/Publisher’s Note: The statements, opinions and data contained in all publications are solely those of the individual author(s) and contributor(s) and not of MDPI and/or the editor(s). MDPI and/or the editor(s) disclaim responsibility for any injury to people or property resulting from any ideas, methods, instructions or products referred to in the content. |
© 2023 by the authors. Licensee MDPI, Basel, Switzerland. This article is an open access article distributed under the terms and conditions of the Creative Commons Attribution (CC BY) license (https://creativecommons.org/licenses/by/4.0/).
Share and Cite
Masnikosa, R.; Pirić, D.; Post, J.M.; Cvetković, Z.; Petrović, S.; Paunović, M.; Vučić, V.; Bindila, L. Disturbed Plasma Lipidomic Profiles in Females with Diffuse Large B-Cell Lymphoma: A Pilot Study. Cancers 2023, 15, 3653. https://doi.org/10.3390/cancers15143653
Masnikosa R, Pirić D, Post JM, Cvetković Z, Petrović S, Paunović M, Vučić V, Bindila L. Disturbed Plasma Lipidomic Profiles in Females with Diffuse Large B-Cell Lymphoma: A Pilot Study. Cancers. 2023; 15(14):3653. https://doi.org/10.3390/cancers15143653
Chicago/Turabian StyleMasnikosa, Romana, David Pirić, Julia Maria Post, Zorica Cvetković, Snježana Petrović, Marija Paunović, Vesna Vučić, and Laura Bindila. 2023. "Disturbed Plasma Lipidomic Profiles in Females with Diffuse Large B-Cell Lymphoma: A Pilot Study" Cancers 15, no. 14: 3653. https://doi.org/10.3390/cancers15143653
APA StyleMasnikosa, R., Pirić, D., Post, J. M., Cvetković, Z., Petrović, S., Paunović, M., Vučić, V., & Bindila, L. (2023). Disturbed Plasma Lipidomic Profiles in Females with Diffuse Large B-Cell Lymphoma: A Pilot Study. Cancers, 15(14), 3653. https://doi.org/10.3390/cancers15143653