
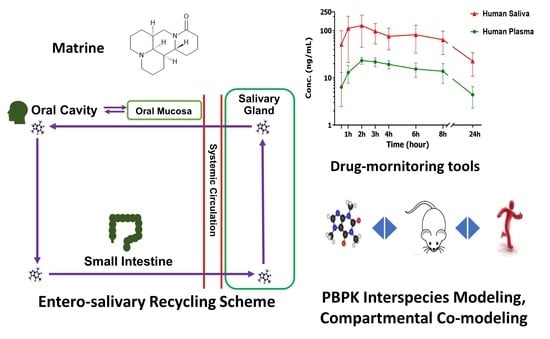
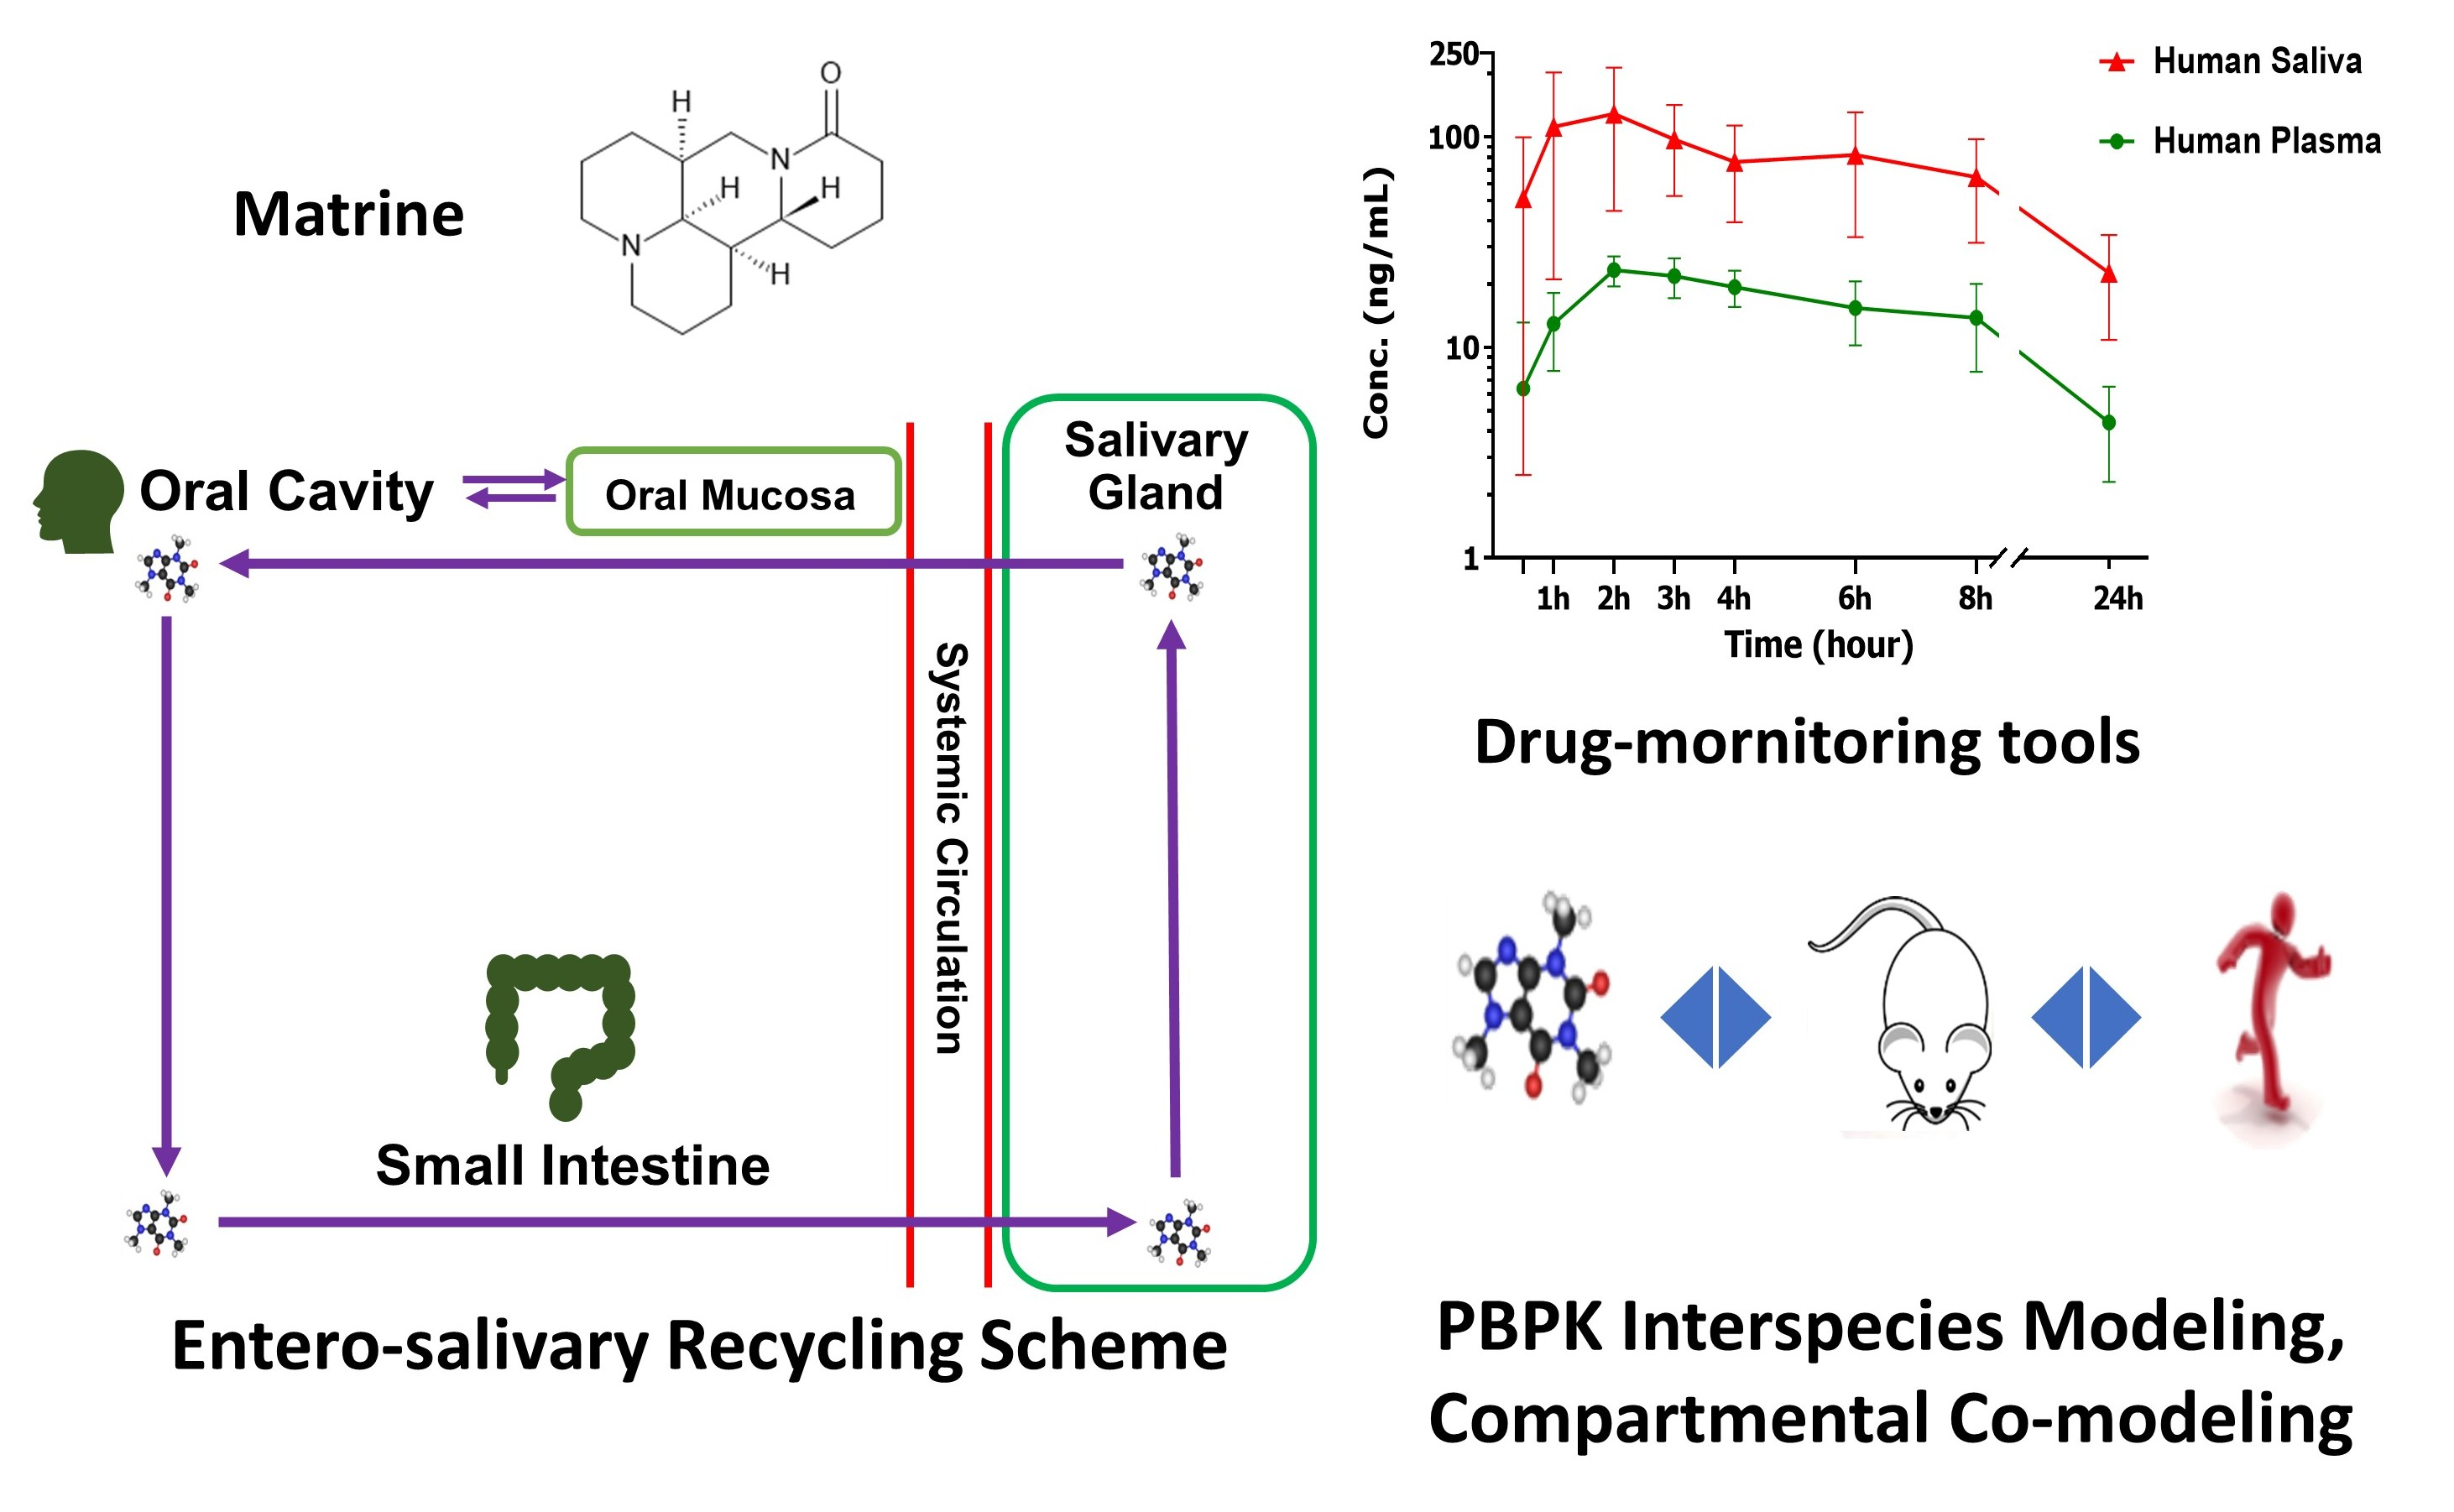
Pharmacokinetic Basis for Using Saliva Matrine Concentrations as a Clinical Compliance Monitoring in Antitumor B Chemoprevention Trials in Humans

Abstract
Simple Summary
Abstract
1. Introduction
2. Materials and Methods
2.1. Materials
2.2. Stability of ATB Tablets
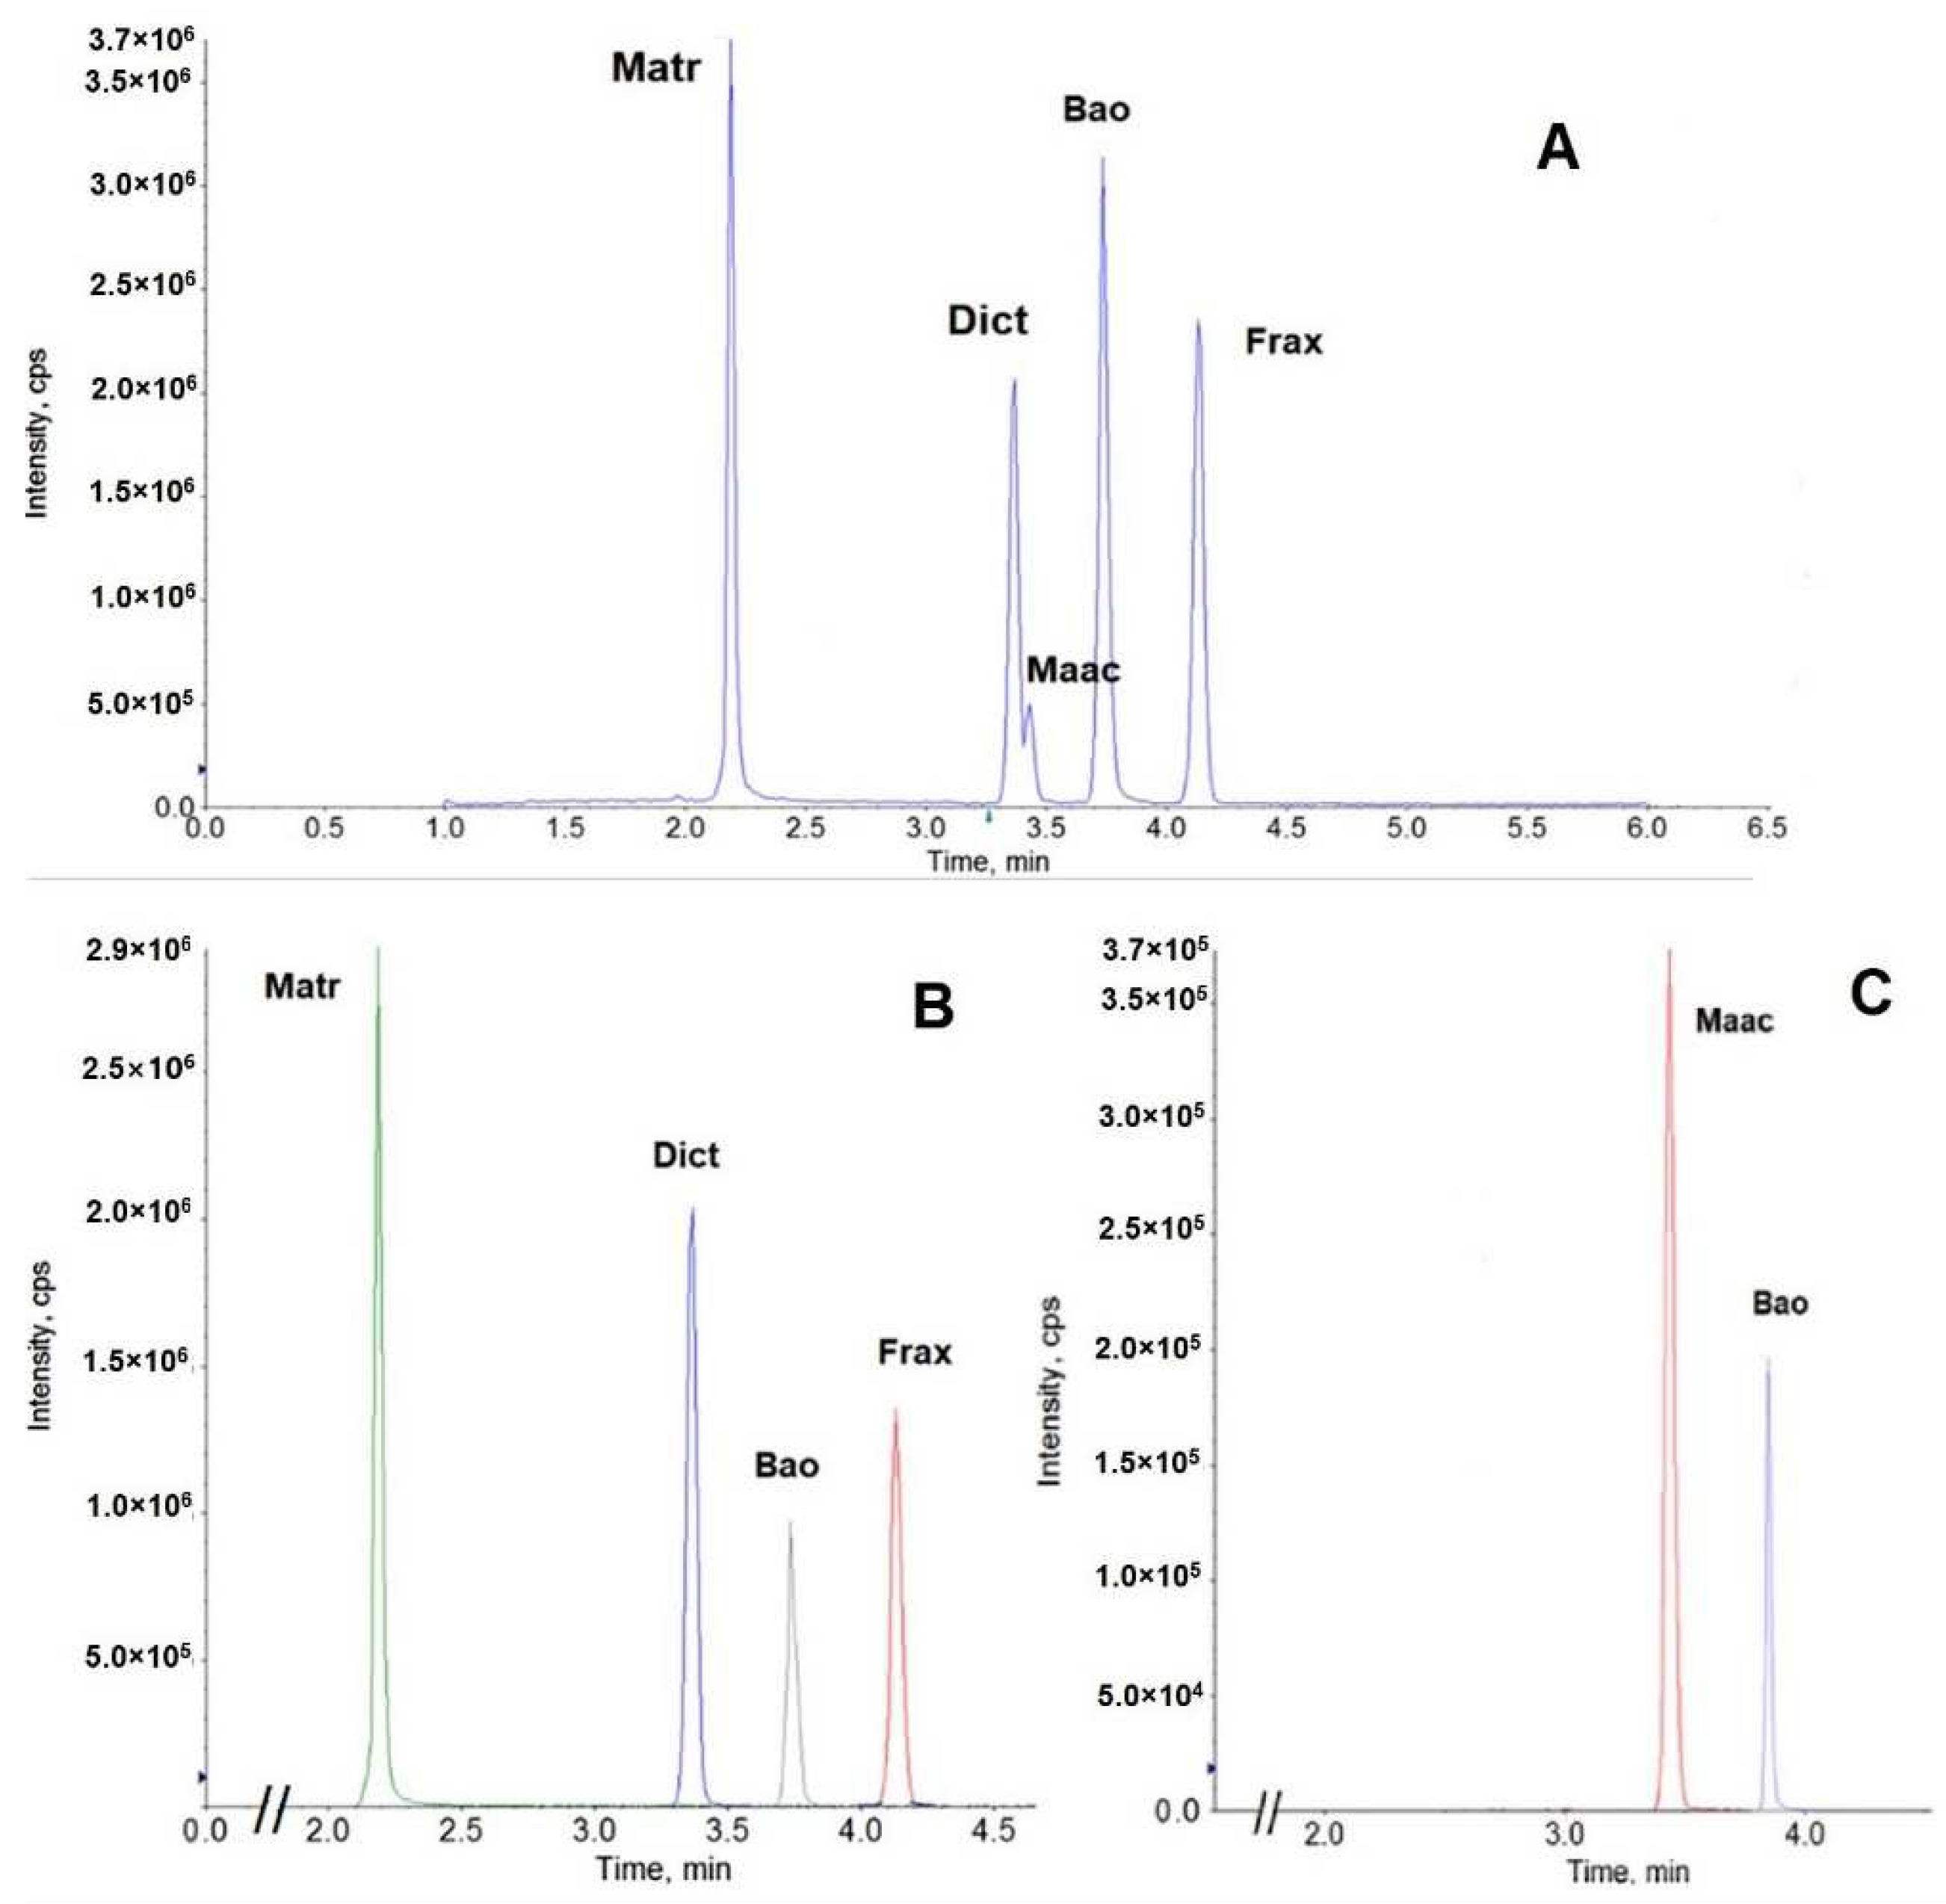
2.3. Quantitative Analysis
2.4. Pharmacokinetics of ATB Compounds in Healthy Adults
Study Design
2.5. Pharmacokinetic Analysis and Modeling
2.5.1. Pharmacokinetics Modeling
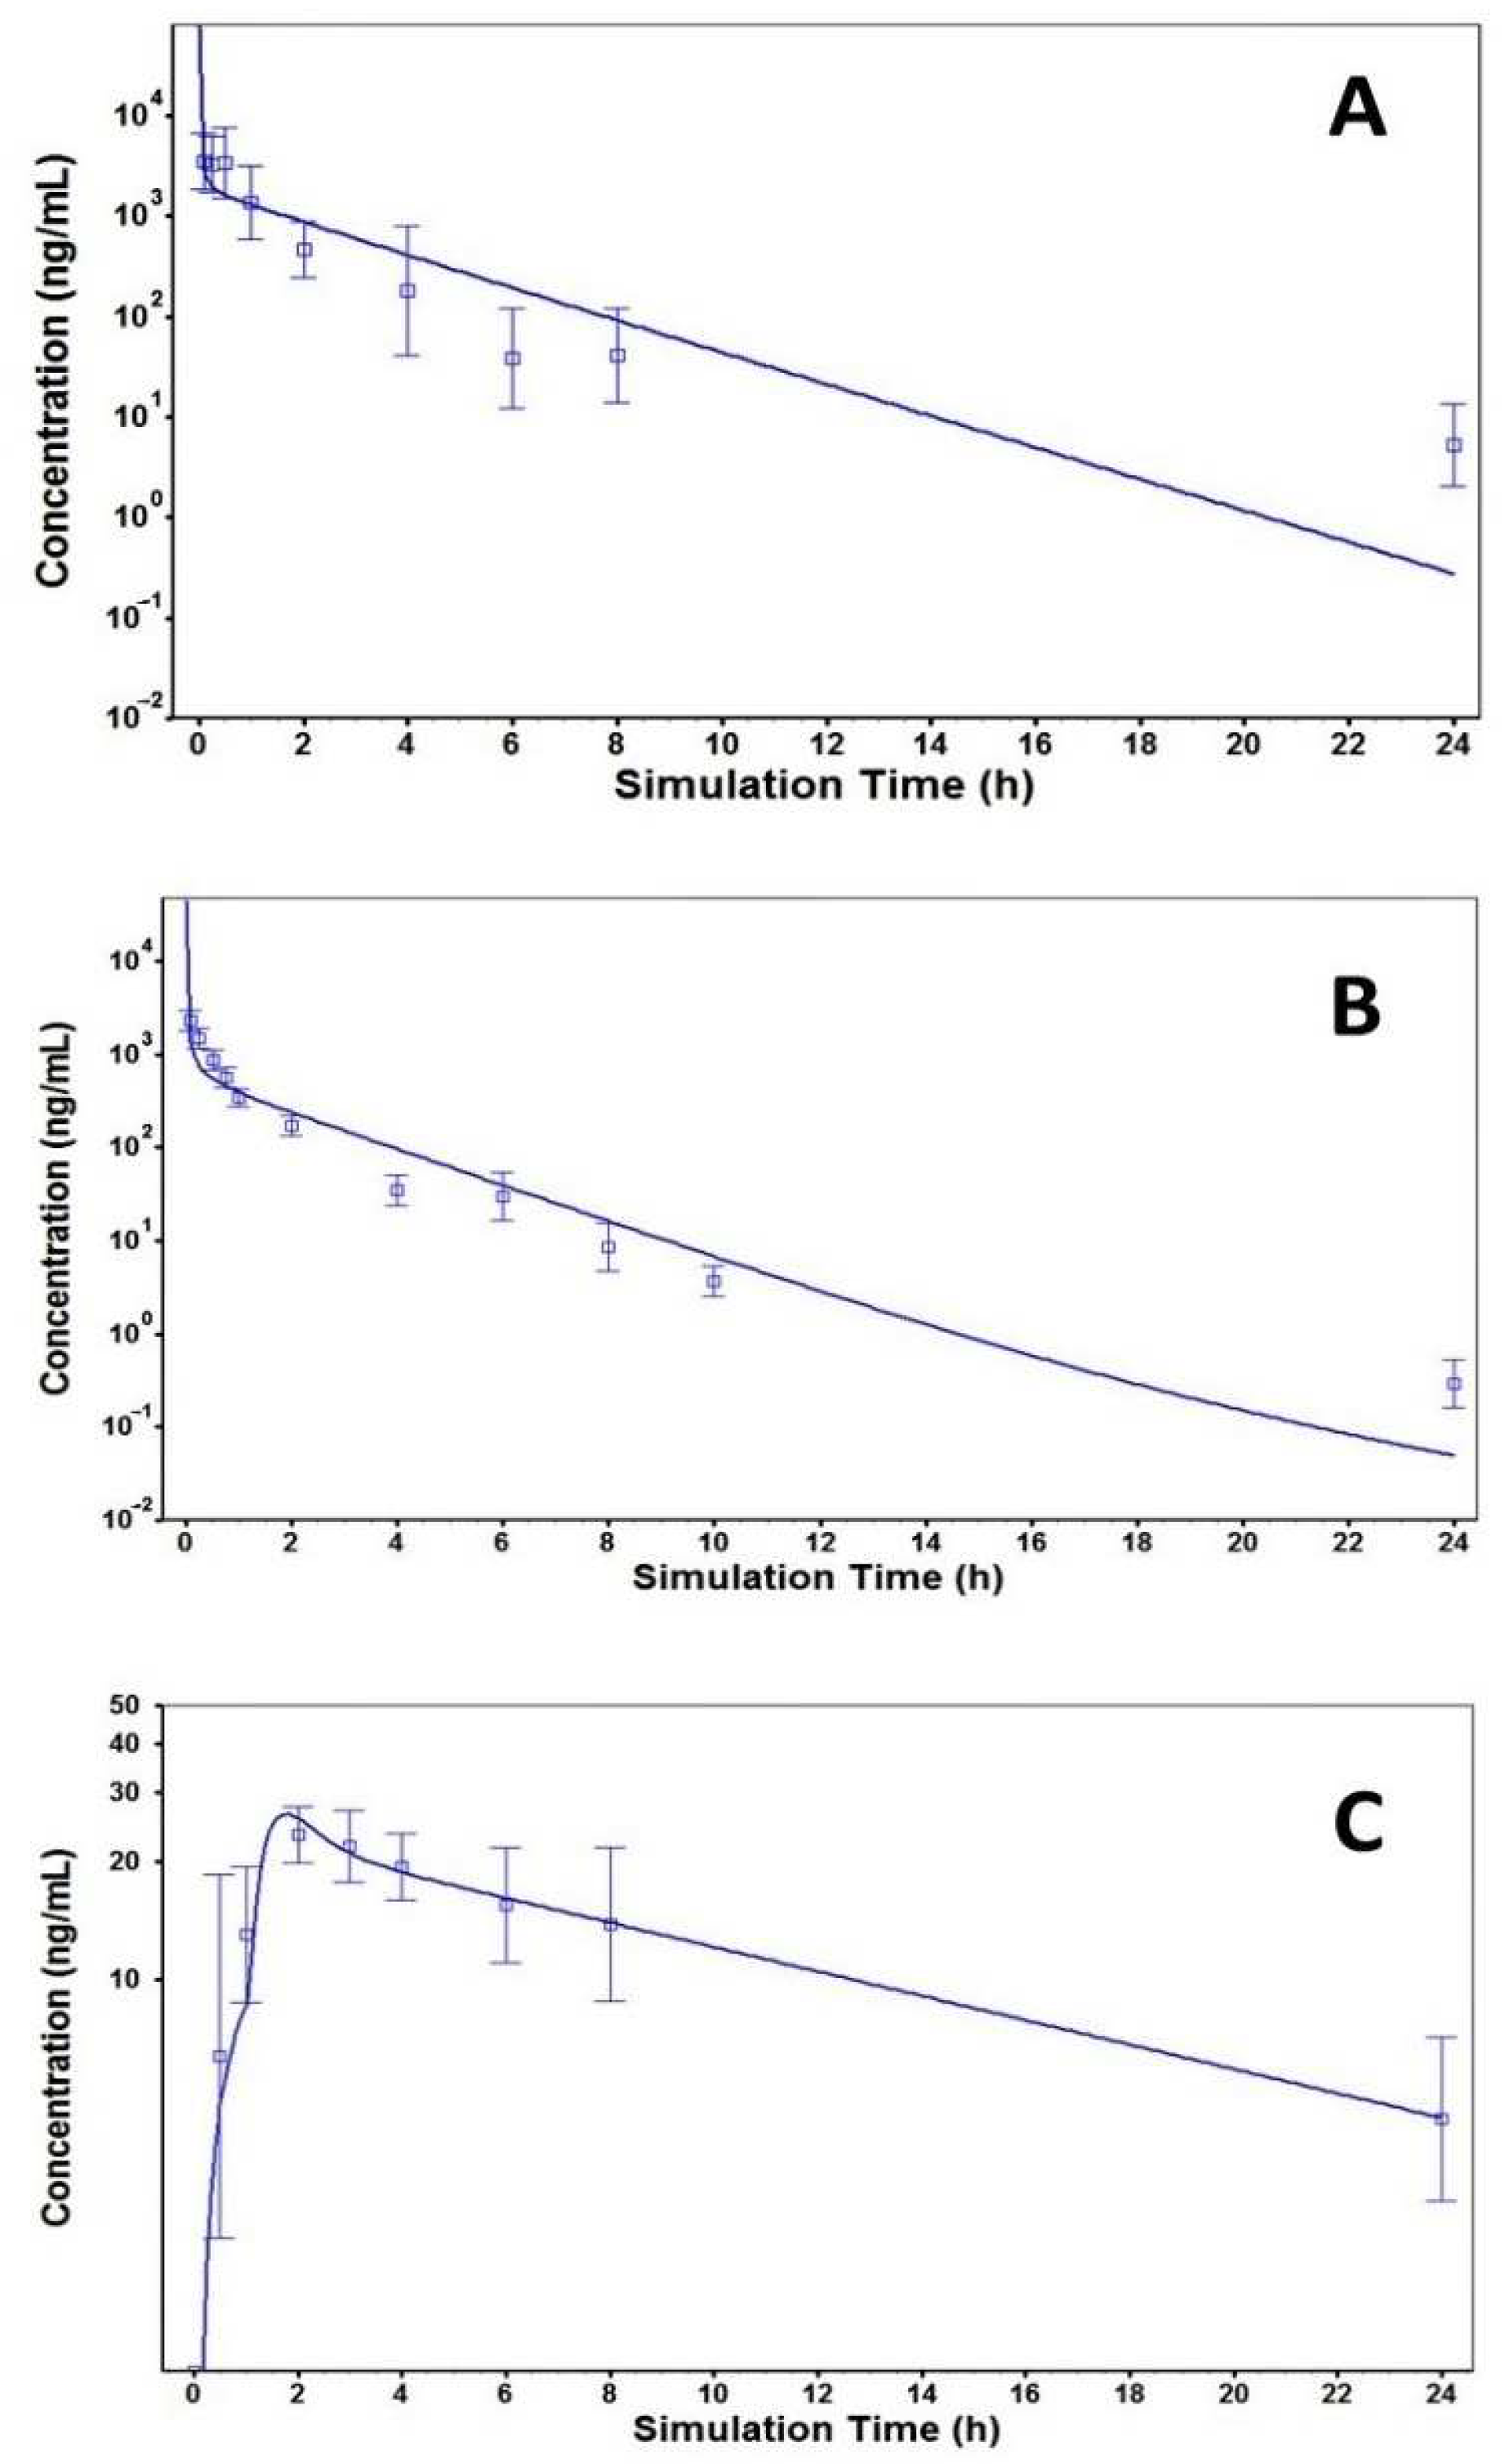
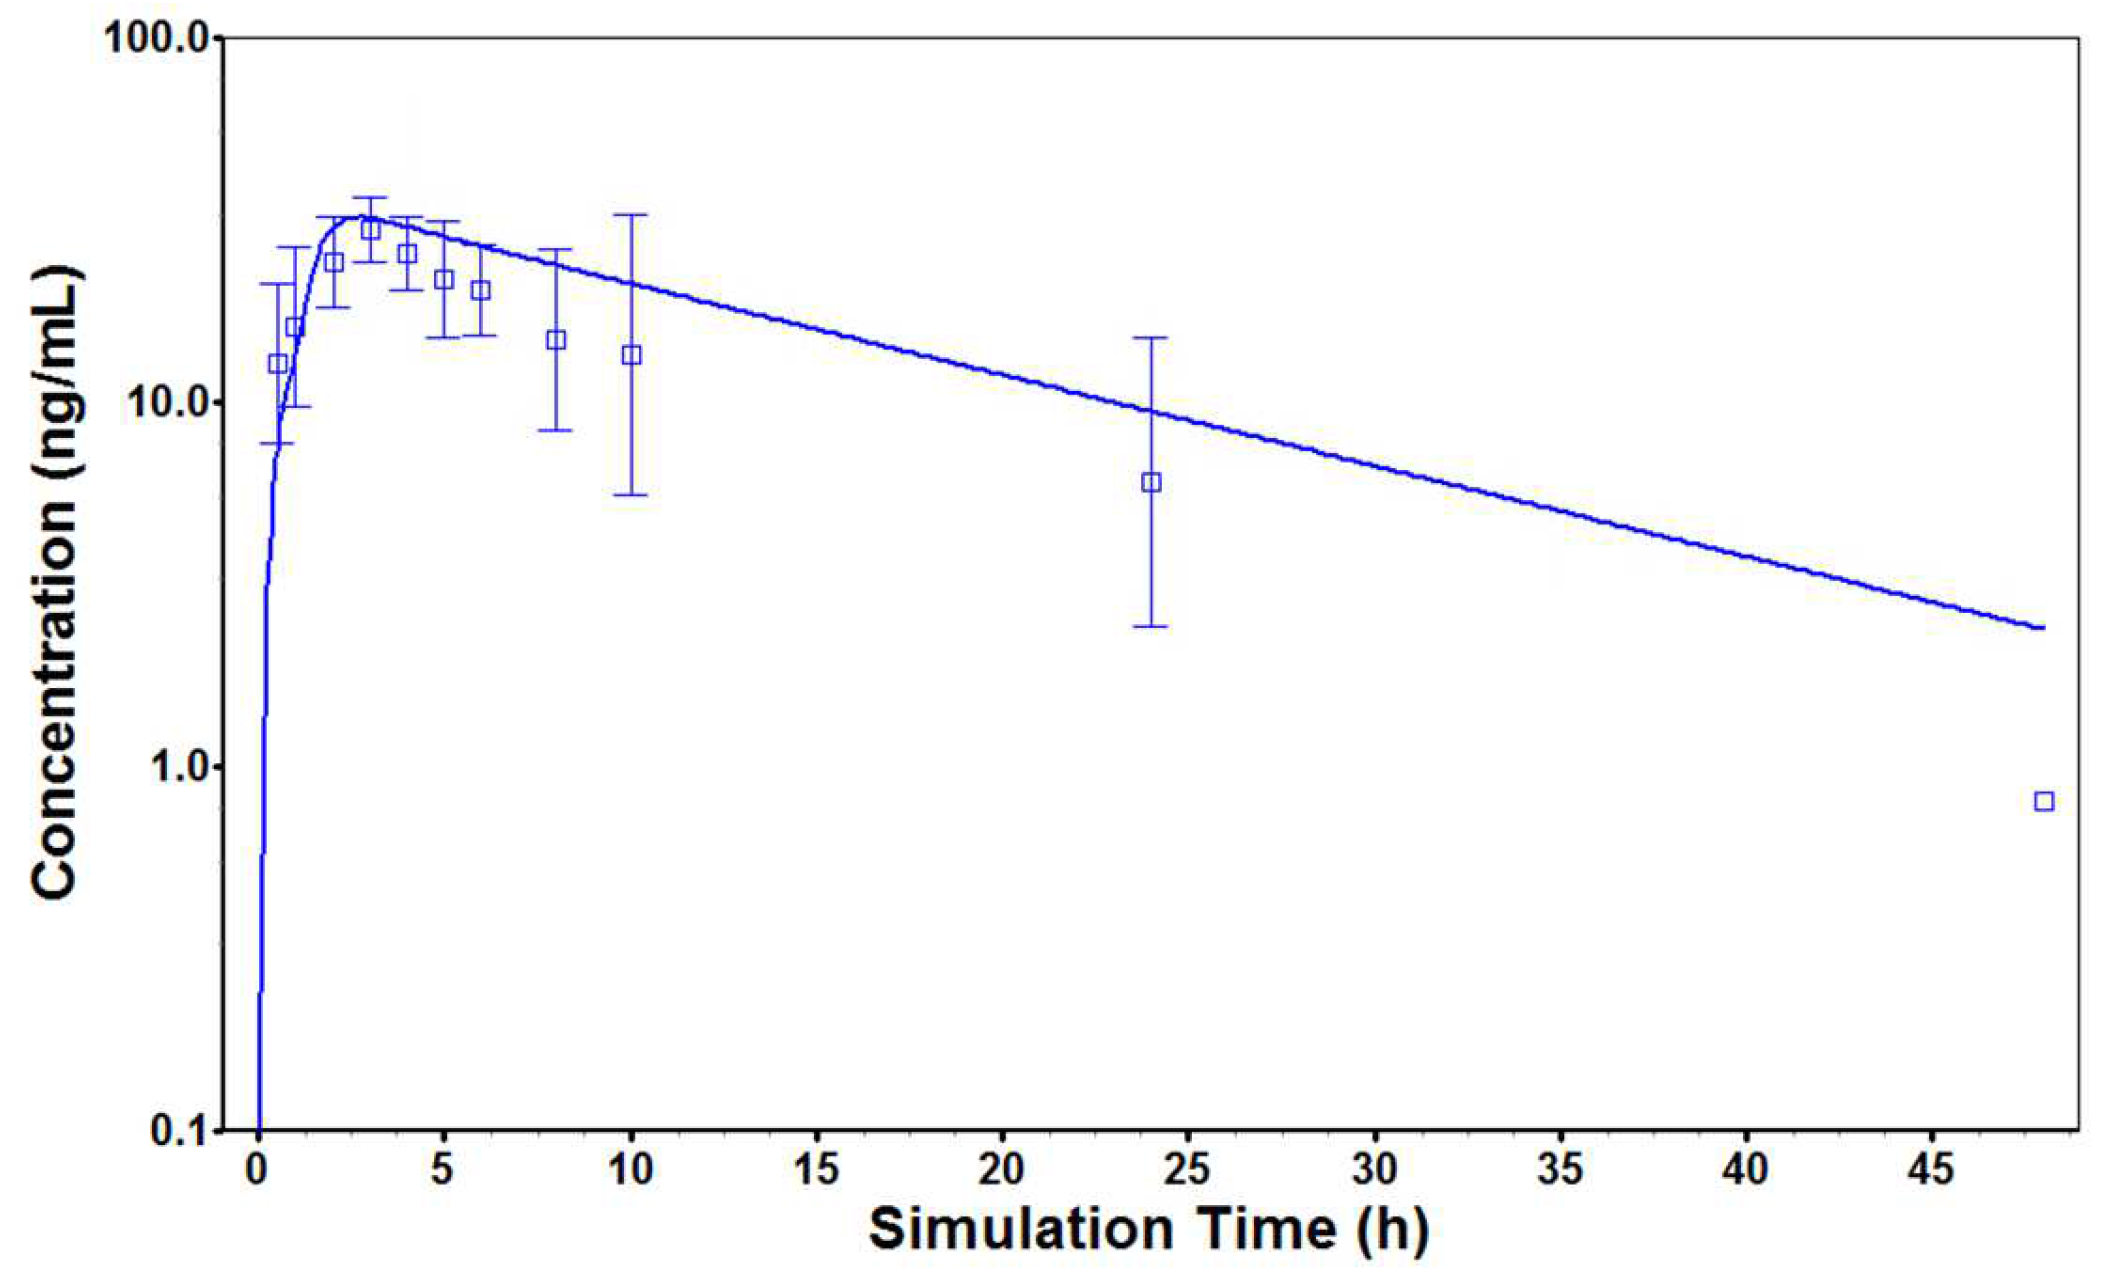
2.5.2. Physiologically Based Pharmacokinetic (PBPK) Modeling and Interspecies Scaling
2.6. Statistical Analysis
3. Results
3.1. Quality Control of ATB Products
3.2. Safety of ATB in Healthy Adults
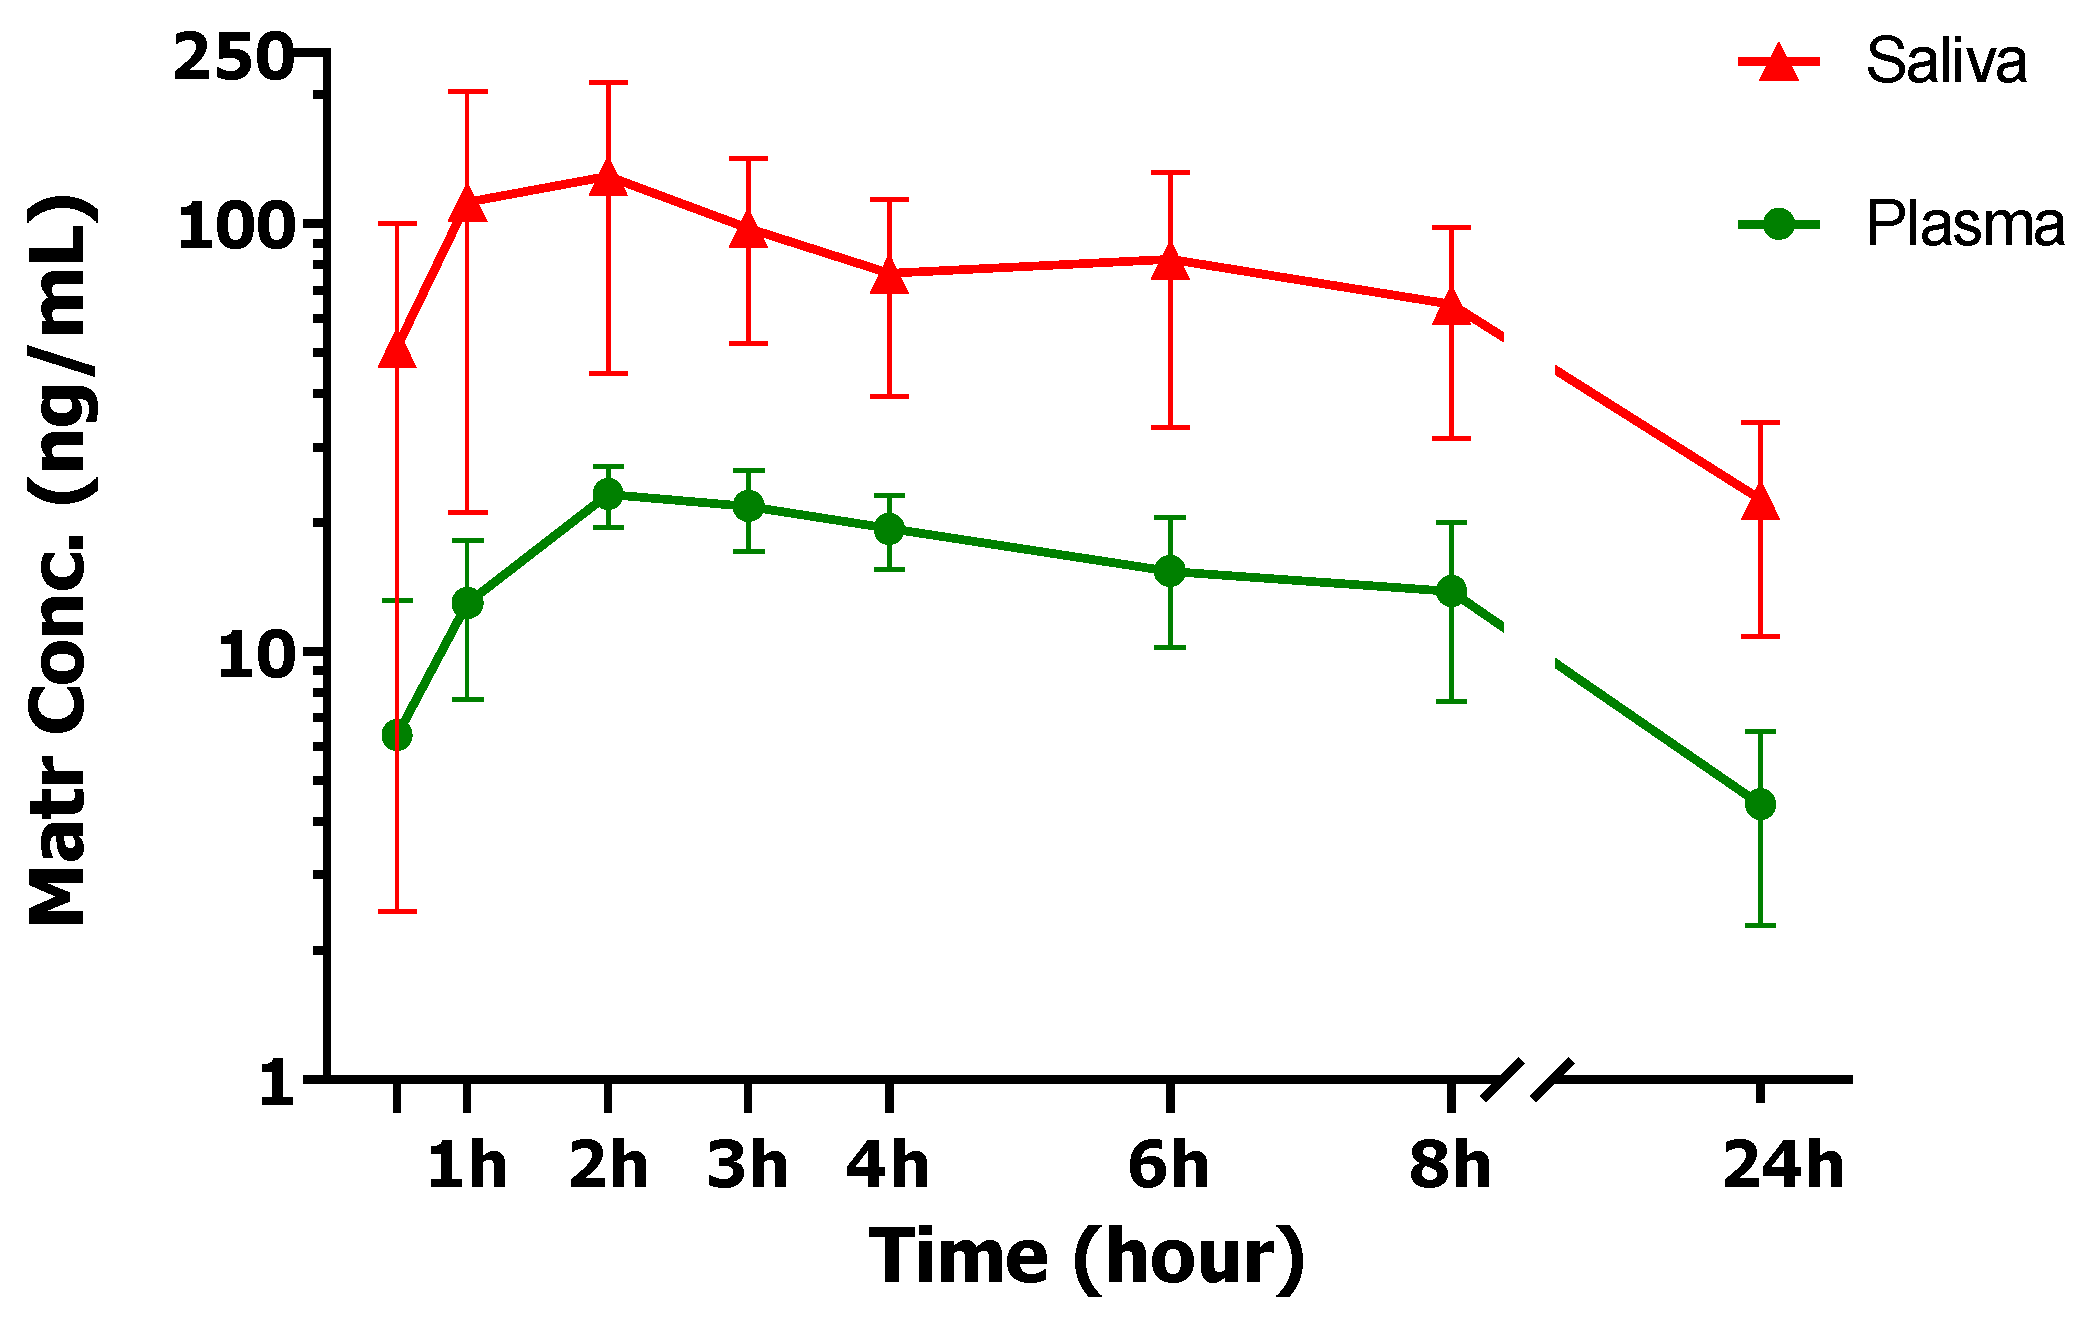
3.3. ATB Pharmacokinetics in Human Plasma and Saliva
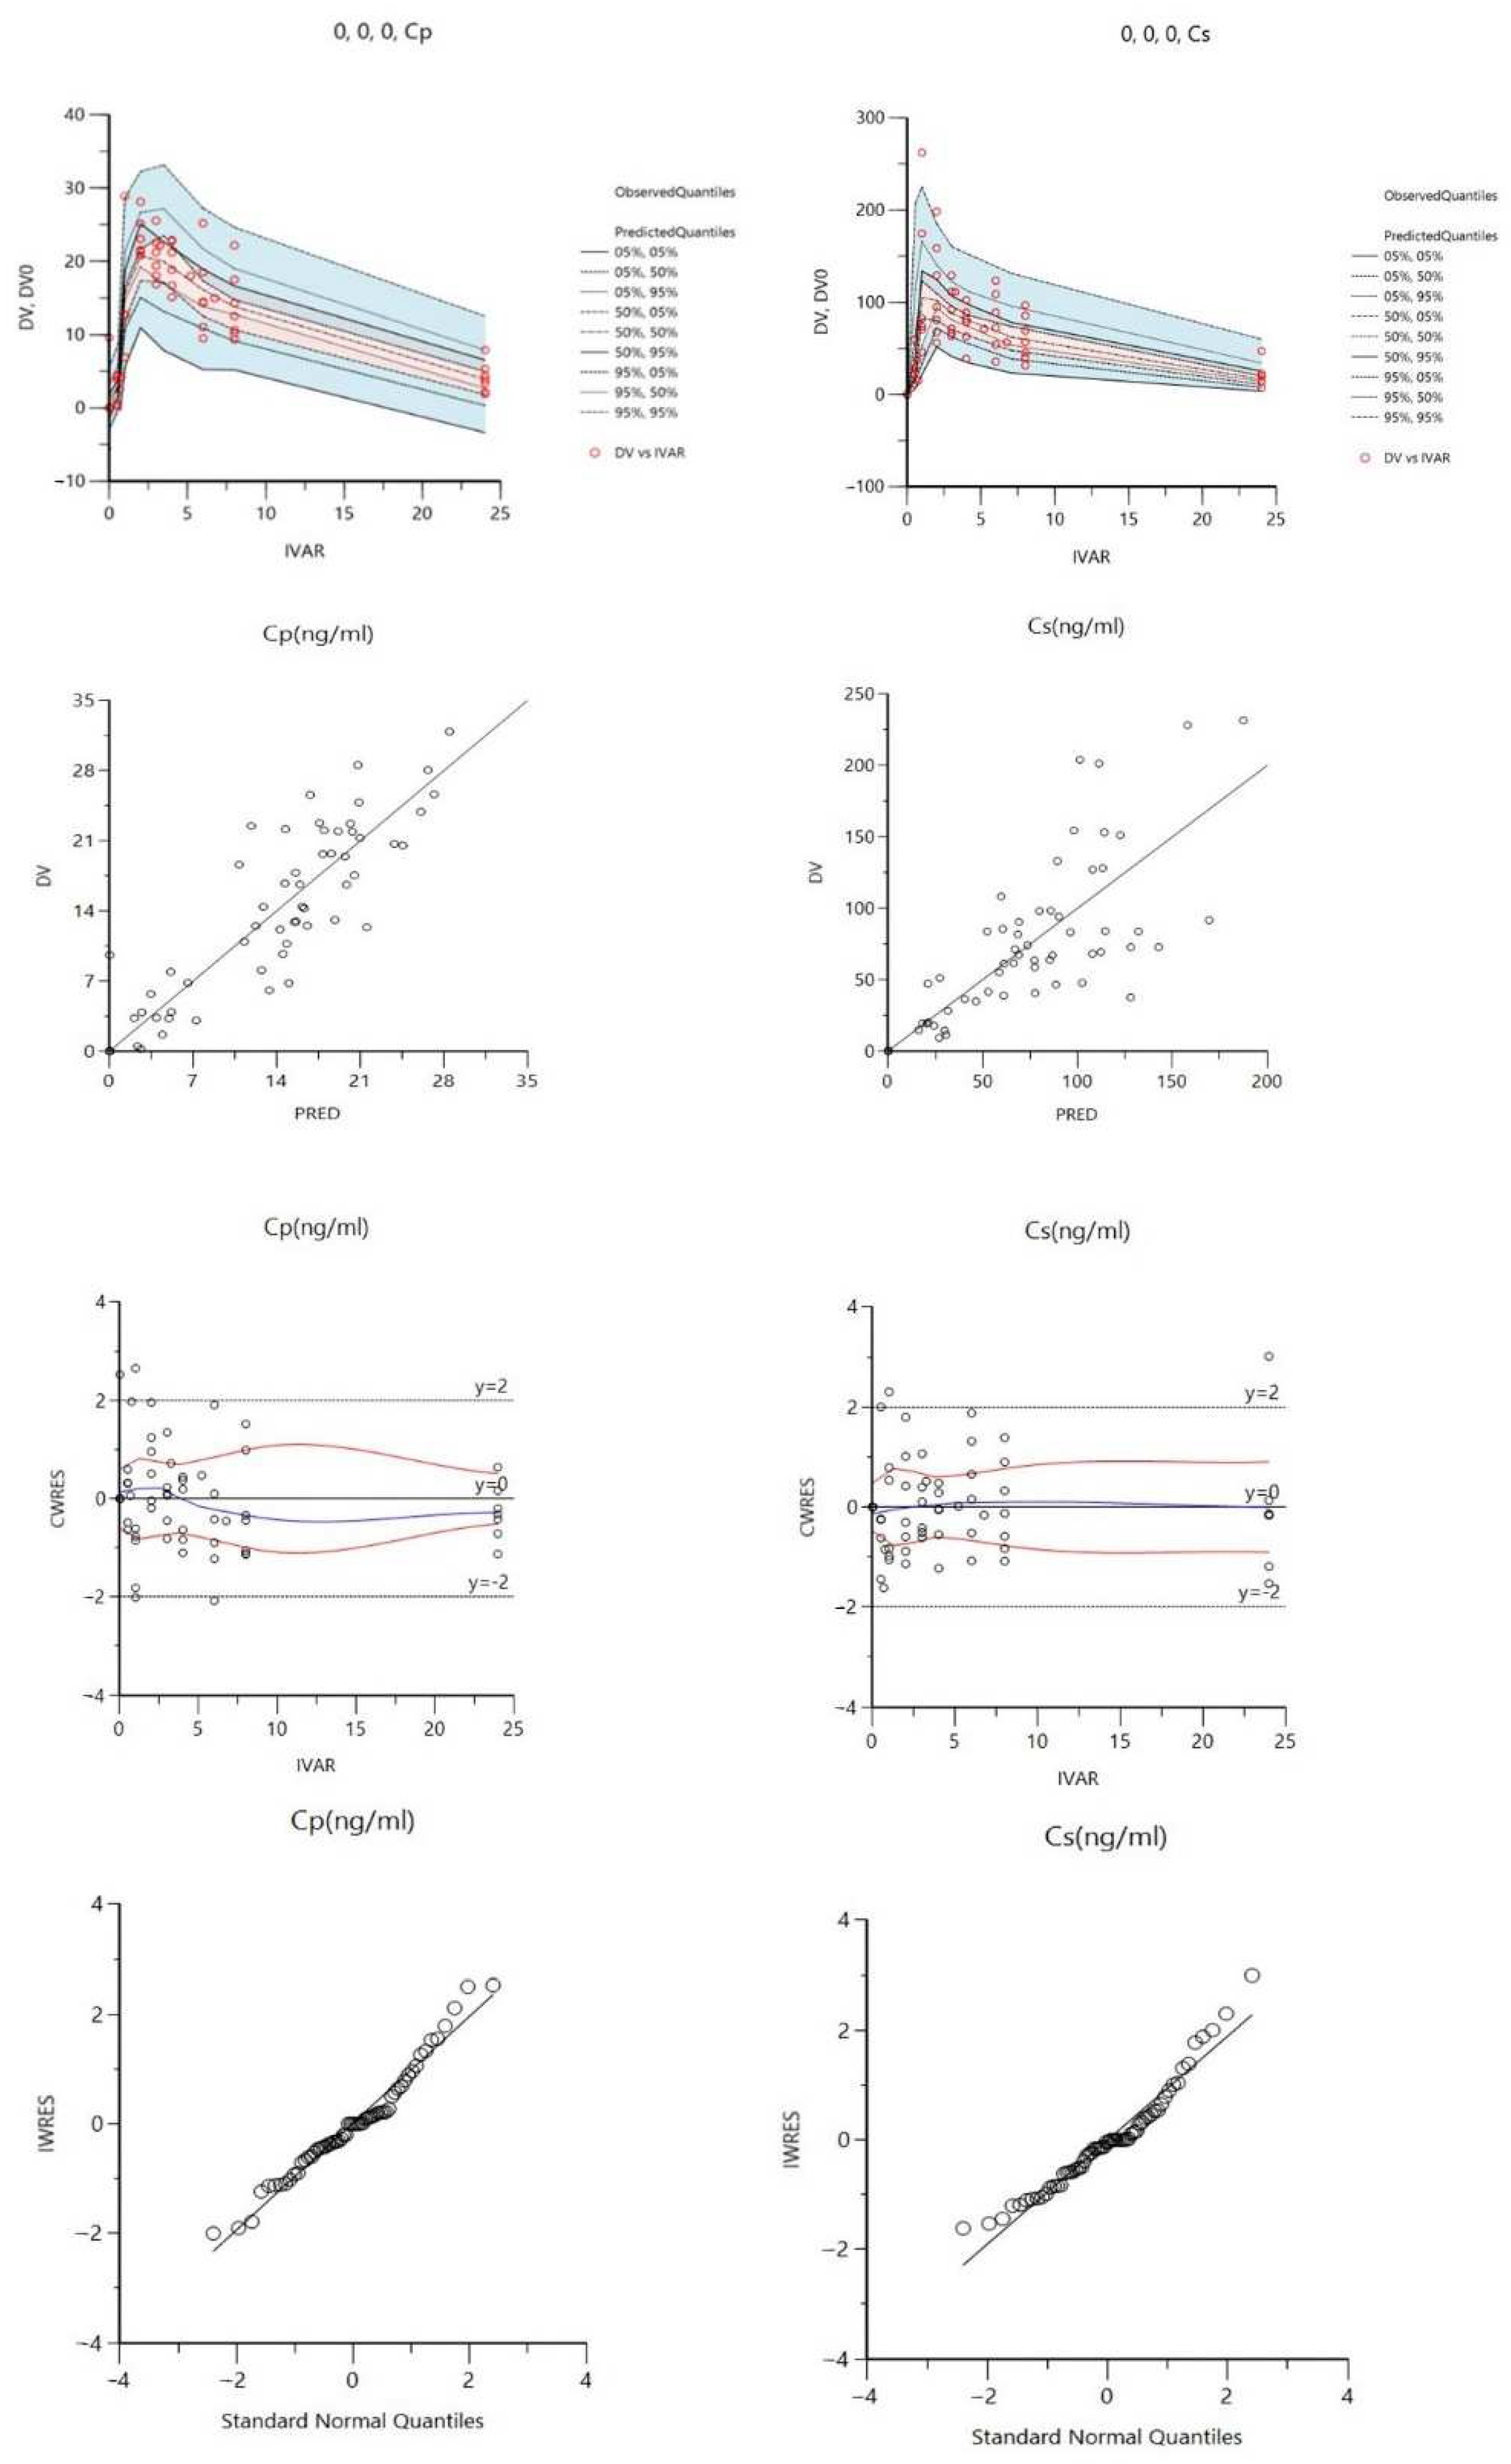
3.4. Compartmental Co-Modeling of Matrine in Plasma and Saliva
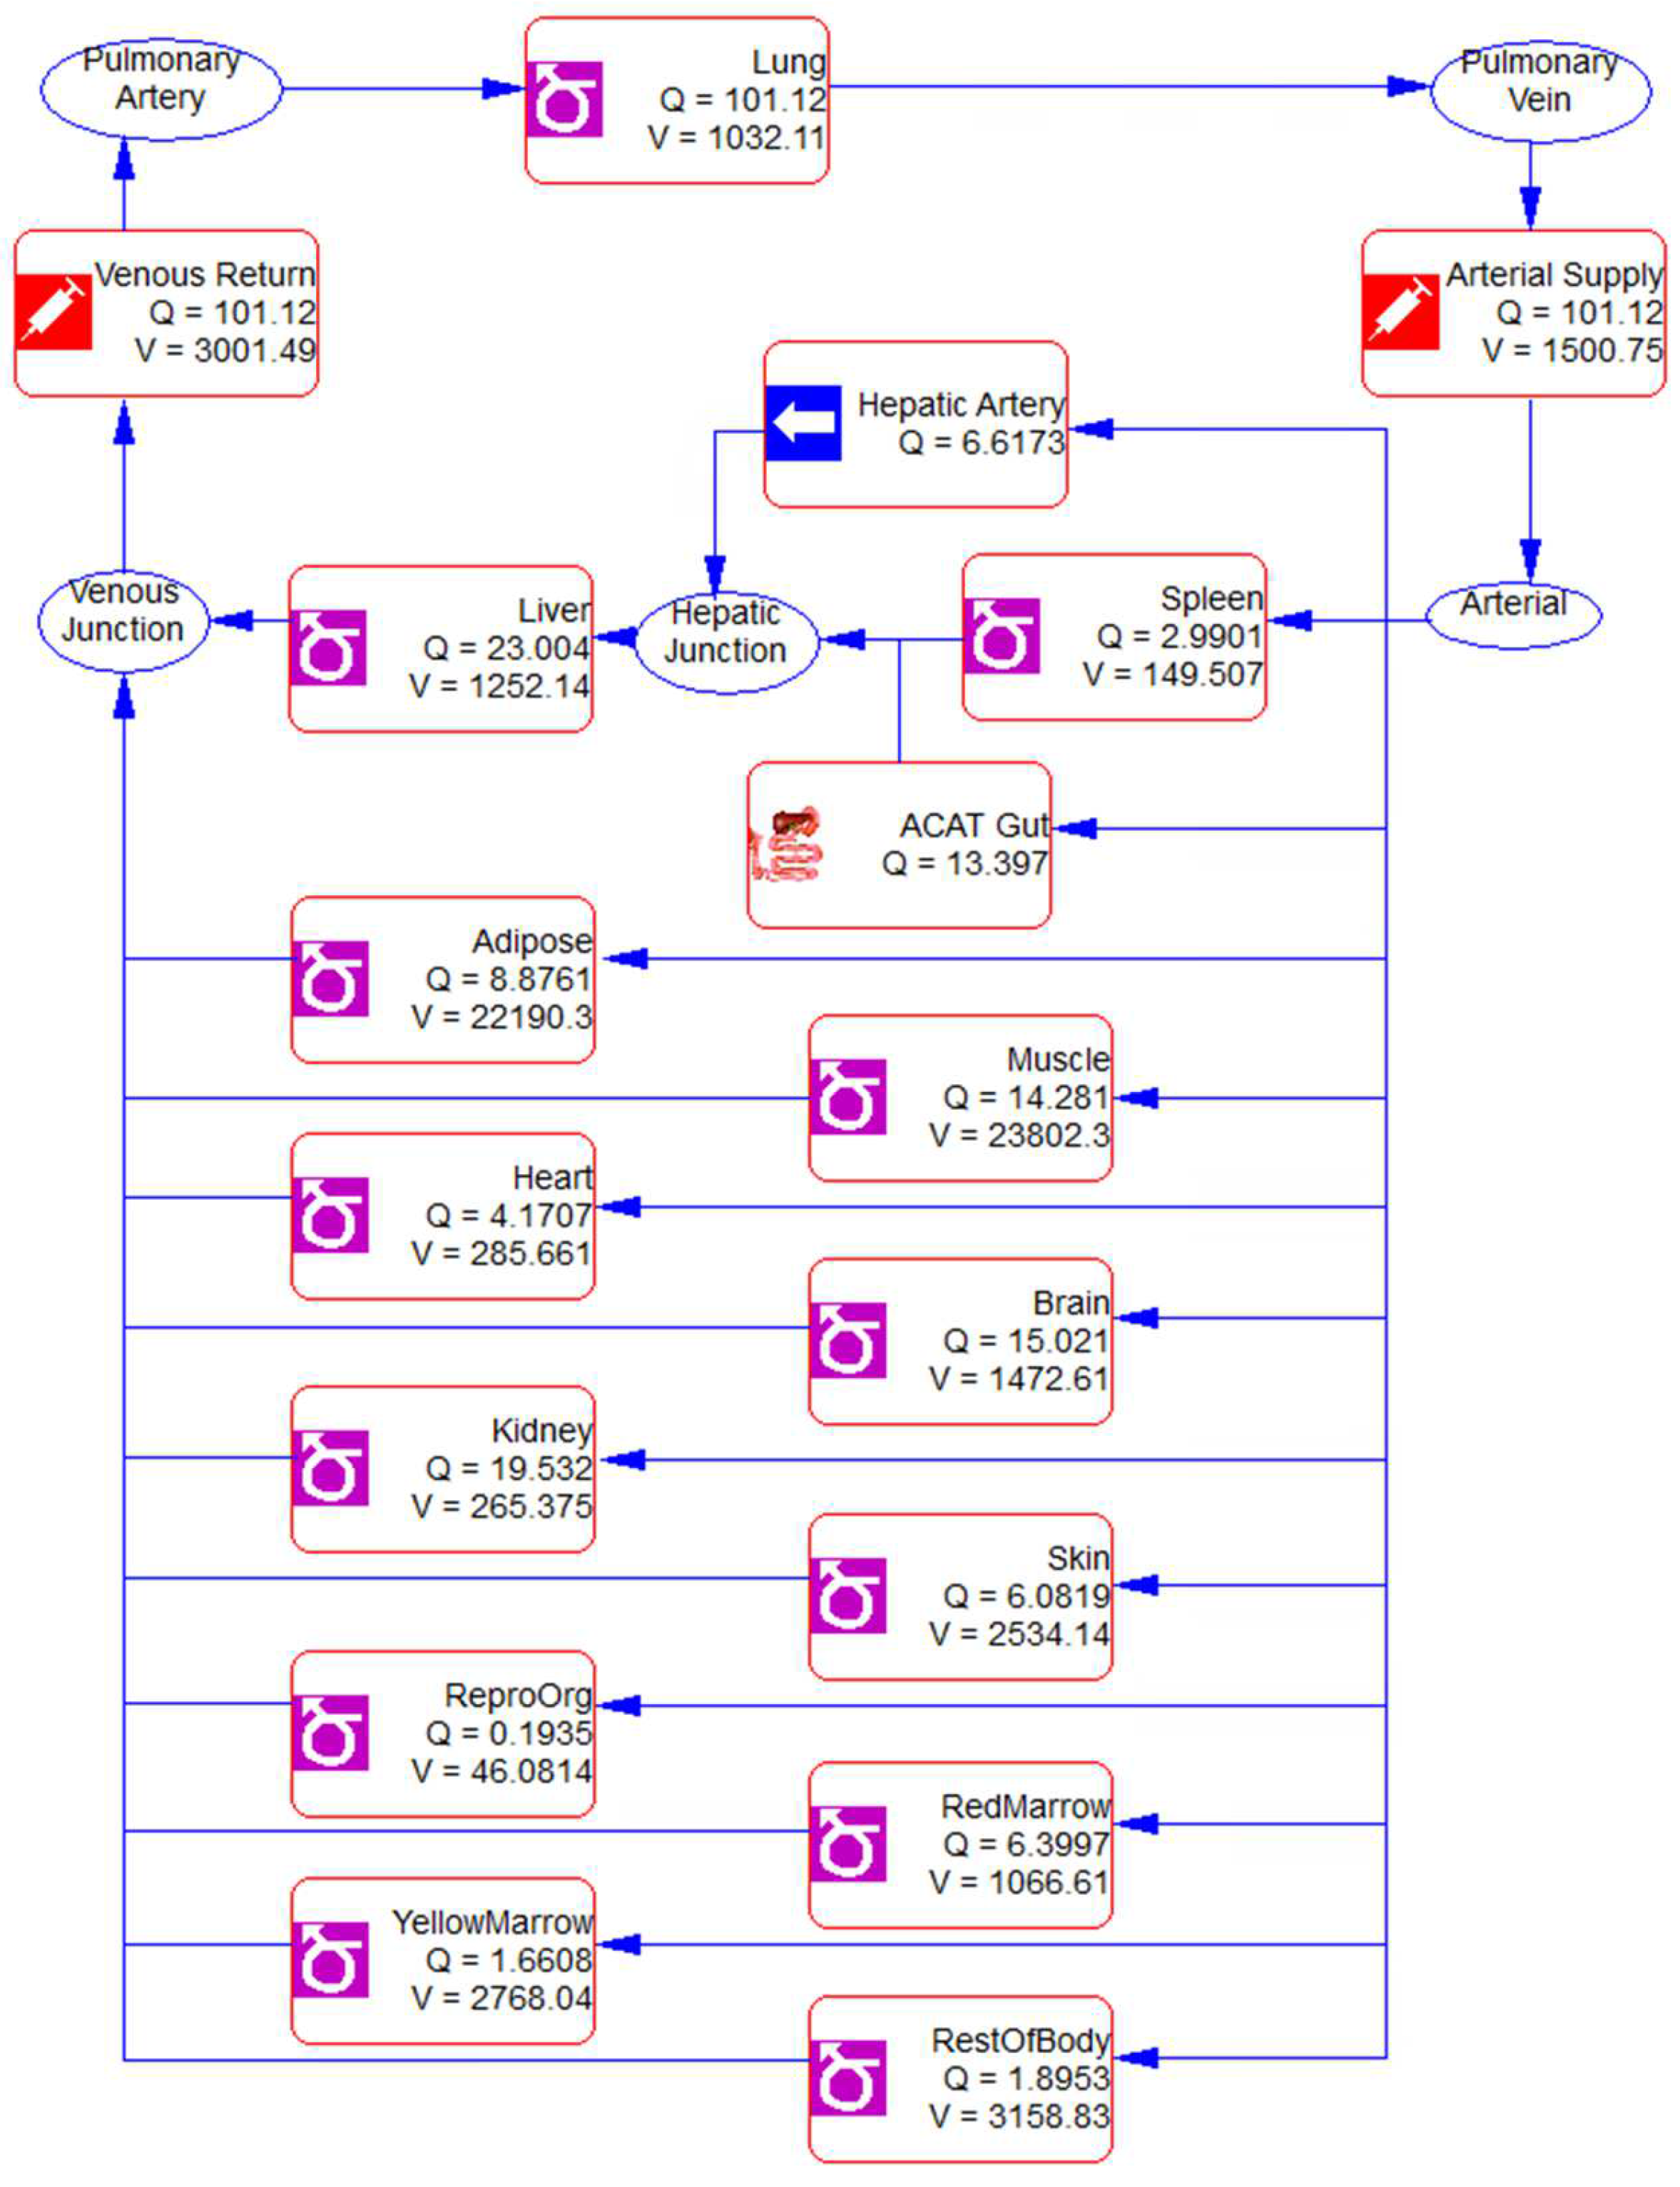
3.5. PBPK Modeling
4. Discussion
5. Conclusions
Supplementary Materials
Author Contributions
Funding
Institutional Review Board Statement
Informed Consent Statement
Data Availability Statement
Acknowledgments
Conflicts of Interest
References
- Fan, X. Inhibitory effect of antitumor-B and retinamide on precancerous lesions of the bladder in rats. Zhongguo Yi Xue Ke Xue Yuan Xue Bao 1993, 15, 71–73. [Google Scholar] [PubMed]
- Wang, Y.; Zhang, Z.; Kastens, E.; Lubet, R.A.; You, M. Mice with alterations in both p53 and Ink4a/Arf display a striking increase in lung tumor multiplicity and progression: Differential chemopreventive effect of budesonide in wild-type and mutant A/J mice. Cancer Res. 2003, 63, 4389–4395. [Google Scholar] [PubMed]
- Zhang, Z.; Wang, Y.; Yao, R.; Li, J.; Yan, Y.; La Regina, M.; Lemon, W.L.; Grubbs, C.J.; Lubet, R.A.; You, M. Cancer chemopreventive activity of a mixture of Chinese herbs (antitumor B) in mouse lung tumor models. Oncogene 2004, 23, 3841–3850. [Google Scholar] [CrossRef]
- Wang, Y.; Yao, R.; Gao, S.; Wen, W.; Du, Y.; Szabo, E.; Hu, M.; Lubet, R.A.; You, M. Chemopreventive effect of a mixture of Chinese Herbs (antitumor B) on chemically induced oral carcinogenesis. Mol. Carcinog. 2013, 52, 49–56. [Google Scholar] [CrossRef] [PubMed]
- Sun, Z.; Guan, X.; Li, N.; Liu, X.; Chen, X. Chemoprevention of oral cancer in animal models, and effect on leukoplakias in human patients with ZengShengPing, a mixture of medicinal herbs. Oral Oncol. 2010, 46, 105–110. [Google Scholar] [CrossRef]
- Lin, P.Z.; Zhang, J.S.; Cao, S.G.; Rong, Z.P.; Gao, R.Q.; Han, R.; Shu, S.P. Secondary prevention of esophageal cancer--intervention on precancerous lesions of the esophagus. Zhonghua Zhong Liu Za Zhi 1988, 10, 161–166. [Google Scholar]
- Lin, P. Medicamentous inhibitory therapy of precancerous lesions of the esophagus--3 and 5 year inhibitory effect of antitumor B, retinamide and riboflavin. Zhongguo Yi Xue Ke Xue Yuan Xue Bao. 1990, 12, 235–245. [Google Scholar]
- Lin, P.; Zhang, J.; Rong, Z.; Han, R.; Xu, S.; Gao, R.; Ding, Z.; Wang, J.; Feng, H.; Cao, S. Studies on medicamentous inhibitory therapy for esophageal precancerous lesions--3- and 5-year inhibitory effects of antitumor-B, retinamide and riboflavin. Proc. Chin. Acad. Med. Sci. Peking Union Med. Coll. 1990, 5, 121–129. [Google Scholar]
- Bui, D.; Yin, T.; Duan, S.; Wei, B.; Yang, P.; Wong, S.J.; You, M.; Singh, R.; Hu, M. Pharmacokinetic Characterization and Bioavailability Barrier for the Key Active Components of Botanical Drug Antitumor B (ATB) in Mice for Chemoprevention of Oral Cancer. J. Nat. Prod. 2021, 84, 2486–2495. [Google Scholar] [CrossRef]
- Gao, G.; Law, F.C.P. Physiologically based pharmacokinetics of matrine in the rat after oral administration of pure chemical and ACAPHA. Drug Metab. Dispos. 2009, 37, 884–891. [Google Scholar] [CrossRef]
- Gao, G. Commparative Pharmacokinetics of Matrine: Pure Matrine vs. Crude Chemical in ACAPHA; Simon Fraser University: Greater Vancouver, BC, Canada, 2007. [Google Scholar]
- ICH Expert Working Group ICH Guideline Q1A(R2). Stability Testing of New Drug Substances and Products. In International Conference on Harmonization; ICH Expert Working Group: Geneva, Switzerland, 2003; ISBN 0269-4727. [Google Scholar]
- U.S. Department of Health and Human Services; Food and Drug Administration; Center for Drug Evaluation and Research (CDER); Center for Veterinary Medicine (CVM). Guidance for Industry: Bioanalytical Method Validation; Food and Drug Administration: Silver Spring, MD, USA, 2018; pp. 1–22. [Google Scholar]
- Bui, D.; Li, L.; Yin, T.; Wang, X.; Gao, S.; You, M.; Singh, R.; Hu, M. Pharmacokinetic and Metabolic Profiling of Key Active Components of Dietary Supplement Magnolia officinalis Extract for Prevention against Oral Carcinoma. J. Agric. Food Chem. 2020, 68, 6576–6587. [Google Scholar] [CrossRef] [PubMed]
- Yang, Z.; Gao, S.; Yin, T.; Kulkarni, K.H.; Teng, Y.; You, M.; Hu, M. Biopharmaceutical and pharmacokinetic characterization of matrine as determined by a sensitive and robust UPLC-MS/MS method. J. Pharm. Biomed. Anal. 2010, 51, 1120–1127. [Google Scholar] [CrossRef] [PubMed]
- ApexBio. Matrine Compound. 2022. Available online: https://www.apexbt.com/matrine.html (accessed on 20 November 2022).
- Idkaidek, N.M. Comparative assessment of saliva and plasma for drug bioavailability and bioequivalence studies in humans. Saudi Pharm. J. 2017, 25, 671–675. [Google Scholar] [CrossRef]
- Bezinelli, L.M.; Eduardo, F.P.; De Carvalho, D.L.C.; Dos Santos Ferreira, C.E.; De Almeida, E.V.; Sanches, L.R.; Esteves, I.; Campregher, P.V.; Hamerschlak, N.; Corrêa, L. Therapeutic salivary monitoring of IV busulfan in patients undergoing hematopoietic stem cell transplantation: A pilot study. Bone Marrow Transplant. 2017, 52, 1384–1389. [Google Scholar] [CrossRef] [PubMed][Green Version]
- Drobitch, R.K.; Svensson, C.K. Therapeutic Drug Monitoring in Saliva: An Update. Clin. Pharmacokinet. 1992, 23, 365–379. [Google Scholar] [CrossRef]
- Dennis, C. Evaluating Saliva As an Alternative Specimen—Final Report; National Institute of Standards and Technology, U.S. Department of Commerce: Washington, DC, USA, 2004; pp. 1–70. [Google Scholar]
- Li, S.; Yu, Y.; Bian, X.; Yao, L.; Li, M.; Lou, Y.R.; Yuan, J.; Lin, H.S.; Liu, L.; Han, B.; et al. Prediction of oral hepatotoxic dose of natural products derived from traditional Chinese medicines based on SVM classifier and PBPK modeling. Arch. Toxicol. 2021, 95, 1683–1701. [Google Scholar] [CrossRef]
- Brantley, S.J.; Gufford, B.T.; Dua, R.; Fediuk, D.J.; Graf, T.N.; Scarlett, Y.V.; Frederick, K.S.; Fisher, M.B.; Oberlies, N.H.; Paine, M.F. Physiologically based pharmacokinetic modeling framework for quantitative prediction of an herb-drug interaction. CPT Pharmacomet. Syst. Pharmacol. 2014, 3, e107. [Google Scholar] [CrossRef]
- Law, F.C.P.; Yao, M.; Bi, H.C.; Lam, S. Physiologically based pharmacokinetic modeling of tea catechin mixture in rats and humans. Pharmacol. Res. Perspect. 2017, 5, e00305. [Google Scholar] [CrossRef]
- Czobor, P.; Skolnick, P. The secrets of a successful clinical trial: Compliance, compliance, and compliance. Mol. Interv. 2011, 11, 107–110. [Google Scholar] [CrossRef]
- Herbert, R.D.; Kasza, J.; Bø, K. Analysis of randomised trials with long-term follow-up. BMC Med. Res. Methodol. 2018, 18, 48. [Google Scholar] [CrossRef]
- Zhao, J.; Li, X.; Xie, W.; Wang, H.; Fang, Z.; Li, Q. Effect and mechanism of matrine on adhesion and invasion of salivary gland adenoid cystic carcinoma cells in vitro. Shanghai Kou Qiang Yi Xue 2009, 18, 401–405. [Google Scholar]
- Solvo Biotechnology. OCT3—Transporters—Solvo Biotechnology. Available online: https://www.solvobiotech.com/transporters/oct3 (accessed on 19 November 2022).
- Lee, N.; Duan, H.; Hebert, M.F.; Liang, C.J.; Rice, K.M.; Wang, J. Taste of a pill: Organic cation transporter-3 (OCT3) mediates metformin accumulation and secretion in salivary glands. J. Biol. Chem. 2014, 289, 27055–27064. [Google Scholar] [CrossRef]
- Proctor, G.B. The physiology of salivary secretion. Periodontol. 2000 2016, 70, 11–25. [Google Scholar] [CrossRef]
- Koepsell, H. Update on drug-drug interaction at organic cation transporters: Mechanisms, clinical impact, and proposal for advanced in vitro testing. Expert Opin. Drug Metab. Toxicol. 2021, 17, 635–653. [Google Scholar] [CrossRef]
- Sun, N.; Shen, B.; Zhu, J.; Zhang, X.; Zhu, H.; Liang, G.; Yang, D.; Lu, J.; Zhang, Y. Clinical application of the AUC-guided dosage adjustment of docetaxel-based chemotherapy for patients with solid tumours: A single centre, prospective and randomised control study. J. Transl. Med. 2020, 18, 226. [Google Scholar] [CrossRef]
- Janus, N.; Thariat, J.; Boulanger, H.; Deray, G.; Launay-Vacher, V. Proposal for dosage adjustment and timing of chemotherapy in hemodialyzed patients. Ann. Oncol. Off. J. Eur. Soc. Med. Oncol. 2010, 21, 1395–1403. [Google Scholar] [CrossRef]
- Gurney, H. How to calculate the dose of chemotherapy. Br. J. Cancer 2002, 86, 1297–1302. [Google Scholar] [CrossRef]
- Khalid, S.; Khalid, A.; Clark, B.A.; Haddad, A.; Spiro, T.P.; Daw, H. Dosage Adjustments for Chemotherapy and Targeted Therapies in Colorectal and Pancreatic Cancer Patients with Hepatic Impairment. Cureus 2018, 10, e2798. [Google Scholar] [CrossRef]
- Motohashi, H.; Inui, K.I. Organic cation transporter OCTs (SLC22) and MATEs (SLC47) in the human kidney. AAPS J. 2013, 15, 581–588. [Google Scholar] [CrossRef]
- Nair, A.B.; Jacob, A. A simple practice guide for dose conversion between animals and human. J. Basic Clin. Pharm. 2016, 7, 27–31. [Google Scholar] [CrossRef]


| Herbal Name | Chinese Name | Plants Parts Used | Form | % Content | |
|---|---|---|---|---|---|
| Latin Name | Family | ||||
| Sophora tonkinensis Gagnep. | Fabaceae | Shan Dou Gen | Dried roots | Water extract | 18–24 |
| Polygonum bistorta L. | Polygonaceae | Quan Shen | Dried rhizome | Water extract | 17–21 |
| Sonchus brachyotus DC. | Asteraceae | Bei Bai Jiang | Dried whole plant | Water extract | 17–23 |
| Prunella vulgaris L. | Lamiaceae | Xia Ku Cao | Dried flower stem | Water extract | 18–25 |
| Dioscorea bulbifera L. | Dioscoreaceae | Huang Yao Zi | Dried rhizome | Water extract | 3–6 |
| Dictamnus dasycarpus Turcz. | Rutaceae | Bai Xian Pi | Dried root bark | Powder | 8–12 |
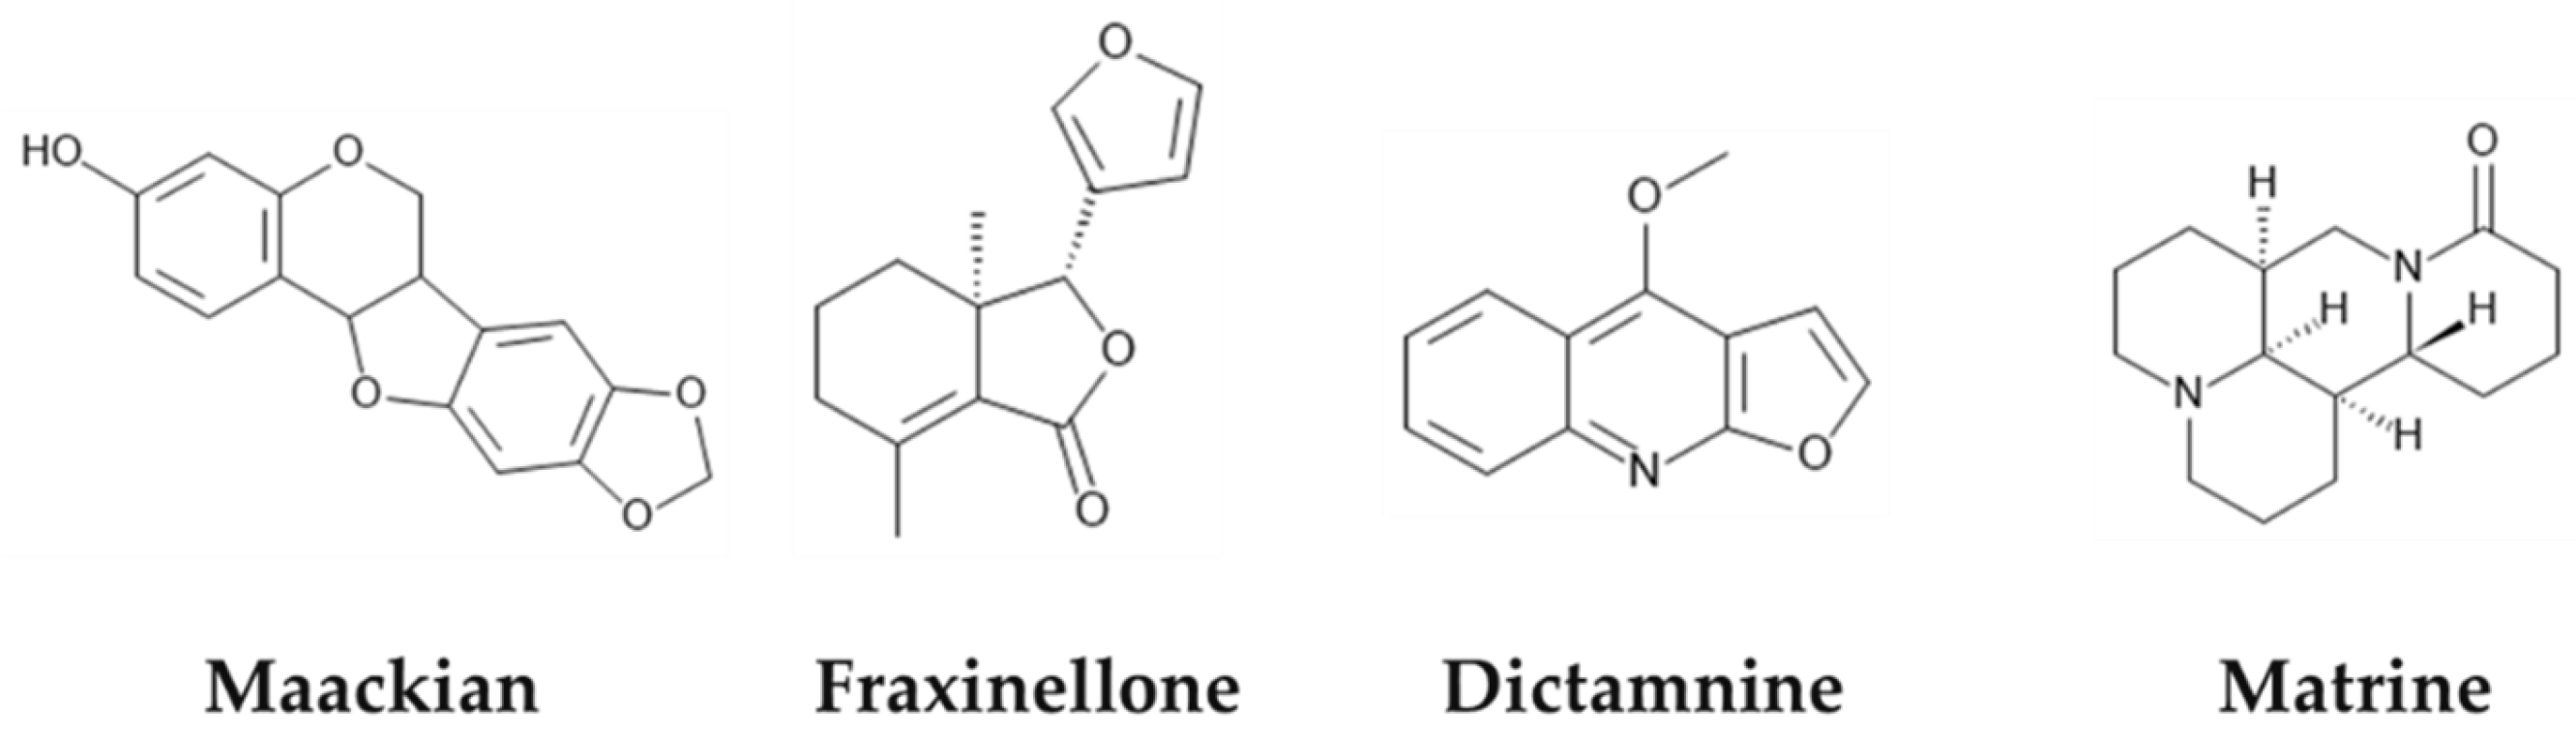
| Analyte | Matrine | Maackiain | Dictamnine | Fraxinellone |
|---|---|---|---|---|
| Amount (μg/g) | 988.7 ± 170.2 | 15.5 ± 0.6 | 11.7 ± 2.3 | 21.2 ± 3.8 |
| Amount (μg/8 tablets) | 2610.2 ± 449.3 | 40.9 ± 1.6 | 30.9 ± 6.1 | 56.0 ± 10.0 |
| Parameter | Value | Resources |
|---|---|---|
| Molecular weight (g/mol) | 248.36 | |
| Log D | 1.45 | ADMET Predictor® 10.2 |
| pKa | 9.49 | ADMET Predictor® 10.2 |
| Solubility at pH 7.4 (mg/mL) | 50.00 | ApexBio website [16] |
| Rbp | 0.97 | Gao et al. [11] |
| Fup (%) | 95.85 | ADMET Predictor® 10.2 |
| First pass effect (%) | 26.00 | Bui et al. [9] |
| Peff (Caco-2, cm/s) | 4.25 × 10⁻⁵ | Yang et al. [15] |
| Mean (±SD) | Median (Range) | |
|---|---|---|
| Age, Years | 32.88 (4.02) | 34 (26–27) |
| Height (cm) | 164.69 (8.10) | 166 (151–176) |
| Weight (lbs) | 151.4 (32.39) | 148.5 (103–192.2) |
| Body Mass Index (kg/m2) | 25.18 (4.35) | 25.2 (20.5–32) |
| Parameter | Tmax (h) | Half-Life (h) | Cmax (ng/mL) | AUC0–24 (ng * h/mL) | ||||||
|---|---|---|---|---|---|---|---|---|---|---|
| Subject | Saliva | Plasma | Saliva | Plasma | Saliva | Plasma | Saliva/Plasma Ratio | Saliva | Plasma | Saliva/Plasma Ratio |
| 1F | 1 | 2 | 7.59 | 15.12 | 91.61 | 28.06 | 3.26 | 845.11 | 295.05 | 2.86 |
| 2F | 2 | 2 | 26.39 | 17.06 | 120.81 | 23.60 | 5.12 | 1067.94 | 228.16 | 4.68 |
| 4M | 2 | 2 | 18.98 | 10.66 | 201.34 | 28.56 | 7.05 | 1884.98 | 408.92 | 4.61 |
| 5M | 3 | 2 | 11.13 | 9.84 | 157.71 | 21.28 | 7.41 | 1024.67 | 247.39 | 4.14 |
| 8F | 1 | 3.3 | 5.42 | 6.29 | 231.60 | 31.91 | 7.27 | 2064.14 | 428.83 | 4.81 |
| 9M | 1 | 1 | 12.23 | 8.65 | 204.07 | 22.48 | 9.08 | 911.28 | 231.84 | 3.93 |
| 11M | 0.5 | 3 | 7.38 | 6.99 | 153.18 | 22.77 | 6.73 | 1487.35 | 173.50 | 8.57 |
| 12M | 2 | 2 | 9.83 | 8.43 | 127.11 | 22.70 | 5.60 | 1133.48 | 240.73 | 4.71 |
| AVG ± SD | 1.56 ± 0.82 | 2.16 ± 0.69 | 12.37 ± 7.01 | 10.38 ± 3.83 | 152.98 ± 53.54 | 25.17 ± 3.82 * | 6.4 ± 1.8 | 1302.37 ± 459.28 * | 278.34 ± 84.90 * | 4.8 ± 1.7 |
| Parameter | Estimate | CV (%) | Units |
|---|---|---|---|
| Vp | 1.42 ± 0.08 | 5.32 | L/kg |
| CLp | 0.02 ± 0.01 | 48.57 | L/h/kg |
| Tlag | 0.44 ± 0.01 | 2.55 | h |
| Ka | 1.66 ± 0.27 | 16.29 | 1/h |
| Vs | 0.02 ± 0.01 | 35.98 | L/kg |
| Vmax | 11.88 ± 1.27 | 10.66 | mg/h/kg |
| Km | 279.52 ± 5.73 | 2.05 | mg/L |
| Vt | 0.62 ± 0.04 | 7.03 | L/kg |
| Kpt | 0.11 ± 0.02 | 21.34 | 1/h |
| CLs | 0.05 ± 0.01 | 17.55 | L/h/kg |
| Kts | 23.42 ± 2.33 | 9.93 | 1/h |
| Ksp | 1.25 ± 0.28 | 22.69 | 1/h |
| Kas | 0.39 ± 0.14 | 36.28 | 1/h |
| Parameter | Mice | Rats | Healthy Volunteers | Human Subjects | ||||
|---|---|---|---|---|---|---|---|---|
| Observed | Predicted | Observed | Predicted | Observed | Predicted | Observed | Predicted | |
| Cmax (ng/mL) | NA | NA | NA | NA | 25.2 | 26.3 | 29.7 | 32.1 |
| Tmax (h) | NA | NA | NA | NA | 2.2 | 1.8 | 3.0 | 2.7 |
| AUC0-T (μg * h/L) | 5131.1 | 5448.7 | 1717.6 | 1718.1 | 278.3 | 270.8 | 412.2 | 570.6 |
Disclaimer/Publisher’s Note: The statements, opinions and data contained in all publications are solely those of the individual author(s) and contributor(s) and not of MDPI and/or the editor(s). MDPI and/or the editor(s) disclaim responsibility for any injury to people or property resulting from any ideas, methods, instructions or products referred to in the content. |
© 2022 by the authors. Licensee MDPI, Basel, Switzerland. This article is an open access article distributed under the terms and conditions of the Creative Commons Attribution (CC BY) license (https://creativecommons.org/licenses/by/4.0/).
Share and Cite
Bui, D.; McWilliams, L.A.; Wu, L.; Zhou, H.; Wong, S.J.; You, M.; Chow, D.S.-L.; Singh, R.; Hu, M. Pharmacokinetic Basis for Using Saliva Matrine Concentrations as a Clinical Compliance Monitoring in Antitumor B Chemoprevention Trials in Humans. Cancers 2023, 15, 89. https://doi.org/10.3390/cancers15010089
Bui D, McWilliams LA, Wu L, Zhou H, Wong SJ, You M, Chow DS-L, Singh R, Hu M. Pharmacokinetic Basis for Using Saliva Matrine Concentrations as a Clinical Compliance Monitoring in Antitumor B Chemoprevention Trials in Humans. Cancers. 2023; 15(1):89. https://doi.org/10.3390/cancers15010089
Chicago/Turabian StyleBui, Dinh, Lenora A. McWilliams, Lei Wu, Haiying Zhou, Stuart J. Wong, Ming You, Diana S.-L. Chow, Rashim Singh, and Ming Hu. 2023. "Pharmacokinetic Basis for Using Saliva Matrine Concentrations as a Clinical Compliance Monitoring in Antitumor B Chemoprevention Trials in Humans" Cancers 15, no. 1: 89. https://doi.org/10.3390/cancers15010089
APA StyleBui, D., McWilliams, L. A., Wu, L., Zhou, H., Wong, S. J., You, M., Chow, D. S.-L., Singh, R., & Hu, M. (2023). Pharmacokinetic Basis for Using Saliva Matrine Concentrations as a Clinical Compliance Monitoring in Antitumor B Chemoprevention Trials in Humans. Cancers, 15(1), 89. https://doi.org/10.3390/cancers15010089