1. Introduction
Colorectal cancer (CRC) is the third most common cancer type and the second leading cause of cancer-related deaths worldwide [
1], accounting for nearly 900,000 deaths each year. This malignant disease develops from the pathological transformation of normal colonic epithelium to adenomatous polyps, which ultimately leads to invasive cancer. This process is gradual and involves the accumulation of genetic and/or epigenetic alterations [
2]. CRC incidence increases with economic development and Westernization of dietary and lifestyle habits, hinting at a significant effect of environmental and lifestyle factors, likely in combination with genetic predisposition [
3]. In this regard, a growing body of evidence has linked alterations of the gastrointestinal tract microbiota with CRC development [
4]. Earlier research has shown that alterations in the gut microbiota may influence colon tumorigenesis [
5] through chronic inflammation or the production of carcinogenic compounds [
6]. Differences in the relative abundances of some microbial species or genera have been found when comparing paired tumor and normal tissues, or fecal samples from CRC patients and healthy subjects [
7,
8].
Diagnosis of CRC is challenging and involves a complex process that usually starts with the detection of the first symptoms by the patient, and is followed by clinical diagnostic procedures, mainly based on colonoscopy. The implementation of preventive measures and early diagnosis of CRC can save many lives [
9,
10] and routine screening of asymptomatic populations following an age-selected criteria has been implemented in many countries. Current CRC screening in the vast majority of Western countries consists of a two-step procedure with a non-invasive test (most commonly a fecal immunochemical test (FIT) for quantification of occult hemoglobin in the stool) followed by colonoscopy if the test is positive (FIT-positive, or more accurately, above a given threshold of hemoglobin concentration) [
11,
12]. This approach is effective but results in a high rate of false positives (around 65% FIT-positive samples reveal no clinically relevant feature at colonoscopy) at the first step and many unnecessary colonoscopies, with a FIT sensitivity of around 35% [
13]. Colonoscopy is an invasive, expensive and time-consuming procedure, and hence additional biomarkers that could better stratify individuals with higher risk for CRC or premalignant lesions to undergo a colonic examination would significantly reduce health-care costs. Much current research is directed towards finding additional criteria, such as risk factors and alternative biomarkers to be considered by the decision algorithms used to personalize positive FIT testing to colonoscopy. To search for potential predictive biomarkers present in FIT samples and to shed light on the potential roles of the gut microbiome in CRC development, we performed microbiome profiling using targeted sequencing of the 16S V3-V4 region from DNA extracted directly from FIT containers collected within the population-based organized screening program implemented in Catalonia, Spain [
14]. We analyzed a total of 2889 FIT-positive samples and assessed their microbial composition and metabolic potential, and how they varied across samples with different colonoscopy results (i.e., different diagnostic outcome after colonoscopy exploration, including, among others, the absence of any clinical feature, the presence of lesions and their risk, the presence of colorectal cancer, and the presence of polyps).
2. Materials and Methods
Our study followed the Strengthening the Organization and Reporting of Microbiome Studies (STORMS) checklist (
Data S1).
2.1. Sample Collection and Subjects
A total of 2889 FIT-positive (>20 μg hemoglobin/g feces) samples recruited in two rounds (2009 and 2017–2019) from asymptomatic participants from the Catalan CRC screening program were analysed. Individuals were selected within the age criteria implemented by the screening programme (50 to 69 years old) and the diagnosis and sex selection were based on an ideal balanced dataset (aimed to obtain equal numbers within each class). Collected metadata comprised six different clinical variables for each sample, including the diagnosis after colonoscopy evaluation (
Data S2), the number of polyps, the FIT value (μg of hemoglobin/g of feces), the hospital at which the sample was collected, and the donor’s sex and age. The considered colonoscopy diagnoses were negative (N), colorectal cancer (CRC) and different lesions that can be relevant in CRC development: carcinoma in situ (CIS), high risk lesion (HRL), intermediate risk lesion (IRL), low risk lesion (LRL) and lesion not associated to risk (LNAR) [
15] (
Table S1). Additionally, we classified the samples into two groups according to the clinical relevance of the colonoscopy-based diagnosis [
16]: CRC, CIS, HRL and IRL were considered clinically relevant (CR) lesions (indeed, they are the goal of CRC screening programs), and N, LNAR and LRL as non-clinically relevant (non-CR) lesions (
Table S1). Individuals with inflammatory bowel disease or polyposis were excluded from the study. Our study was approved by the institutional ethical committees of the involved institutions and informed consent was obtained from the participants.
2.2. DNA Extraction and 16S Sequencing
Aliquots of 500 μL of buffer contained in FIT collection devices (OC-Sensor, Eiken Chemical Co., Tokyo, Japan) were prepared in a test tube and stored at −80 °C until further processing. DNA was extracted from FIT samples using the DNeasy PowerLyzer PowerSoil Kit (Qiagen, ref. QIA12855) following manufacturer’s instructions. The extraction tubes were agitated twice in a 96-well plate using the TissueLyser II (Qiagen) at 30 Hz/s for 5 min.
Four μL of each DNA sample were used to amplify the V3–V4 regions of the bacterial 16S ribosomal RNA gene, using the following universal primers in a limited cycle PCR: V3-V4-Forward (5′-TCGTCGGCAGCGTCAGATGTGTATAAGAGACAGCCTACGGGNGGCWGCAG-3′) and V3-V4-Reverse (5′-GTCTCGTGGGCTCGGAGATGTGTATAAGAGACAGGACTACHVGGGTATCTAATCC-3′). To prevent unbalanced base composition in further MiSeq sequencing, we shifted sequencing phases by adding a variable number of bases (from 0 to 3) as spacers to both forward and reverse primers (we used a total of 4 forward and 4 reverse primers). The PCR was performed in 10 μL volume reactions with 0.2 μM primer concentration and using the Kapa HiFi HotStart Ready Mix (Roche, ref. KK2602). Cycling conditions were initial denaturation of 3 min at 95 °C followed by 25 cycles of 95 °C for 30 s, 55 °C for 30 s, and 72 °C for 30 s, ending with a final elongation step of 5 min at 72 °C.
After the first PCR step, water was added to a total volume of 50 μL and reactions were purified using AMPure XP beads (Beckman Coulter) with a 0.9X ratio according to manufacturer’s instructions. PCR products were eluted from the magnetic beads with 32 μL of Buffer EB (Qiagen) and 30 μL of the eluate were transferred to a fresh 96-well plate. The primers used in the first PCR contained overhangs allowing the addition of full-length Nextera adapters with barcodes for multiplex sequencing in a second PCR step, resulting in sequencing ready libraries. To do so, 5 μL of the first amplification was used as template for the second PCR with Nextera XT v2 adaptor primers in a final volume of 50 μL using the same PCR mix and thermal profile as for the first PCR but for only 8 cycles. After the second PCR, 25 μL of the final product was used for purification and normalization with the SequalPrep normalization kit (Invitrogen), according to the manufacturer’s protocol. Libraries were eluted in 20 μL and pooled for sequencing.
Final pools were quantified by qPCR using the Kapa library quantification kit for Illumina Platforms (Kapa Biosystems) on an ABI 7900HT real-time cycler (Applied Biosystems). Sequencing was performed in the Illumina MiSeq with 2 × 300 bp reads using v3 chemistry with a loading concentration of 18 pM. To increase the diversity of the sequences, 10% of PhIX control libraries were spiked in.
Two bacterial mock communities were obtained from the BEI Resources of the Human Microbiome Project (HM-276D and HM-277D), each containing genomic DNA of ribosomal operons from 20 bacterial species [
17]. Mock DNAs were amplified and sequenced in the same manner as all other FIT samples. Negative controls of the DNA extraction and PCR amplification steps were also included in parallel, using the same conditions and reagents. These negative controls provided no visible band or quantifiable DNA amounts by Bioanalyzer, whereas all our samples provided clearly visible bands after 25 cycles.
2.3. Microbiome Analysis
We used the dada2 (v. 1.10.1) pipeline [
18] to obtain an amplicon sequence variants (ASV) table for each of the sequencing runs separately. The quality profiles of forward and reverse sequencing reads were examined using the plotQualityProfile function of dada2 and, according to these plots, low-quality sequencing reads were filtered and trimmed using the filterAndTrim function. We obtained a matrix with learned error rates with the learnErrors dada2 function. We performed dereplication (combining identical sequencing reads into unique sequences), sample inference (from the matrix of estimated learning error rates) and merged paired reads to obtain full denoised sequences. From these, chimeric sequences were removed. Taxonomy was assigned to ASVs by mapping to the SILVA 16s rRNA database (v. 132) [
19]. Negative controls (non-template samples) and positive controls (mock microbial communities comprising a mixture of 20 strains with known proportions) were sequenced and analyzed in each of the runs to assess the possible contamination background and evaluate the accuracy of the pipeline. We obtained ASV and taxonomy tables for each run separately, and then merged the results. Samples without metadata information and the controls were discarded in further analyses.
We reconstructed a phylogenetic tree by using the phangorn (v. 2.5.5) [
20] and Decipher R packages (v 2.10.2) [
21] and integrated it with the merged ASV and Taxonomy tables and their assigned metadata creating a phyloseq (v. 1.26.1) object [
22]. We characterized alpha diversity metrics including Observed index, Shannon, Simpson, InvSimpson, PD Chao1, ACE and standard error measures such as se.Chao1 and se.ACE using the estimate_richness function of the phyloseq package. Using the picante package (v. 1.8.1) we computed Faith’s phylogenetic diversity, an alpha diversity metric that incorporates branch lengths of the phylogenetic tree. Additionally, we calculated different distance metrics based on the differences in taxonomic composition between samples using the Phyloseq and Vegan (v. 2.5–6) [
23] packages. These metrics include Jensen-Shannon Divergence (JSD), Weighted-Unifrac, Unweighted-unifrac, Bray-Curtis dissimilarity, Jaccard and Canberra. We also computed Aitchison distances between samples using the cmultRepl and codaSeq.clr functions from the CodaSeq (v. 0.99.6) [
24] and zCompositions (v. 1.3.4) [
25] packages. Normalization was performed by transforming counts to centered log-ratios (clr) [
26]. We performed multiplicative simple zero replacement as implemented in the cmultRepl function of the zCompositions package (v. 1.3.4) (indicating method = “CZM”). Samples with fewer than 1000 reads and taxa that appeared in fewer than 10 samples and at low abundances (fewer than 100 reads) were filtered out. Finally, we agglomerated taxa at each taxonomic rank to study trends at different taxonomic depths.
We made a comparison of our overall microbiome profiles with samples studied in a previous study [
27]. We treated the samples from their 2 × 300 pb cycle run by applying the same procedure state in the present section.
2.4. Statistical Analysis
We assessed associations between clinical variables and the overall microbial composition of the samples by performing permutational multivariate analysis of variance (PERMANOVA) using the adonis function from the Vegan R package (v. 2.5–6) with the seven distance metrics mentioned above. Diagnosis, sex and age variables were considered as covariates. Additionally, we performed an analysis of similarities (ANOSIM) test using the anosim function from the Vegan R package to assess differences between and within groups.
We performed a differential abundance analysis using clr data for the different taxonomic ranks across various clinical variables using linear models implemented in the R package lme4 (v. 1.1–21) [
28]. We built a linear model including diagnosis (Dx), hospital, sex, age, number of polyps and FIT value as fixed effects, and the sequencing run as a random effect to account for possible batch effects: tax_element~Dx + hospital + sex + age + number_polyps + FIT_value + (1|run). This linear model was evaluated considering all the diagnoses, but also made a comparison of CRC versus non-CRC samples by changing all other diagnoses to “others”. A second linear model was applied that considered as fixed effect a variable called risk instead of the diagnosis in order to assess the differences between samples with CR or non-CR colonoscopy, as defined above (
Table S1).
We applied analysis of variance (ANOVA) to assess the significance for each of the fixed effects included in the models using the Car R package (v. 3.0–6) [
29]. To assess differences between groups, we performed multiple comparisons to the results obtained in the linear models using the Tukey test in the function glht from the multcomp R package (v. 1.4–12) [
30]. We applied Bonferroni as a multiple testing correction as implemented in the summary.glht function of the multcomp package, and statistical significance was defined at
p values lower than 0.05. In addition, we used the selbal package (v. 0.1.0) [
31] to study groups of taxa (balances) with potential predictive power for CRC status.
2.5. Co-Occurrence and Networks
Co-occurrence networks for microbial species were inferred and represented for each of the diagnostic groups, considering the top 50 taxa and using the SpiecEasi R package (v. 1.1.0) [
32]. We used neighborhood selection based on penalized regression as the graphical model inference. The resulting networks, following the path transition from healthy colon (N) to cancer (CRC), were compared by computing hamming distances with the netdist function from the R package nettools (v. 1.1.0). We represented the weights of the correlations of the co-occurrence networks by using the chordDiagram function from the circlize package (v. 0.4.12).
We also calculated taxa correlation matrices for each diagnosis group by using the function corr.test from the R psych package (v. 2.0.12) and using the Spearman method, adjusting for multiple comparisons with the Holm-Bonferroni method. The significance threshold was set at p.adjust < 0.05.
2.6. Genome Content Inference
Given the ASV and taxonomy tables in the phyloseq object, we applied the t4f function from the themetagenomics package (v. 1.0.0) [
33] to predict the functional content in terms of functional genes (kegg orthologous groups (OGs), which are families of genes that descent from a common ancestral gene and that generally perform similar functions). Then, we applied a linear model (ortholog~Dx + hospital + sex + age + number_polyps + FIT_value + (1|run)) to determine OGs that were significantly differentially abundant according to the diagnosis, and a multiple comparison test (Tukey) correcting by Bonferroni. From these differentially abundant OGs, we extracted all the functional pathways in which they were involved and performed a test for pathway enrichment only considering pathways with 10 or more predicted OGs and having at least 10% of their OGs being differentially abundant. Using custom scripts and text mining tools implemented in the easyPubMed R package (v.2.13) [
34], we retrieved pubmed articles in which these pathways appeared related to CRC.
2.7. Machine Learning Classification
We developed a predictive model based on a two-phase classification using a neural network (NN) algorithm implemented in the caret package (v. 6.0–85) [
35]. For each phase we trained a random 75% of the data with a 10-fold cross validation and tested with the remaining samples. The process was repeated 100 times to avoid “lucky” splits and to evaluate the variability in predictive performance. We performed a feature selection based on the differential abundance results including taxa found as having significantly different abundances in our study and incorporating FIT-value, age and sex variables. Samples with missing values for the considered metadata were removed. Taxa abundances were included as clr. The two-phase classifier proceeds as follows: in the first phase the method classifies CRC vs. non-CRC samples. Samples that are classified as non-CRC in the first phase are subjected to a second model that classifies CR vs. non-CR samples. At the end of the two-phase classification, the mean percentage of misclassified CRC and CR samples was calculated, and the performance of the model was evaluated.
To validate our strategy we built a model training with all the CRIPREV samples and tested it in two independent datasets: a cohort from the USA [
36,
37] and 100 extra samples from the same Catalan screening. For the USA cohort, we applied the Catalan hemoglobin threshold (>20 μg of hemoglobin/g of feces) to select the FIT-positive samples to include in the validation. We processed their raw data following the same methodology as in our study (see Microbiome analysis, Materials and Methods). We unfortunately could not assign
Bacteroides fragilis, likely because that study only used the V4 region of the 16S rRNA gene as compared to V3-V4 in our study.
We assessed possible subsets of taxa with classification potential by using the 100 extra samples from the same local screening. We identified a total of 27 taxa, found as differentially abundant in both the CRC vs. others and CR vs. non-CR comparisons, intersecting between the CRIPREV project and these extra samples, that are those included in the results presented here. We assessed different combinations of the taxa, considering the effect size observed in our statistical test. We defined top and down taxa from the list, per each phase, and made an assessment of subsets of taxa as follows: 4 taxa from the top of the list (50 random combinations), 4 taxa from the bottom of the list (50 random combinations), 4 random taxa (50 random combinations), 2 taxa from the top of the list (all the possible combinations), 2 taxa from the bottom of the list (all the possible combinations), 1 taxa from the top of the list (all the possible combinations) and 1 taxa from the bottom of the list (all the possible combinations).
We tested a total of 948 models using our validation set. We filtered the models based on some classification metrics: AUC1 >= 0.55, specificity1 > 0.2, AUC2 > 0.5 and specificity2 > 0.
ROC curves were represented using the package pROC (v 1.16.1) [
38].
3. Results
3.1. 16S Metabarcoding from FIT Samples Is a Valid Proxy for Gut Microbiome
To assess the diagnostic and research potential of microbiome analyses performed on FIT samples collected within currently ongoing CRC screening programs, we enrolled asymptomatic participants of the Catalan CRC screening program that had a FIT-positive test. We froze their FIT cartridges until the results from the colonoscopy examination were obtained. These outcomes were categorized into clinically relevant (CR) lesions -including CRC, carcinoma in situ (CIS), high risk lesion (HRL) and intermediate risk lesion (IRL)-, and non-CR lesions—including negative (N), lesion not associated to risk (LNAR) and low risk lesion (LRL). Using the colonoscopy information, we selected a representative set of samples for microbiome characterization, aiming for a balanced representation of clinically relevant colonoscopy outcomes. We performed DNA extraction and 16S metabarcoding analysis of the V3-V4 region on the selected samples (see Materials and Methods,
Section 2.2). A total of 2889 FIT-positive samples passed all quality filters and were included in the study (see Materials and Methods,
Section 2.3). A summary of the distribution of these samples across several characteristics is shown in
Table S2. We obtained a mean value of 56,219.03 filtered reads per sample, which comprised a total of 376 assigned taxa. Bacteroidetes and Firmicutes were the most represented phyla, and the ten most abundant genera were, in this order:
Bacteroides,
Faecalibacterium,
Prevotella,
Blautia, F.Lachnospiraceae.UCG,
Ruminococcus,
Agathobacter,
Bifidobacterium,
Alistipes and
Akkermansia (
Figure S1). These results are consistent with previous studies using stool samples [
39,
40,
41,
42,
43], and with earlier analyses showing a high correspondence between stool and FIT samples from the same individuals [
36,
37]. We compared our data with that of a recent Spanish population gut microbiome study [
27]. The two cohorts differ in several features such as the age range, but most notably our cohort was entirely formed by individuals with blood in stool, a factor shown to impact the gut microbiome [
44], and hence differences are expected. Nevertheless, the two sample sets were largely similar in terms of dominating phyla and genera, reinforcing the validity of FIT sampling as a proxy of the gut microbiome (
Figure S2).
3.2. Changes in Microbiome Composition along the Path from Healthy Colon to Colorectal Cancer
We quantified the overall microbiome diversity by computing alpha and beta diversity metrics. We only observed significant differences (Kruskal-Wallis,
p < 0.05) in the observed index alpha diversity metric (which measures the number of species per sample), and in the Simpson index (which considers taxa abundances) when considering all diagnoses, but not when specifically comparing clinically relevant (CR) vs. non-CR samples (
Figure S3). For the Shannon and Simpson indices, which consider differences in taxa abundances, we only observed significant differences with the Simpson index (which assigns more weight to dominant species) when considering all diagnoses. We produced multidimensional scaling (MDS) plots using distances between the microbial profiles of samples (beta diversity) such as the Aitchison distance (
Figure S4). We did not observe a clear clustering of samples with the same diagnosis or risk (CR vs. non-CR). However, with the adonis test and Aitchison distance, we detected a significant effect of the diagnosis (
p = 0.001) considering sex and age as covariates, and the sequencing run as a possible source of batch effect. The ANOSIM test also supported significant differences between the diagnostic groups and a higher similarity within groups (R: 0.07463,
p-value: 0.001). Altogether, these results suggest the existence of significant but subtle differences in the overall microbiome composition between FIT-positive samples with different colonoscopy outcomes.
We next used comparative analysis to detect significant differences in the relative abundance of taxa according to the variables considered (
Table S3). These analyses identified 34 species whose abundance varied significantly across colonoscopy diagnosis (
Data S3 and
Figure 1).
Based on the observation that CRC was the diagnosis with the most distinct microbiome (
Figure 1), we specifically compared CRC to non-CRC samples, which revealed 41 differentially abundant species (
Figure 2a and
Data S4). These included overrepresentation of
Akkermansia muciniphila and
Akkermansia spp., as well as underrepresentation of
Bacteroides plebeius and
Bacteroides fragilis in CRC compared to non-CRC samples. In addition, we found that the ratio between species abundance (balance) most associated with CRC-status was given by a decrease (as compared to non-CRC samples) in a group of taxa comprising
B. fragilis (G1:
Bifidobacterium spp.,
Bacteroides fragilis,
Sutterella wadsworthensis, and
Eggerthella spp.), with respect to a second group of taxa including
Akkermansia spp. (G2:
Akkermansia spp.,
Gemella spp.,
Peptostreptococcus stomatis,
Adlercreutzia spp. and
Butyrivibrio spp.). We explored the progression of the levels of
Akkermansia genus along the path from normal colon to CRC, observing an increase from HRL to carcinoma in situ and from carcinoma in situ to CRC. (
Figure S5).
Finally, we applied the same linear model to the comparison of CR vs. non-CR samples, which identified 34 differentially abundant species, of which six were shared with the comparison above (
Figure 2b and
Data S5).
We next explored whether changes in the microbiome correlated with other variables collected in the study such as the number of polyps observed in the colonoscopy examination and lifestyle parameters collected by a questionnaire. Colorectal polyps, which are benign tumors that project onto the colon mucus and protrude into intestinal lumen [
45], have long been identified as potential precursors of CRC. Polyp size, localization and histology, among other factors, may influence their role in CRC development. Our study includes the information of the presence or absence of polyps, wherein colonoscopy detected the presence of polyps in 66.82% of samples, with the numbers of polyps ranging from one to 22. We observed that some CRC (32/134, 23.88%) samples had no polyps, whereas some negative samples had from 1 to 3 polyps (21/925, 2.27%), and some lesions that were not associated with a clinically relevant colonoscopy had a considerable amount of polyps (from 1 to 11 polyps, e.g., two individuals diagnosed by LNAR and LRL had 11 polyps). We searched for species whose abundance correlated significantly with the number of polyps and found 33 such cases (
Data S6), including
B. vulgatus, which was associated with systemic inflammation and CRC progression [
46]. Finally, we found no significant effect of the CRC tumor stage on the microbiome composition, although this may relate to limited sample size (n = 101, Adonis test, R2: 0.03104
p value: 0.386). A subset of the included individuals (n = 2016) responded to a lifestyle questionnaire. We assessed the impact of different variables on microbiome composition, and found a significant impact of weight, height, regular exercise, smoking, alcohol, vegetables and processed meat intake and anti-inflammatory drug use, as observed in previous studies. When this impact was considered in conjunction with the diagnosis, we observed only a significant effect of the vegetable’s intake (
Figure S6).
3.3. Diagnosis-Specific Co-Occurrence and Functional Profiles
To gain further insights into the changes of microbial composition along the path from healthy tissue to CRC, we used proxies for community interactions (co-occurrence networks), and functional potential (functional inference from taxonomic assignment). We first built species networks showing patterns of correlated abundances for samples with each specific diagnosis and compared them (see Materials and Methods,
Section 2.5). By constructing and representing co-occurrence networks based on the 50 most abundant taxa, we qualitatively observed differences across the diagnoses along the path from healthy colon to CRC (
Figure 3). These differences were confirmed by computing hamming distances between co-occurrence networks of successive pairs of diagnoses along this path: 0.024 (N vs. LNAR), 0.023 (LNAR vs. LRL), 0.014 (LRL vs. IRL), 0.016 (IRL vs. HRL), 0.030 (HRL vs. CIS) and 0.028 (CIS vs. CRC). According to this, the last two steps in the progression from healthy tissue towards CRC (HRL to CIS and CIS to CRC) display the largest dissimilarities. Similar results were obtained using an alternative approach based on Spearman correlations: 66% (N vs. LNAR), 65% (LNAR vs. LRL), 53% (LRL vs. IRL), 53% (IRL vs. HRL), 79% (HRL vs. CIS) and 73% (CIS vs. CRC).
S1: Bacteroides vulgatus, S2: Akkermansia muciniphila, S3: Akkermansia spp., S4: Collinsella aerofaciens, S5: Bacteroides spp., S6: Agathobacter spp., S7: Bacteroides uniformis, S8: Faecalibacterium prausnitzii, S9: Holdemanella spp., S10: Collinsella spp., S11: Faecalibacterium_CM04-06 spp., S12: Ruminococcus bromii, S13: Erysipelotrichaceae_UCG-003 spp., S14: Escherichia spp., S15: Faecalibacterium spp., S16: Dorea longicatena, S17: Alistipes putredinis, S18: Phascolarctobacterium spp., S19: Ruminococcus spp., S20: Blautia spp., S21: Subdoligranulum spp., S22: Alistipes spp., S23: Dorea spp., S24: Bifidobacterium spp., S25: Bacteroides massiliensis, S26: Streptococcus spp., S27: Ruminococcaceae_UCG-002 spp., S28: F.Lachnospiraceae.UCG, S29: Prevotella spp., S30: Parabacteroides spp., S31: Ruminococcaceae_UCG-014 spp., S32: Prevotellaceae_NK3B31_group spp., S33: F.Ruminococcaceae.UCG, S34: Coprococcus spp., S35: Anaerostipes spp., S36: Dialister spp., S37: Roseburia spp., S38: Lachnospira spp., S39: Barnesiella spp., S40: Bacteroides coprocola, S41: F.Muribaculaceae.UCG, S42: Paraprevotella spp., S43: Catenibacterium spp., S44: O.Rhodospirillales.UCF, S45: Erysipelatoclostridium spp., S46: Lachnospiraceae_NK4A136_group spp., S47: Christensenellaceae_R-7_group spp., S48: Lachnoclostridium spp., S49: Ruminiclostridium spp. and S50: Alloprevotella spp.
Of note, some of the specific differences that we detected were that Akkermansia muciniphila and Akkermansia spp. were found as positively correlated in all the diagnoses, but only in CRC we observed a negative correlation of the Akkermansia spp. and Dorea longicatena species. In contrast, in LNAR and LRL we found a negative correlation of these species with Agathobacter spp. and Alloprevotella spp., respectively. Also, we observed a positive correlation between Collinsella aerofaciens and Collinsella spp. in all the diagnoses except in the CIS group, and only in CRC we observed a negative correlation with another taxon, Lachnospira spp.
Co-occurrence networks may reflect underlying microbial communities that may interact metabolically. To obtain functional insights we inferred the functional potential of the microbiota in each sample by exploring metabolic pathways and processes associated with 2927 orthologous groups (OG, i.e., functionally-annotated gene families) in 376 taxa present in our samples (see Materials and Methods,
Section 2.6). By studying the variation of abundance of OGs across samples, we identified 184 that were significantly differentially abundant according to the diagnosis (
Data S7). The differentially abundant OGs were linked to 23 enriched pathways (containing more than 10 predicted OGs and 10% or more differentially abundant OGs involved), many of which have been linked to CRC in the literature, according to a text-mining approach (
Figure 4a).
When performing pairwise comparisons between diagnoses along the path from healthy colon to CRC, we only observed significant differences of OGs in the transition from IRL to HRL (
Figure 4b and
Data S8). For instance, some of the OGs that we found as significantly differentially abundant between these two diagnoses were: K00850, K00963, K02231, which are involved, respectively, in galactose metabolism, RNA degradation, pentose and glucuronate interconversions, porphyrin and chlorophyll metabolism, peptidoglycan biosynthesis and cell cycle—Caulobacter.
3.4. Development of a Two-Phase Machine Learning Classifier
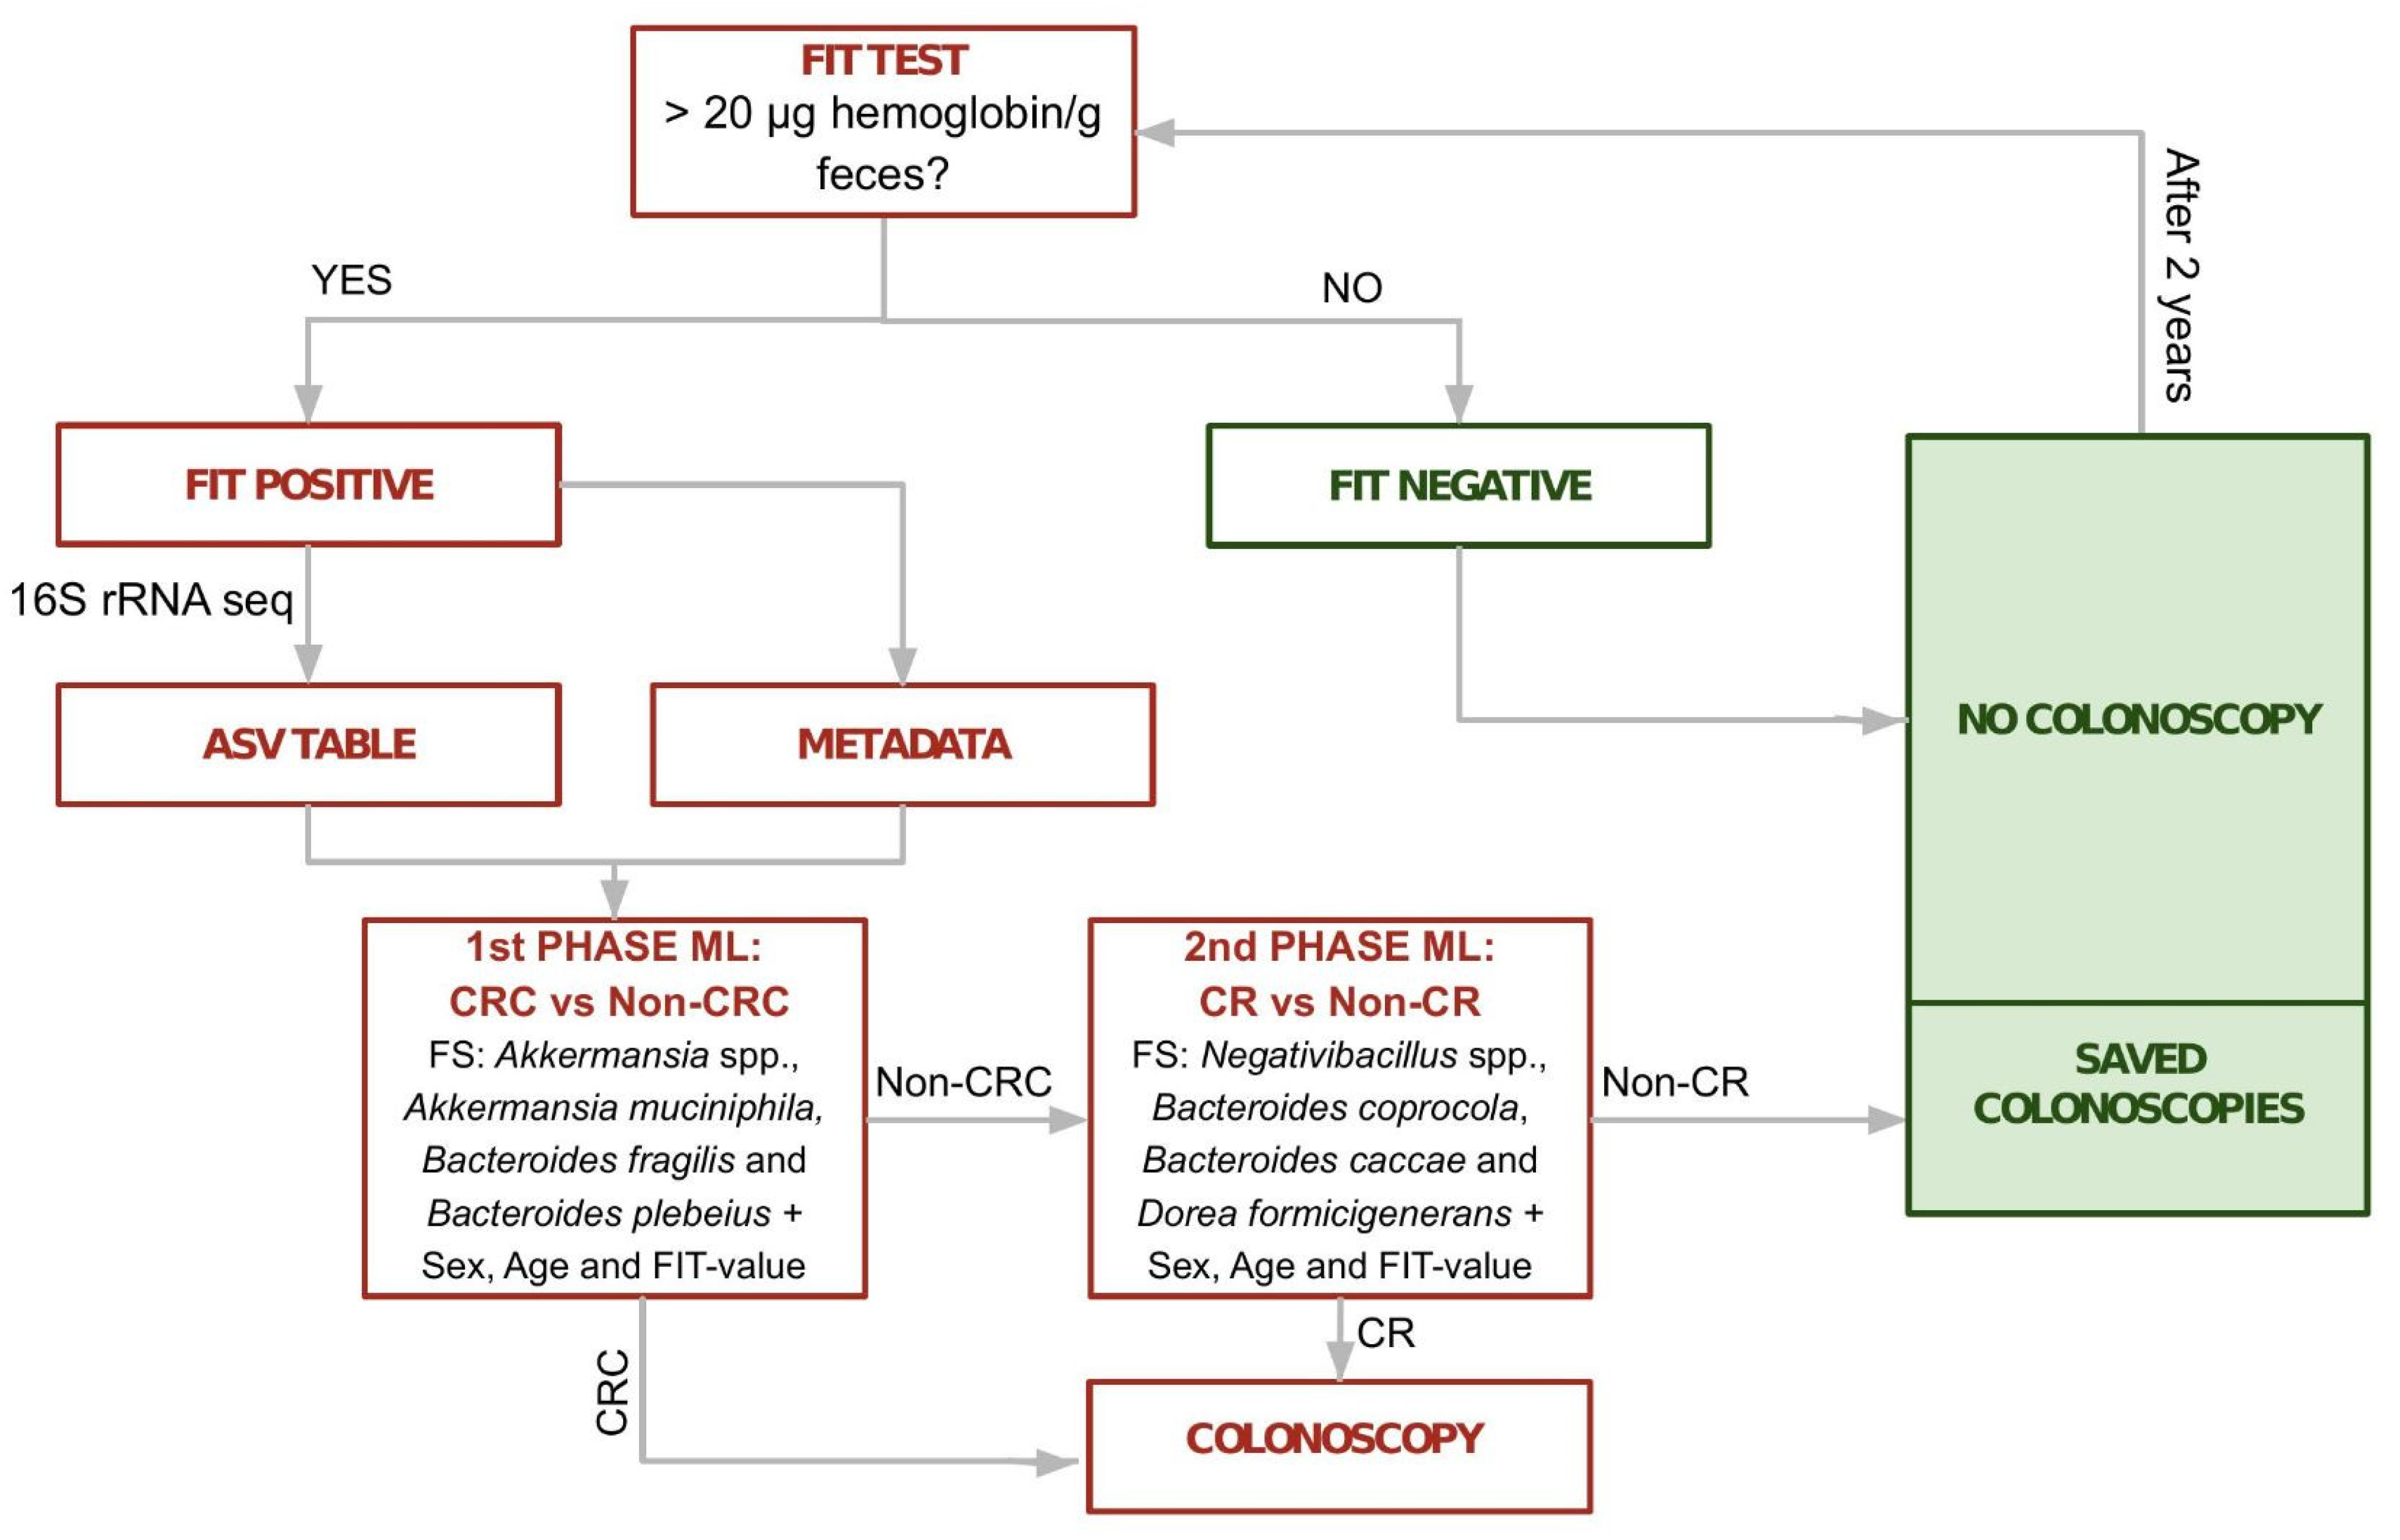
The observed differences in bacterial composition across samples with varying diagnoses suggest a diagnostic potential for the microbial compositions of FIT-positive samples that could be harnessed to improve the efficiency of current screening programs. With the aim of reducing unnecessary colonoscopies while maintaining a high sensitivity, we explored machine learning approaches to develop a sample classifier able to discriminate samples with clinically-relevant diagnoses (CR, CRC samples and lesions of higher risk). Contrary to most automated classifiers that aim at maximizing accuracy, we intentionally put our focus on achieving high sensitivity at the cost of reduced accuracy. This is justified because, in a clinical context, false negatives (i.e., persons with clinically relevant lesions that do not proceed to colonoscopy) are of higher medical concern as compared to false positives (persons with no lesions that undergo colonoscopy), and because the main aim was to reduce the already high level of false positives in current FIT-based screenings without increasing the amount of false negatives. To derive this predictor, we explored the effect of using different machine learning algorithms, and the use of feature selection to restrict the parameter set to all bacterial taxa showing significant differences, or to a subset of them (see Materials and Methods,
Section 2.7). When including more taxa, we observed a better area under the curve (AUC) and specificity (
Table S4) This fact can be translated to better reduction of false-positive rates. On the other hand, when restricting to only a panel of taxa, we obtained better recall and sensitivity for CRC and CR samples but poor AUC and specificity (
Table 1). However, in the context of the current screening, there is still a satisfactory reduction of the false-positive rate with a good prioritization of relevant cases. We achieved optimal results, in terms of inclusion of clinically relevant samples, with a two-phase classifier trained to classify CRC samples in a first phase and CR samples in a second phase. This final classifier considered information on sex, age and fecal hemoglobin concentration, and abundances from two different subsets of four taxa (first phase:
Akkermansia spp.,
Akkermansia muciniphila, Bacteroides fragilis and
Bacteroides plebeius and second phase:
Negativibacillus spp.,
Bacteroides coprocola,
Bacteroides caccae and
Dorea formicigenerans) (
Figure 5). This classifier obtained an average 98.98% sensitivity for CRC samples and 97.98% for clinically relevant samples (
Table 1B).
We validated our strategy on two independent datasets. We first constructed a model with all the samples (without including
Bacteroides fragilis, see Materials and Methods,
Section 2.7) and tested it on an independent cohort of 135 FIT-positive samples from the USA [
37]. The results of this adjusted model in the USA cohort yielded 100% sensitivity for CRC and 98.46% for CR lesions, reducing 20 % of the unnecessary colonoscopies (
Table S5A). We also performed an additional validation, in this case including both 4-4 taxa panels, with an independent dataset composed of 100 additional samples from the same Catalan screening detecting all CRC samples, 96% of the CR samples and having a reduction of 12% of the false positives (
Table S5B). This last test set was balanced, and it was used for further optimization of the classifier. The corresponding ROC curves are represented at (
Figure S7).
We explored how changing some parameters of the classifier affected sensitivity and the number of saved colonoscopies. For instance, by penalizing less the minority class (CR) at the second phase, we obtained better reduction of unnecessary colonoscopies (26%) but at the cost of including less CR samples (90%). Similarly, the number of samples to be tested for the microbial signature can be reduced by applying a FIT-value threshold above which a benefit of colonoscopy is assumed. For instance, applying a value of 954 μg hemoglobin/g feces (3rd quartile in our CR samples) for such a threshold, which is passed by 18% of our samples, would save 14% of unnecessary colonoscopies at the end of the process and reduce the need for microbiome testing. When we combined both approaches, we could reach 30% of saved colonoscopies, at the cost of a reduction of CR detection (87%). However, in all the mentioned cases we detected 100% of the CRC samples. This shows that our algorithm can be fine-tuned to optimize cost-effectiveness (
Figure S8). A comparison of our algorithm with the current FIT strategy and other available solutions (GoodGut [
47] and ColoGuard [
48]) revealed higher sensitivity for both CRC and CR while maintaining a significant reduction of the current false positive rate and, importantly, without the need of collecting a separate sample from the screening (
Table S6).
We next assessed possible alternative subsets of species included in the lists of differentially abundant taxa according to the diagnosis (
Data S4 and S5) as potential features for the classification (See Materials and Methods,
Section 2.7). We tested a total of 948 models and selected 13.5% of them (128/948). The strategy that led to more selected models was the one including subsets of 4 taxa with highest effect size, selecting half of the trained models (
Figure S9A). The two
Akkermansia species were the taxa that were most often included in selected models (
Figure S9B) and 96.88% of the selected models included at least one of the 8 taxa used as features in the 4-4 taxa panel classifier (
Akkermansia muciniphila,
Akkermansia spp.,
Bacteroides fragilis,
Bacteroides plebeius,
Bacteroides coprocola,
Negativibacillus spp.,
Dorea formicigenerans or
Bacteroides caccae). These results suggest that different combinations of biomarkers drawn from the identified differentially abundant taxa can effectively be used to classify samples according to their clinical relevance.
4. Discussion
CRC is a healthcare challenge and one of the leading causes of cancer-related deaths worldwide [
49]. Early diagnosis of CRC is key for efficient treatment and for the survival of the patients and, hence, there is a strong interest in implementing diagnostic screenings for populations at risk. Colonoscopy, which is the gold standard for CRC diagnosis, is an expensive, time-consuming, invasive technique with potential complications. To minimize the use of colonoscopy only to cases that are more likely to benefit, population screening programs use less specific, non-invasive tests to pre-screen for risk of CRC. Immunochemical methods, such as FIT, have commonly been used as pre-colonoscopy tests in a two-step approach [
50], but they have high false-positive rates, which results in unnecessary colonoscopies. This, in turn, increases healthcare costs and saturates endoscopy units, limiting the efficiency of population screenings. Considering this, there is a need to reduce the false-positive rate of the initial screening step by identifying new biomarkers and developing new risk scores. In this context, the gut microbiome has been suggested as a promising source for biomarkers with diagnostic potential in CRC [
51]. In this project, we set out to investigate the potential of FIT samples to identify diagnostic markers and changes in the microbiota along the path from healthy colonic tissue to CRC.
Recent studies have shown the potential of the gut microbiome for CRC screening but these are mainly based on other types of samples [
8,
41,
52,
53] (e.g.,: gFOBT or stool samples) and are often focused on the comparison of CRC and healthy controls. In contrast, the focus of this project was on improving current screening programs based on FIT testing, using material from the same samples, and focusing on distinguishing clinically relevant cases (not only CRC) from FIT-positive samples (not the usual healthy baseline but the baseline of the population currently sent for colonoscopy).
Our results support the use of sampled material directly from FIT containers for microbiome analysis, avoiding the complex and costly collection and processing of separate stool samples that are widely and traditionally used to represent the gut microbiome [
36]. More importantly, we show that the collected fecal material was enough to perform both the hemoglobin analysis and DNA extraction, and that the DNA was of sufficient quantity and quality to efficiently perform 16S metabarcoding. Earlier studies have also shown good conservation of DNA from frozen samples and close correspondence between microbiome profiles obtained from FIT samples and matching fecal material [
54,
55]. This is consistent with our results, which showed that the identified taxa and abundances are typically found in studies that use stool samples although observing differences that can be attributed to cohort or methodological particularities. Hence, our study shows that we can use the same fecal sample for both FIT and microbiome analyses, facilitating the implementation of microbiome-based biomarkers in currently ongoing population screening programs. It is well known that a high percentage of CRCs emerge from premalignant polypoid lesions (i.e., adenomas and serrated lesions), which progress to CRC following a multi-stage development driven by both genetic and environmental risk factors [
56]. Diet and lifestyle are key environmental factors associated with the presence of adenomas and their progression to CRC, likely through alterations of the gut microbiome. In our study, we captured differences between the fecal microbiome profiles along the various stages in the path from normal colonic epithelium to CRC. To the best of our knowledge, this is the first large microbiome study considering such a detailed and rigorous diagnostic classification associated with the included samples, which comprises different lesions in addition to healthy and CRC samples (
Table S1). We did not observe disparate overall microbiome compositions between different clinical diagnoses but did find significant changes in particular taxa. Thus, different combinations of small but relevant changes may drive microbiome influence on CRC progression. In addition, it must be considered that microbiota alterations might more profoundly affect lesions and surrounding tissues, which may result in only subtle differences in the overall composition of the fecal material contained within FIT tubes.
Expectedly, we observed that CRC was the diagnostic group that had the most distinct microbiome profile. Taxa with the highest deviations in CRC-associated samples were
Akkermansia muciniphila and an unclassified species from the same genus (
Akkermansia spp.), which were overrepresented in CRC compared to the other samples, and
Bacteroides fragilis and
Bacteroides plebeius, which were underrepresented. Of note,
A. muciniphila is a mucin-degrading bacterium and mucins such as MUC1 and MUC5AC are known to be overexpressed in CRC patients [
57]. Hence, an increase of substrate availability could influence the observed higher abundance of this species. Interestingly, it is known that if microorganisms or their products cross the host epithelial barrier, both the immune and mesenchymal defenses respond with a signaling cascade (e.g., activation of NF-kB and STAT3) in order to maintain epithelial integrity. This fact has a selective impact on the gut microbiome and triggers mucin and antimicrobial peptide secretion [
58].
A. muciniphila was found as overrepresented in other populations, and it was recently claimed as a potential biomarker for CRC in tissue [
59].
Contrary to other studies with fecal and tissue samples that reported an enrichment of
Bacteroides fragilis in CRC [
58], we found this species to be underrepresented in these samples. Previous studies suggested that
B. fragilis plays a key role in the development of CRC through the action of its toxin (BFT), which can influence colorectal tumorigenesis by disturbance or activation of signaling pathways that produce chronic intestinal inflammation and tissue injury [
60]. However, we found this underrepresentation comparing CRC vs. non-CRC (including all the adenomas), as opposed to these other studies which compared CRC vs. healthy samples. Previous studies have shown that there are different strains of
B. fragilis along the gastrointestinal tract apart from the mentioned BFT-producing strains, such as a non-toxigenic
B. fragilis which has an immunogenic capsular component, and the Polysaccharide A that promotes mucosal immune development and whose increase has not been associated to CRC [
61,
62].
We also observed an influence on the differences of the microbiome driven by variables like sex and age and, interestingly, by the number of polyps. As mentioned above, the presence of polyps can be a sign of risk to development or progression of CRC, so the study of the microbiome associated with polyps can serve as a source of predictive biomarkers for CRC. Some of the genera whose abundance correlated with the number of polyps were also reported in previous studies in relation to risk for CRC polyps (e.g.,
Bacteroides,
Blautia and
Bifidobacterium). However, the presence of polyps does not necessarily lead to the development of CRC and some patients with particular genetic profiles may present numerous polyps [
63].
It is known that the presence of certain metabolites, DNA damage, and inflammation are all factors driving CRC progression [
64]. Changes in the microbial composition or functionalities can promote a more optimal microenvironment for the development of CRC. Conversely, CRC progression can alter the surrounding environment and therefore affect microbial communities. In our study, we inferred the potential functionalities of the microbiome profiles associated with each colonoscopy outcome and observed OGs that were significantly differentially abundant across diagnoses. Interestingly, we observed that the transition from intermediate risk lesion to high risk lesion was the stage with the greatest alteration of functional and metabolic capacities. Some examples of enriched pathways were galactose metabolism, RNA degradation, pentose and glucuronate interconversions and quorum sensing. In this regard, it has been reported that microbes can interact with cancer cells through their quorum sensing peptides and influence metastasis [
65]. Also of note, many of the pathways found are related to DNA repair. This may reflect a toxic environment for the microbial DNA, perhaps caused by the bacterial metabolism. This same environment could be damaging to the host DNA, supporting a genotoxic pathway connecting the microbiome and CRC development [
66]. Our results are based on 16S rRNA sequencing, which is a cost-effective approach that can be applied to many samples. In particular, the presented results related to functional inference should be confirmed using shotgun metagenomics or meta-transcriptomics approaches, which will provide better resolution. However, previous studies demonstrated high correlation of functional profiles predicted from 16S rRNA sequencing data and from metagenomes [
67], and we believe the data presented here are a good proxy for generating testable hypotheses.
Metabolic capacities of some microorganisms, such as the mentioned mucin utilization of
A.muciniphila, can result in sources of nutrients or energy for other microbes in the gut. The study of correlated abundances between different microbes is interesting in this context. We detected distinct taxon co-occurrence patterns in the studied diagnoses that likely reflect changes in microbial ecosystems and their metabolic interactions that accompany the transitions towards CRC development. It is interesting to account for these patterns because of the dominant functional redundancy of the gut microbiome: some bacteria can share functions and exert similar influences on the development and progression of CRC. In addition, it is still unclear how microbes modulate each other, or how they shape the immune environment of the tumor, and these co-occurrence patterns can shed light in this direction [
58]. For instance, we observed an exclusive negative association between
Dorea longicatena and
Akkermansia spp. only in the CRC group.
The presented machine learning prediction results show a potential role of the microbial composition of FIT samples in CRC screening. We derived a two-phase classifier with high sensitivity for CRC and other CR samples with a small but significant reduction of the false positive rate. In the context of the Barcelona screening program [
13], in which there is an average participation of 50%, approximately 5% of participants have a positive FIT result. Of them, around 3–5% have CRC detected during colonoscopy and an additional 30% have a CR lesion associated with CRC risk requiring a more intensive surveillance, whereas around 65% have a normal colonoscopy or only non-CR lesions are detected. Therefore, translating our results to this clinical context and considering the mean participation and diagnosis obtained during the last four available rounds, we would save a range between 423 (12%) to 1057 (30%) unnecessary colonoscopies each year, while maximizing the inclusion of CR individuals (
Data S9).
By reducing the number of unnecessary colonoscopies and increasing cost-effectiveness of current population screenings, microbiome-based tests such as the one explored here, could not only save money and time but also increase participation and adherence rates. The present study has some limitations, such as the imbalance in some of the diagnoses, and the lack of more detailed information on polyps or lesion characteristics (e.g., localization, size, histology), genetic profiles, or past treatments, which can be factors influencing the microbiome. However, this lack of information, which is difficult to access beforehand, is also a strength of our study, showing that with just the FIT sample and information on the sex and age of individuals we can draw some conclusions and obtain a classification of the samples with high sensitivity for CRC and CR samples. Further studies are necessary to validate these findings in different cohorts and to properly assess cost-effectiveness in the framework of a health economics analysis that considers direct and indirect costs of colonoscopy and microbiome analysis from FIT samples. Finally, further developments such as a targeted quantification of a species panel by multiplex PCR, or implementations in the FIT tube to accommodate this additional test, will likely further reduce costs and facilitate the adoption of microbiome-based tests.


 ,
, 


