
Radiogenomics in Clear Cell Renal Cell Carcinoma: A Review of the Current Status and Future Directions

Abstract
:Simple Summary
Abstract
1. Introduction
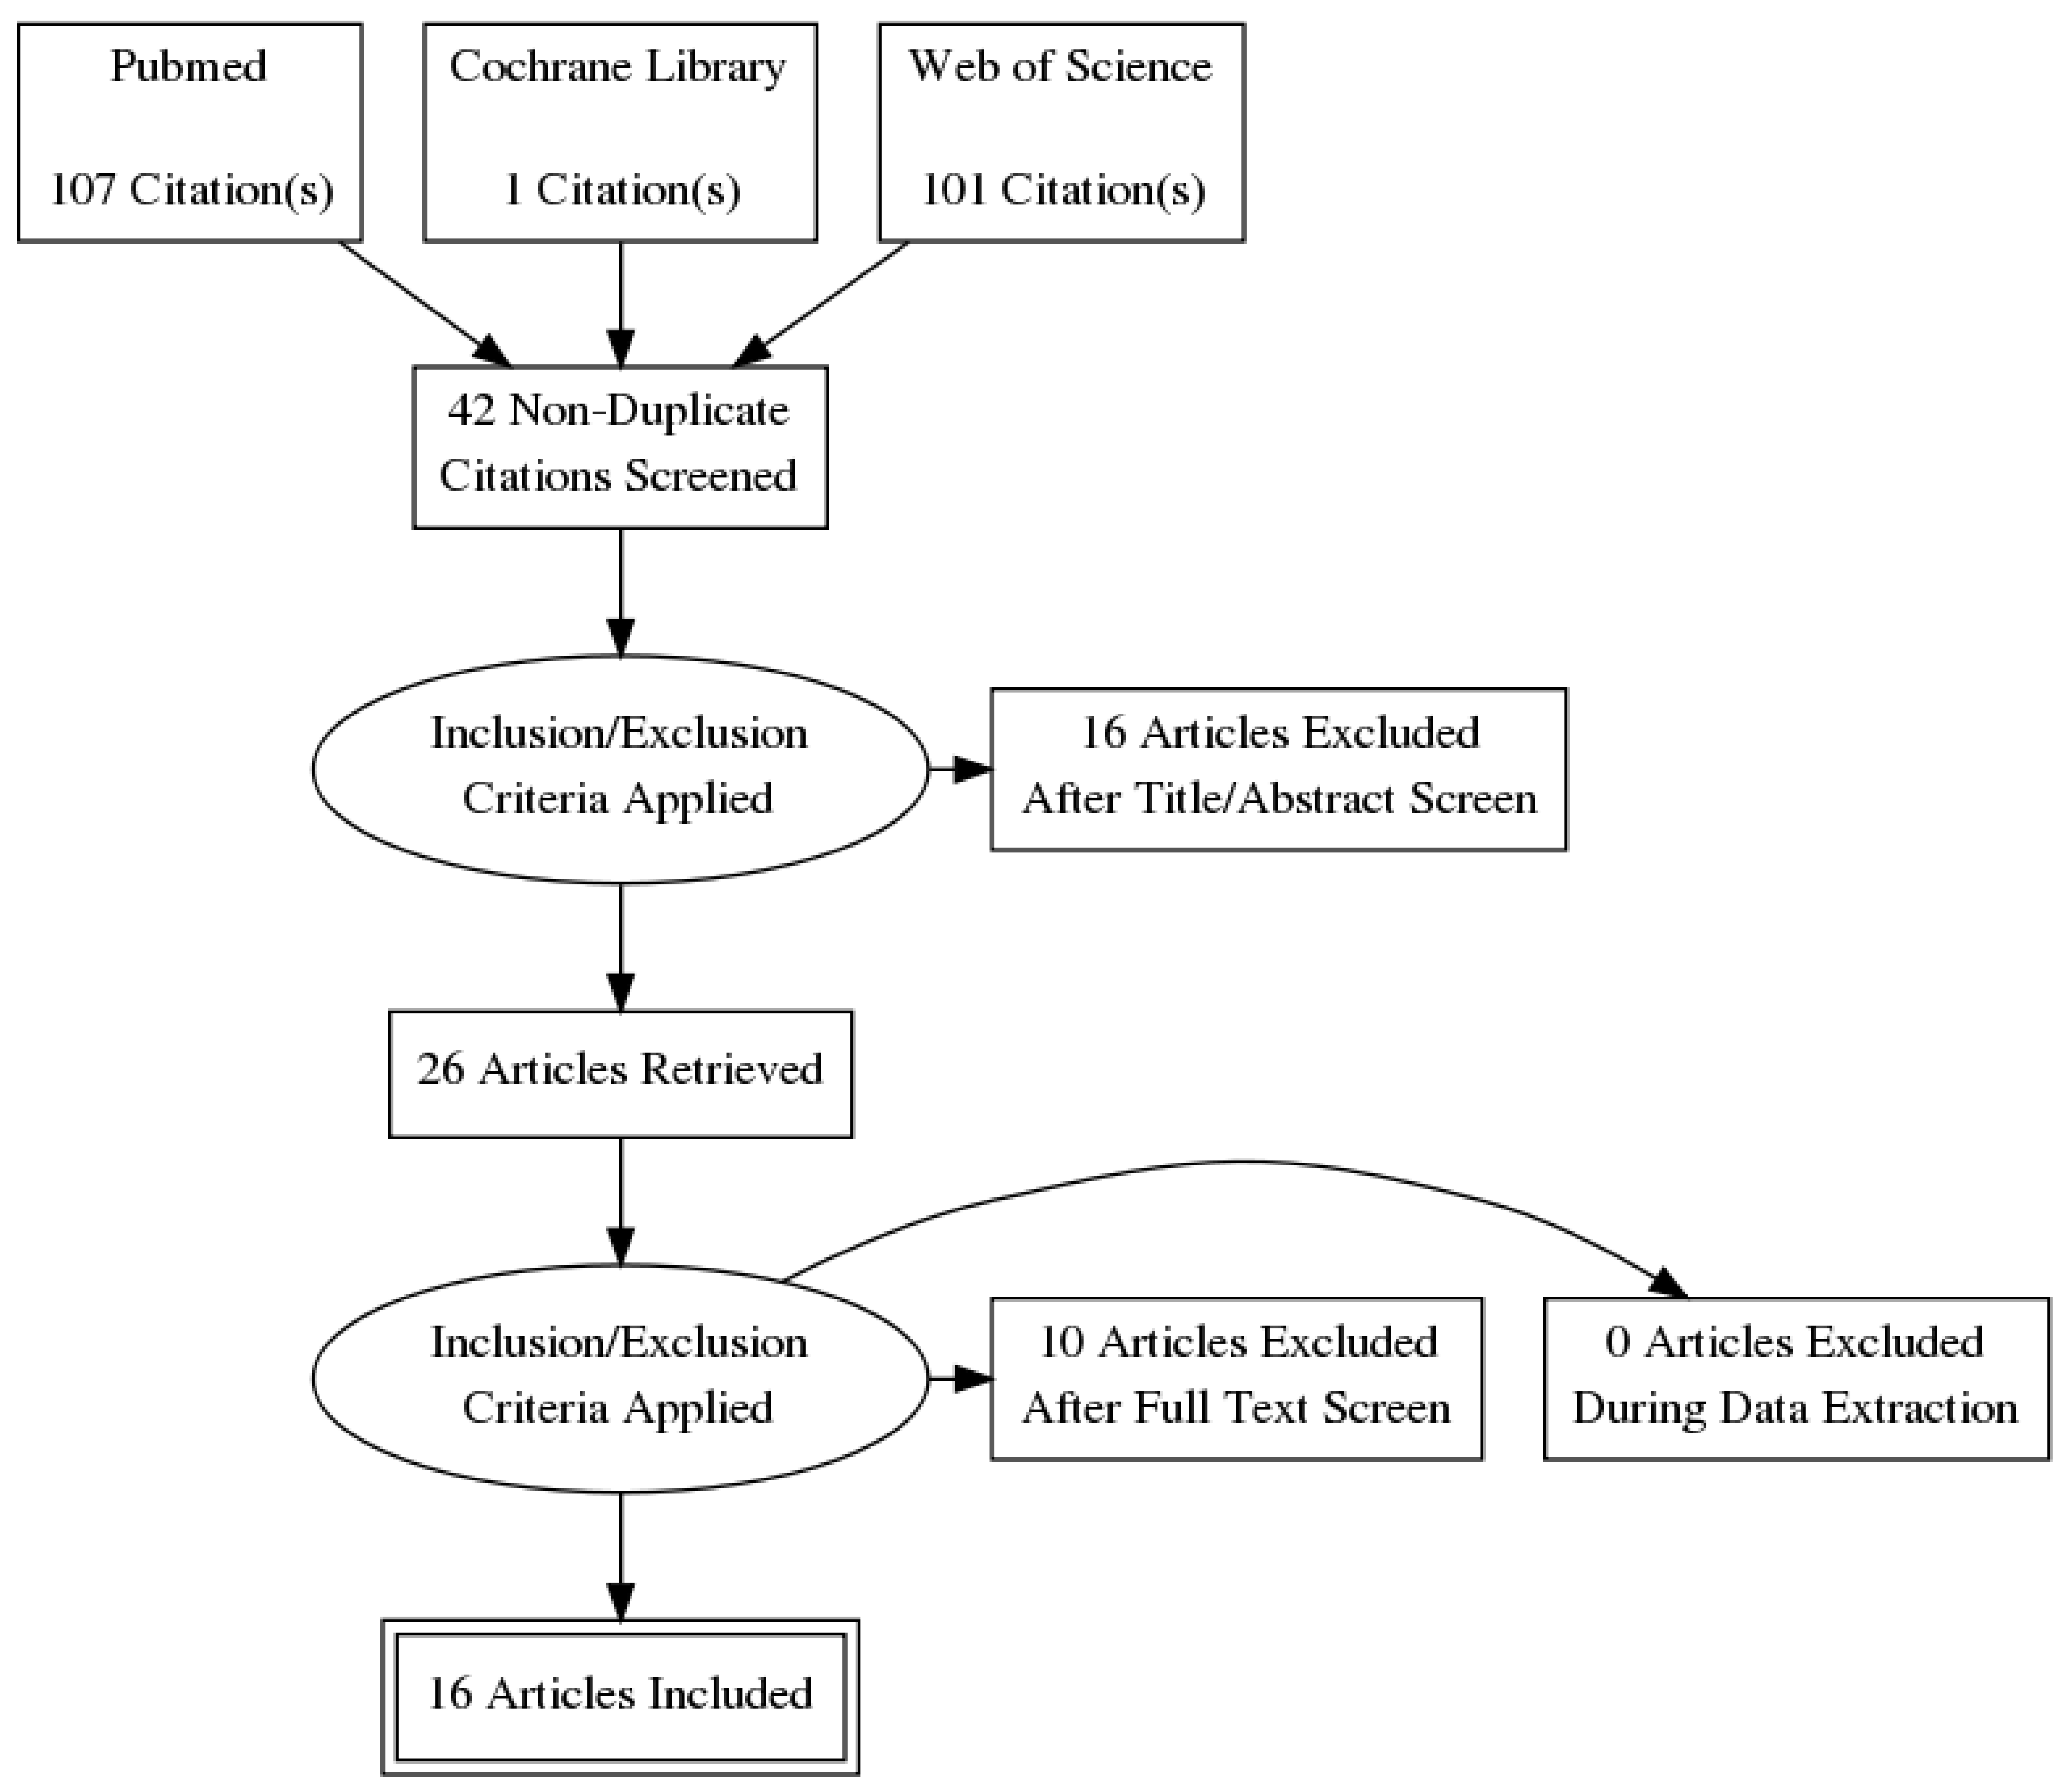
2. Methods
3. Results
3.1. Key Genetic Mutations in ccRCC
3.1.1. VHL
3.1.2. PBRM1
3.1.3. BAP1
3.1.4. SETD2
3.1.5. KDM5C
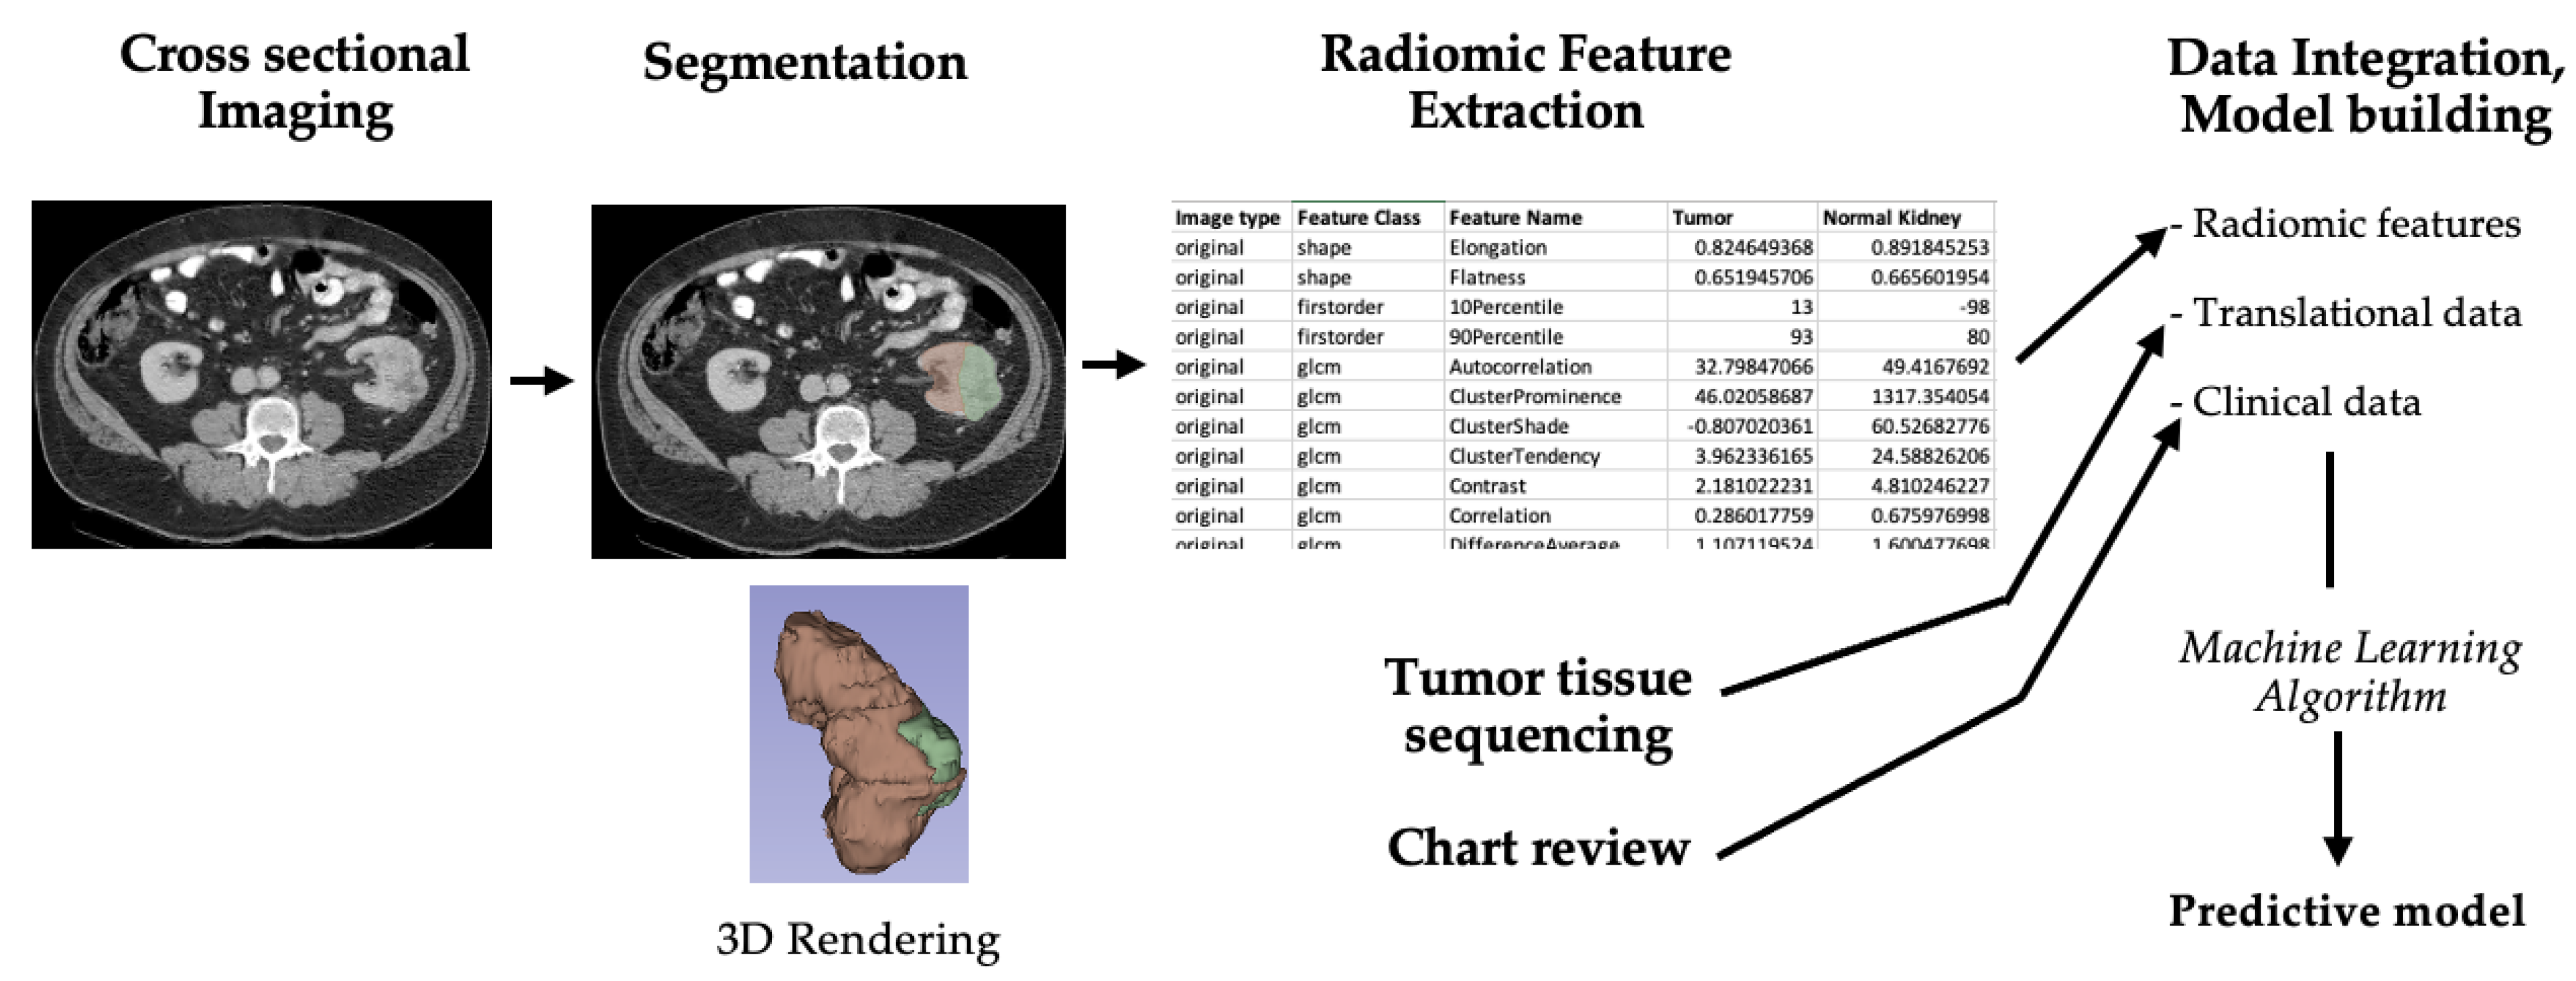
3.2. Overview of Radiogenomics Workflow
3.3. Mutational Radiogenomic Biomarkers
3.4. Beyond Gene Mutations: Transcriptomic and Epigenetic Radiogenomic Biomarkers
3.4.1. Transcriptomic Radiogenomic Biomarkers
3.4.2. Epigenetic Radiogenomic Biomarkers
3.5. Beyond Predicting Molecular Profile: Radiogenomic Models as Clinical Biomarkers
4. Discussion
5. Conclusions
Author Contributions
Funding
Conflicts of Interest
References
- Motzer, R.J.; Jonasch, E.; Michaelson, M.D.; Nandagopal, L.; Gore, J.L.; George, S.; Alva, A.; Haas, N.; Harrison, M.R.; Plimack, E.R.; et al. NCCN Guidelines Insights: Kidney Cancer, Version 2.2020. J. Natl. Compr. Canc. Netw. 2019, 17, 1278–1285. [Google Scholar] [CrossRef] [PubMed] [Green Version]
- Linehan, W.M. Genetic basis of kidney cancer: Role of genomics for the development of disease–based therapeutics. Genome Res. 2012, 22, 2089–2100. [Google Scholar] [CrossRef] [PubMed] [Green Version]
- Patel, H.D.; Gupta, M.; Joice, G.A.; Srivastava, A.; Alam, R.; Allaf, M.E.; Pierorazio, P.M. Clinical Stage Migration and Survival for Renal Cell Carcinoma in the United States. Eur. Urol. Oncol. 2019, 2, 343–348. [Google Scholar] [CrossRef] [PubMed]
- Johnson, D.C.; Vukina, J.; Smith, A.B.; Meyer, A.M.; Wheeler, S.B.; Kuo, T.M.; Tan, H.J.; Woods, M.E.; Raynor, M.C.; Wallen, E.M.; et al. Preoperatively misclassified, surgically removed benign renal masses: A systematic review of surgical series and United States population level burden estimate. J. Urol. 2015, 193, 30–35. [Google Scholar] [CrossRef]
- Sasaguri, K.; Takahashi, N. CT and MR imaging for solid renal mass characterization. Eur. J. Radiol. 2018, 99, 40–54. [Google Scholar] [CrossRef]
- Avanzo, M.; Stancanello, J.; El Naqa, I. Beyond imaging: The promise of radiomics. Phys. Med. 2017, 38, 122–139. [Google Scholar] [CrossRef]
- Bowen, L.; Xiaojing, L. Radiogenomics of Clear Cell Renal Cell Carcinoma: Associations Between mRNA-Based Subtyping and CT Imaging Features. Acad. Radiol. 2019, 26, e32–e37. [Google Scholar] [CrossRef]
- Brannon, A.R.; Reddy, A.; Seiler, M.; Arreola, A.; Moore, D.T.; Pruthi, R.S.; Wallen, E.M.; Nielsen, M.E.; Liu, H.; Nathanson, K.L.; et al. Molecular Stratification of Clear Cell Renal Cell Carcinoma by Consensus Clustering Reveals Distinct Subtypes and Survival Patterns. Genes Cancer 2010, 1, 152–163. [Google Scholar] [CrossRef]
- Vuong, L.; Kotecha, R.R.; Voss, M.H.; Hakimi, A.A. Tumor Microenvironment Dynamics in Clear-Cell Renal Cell Carcinoma. Cancer Discov. 2019, 9, 1349–1357. [Google Scholar] [CrossRef] [Green Version]
- Hakimi, A.A.; Voss, M.H.; Kuo, F.; Sanchez, A.; Liu, M.; Nixon, B.G.; Vuong, L.; Ostrovnaya, I.; Chen, Y.B.; Reuter, V.; et al. Transcriptomic Profiling of the Tumor Microenvironment Reveals Distinct Subgroups of Clear Cell Renal Cell Cancer: Data from a Randomized Phase III Trial. Cancer Discov. 2019, 9, 510–525. [Google Scholar] [CrossRef] [Green Version]
- Sun, M.; Shariat, S.F.; Cheng, C.; Ficarra, V.; Murai, M.; Oudard, S.; Pantuck, A.J.; Zigeuner, R.; Karakiewicz, P.I. Prognostic factors and predictive models in renal cell carcinoma: A contemporary review. Eur. Urol. 2011, 60, 644–661. [Google Scholar] [CrossRef] [PubMed]
- Heng, D.Y.; Xie, W.; Regan, M.M.; Warren, M.A.; Golshayan, A.R.; Sahi, C.; Eigl, B.J.; Ruether, J.D.; Cheng, T.; North, S.; et al. Prognostic factors for overall survival in patients with metastatic renal cell carcinoma treated with vascular endothelial growth factor-targeted agents: Results from a large, multicenter study. J. Clin. Oncol. 2009, 27, 5794–5799. [Google Scholar] [CrossRef] [PubMed]
- Frank, I.; Blute, M.L.; Cheville, J.C.; Lohse, C.M.; Weaver, A.L.; Zincke, H. An outcome prediction model for patients with clear cell renal cell carcinoma treated with radical nephrectomy based on tumor stage, size, grade and necrosis: The SSIGN score. J. Urol. 2002, 168, 2395–2400. [Google Scholar] [CrossRef]
- Zisman, A.; Pantuck, A.J.; Dorey, F.; Said, J.W.; Shvarts, O.; Quintana, D.; Gitlitz, B.J.; DeKernion, J.B.; Figlin, R.A.; Belldegrun, A.S. Improved prognostication of renal cell carcinoma using an integrated staging system. J. Clin. Oncol. 2001, 19, 1649–1657. [Google Scholar] [CrossRef] [PubMed]
- Rutman, A.M.; Kuo, M.D. Radiogenomics: Creating a link between molecular diagnostics and diagnostic imaging. Eur. J. Radiol. 2009, 70, 232–241. [Google Scholar] [CrossRef]
- Lo Gullo, R.; Daimiel, I.; Morris, E.A.; Pinker, K. Combining molecular and imaging metrics in cancer: Radiogenomics. Insights Imaging 2020, 11, 1. [Google Scholar] [CrossRef]
- Mazurowski, M.A. Radiogenomics: What it is and why it is important. J. Am. Coll. Radiol. 2015, 12, 862–866. [Google Scholar] [CrossRef]
- Story, M.D.; Durante, M. Radiogenomics. Med. Phys. 2018, 45, e1111–e1122. [Google Scholar] [CrossRef]
- Bodalal, Z.; Trebeschi, S.; Nguyen-Kim, T.D.L.; Schats, W.; Beets-Tan, R. Radiogenomics: Bridging imaging and genomics. Abdom. Radiol. 2019, 44, 1960–1984. [Google Scholar] [CrossRef] [Green Version]
- Karlo, C.A.; Di Paolo, P.L.; Chaim, J.; Hakimi, A.A.; Ostrovnaya, I.; Russo, P.; Hricak, H.; Motzer, R.; Hsieh, J.J.; Akin, O. Radiogenomics of clear cell renal cell carcinoma: Associations between CT imaging features and mutations. Radiology 2014, 270, 464–471. [Google Scholar] [CrossRef]
- Shinagare, A.B.; Vikram, R.; Jaffe, C.; Akin, O.; Kirby, J.; Huang, E.; Freymann, J.; Sainani, N.I.; Sadow, C.A.; Bathala, T.K.; et al. Radiogenomics of clear cell renal cell carcinoma: Preliminary findings of The Cancer Genome Atlas-Renal Cell Carcinoma (TCGA-RCC) Imaging Research Group. Abdom. Imaging 2015, 40, 1684–1692. [Google Scholar] [CrossRef] [PubMed]
- Chen, X.; Zhou, Z.; Hannan, R.; Thomas, K.; Pedrosa, I.; Kapur, P.; Brugarolas, J.; Mou, X.; Wang, J. Reliable gene mutation prediction in clear cell renal cell carcinoma through multi-classifier multi-objective radiogenomics model. Phys. Med. Biol. 2018, 63, 215008. [Google Scholar] [CrossRef] [PubMed]
- Li, Z.C.; Zhai, G.; Zhang, J.; Wang, Z.; Liu, G.; Wu, G.Y.; Liang, D.; Zheng, H. Differentiation of clear cell and non-clear cell renal cell carcinomas by all-relevant radiomics features from multiphase CT: A VHL mutation perspective. Eur. Radiol. 2019, 29, 3996–4007. [Google Scholar] [CrossRef] [PubMed]
- Kocak, B.; Durmaz, E.S.; Ates, E.; Ulusan, M.B. Radiogenomics in Clear Cell Renal Cell Carcinoma: Machine Learning-Based High-Dimensional Quantitative CT Texture Analysis in Predicting PBRM1 Mutation Status. AJR Am. J. Roentgenol. 2019, 212, W55–W63. [Google Scholar] [CrossRef] [PubMed]
- Kocak, B.; Durmaz, E.S.; Kaya, O.K.; Kilickesmez, O. Machine learning-based unenhanced CT texture analysis for predicting BAP1 mutation status of clear cell renal cell carcinomas. Acta Radiol. 2020, 61, 856–864. [Google Scholar] [CrossRef]
- Feng, Z.; Zhang, L.; Qi, Z.; Shen, Q.; Hu, Z.; Chen, F. Identifying BAP1 Mutations in Clear-Cell Renal Cell Carcinoma by CT Radiomics: Preliminary Findings. Front Oncol. 2020, 10, 279. [Google Scholar] [CrossRef]
- Ghosh, P.; Tamboli, P.; Vikram, R.; Rao, A. Imaging-genomic pipeline for identifying gene mutations using three-dimensional intra-tumor heterogeneity features. J. Med. Imaging 2015, 2, 041009. [Google Scholar] [CrossRef] [Green Version]
- Marigliano, C.; Badia, S.; Bellini, D.; Rengo, M.; Caruso, D.; Tito, C.; Miglietta, S.; Palleschi, G.; Pastore, A.L.; Carbone, A.; et al. Radiogenomics in Clear Cell Renal Cell Carcinoma: Correlations Between Advanced CT Imaging (Texture Analysis) and MicroRNAs Expression. Technol. Cancer Res. Treat. 2019, 18, 1533033819878458. [Google Scholar] [CrossRef]
- Yin, Q.; Hung, S.C.; Rathmell, W.K.; Shen, L.; Wang, L.; Lin, W.; Fielding, J.R.; Khandani, A.H.; Woods, M.E.; Milowsky, M.I.; et al. Integrative radiomics expression predicts molecular subtypes of primary clear cell renal cell carcinoma. Clin. Radiol. 2018, 73, 782–791. [Google Scholar] [CrossRef]
- Cen, D.; Xu, L.; Zhang, S.; Chen, Z.; Huang, Y.; Li, Z.; Liang, B. Renal cell carcinoma: Predicting RUNX3 methylation level and its consequences on survival with CT features. Eur. Radiol. 2019, 29, 5415–5422. [Google Scholar] [CrossRef]
- Huang, Y.; Zeng, H.; Chen, L.; Luo, Y.; Ma, X.; Zhao, Y. Exploration of an Integrative Prognostic Model of Radiogenomics Features With Underlying Gene Expression Patterns in Clear Cell Renal Cell Carcinoma. Front Oncol. 2021, 11, 640881. [Google Scholar] [CrossRef] [PubMed]
- Jamshidi, N.; Jonasch, E.; Zapala, M.; Korn, R.L.; Aganovic, L.; Zhao, H.; Tumkur Sitaram, R.; Tibshirani, R.J.; Banerjee, S.; Brooks, J.D.; et al. The Radiogenomic Risk Score: Construction of a Prognostic Quantitative, Noninvasive Image-based Molecular Assay for Renal Cell Carcinoma. Radiology 2015, 277, 114–123. [Google Scholar] [CrossRef] [PubMed] [Green Version]
- Jamshidi, N.; Jonasch, E.; Zapala, M.; Korn, R.L.; Brooks, J.D.; Ljungberg, B.; Kuo, M.D. The radiogenomic risk score stratifies outcomes in a renal cell cancer phase 2 clinical trial. Eur. Radiol. 2016, 26, 2798–2807. [Google Scholar] [CrossRef] [PubMed]
- Udayakumar, D.; Zhang, Z.; Xi, Y.; Dwivedi, D.K.; Fulkerson, M.; Haldeman, S.; McKenzie, T.; Yousuf, Q.; Joyce, A.; Hajibeigi, A.; et al. Deciphering Intratumoral Molecular Heterogeneity in Clear Cell Renal Cell Carcinoma with a Radiogenomics Platform. Clin. Cancer Res. 2021, 27, 4794–4806. [Google Scholar] [CrossRef] [PubMed]
- Cancer Genome Atlas Research Network. Comprehensive molecular characterization of clear cell renal cell carcinoma. Nature 2013, 499, 43–49. [Google Scholar] [CrossRef] [Green Version]
- Sato, Y.; Yoshizato, T.; Shiraishi, Y.; Maekawa, S.; Okuno, Y.; Kamura, T.; Shimamura, T.; Sato-Otsubo, A.; Nagae, G.; Suzuki, H.; et al. Integrated molecular analysis of clear-cell renal cell carcinoma. Nat. Genet. 2013, 45, 860–867. [Google Scholar] [CrossRef]
- Brauch, H.; Weirich, G.; Brieger, J.; Glavac, D.; Rodl, H.; Eichinger, M.; Feurer, M.; Weidt, E.; Puranakanitstha, C.; Neuhaus, C.; et al. VHL alterations in human clear cell renal cell carcinoma: Association with advanced tumor stage and a novel hot spot mutation. Cancer Res. 2000, 60, 1942–1948. [Google Scholar]
- Maxwell, P.H.; Wiesener, M.S.; Chang, G.W.; Clifford, S.C.; Vaux, E.C.; Cockman, M.E.; Wykoff, C.C.; Pugh, C.W.; Maher, E.R.; Ratcliffe, P.J. The tumour suppressor protein VHL targets hypoxia-inducible factors for oxygen-dependent proteolysis. Nature 1999, 399, 271–275. [Google Scholar] [CrossRef]
- Kim, B.J.; Kim, J.H.; Kim, H.S.; Zang, D.Y. Prognostic and predictive value of VHL gene alteration in renal cell carcinoma: A meta-analysis and review. Oncotarget 2017, 8, 13979–13985. [Google Scholar] [CrossRef] [Green Version]
- Turajlic, S.; Xu, H.; Litchfield, K.; Rowan, A.; Chambers, T.; Lopez, J.I.; Nicol, D.; O’Brien, T.; Larkin, J.; Horswell, S.; et al. Tracking Cancer Evolution Reveals Constrained Routes to Metastases: TRACERx Renal. Cell 2018, 173, 581–594.e12. [Google Scholar] [CrossRef] [Green Version]
- Brugarolas, J. Molecular genetics of clear-cell renal cell carcinoma. J. Clin. Oncol. 2014, 32, 1968–1976. [Google Scholar] [CrossRef] [PubMed] [Green Version]
- Carril-Ajuria, L.; Santos, M.; Roldan-Romero, J.M.; Rodriguez-Antona, C.; De Velasco, G. Prognostic and Predictive Value of PBRM1 in Clear Cell Renal Cell Carcinoma. Cancers 2019, 12, 16. [Google Scholar] [CrossRef] [PubMed] [Green Version]
- Hakimi, A.A.; Chen, Y.B.; Wren, J.; Gonen, M.; Abdel-Wahab, O.; Heguy, A.; Liu, H.; Takeda, S.; Tickoo, S.K.; Reuter, V.E.; et al. Clinical and pathologic impact of select chromatin-modulating tumor suppressors in clear cell renal cell carcinoma. Eur. Urol. 2013, 63, 848–854. [Google Scholar] [CrossRef] [PubMed] [Green Version]
- Kim, S.H.; Park, W.S.; Park, E.Y.; Park, B.; Joo, J.; Joung, J.Y.; Seo, H.K.; Lee, K.H.; Chung, J. The prognostic value of BAP1, PBRM1, pS6, PTEN, TGase2, PD-L1, CA9, PSMA, and Ki-67 tissue markers in localized renal cell carcinoma: A retrospective study of tissue microarrays using immunohistochemistry. PLoS ONE 2017, 12, e0179610. [Google Scholar] [CrossRef] [Green Version]
- Miao, D.; Margolis, C.A.; Gao, W.; Voss, M.H.; Li, W.; Martini, D.J.; Norton, C.; Bosse, D.; Wankowicz, S.M.; Cullen, D.; et al. Genomic correlates of response to immune checkpoint therapies in clear cell renal cell carcinoma. Science 2018, 359, 801–806. [Google Scholar] [CrossRef] [Green Version]
- Joseph, R.W.; Kapur, P.; Serie, D.J.; Parasramka, M.; Ho, T.H.; Cheville, J.C.; Frenkel, E.; Parker, A.S.; Brugarolas, J. Clear Cell Renal Cell Carcinoma Subtypes Identified by BAP1 and PBRM1 Expression. J. Urol. 2016, 195, 180–187. [Google Scholar] [CrossRef] [Green Version]
- Bielecka, Z.F.; Czarnecka, A.M.; Szczylik, C. Genomic Analysis as the First Step toward Personalized Treatment in Renal Cell Carcinoma. Front Oncol. 2014, 4, 194. [Google Scholar] [CrossRef] [Green Version]
- Hakimi, A.A.; Ostrovnaya, I.; Reva, B.; Schultz, N.; Chen, Y.B.; Gonen, M.; Liu, H.; Takeda, S.; Voss, M.H.; Tickoo, S.K.; et al. Adverse outcomes in clear cell renal cell carcinoma with mutations of 3p21 epigenetic regulators BAP1 and SETD2: A report by MSKCC and the KIRC TCGA research network. Clin. Cancer Res. 2013, 19, 3259–3267. [Google Scholar] [CrossRef] [Green Version]
- Pena-Llopis, S.; Vega-Rubin-de-Celis, S.; Liao, A.; Leng, N.; Pavia-Jimenez, A.; Wang, S.; Yamasaki, T.; Zhrebker, L.; Sivanand, S.; Spence, P.; et al. BAP1 loss defines a new class of renal cell carcinoma. Nat. Genet. 2012, 44, 751–759. [Google Scholar] [CrossRef]
- Tennenbaum, D.M.; Manley, B.J.; Zabor, E.; Becerra, M.F.; Carlo, M.I.; Casuscelli, J.; Redzematovic, A.; Khan, N.; Arcila, M.E.; Voss, M.H.; et al. Genomic alterations as predictors of survival among patients within a combined cohort with clear cell renal cell carcinoma undergoing cytoreductive nephrectomy. Urol. Oncol. 2017, 35, 532.e7–532.e13. [Google Scholar] [CrossRef]
- Kumar, V.; Gu, Y.; Basu, S.; Berglund, A.; Eschrich, S.A.; Schabath, M.B.; Forster, K.; Aerts, H.J.; Dekker, A.; Fenstermacher, D.; et al. Radiomics: The process and the challenges. Magn. Reson. Imaging 2012, 30, 1234–1248. [Google Scholar] [CrossRef] [PubMed] [Green Version]
- Gillies, R.J.; Kinahan, P.E.; Hricak, H. Radiomics: Images Are More than Pictures, They Are Data. Radiology 2016, 278, 563–577. [Google Scholar] [CrossRef] [PubMed] [Green Version]
- Wang, Z.; Peng, S.; Guo, L.; Xie, H.; Wang, A.; Shang, Z.; Niu, Y. Prognostic and clinicopathological value of PBRM1 expression in renal cell carcinoma. Clin. Chim. Acta 2018, 486, 9–17. [Google Scholar] [CrossRef] [PubMed]
- Lopez, J.I. Intratumor heterogeneity in clear cell renal cell carcinoma: A review for the practicing pathologist. APMIS 2016, 124, 153–159. [Google Scholar] [CrossRef]
- Lopez, J.I.; Angulo, J.C. Pathological Bases and Clinical Impact of Intratumor Heterogeneity in Clear Cell Renal Cell Carcinoma. Curr. Urol. Rep. 2018, 19, 3. [Google Scholar] [CrossRef]
- Duns, G.; Van den Berg, E.; Van Duivenbode, I.; Osinga, J.; Hollema, H.; Hofstra, R.M.; Kok, K. Histone methyltransferase gene SETD2 is a novel tumor suppressor gene in clear cell renal cell carcinoma. Cancer Res. 2010, 70, 4287–4291. [Google Scholar] [CrossRef] [Green Version]
- Brooks, S.A.; Brannon, A.R.; Parker, J.S.; Fisher, J.C.; Sen, O.; Kattan, M.W.; Hakimi, A.A.; Hsieh, J.J.; Choueiri, T.K.; Tamboli, P.; et al. ClearCode34: A prognostic risk predictor for localized clear cell renal cell carcinoma. Eur. Urol. 2014, 66, 77–84. [Google Scholar] [CrossRef] [Green Version]
- Serie, D.J.; Joseph, R.W.; Cheville, J.C.; Ho, T.H.; Parasramka, M.; Hilton, T.; Thompson, R.H.; Leibovich, B.C.; Parker, A.S.; Eckel-Passow, J.E. Clear Cell Type A and B Molecular Subtypes in Metastatic Clear Cell Renal Cell Carcinoma: Tumor Heterogeneity and Aggressiveness. Eur. Urol. 2017, 71, 979–985. [Google Scholar] [CrossRef]
- Tang, K.; Xu, H. Prognostic value of meta-signature miRNAs in renal cell carcinoma: An integrated miRNA expression profiling analysis. Sci. Rep. 2015, 5, 10272. [Google Scholar] [CrossRef] [Green Version]
- Pourmir, I.; Noel, J.; Simonaggio, A.; Oudard, S.; Vano, Y.A. Update on the most promising biomarkers of response to immune checkpoint inhibitors in clear cell renal cell carcinoma. World J. Urol. 2021, 39, 1377–1385. [Google Scholar] [CrossRef]
- Quail, D.F.; Joyce, J.A. Microenvironmental regulation of tumor progression and metastasis. Nat. Med. 2013, 19, 1423–1437. [Google Scholar] [CrossRef] [PubMed]
- Rappold, P.M.; Silagy, A.W.; Kotecha, R.R.; Hakimi, A.A. Immune checkpoint blockade in renal cell carcinoma. J. Surg. Oncol. 2021, 123, 739–750. [Google Scholar] [CrossRef] [PubMed]
- Rijnders, M.; De Wit, R.; Boormans, J.L.; Lolkema, M.P.J.; Van der Veldt, A.A.M. Systematic Review of Immune Checkpoint Inhibition in Urological Cancers. Eur. Urol. 2017, 72, 411–423. [Google Scholar] [CrossRef] [PubMed]
- Berenguer, R.; Pastor-Juan, M.D.R.; Canales-Vazquez, J.; Castro-Garcia, M.; Villas, M.V.; Mansilla Legorburo, F.; Sabater, S. Radiomics of CT Features May Be Nonreproducible and Redundant: Influence of CT Acquisition Parameters. Radiology 2018, 288, 407–415. [Google Scholar] [CrossRef] [PubMed] [Green Version]
- Zwanenburg, A.; Vallieres, M.; Abdalah, M.A.; Aerts, H.; Andrearczyk, V.; Apte, A.; Ashrafinia, S.; Bakas, S.; Beukinga, R.J.; Boellaard, R.; et al. The Image Biomarker Standardization Initiative: Standardized Quantitative Radiomics for High-Throughput Image-based Phenotyping. Radiology 2020, 295, 328–338. [Google Scholar] [CrossRef] [PubMed] [Green Version]

| Author and Year | Imaging Modality | Primary Outcome of Interest | Machine Learning Algorithm | Summary of Results | Notes |
|---|---|---|---|---|---|
| Karlo et al. (2014) [20] | Multiphase CT | Investigate association between CT features of ccRCC and mutations in VHL, PBRM1, SETD2, KDM5C, or BAP1 | N/A—Development of a predictive model was not intended | Mutations of VHL were significantly associated with well-defined tumor margins, nodular tumor enhancement, and gross appearance of intratumoral vascularity. Mutations of KDM5C and BAP1 were significantly associated with evidence of renal vein invasion. Mutations of SETD2, KDM5C, and BAP1 were absent in multicystic clear cell RCC; mutations of VHL and PBRM1 were significantly more common among solid clear cell RCC | Retrospective review of institutional cohort of 233 patients with ccRCC and known mutation status for genes of interest. |
| Shinagare et al. (2015) [21] | Multiphase CT and MRI | Investigate association between CT/MRI features of ccRCC and mutations in VHL, BAP1, PBRM1, SETD2, KDM5C, and MUC4 | N/A—Development of a predictive model was not intended | Retrospective review of 103 patients with CT and/or MRI images; majority (81) were CT-only. | |
| Chen et al. (2018) [22] | Multiphase CT | Create a ML model to differentiate ccRCC tumors by radiomic features reflective of genetic mutation profile (VHL, PBRM1, BAP1) | Multi-classifier multi-objective (MO) and MO optimization algorithm | Model AUC ≥ 0.86, sensitivity ≥ 0.75, and specificity ≥ 0.80 | Used a relatively small (57 patients) institutional cohort for training and validation. The model was designed to predict multiple rather than single outcome (mutation). |
| Li et al. (2019) [23] | Multiphase CT | Create a ML model to differentiate ccRCC from non-ccRCC tumors by radiomic features | Random forest (RF) and minimum redundancy maximum relevance (mRMR) | Model AUC of 0.949 and an accuracy of 92.9% vs. an AUC of 0.851 and an accuracy of 81.2% for the RF and mRMR models, respectively | Used a large (255 patients) institutional cohort for training and validation. Secondary outcome was correlation of predictive features with VHL mutational status, with false discovery rate p-value < 0.05. |
| Kocack et al. (2019) [24] | Multiphase CT | Create a ML model to differentiate ccRCC tumors by radiomic features reflective of PRBM1 mutation status | Artificial neural network (ANN) and RF algorithms | Model accuracy of 88.2% (AUC = 0.925) vs. 95.0% (AUC = 0.987) for the ANN vs. RF models | Used only 45 patient studies from the TCGA-KIRC cohort for training the model (29 PRBM1-unmuated, 16 PRBM1-mutated). |
| Kocack et al. (2020) [25] | Multiphase CT | Create a ML model to differentiate ccRCC tumors by radiomic features reflective of BAP1 mutation status | RF algorithm | Model specificity of 78.8% and precision of 81% for presence and absence of BAP1 mutations, respectively | Used 65 patients from TCGA-KIRC for training the model (13 with and 52 without BAP1 mutation). |
| Feng et al. (2020) [26] | Multiphase CT | Create a ML model to differentiate ccRCC tumors by radiomic features reflective of BAP1 mutation status | RF algorithm | Model AUC = 0.77, sensitivity of 0.72, specificity of 0.87, and precision of 0.65 | Used 56 patients (9 BAP1-mutated, 45 BAP1-unmutated) TCGA-KIRC for training the model. |
| Ghosh et al. (2015) [27] | Multiphase CT | Create a ML model to differentiate ccRCC tumors by radiomic features reflective of BAP1 mutation status | RF algorithm | AUCs of 0.66, 0.62, 0.71, and 0.52 for the non-contrast, cortico-medullary, nephrographic, and excretory phases, respectively | Used TCGA-KIRC for training and validation cohorts (78 patients). Developed separate classifiers for BAP1 in the non-contrast, cortico-medullary, nephrographic, and excretory phases. Utilized 3D feature extraction to evaluate intra-tumoral heterogeneity. |
| Bowen et al. (2019) [7] | Multiphase CT | Describe radiomic features associated of molecular TCGA subtypes (m1–m4) | N/A—Development of a predictive model was not intended | The m1 subgroup had well-defined tumor margins (vs. ill-defined, OR = 2.104; CI 1.024–4.322). The m3 subgroup was less frequently associated with well-defined tumor margins (OR = 0.421; CI 0.212–0.834); more collecting system invasion (OR = 2.164; CI 1.090–4.294) and renal vein invasion (OR 2.120; CI 1.078–4.168). There were no significant CT findings with the m2 or m4 subgroups | TCGA cohort was used for this assessment. |
| Marigliano et al. (2019) [28] | Multiphase CT | Describe radiomic features associated with miRNA expression | N/A—Development of a predictive model was not intended | There were no significantly associated texture-specific features with expression of any of the evaluated miRNAs | Pilot study using small institutional cohort of 20 patients. |
| Yin et al. (2018) [29] | PET and MRI | Develop a combined PET/MRI model + other features to predict ccRCC molecular subtype (ccA vs. ccB) | ML was not used to build the predictive model | Correct classification rate was 87% vs. 95.6% using the radiomic signature alone vs. the combined signature (radiomic signature + several clinical features) | Very small training/test subset (23 specimens from 8 primary ccRCC patients). Sparse partial least squares discriminant analysis (SPLS-DA) was used to build their predictive models. |
| Cen et al. (2019) [30] | Multiphase CT | Identify CT imaging features predictive of high RUNX3 methylation levels | N/A—Development of a predictive model was not intended | Well vs. poorly defined margin status (OR 2.685; CI 1.057–6.820), and present/absent intratumoral vascularity (OR 3.286; CI 1.367–7.898) were all significant independent predictors of high RUNX3 methylation on multivariate regression | |
| Huang et al. (2021) [31] | Multiphase CT | Development of a radiogenomic model to predict overall survival in ccRCC using gene expression data | LASSO-COX regression to identify a prognostic radiomic signature, then RF to combine the radiomic and prognostic gene signatures | The radiogenomic model outperformed the radiomic features-only model at predicting overall survival at 1, 3 and 5 years (average AUCs for 1-, 3-, and 5-year survival of 0.814 vs. 0.837, 0.74 vs. 0.806, and 0.689 vs. 0.751, respectively) | Trained model using TCGA-KIRC dataset (205 patients). |
| Jamshidi et al. (2015) [32] | Multiphase CT | Development of a radiogenomic risk score (RSS) to predict gene expression results from a microarray assay | None—Multivariate regression was used to identify features most predictive of variation in supervised principal component (SPC) gene expression analysis | Significant correlation of RSS with the microarray gene signature (R = 0.57, p < 0.001; classification accuracy 70.1%, p < 0.001) Significant correlation of RSS with disease-specific survival: log-rank p < 0.001 | RSS was developed from data in a 70-patient cohort, with validation in a separate cohort (70 for validation of the signature’s correlation with micro-array results, 77 for correlation of signature with disease-free survival). |
| Jamshidi et al. (2016) [33] | Multiphase CT | Correlation of RSS developed in above study with radiologic progression free survival (rPFS) in a cohort of 41 mRCC patients undergoing CRN and pre-surgical bevacizumab | None—Purpose of study was to compare rPFS in the low- vs. high-RSS cohorts | Patients with a low RSS vs. high RSS had longer rPFS (25 months vs. 6 months; p = 0.005) and OS (37 months vs. 25 months; p = 0.03) | |
| Udayakumar et al. (2021) [34] | Dynamic contrast-enhanced MRI | Correlation of enhancement scores for tumors with their TME expression signature | None | Enhancement-high tumors exhibited upregulated angiogenesis-related TME gene signatures, while enhancement-low areas exhibited higher levels of T-cell infiltration signatures. Better PFS with TKI in the enhancement-high compared to enhancement-low tumor groups (adjusted p < 0.0001), but no significant difference in PFS with IO between the two groups | Cutoff for determining tumors to have high or low enhancement/angiogenesis/infiltration was relative to the median value of the distribution of these values in the training cohort. Authors did not utilize any previously published TME signatures for angiogenesis or immune infiltration. |
| Gene Mutation | Frequency in ccRCC (%) | Protein Function | Clinical and Prognostic Implications | Associated Features on CT Imaging |
|---|---|---|---|---|
| VHL | >90% | Tumor Suppressor | None | Defined tumor margins, nodular tumor enhancement, intratumor vascularity |
| PRBM1 | 40–50% | Tumor Suppressor | Inconsistent clinical significance in localized ccRCC; may be predictive of better prognosis and response to immune checkpoint inhibitors in metastatic ccRCC | Solid ccRCC |
| BAP1 | 10–15% | Tumor Suppressor | Poor prognosis | Renal vein invasion, ill-defined tumor margins, and intratumor calcificationsAbsent in multicystic ccRCC |
| SET2D | 10–15% | Tumor Suppressor | Poor prognosis | Inconsistent Absent in multicystic ccRCC |
| KDM5C | 6–7% | Tumor Suppressor | Good prognosis | Renal vein invasion Absent in multicystic ccRCC |
Publisher’s Note: MDPI stays neutral with regard to jurisdictional claims in published maps and institutional affiliations. |
© 2022 by the authors. Licensee MDPI, Basel, Switzerland. This article is an open access article distributed under the terms and conditions of the Creative Commons Attribution (CC BY) license (https://creativecommons.org/licenses/by/4.0/).
Share and Cite
Khaleel, S.; Katims, A.; Cumarasamy, S.; Rosenzweig, S.; Attalla, K.; Hakimi, A.A.; Mehrazin, R. Radiogenomics in Clear Cell Renal Cell Carcinoma: A Review of the Current Status and Future Directions. Cancers 2022, 14, 2085. https://doi.org/10.3390/cancers14092085
Khaleel S, Katims A, Cumarasamy S, Rosenzweig S, Attalla K, Hakimi AA, Mehrazin R. Radiogenomics in Clear Cell Renal Cell Carcinoma: A Review of the Current Status and Future Directions. Cancers. 2022; 14(9):2085. https://doi.org/10.3390/cancers14092085
Chicago/Turabian StyleKhaleel, Sari, Andrew Katims, Shivaram Cumarasamy, Shoshana Rosenzweig, Kyrollis Attalla, A Ari Hakimi, and Reza Mehrazin. 2022. "Radiogenomics in Clear Cell Renal Cell Carcinoma: A Review of the Current Status and Future Directions" Cancers 14, no. 9: 2085. https://doi.org/10.3390/cancers14092085
APA StyleKhaleel, S., Katims, A., Cumarasamy, S., Rosenzweig, S., Attalla, K., Hakimi, A. A., & Mehrazin, R. (2022). Radiogenomics in Clear Cell Renal Cell Carcinoma: A Review of the Current Status and Future Directions. Cancers, 14(9), 2085. https://doi.org/10.3390/cancers14092085