
Folic Acid Treatment Directly Influences the Genetic and Epigenetic Regulation along with the Associated Cellular Maintenance Processes of HT-29 and SW480 Colorectal Cancer Cell Lines


 , ,
, ,  , and
, and 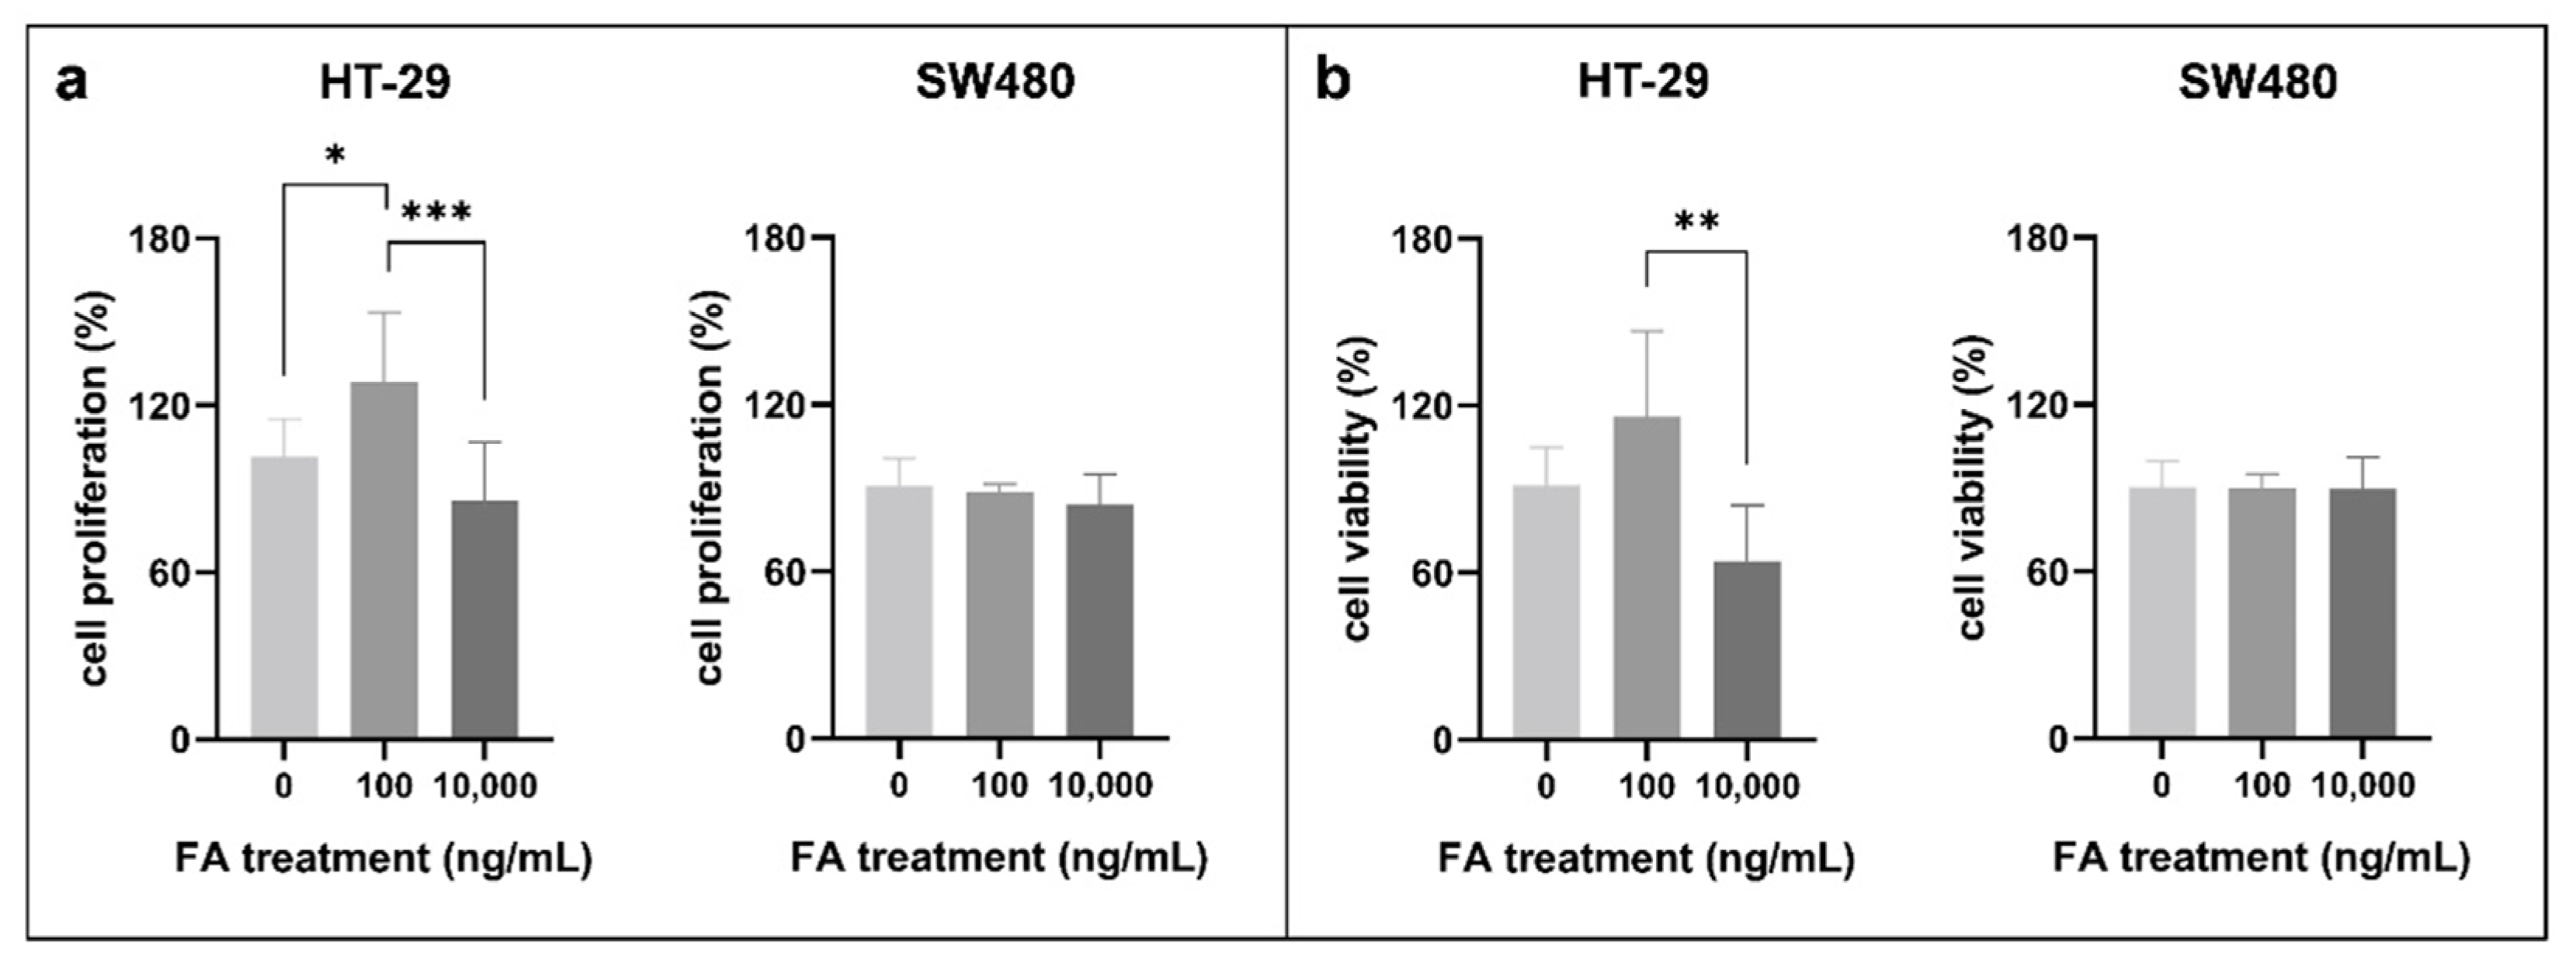
Abstract
:Simple Summary
Abstract
1. Introduction
2. Materials and Methods
2.1. Cell Cultures
2.2. Cell Viability and Proliferation Analysis with alamarBlue and Sulforhodamine B Assays
2.3. Cell Cycle Analysis with Flow Cytometry
2.4. Genomic Stability Detection with Micronucleus Scoring
2.5. Genomic Stability Detection with Comet Assay
2.6. DNA Methylation Analysis with LINE-1 Pyrosequencing
2.7. DNA Methylation Analysis with Reduced Representation Bisulfite Sequencing
2.8. Whole Genomic Expression Analysis with Microarray
3. Results
3.1. Effect of Folic Acid Treatment on Cell Proliferation, Cell Viability, and Cell Cycle

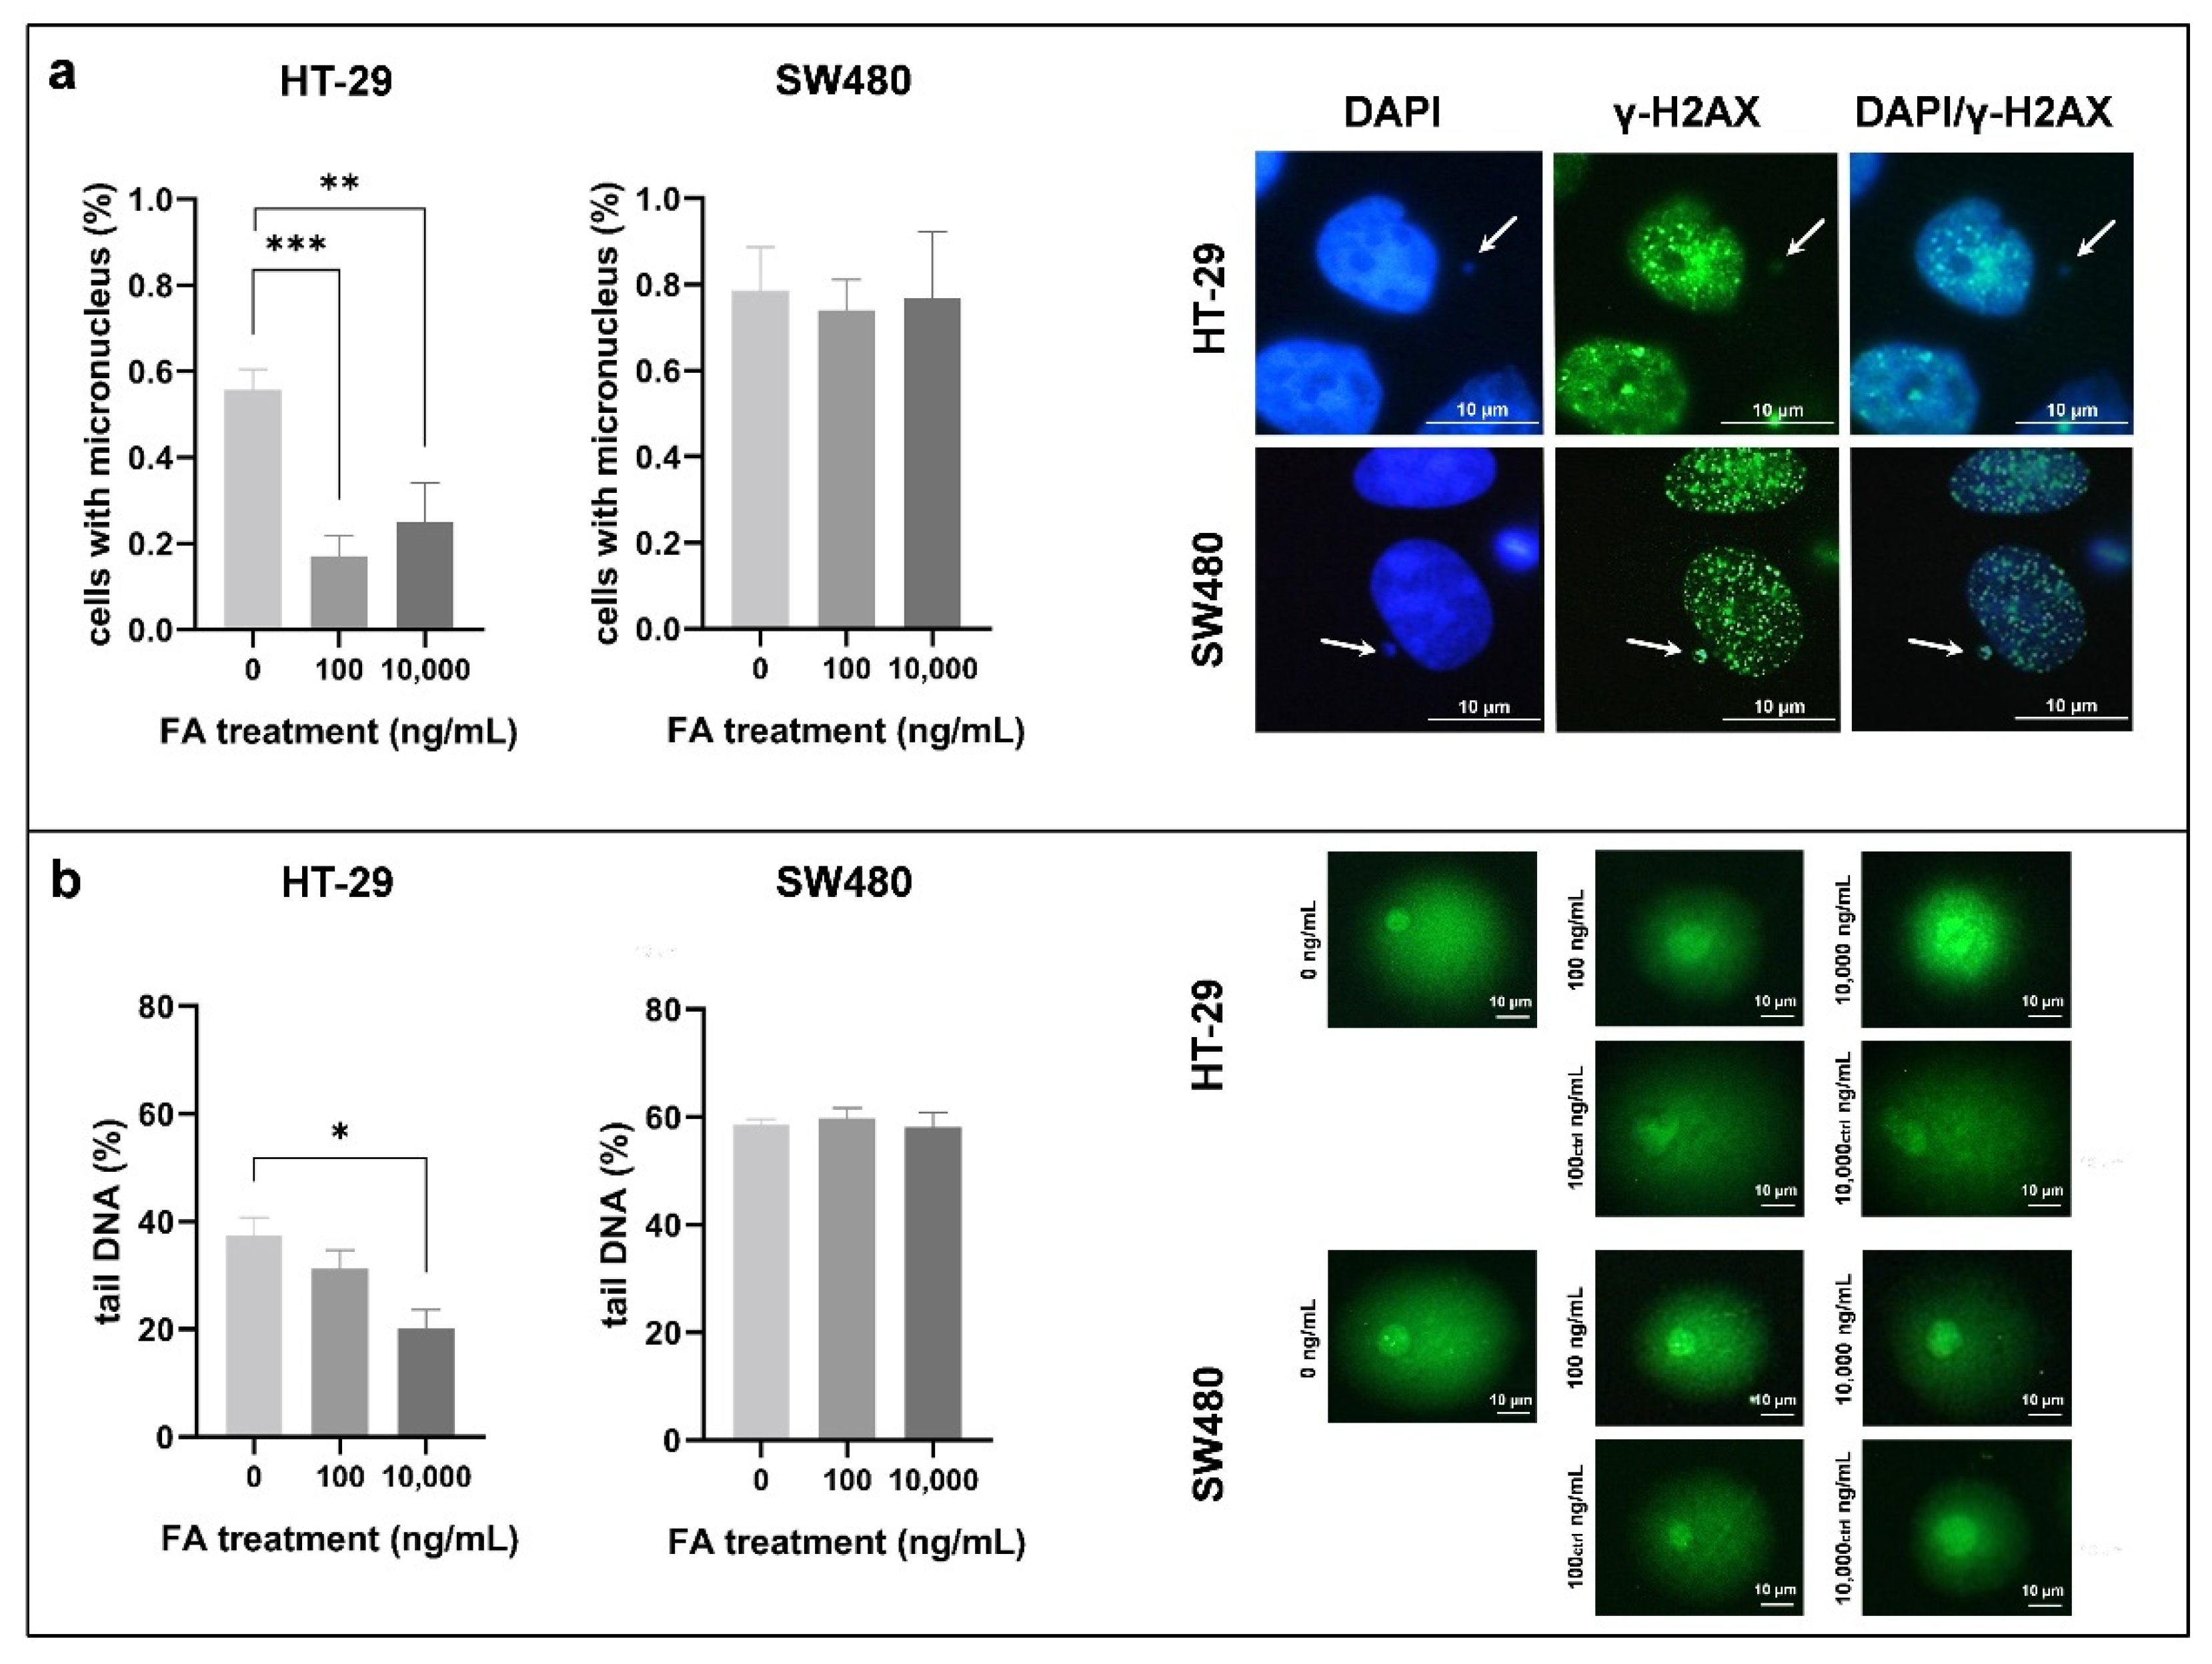
3.2. Effect of Folic Acid Treatment on Genomic Stability

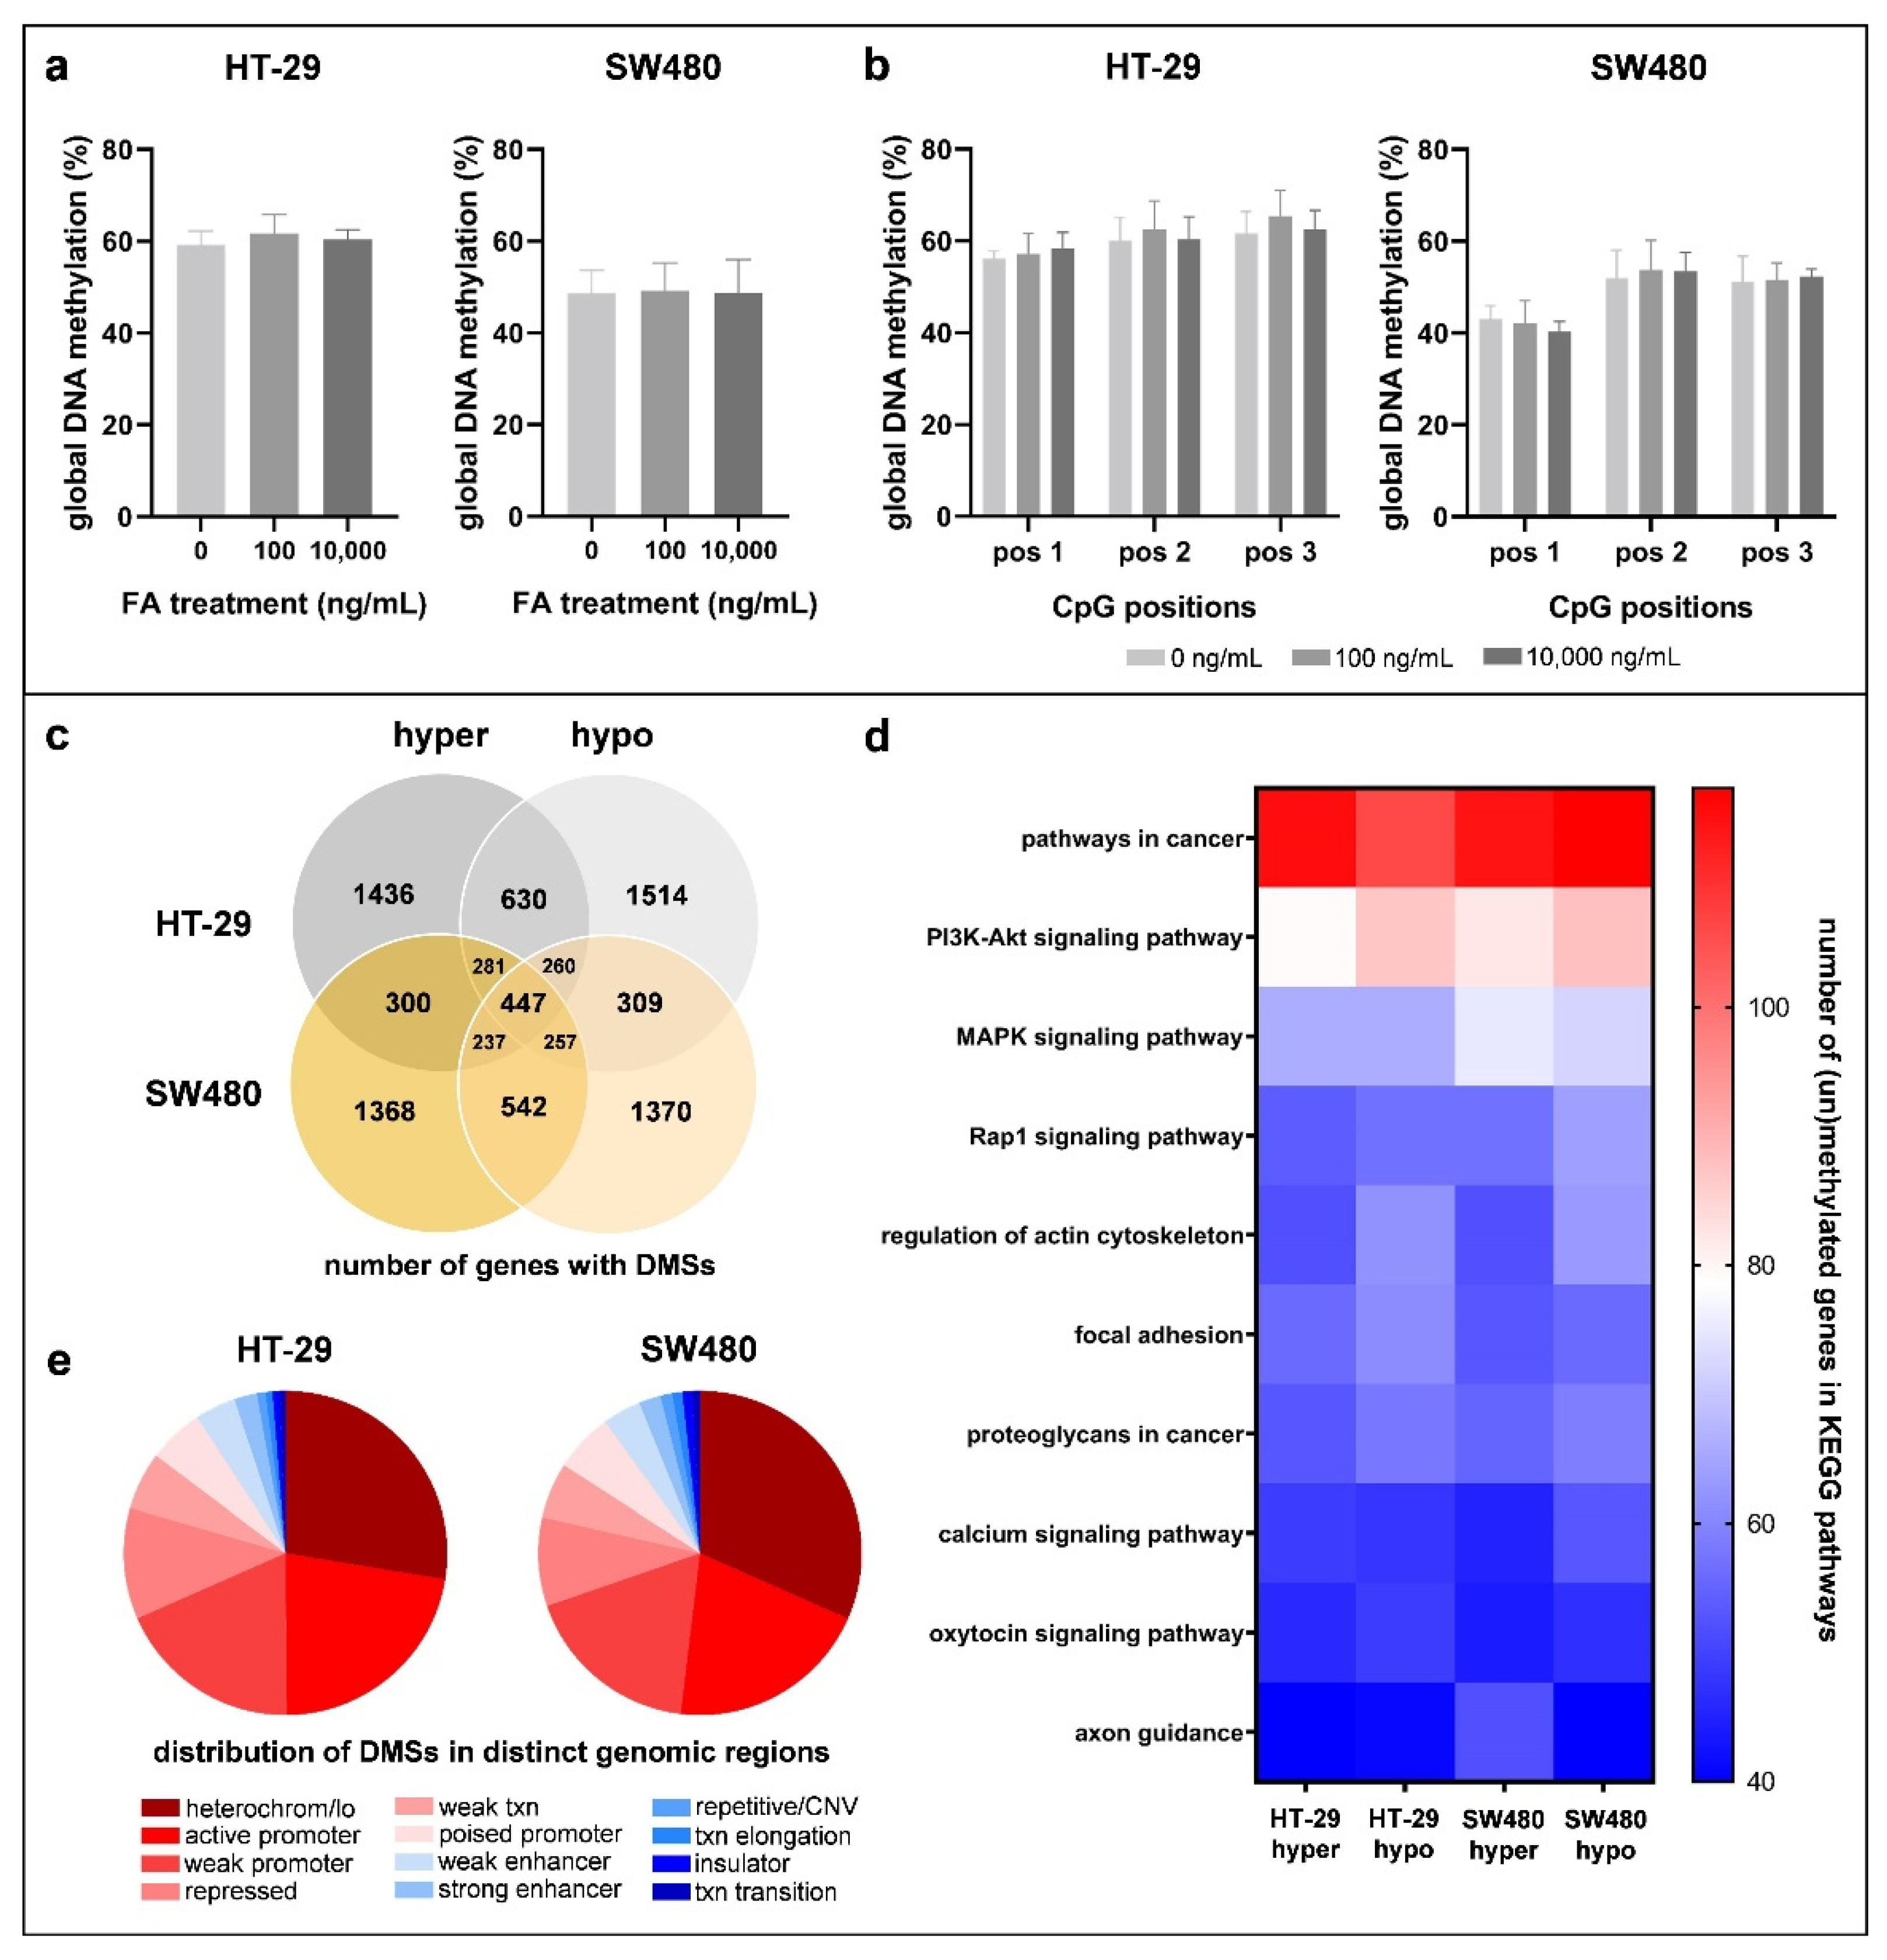
3.3. Effect of Folic Acid Treatment on DNA Methylation
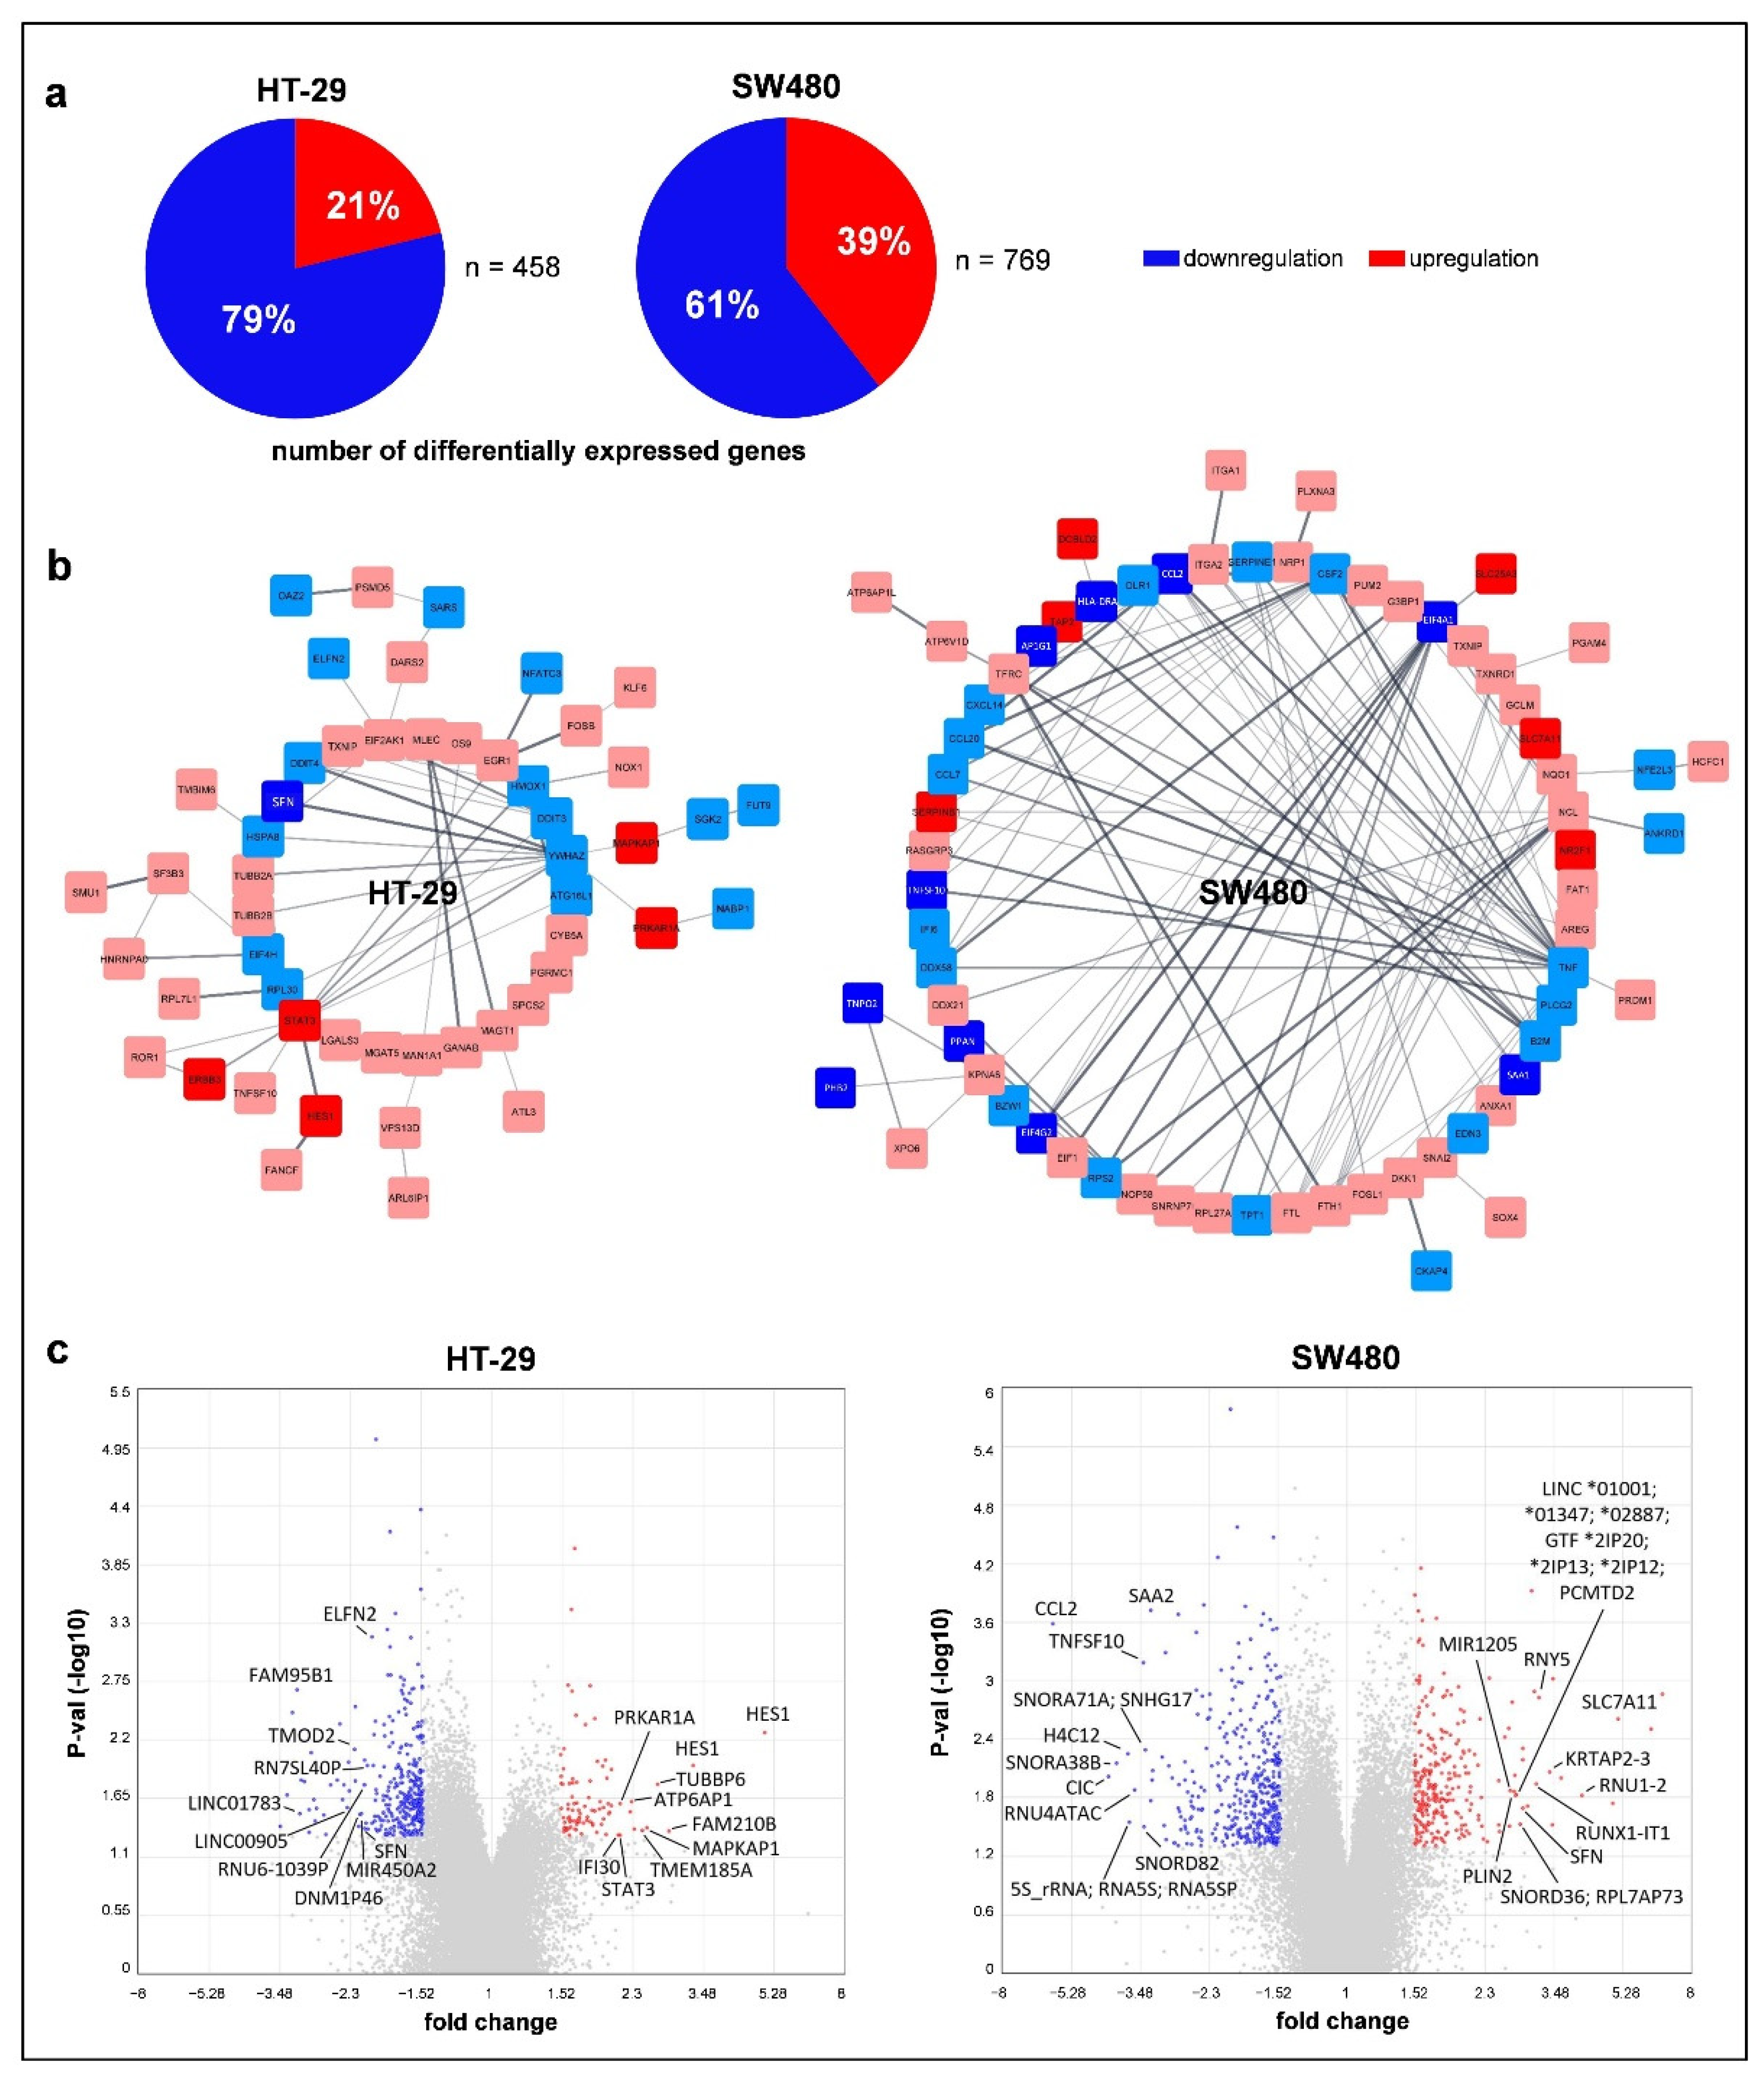
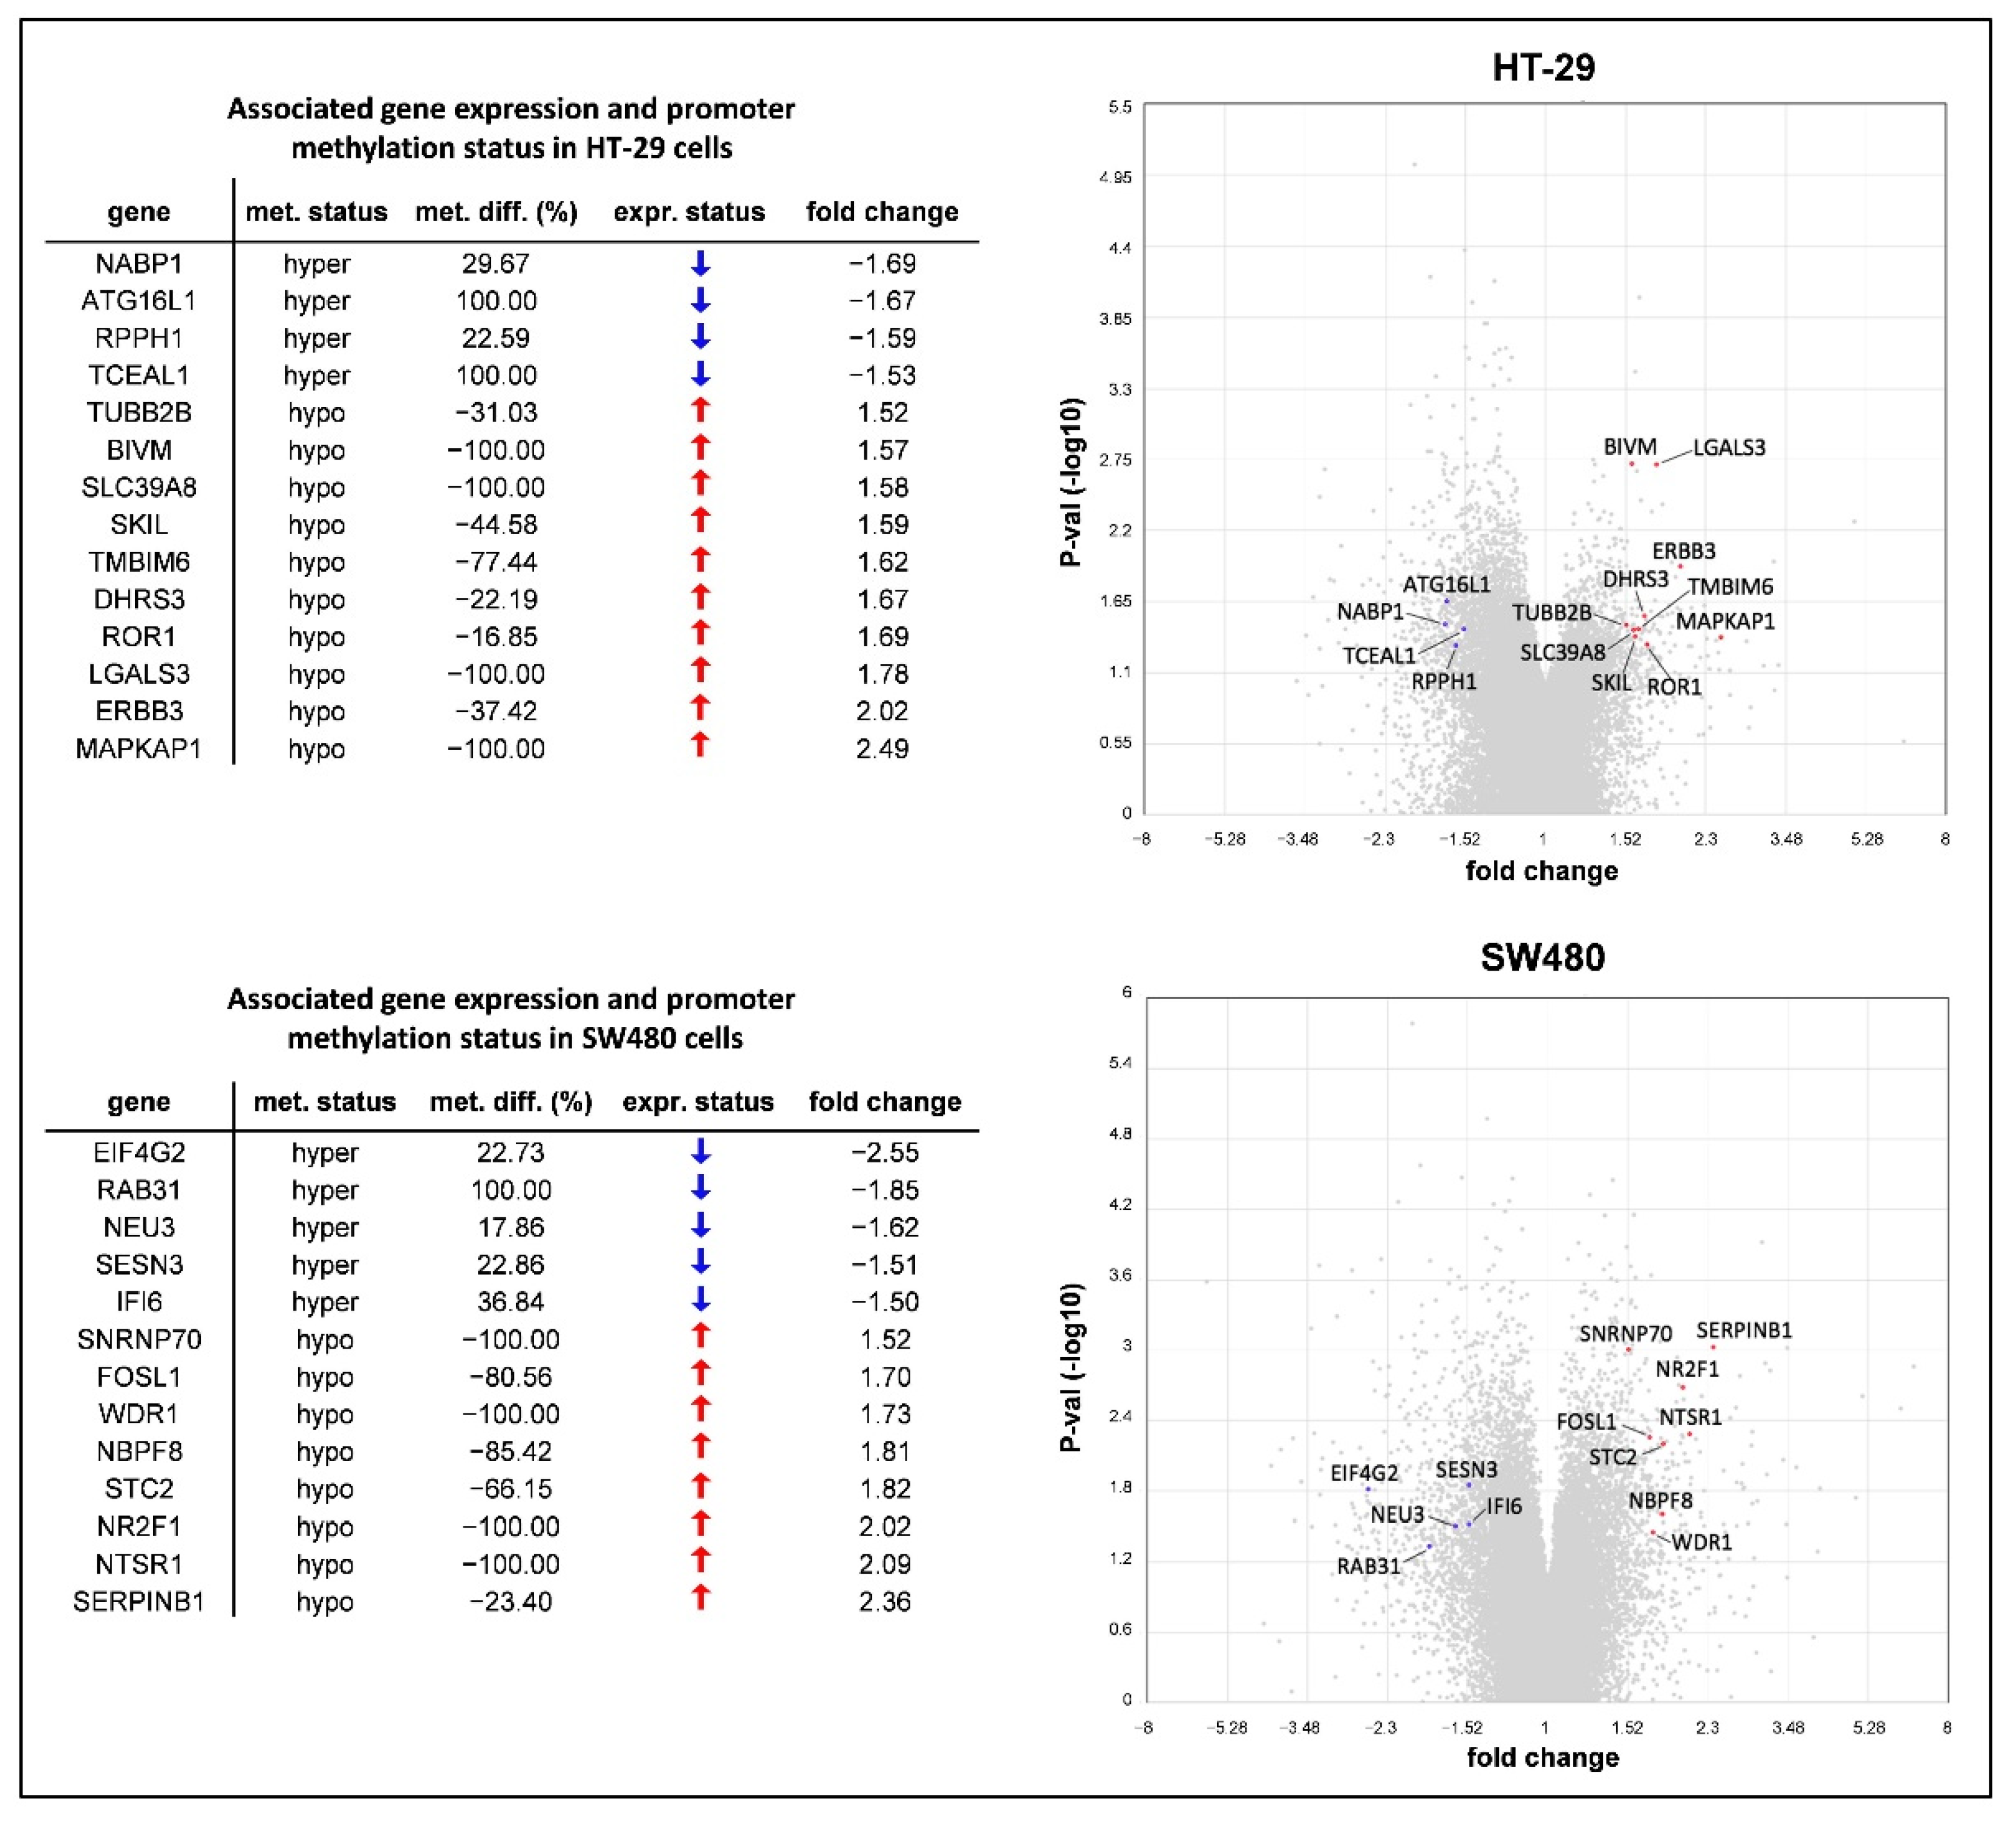
3.4. Effect of Folic Acid Treatment on Gene Expression
4. Discussion
5. Conclusions
Supplementary Materials
Author Contributions
Funding
Institutional Review Board Statement
Informed Consent Statement
Data Availability Statement
Acknowledgments
Conflicts of Interest
References
- Kim, Y.I. Current Status of Folic Acid Supplementation on Colorectal Cancer Prevention. Curr. Pharmacol. Rep. 2016, 2, 21–33. [Google Scholar] [CrossRef] [Green Version]
- Kim, Y.I. Folate and colorectal cancer: An evidence-based critical review. Mol. Nutr. Food Res. 2007, 51, 267–292. [Google Scholar] [CrossRef] [PubMed]
- Ulrich, C.M.; Potter, J.D. Folate supplementation: Too much of a good thing? Cancer Epidemiol. Biomarkers Prev. 2006, 15, 189–193. [Google Scholar] [CrossRef] [PubMed]
- Farias, N.; Ho, N.; Butler, S.; Delaney, L.; Morrison, J.; Shahrzad, S.; Coomber, B.L. The effects of folic acid on global DNA methylation and colonosphere formation in colon cancer cell lines. J. Nutr. Biochem. 2015, 26, 818–826. [Google Scholar] [CrossRef] [PubMed] [Green Version]
- Pufulete, M.; Emery, P.W.; Sanders, T.A. Folate, DNA methylation and colo-rectal cancer. Proc. Nutr. Soc. 2003, 62, 437–445. [Google Scholar] [CrossRef] [PubMed]
- Price, R.J.; Lillycrop, K.A.; Burdge, G.C. Folic acid induces cell type-specific changes in the transcriptome of breast cancer cell lines: A proof-of-concept study. J. Nutr. Sci. 2016, 5, e17. [Google Scholar] [CrossRef] [Green Version]
- Kuo, C.T.; Chang, C.; Lee, W.S. Folic acid inhibits COLO-205 colon cancer cell proliferation through activating the FRα/c-SRC/ERK1/2/NFκB/TP53 pathway: In vitro and in vivo studies. Sci. Rep. 2015, 5, 11187. [Google Scholar] [CrossRef] [PubMed] [Green Version]
- Pellis, L.; Dommels, Y.; Venema, D.; Polanen, A.; Lips, E.; Baykus, H.; Kok, F.; Kampman, E.; Keijer, J. High folic acid increases cell turnover and lowers differentiation and iron content in human HT29 colon cancer cells. Br. J. Nutr. 2008, 99, 703–708. [Google Scholar] [CrossRef] [PubMed] [Green Version]
- McCabe, J.; Chang, S.; Hajibandeh, J.; Tran, M.D.; Meeder, C.A.; Sharma, K.; Nguyen, D.H.; Moody, M.; Keiserman, M.A.; Bergman, C.J.; et al. Folate supplementation induces differential dose-dependent modulation of proliferative phenotypes among cancerous and noncancerous oral cell lines in vitro. J. Diet. Suppl. 2010, 7, 325–340. [Google Scholar] [CrossRef] [PubMed]
- Farias, N. The Role of Folic Acid in Maintaining Colorectal Cancer Cell DNA Methylation Patterns and Cancer Stem Cell Phenotype In Vitro. Master’s Thesis, University of Guelph, Guelph, ON, Canada, 2013. [Google Scholar]
- Kim, Y.I. Role of folate in colon cancer development and progression. J. Nutr. 2003, 133, 3731S–3739S. [Google Scholar] [CrossRef] [PubMed]
- Kim, Y.I. Folate and carcinogenesis: Evidence, mechanisms, and implications. J. Nutr. Biochem. 1999, 10, 66–88. [Google Scholar] [CrossRef]
- Richardson, R.B.; Allan, D.S.; Le, Y. Greater organ involution in highly proliferative tissues associated with the early onset and acceleration of ageing in humans. Exp. Gerontol. 2014, 55, 80–91. [Google Scholar] [CrossRef] [PubMed] [Green Version]
- Luebeck, E.G.; Moolgavkar, S.H.; Liu, A.Y.; Boynton, A.; Ulrich, C.M. Does folic acid supplementation prevent or promote colorectal cancer? Results from model-based predictions. Cancer Epidemiol. Biomark. Prev. 2008, 17, 1360–1367. [Google Scholar] [CrossRef] [PubMed] [Green Version]
- Kim, Y.I. Folate: A magic bullet or a double edged sword for colorectal cancer prevention? Gut 2006, 55, 1387–1389. [Google Scholar] [CrossRef] [PubMed] [Green Version]
- Vodenkova, S.; Buchler, T.; Cervena, K.; Veskrnova, V.; Vodicka, P.; Vymetalkova, V. 5-fluorouracil and other fluoropyrimidines in colorectal cancer: Past, present and future. Pharmacol. Ther. 2020, 206, 107447. [Google Scholar] [CrossRef] [PubMed]
- Nielson, C.M.; Bylsma, L.C.; Fryzek, J.P.; Saad, H.A.; Crawford, J. Relative Dose Intensity of Chemotherapy and Survival in Patients with Advanced Stage Solid Tumor Cancer: A Systematic Review and Meta-Analysis. Oncologist 2021, 26, e1609–e1618. [Google Scholar] [CrossRef] [PubMed]
- Pino, M.S.; Chung, D.C. The chromosomal instability pathway in colon cancer. Gastroenterology 2010, 138, 2059–2072. [Google Scholar] [CrossRef] [PubMed] [Green Version]
- Berg, K.C.G.; Eide, P.W.; Eilertsen, I.A.; Johannessen, B.; Bruun, J.; Danielsen, S.A.; Bjørnslett, M.; Meza-Zepeda, L.A.; Eknæs, M.; Lind, G.E.; et al. Multi-omics of 34 colorectal cancer cell lines—A resource for biomedical studies. Mol. Cancer 2017, 16, 116. [Google Scholar] [CrossRef]
- Menter, D.G.; Davis, J.S.; Broom, B.M.; Overman, M.J.; Morris, J.; Kopetz, S. Back to the Colorectal Cancer Consensus Molecular Subtype Future. Curr. Gastroenterol. Rep. 2019, 21, 5. [Google Scholar] [CrossRef]
- Ogino, S.; Cantor, M.; Kawasaki, T.; Brahmandam, M.; Kirkner, G.J.; Weisenberger, D.J.; Campan, M.; Laird, P.W.; Loda, M.; Fuchs, C.S. CpG island methylator phenotype (CIMP) of colorectal cancer is best characterised by quantitative DNA methylation analysis and prospective cohort studies. Gut 2006, 55, 1000–1006. [Google Scholar] [CrossRef] [PubMed]
- Zsigrai, S.; Kalmár, A.; Nagy, Z.B.; Barták, B.K.; Valcz, G.; Szigeti, K.A.; Galamb, O.; Dankó, T.; Sebestyén, A.; Barna, G.; et al. S-Adenosylmethionine Treatment of Colorectal Cancer Cell Lines Alters DNA Methylation, DNA Repair and Tumor Progression-Related Gene Expression. Cells 2020, 9, 1864. [Google Scholar] [CrossRef]
- Pietrzik, K.; Bailey, L.; Shane, B. Folic acid and L-5-methyltetrahydrofolate: Comparison of clinical pharmacokinetics and pharmacodynamics. Clin. Pharmacokinet. 2010, 49, 535–548. [Google Scholar] [CrossRef] [PubMed]
- Moll, S.; Varga, E.A. Homocysteine and MTHFR Mutations. Circulation 2015, 132, e6–e9. [Google Scholar] [CrossRef] [PubMed] [Green Version]
- Zetterberg, H.; Regland, B.; Palmér, M.; Ricksten, A.; Palmqvist, L.; Rymo, L.; Arvanitis, D.A.; Spandidos, D.A.; Blennow, K. Increased frequency of combined methylenetetrahydrofolate reductase C677T and A1298C mutated alleles in spontaneously aborted embryos. Eur. J. Hum. Genet. 2002, 10, 113–118. [Google Scholar] [CrossRef]
- Vidmar Golja, M.; Šmid, A.; Karas Kuželički, N.; Trontelj, J.; Geršak, K.; Mlinarič-Raščan, I. Folate Insufficiency Due to MTHFR Deficiency Is Bypassed by 5-Methyltetrahydrofolate. J. Clin. Med. 2020, 9, 2836. [Google Scholar] [CrossRef] [PubMed]
- Valcz, G.; Buzás, E.I.; Kittel, Á.; Krenács, T.; Visnovitz, T.; Spisák, S.; Török, G.; Homolya, L.; Zsigrai, S.; Kiszler, G.; et al. En bloc release of MVB-like small extracellular vesicle clusters by colorectal carcinoma cells. J. Extracell. Vesicles 2019, 8, 1596668. [Google Scholar] [CrossRef] [PubMed] [Green Version]
- Ribas, L.E.; Baravalle, M.E.; Gasser, F.B.; Renna, M.S.; Addona, S.; Ortega, H.H.; Savino, G.H.; Van de Velde, F.; Hein, G.J. Extraction of phenolic compounds from the shells of pecan nuts with cytotoxic activity through apoptosis against the colon cancer cell line HT-29. J. Food Sci. 2021, 86, 5409–5423. [Google Scholar] [CrossRef] [PubMed]
- El Hosry, L.; Di Giorgio, C.; Birer, C.; Habib, J.; Tueni, M.; Bun, S.S.; Herbette, G.; De Meo, M.; Ollivier, E.; Elias, R. In vitro cytotoxic and anticlastogenic activities of saxifragifolin B and cyclamin isolated from Cyclamen persicum and Cyclamen libanoticum. Pharm. Biol. 2014, 52, 1134–1140. [Google Scholar] [CrossRef] [PubMed] [Green Version]
- Wingett, S.W.; Andrews, S. FastQ Screen: A tool for multi-genome mapping and quality control. F1000Research 2018, 7, 1338. [Google Scholar] [CrossRef] [PubMed]
- Krueger, F.; Andrews, S.R. Bismark: A flexible aligner and methylation caller for Bisulfite-Seq applications. Bioinformatics 2011, 27, 1571–1572. [Google Scholar] [CrossRef]
- Akalin, A.; Kormaksson, M.; Li, S.; Garrett-Bakelman, F.E.; Figueroa, M.E.; Melnick, A.; Mason, C.E. MethylKit: A comprehensive R package for the analysis of genome-wide DNA methylation profiles. Genome Biol. 2012, 13, R87. [Google Scholar] [CrossRef] [Green Version]
- Lee, B.T.; Barber, G.P.; Benet-Pagès, A.; Casper, J.; Clawson, H.; Diekhans, M.; Fischer, C.; Gonzalez, J.N.; Hinrichs, A.S.; Lee, C.M.; et al. The UCSC Genome Browser database: 2022 update. Nucleic Acids Res. 2022, 50, D1115–D1122. [Google Scholar] [CrossRef] [PubMed]
- Nagy, Z.B.; Wichmann, B.; Kalmár, A.; Galamb, O.; Barták, B.K.; Spisák, S.; Tulassay, Z.; Molnár, B. Colorectal adenoma and carcinoma specific miRNA profiles in biopsy and their expression in plasma specimens. Clin. Epigenet. 2017, 9, 22. [Google Scholar] [CrossRef] [Green Version]
- Kalmár, A.; Nagy, Z.B.; Galamb, O.; Csabai, I.; Bodor, A.; Wichmann, B.; Valcz, G.; Barták, B.K.; Tulassay, Z.; Igaz, P.; et al. Genome-wide expression profiling in colorectal cancer focusing on lncRNAs in the adenoma-carcinoma transition. BMC Cancer 2019, 19, 1059. [Google Scholar] [CrossRef]
- Metz, J. Folates in megaloblastic anaemia. Bull. World Health Organ. 1963, 28, 517–529. [Google Scholar]
- Lucock, M. Folic acid: Nutritional biochemistry, molecular biology, and role in disease processes. Mol. Genet. Metab. 2000, 71, 121–138. [Google Scholar] [CrossRef]
- Molloy, A.M.; Kirke, P.N.; Brody, L.C.; Scott, J.M.; Mills, J.L. Effects of folate and vitamin B12 deficiencies during pregnancy on fetal, infant, and child development. Food Nutr. Bull. 2008, 29, S101–S115. [Google Scholar] [CrossRef]
- Hibbard, B.M.; Hibbard, E.D.; Jeffcoate, T.N. Folic acid and reproduction. Acta Obstet. Gynecol Scand. 1965, 44, 375–400. [Google Scholar] [CrossRef]
- Young, S.N. Folate and depression--a neglected problem. J. Psychiatry Neurosci. 2007, 32, 80–82. [Google Scholar] [PubMed]
- Novakovic, P.; Stempak, J.M.; Sohn, K.J.; Kim, Y.I. Effects of folate deficiency on gene expression in the apoptosis and cancer pathways in colon cancer cells. Carcinogenesis 2006, 27, 916–924. [Google Scholar] [CrossRef] [PubMed]
- Zsigrai, S.; Kalmár, A.; Valcz, G.; Szigeti, K.A.; Barták, B.K.; Nagy, Z.B.; Igaz, P.; Tulassay, Z.; Molnár, B. Physiological and pathophysiological significance of vitamin B9. Summary on the occasion of the 30-year introduction of folic acid as a die-tary supplement. Orv. Hetil. 2019, 160, 1087–1096. [Google Scholar] [CrossRef]
- Lin, S.Y.; Lee, W.R.; Su, Y.F.; Hsu, S.P.; Lin, H.C.; Ho, P.Y.; Hou, T.C.; Chou, Y.P.; Kuo, C.T.; Lee, W.S. Folic acid inhibits endothelial cell proliferation through activating the cSrc/ERK 2/NF-κB/p53 pathway mediated by folic acid receptor. Angiogenesis 2012, 15, 671–683. [Google Scholar] [CrossRef] [PubMed]
- Liu, Z.; Jin, X.; Pi, W.; Liu, S. Folic acid inhibits nasopharyngeal cancer cell proliferation and invasion via activation of FRα/ERK1/2/TSLC1 pathway. Biosci. Rep. 2017, 37, BSR20170772. [Google Scholar] [CrossRef] [PubMed] [Green Version]
- Catala, G.N.; Bestwick, C.S.; Russell, W.R.; Tortora, K.; Giovannelli, L.; Moyer, M.P.; Lendoiro, E.; Duthie, S.J. Folate, genomic stability and colon cancer: The use of single cell gel electrophoresis in assessing the impact of folate in vitro, in vivo and in human biomonitoring. Mutat. Res. Genet. Toxicol. Environ. Mutagen. 2019, 843, 73–80. [Google Scholar] [CrossRef] [PubMed]
- Meng, H.; Cao, Y.; Qin, J.; Song, X.; Zhang, Q.; Shi, Y.; Cao, L. DNA methylation, its mediators and genome integrity. Int. J. Biol. Sci. 2015, 11, 604–617. [Google Scholar] [CrossRef] [Green Version]
- Szigeti, K.A.; Galamb, O.; Kalmár, A.; Barták, B.K.; Nagy, Z.B.; Márkus, E.; Igaz, P.; Tulassay, Z.; Molnár, B. Role and alterations of DNA methylation during the aging and cancer. Orv. Hetil. 2018, 159, 3–15. [Google Scholar] [CrossRef] [PubMed] [Green Version]
- Hardy, L.W.; Finer-Moore, J.S.; Montfort, W.R.; Jones, M.O.; Santi, D.V.; Stroud, R.M. Atomic structure of thymidylate synthase: Target for rational drug design. Science 1987, 235, 448–455. [Google Scholar] [CrossRef] [PubMed]
- Hazra, A.; Selhub, J.; Chao, W.H.; Ueland, P.M.; Hunter, D.J.; Baron, J.A. Uracil misincorporation into DNA and folic acid supplementation. Am. J. Clin. Nutr. 2010, 91, 160–165. [Google Scholar] [CrossRef] [PubMed]
- Blount, B.C.; Mack, M.M.; Wehr, C.M.; MacGregor, J.T.; Hiatt, R.A.; Wang, G.; Wickramasinghe, S.N.; Everson, R.B.; Ames, B.N. Folate deficiency causes uracil misincorporation into human DNA and chromosome breakage: Implications for cancer and neuronal damage. Proc. Natl. Acad. Sci. USA 1997, 94, 3290–3295. [Google Scholar] [CrossRef] [Green Version]
- Bailey, L.B.; Gregory, J.F. Folate metabolism and requirements. J. Nutr. 1999, 129, 779–782. [Google Scholar] [CrossRef] [Green Version]
- Kulis, M.; Esteller, M. DNA methylation and cancer. Adv. Genet. 2010, 70, 27–56. [Google Scholar] [PubMed]
- Crider, K.S.; Yang, T.P.; Berry, R.J.; Bailey, L.B. Folate and DNA methylation: A review of molecular mechanisms and the evidence for folate’s role. Adv. Nutr. 2012, 3, 21–38. [Google Scholar] [CrossRef] [PubMed] [Green Version]
- Stempak, J.M.; Sohn, K.J.; Chiang, E.P.; Shane, B.; Kim, Y.I. Cell and stage of transformation-specific effects of folate deficiency on methionine cycle intermediates and DNA methylation in an in vitro model. Carcinogenesis 2005, 26, 981–990. [Google Scholar] [CrossRef] [PubMed]
- Wang, Y.; Sun, Z.; Szyf, M. S-adenosyl-methionine (SAM) alters the transcriptome and methylome and specifically blocks growth and invasiveness of liver cancer cells. Oncotarget 2017, 8, 111866–111881. [Google Scholar] [CrossRef]
- Jiang, N.; Dai, Q.; Su, X.; Fu, J.; Feng, X.; Peng, J. Role of PI3K/AKT pathway in cancer: The framework of malignant behavior. Mol. Biol. Rep. 2020, 47, 4587–4629. [Google Scholar] [CrossRef] [PubMed]
- Zhang, W.; Liu, H. MAPK signal pathways in the regulation of cell proliferation in mammalian cells. Cell Res. 2002, 12, 9–18. [Google Scholar] [CrossRef]
- Zhang, Y.L.; Wang, R.C.; Cheng, K.; Ring, B.Z.; Su, L. Roles of Rap1 signaling in tumor cell migration and invasion. Cancer Biol. Med. 2017, 14, 90–99. [Google Scholar] [PubMed] [Green Version]
- Yamaguchi, H.; Condeelis, J. Regulation of the actin cytoskeleton in cancer cell migration and invasion. Biochim. Biophys. Acta 2007, 1773, 642–652. [Google Scholar] [CrossRef] [PubMed] [Green Version]
- Eke, I.; Cordes, N. Focal adhesion signaling and therapy resistance in cancer. Semin. Cancer Biol. 2015, 31, 65–75. [Google Scholar] [CrossRef] [PubMed]
- Ahrens, T.D.; Bang-Christensen, S.R.; Jørgensen, A.M.; Løppke, C.; Spliid, C.B.; Sand, N.T.; Clausen, T.M.; Salanti, A.; Agerbæk, M.Ø. The Role of Proteoglycans in Cancer Metastasis and Circulating Tumor Cell Analysis. Front. Cell. Dev. Biol. 2020, 8, 749. [Google Scholar] [CrossRef]
- Huang, X.; He, Z.; Jiang, X.; Hou, M.; Tang, Z.; Zhen, X.; Liang, Y.; Ma, J. Folic Acid Represses Hypoxia-Induced Inflammation in THP-1 Cells through Inhibition of the PI3K/Akt/HIF-1α Pathway. PLoS ONE 2016, 11, e0151553. [Google Scholar] [CrossRef] [Green Version]
- Slattery, M.L.; Lundgreen, A.; Wolff, R.K. Dietary influence on MAPK-signaling pathways and risk of colon and rectal cancer. Nutr. Cancer 2013, 65, 729–738. [Google Scholar] [CrossRef] [Green Version]
- Ollikainen, M.; Ismail, K.; Gervin, K.; Kyllönen, A.; Hakkarainen, A.; Lundbom, J.; Järvinen, E.A.; Harris, J.R.; Lundbom, N.; Rissanen, A.; et al. Genome-wide blood DNA methylation alterations at regulatory elements and heterochromatic regions in monozygotic twins discordant for obesity and liver fat. Clin. Epigenetics 2015, 7, 39. [Google Scholar] [CrossRef] [PubMed]
- Chandra, S.; Baribault, C.; Lacey, M.R.; Ehrlich, M. Myogenic Differential Methylation: Diverse Associations with Chromatin Structure. Biology 2014, 3, 426–451. [Google Scholar] [CrossRef] [PubMed] [Green Version]
- Gan, Y.; Ye, F.; He, X.X. The role of YWHAZ in cancer: A maze of opportunities and challenges. J. Cancer 2020, 11, 2252–2264. [Google Scholar] [CrossRef] [PubMed]
- Zhang, H.; Jiang, H.; Chen, L.; Liu, J.; Hu, X.; Zhang, H. Inhibition of Notch1/Hes1 signaling pathway improves radiosensitivity of colorectal cancer cells. Eur. J. Pharmacol. 2018, 818, 364–370. [Google Scholar] [CrossRef] [PubMed]
- Barry, S.P.; Townsend, P.A.; Knight, R.A.; Scarabelli, T.M.; Latchman, D.S.; Stephanou, A. STAT3 modulates the DNA damage response pathway. Int. J. Exp. Pathol. 2010, 91, 506–514. [Google Scholar] [CrossRef]
- Redon, C.E.; Dickey, J.S.; Nakamura, A.J.; Kareva, I.G.; Naf, D.; Nowsheen, S.; Kryston, T.B.; Bonner, W.M.; Georgakilas, A.G.; Sedelnikova, O.A. Tumors induce complex DNA damage in distant proliferative tissues in vivo. Proc. Natl. Acad. Sci. USA 2010, 107, 17992–17997. [Google Scholar] [CrossRef] [Green Version]
- Price, R.J.; Lillycrop, K.A.; Burdge, G.C. Folic acid supplementation in vitro induces cell type-specific changes in BRCA1 and BRCA 2 mRNA expression, but does not alter DNA methylation of their promoters or DNA repair. Nutr. Res. 2015, 35, 532–544. [Google Scholar] [CrossRef] [Green Version]

Publisher’s Note: MDPI stays neutral with regard to jurisdictional claims in published maps and institutional affiliations. |
© 2022 by the authors. Licensee MDPI, Basel, Switzerland. This article is an open access article distributed under the terms and conditions of the Creative Commons Attribution (CC BY) license (https://creativecommons.org/licenses/by/4.0/).
Share and Cite
Zsigrai, S.; Kalmár, A.; Barták, B.K.; Nagy, Z.B.; Szigeti, K.A.; Valcz, G.; Kothalawala, W.; Dankó, T.; Sebestyén, A.; Barna, G.; et al. Folic Acid Treatment Directly Influences the Genetic and Epigenetic Regulation along with the Associated Cellular Maintenance Processes of HT-29 and SW480 Colorectal Cancer Cell Lines. Cancers 2022, 14, 1820. https://doi.org/10.3390/cancers14071820
Zsigrai S, Kalmár A, Barták BK, Nagy ZB, Szigeti KA, Valcz G, Kothalawala W, Dankó T, Sebestyén A, Barna G, et al. Folic Acid Treatment Directly Influences the Genetic and Epigenetic Regulation along with the Associated Cellular Maintenance Processes of HT-29 and SW480 Colorectal Cancer Cell Lines. Cancers. 2022; 14(7):1820. https://doi.org/10.3390/cancers14071820
Chicago/Turabian StyleZsigrai, Sára, Alexandra Kalmár, Barbara K. Barták, Zsófia B. Nagy, Krisztina A. Szigeti, Gábor Valcz, William Kothalawala, Titanilla Dankó, Anna Sebestyén, Gábor Barna, and et al. 2022. "Folic Acid Treatment Directly Influences the Genetic and Epigenetic Regulation along with the Associated Cellular Maintenance Processes of HT-29 and SW480 Colorectal Cancer Cell Lines" Cancers 14, no. 7: 1820. https://doi.org/10.3390/cancers14071820
APA StyleZsigrai, S., Kalmár, A., Barták, B. K., Nagy, Z. B., Szigeti, K. A., Valcz, G., Kothalawala, W., Dankó, T., Sebestyén, A., Barna, G., Pipek, O., Csabai, I., Tulassay, Z., Igaz, P., Takács, I., & Molnár, B. (2022). Folic Acid Treatment Directly Influences the Genetic and Epigenetic Regulation along with the Associated Cellular Maintenance Processes of HT-29 and SW480 Colorectal Cancer Cell Lines. Cancers, 14(7), 1820. https://doi.org/10.3390/cancers14071820