
MUC1 (CA27.29) before and after Chemotherapy and Prognosis in High-Risk Early Breast Cancer Patients

 , ,
, , 
 , , ,
, , ,  ,
,
Abstract
:Simple Summary
Abstract
1. Introduction
2. Materials and Methods
2.1. Study Design
2.2. Participants
2.3. End Points, Follow-Up, and Data Capture
2.4. Assessment of Soluble MUC1 with the CA27.29 Assay
2.5. Statistical Methods
3. Results
3.1. Patient Characteristics
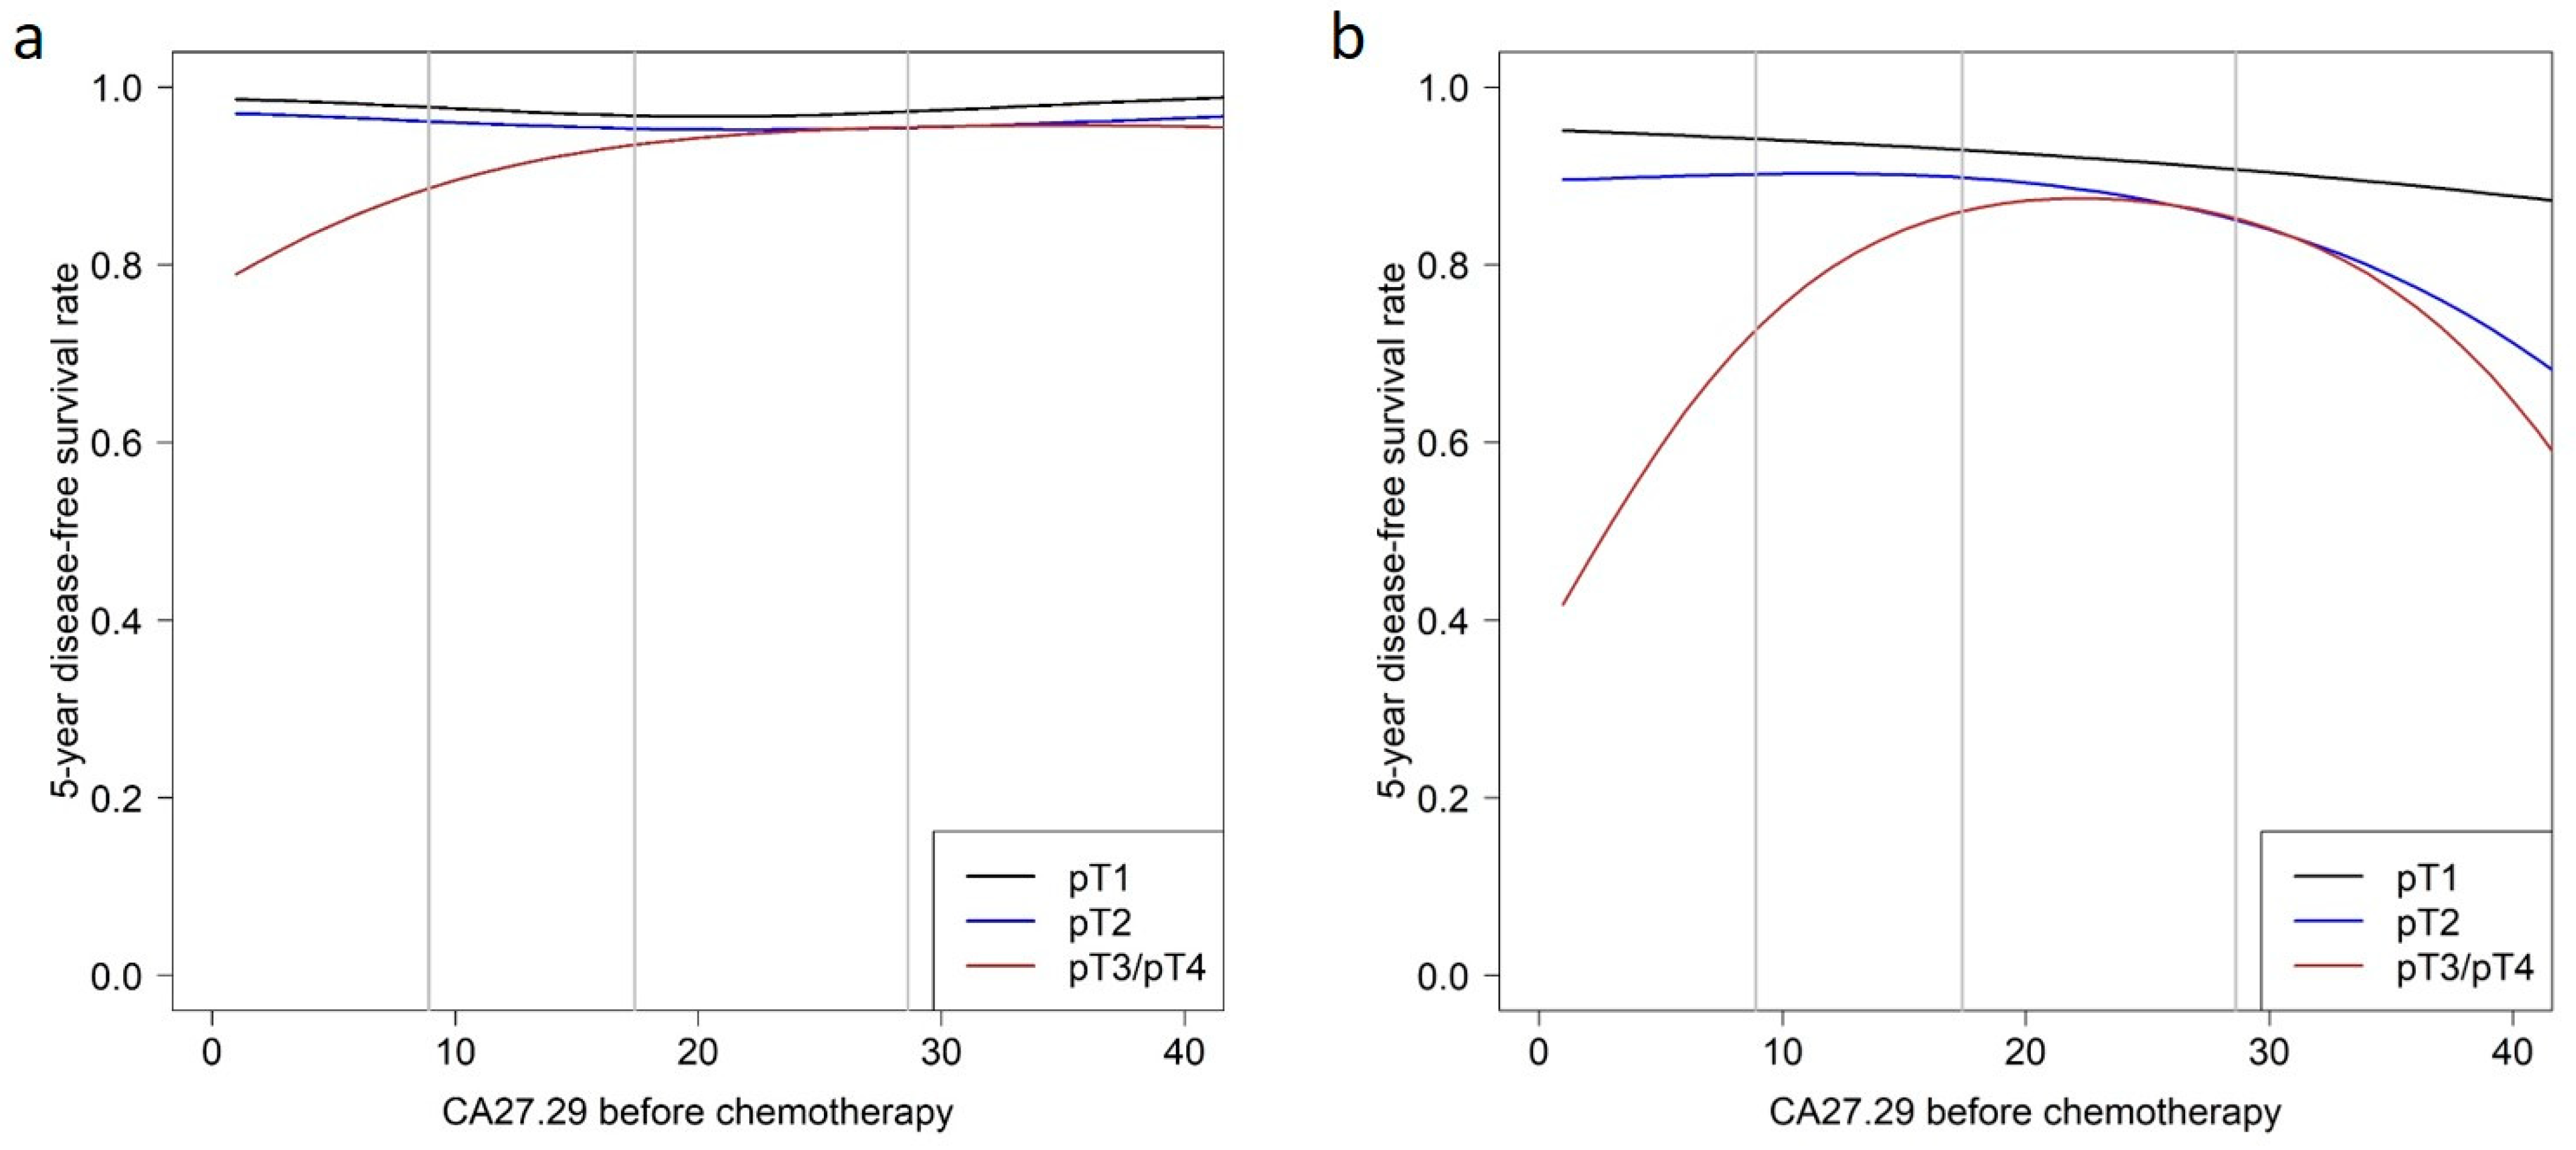
3.2. Prediction of Disease-Free Survival
4. Discussion
5. Conclusions
Supplementary Materials
Author Contributions
Funding
Institutional Review Board Statement
Informed Consent Statement
Data Availability Statement
Acknowledgments
Conflicts of Interest
Abbreviations
| AE | Adverse event |
| ANC | Absolute neutrophil count |
| BC | Breast cancer |
| BMI | Body mass index |
| CI | Confidence interval |
| CMF | Cyclophosphamide, methotrexate and fluorouracil |
| CTC | Circulating tumor cells |
| DFS | Disease-free survival |
| Doc | Docetaxel |
| ER | Estrogen receptor |
| FEC | 5-fluoroucacil, epirubicin and cyclophosphamide |
| 5-FU | 5-fluorouracil |
| G-CSF | Granulocyte-colony stimulating factor |
| Gem | Gemcitabine |
| HER2 | Human epidermal growth factor receptor 2 |
| HR | Hazard ratio |
| HRS | Hormone receptor status |
| MAPK | Mitogen-activated protein kinase |
| MUC1-C | Carboxy-terminal transmembrane subunit |
| MUC1-N | Amino-terminal extracellular subunit |
| NFκB | Nuclear factor kappa B |
| OS | Overall survival |
| PI3K | Phosphatidylinositol-3′-kinase |
| PR | Progesterone receptor |
| SGPT | Serum glutamate pyruvate transaminase |
References
- Hartkopf, A.D.; Muller, V.; Wockel, A.; Lux, M.P.; Janni, W.; Ettl, J.; Belleville, E.; Schutz, F.; Fasching, P.A.; Kolberg, H.C.; et al. Translational Highlights in Breast and Ovarian Cancer 2019—Immunotherapy, DNA Repair, PI3K Inhibition and CDK4/6 Therapy. Geburtshilfe Frauenheilkd 2019, 79, 1309–1319. [Google Scholar] [CrossRef] [PubMed]
- Duffy, M.J.; Evoy, D.; McDermott, E.W. CA 15-3: Uses and limitation as a biomarker for breast cancer. Clin. Chim. Acta 2010, 411, 1869–1874. [Google Scholar] [CrossRef] [PubMed]
- Kufe, D.W. MUC1-C oncoprotein as a target in breast cancer: Activation of signaling pathways and therapeutic approaches. Oncogene 2013, 32, 1073–1081. [Google Scholar] [CrossRef] [PubMed] [Green Version]
- Shao, Y.; Sun, X.; He, Y.; Liu, C.; Liu, H. Elevated Levels of Serum Tumor Markers CEA and CA15-3 Are Prognostic Parameters for Different Molecular Subtypes of Breast Cancer. PLoS ONE 2015, 10, e0133830. [Google Scholar] [CrossRef] [PubMed]
- Wu, S.G.; He, Z.Y.; Zhou, J.; Sun, J.Y.; Li, F.Y.; Lin, Q.; Guo, L.; Lin, H.X. Serum levels of CEA and CA15-3 in different molecular subtypes and prognostic value in Chinese breast cancer. Breast 2014, 23, 88–93. [Google Scholar] [CrossRef] [PubMed]
- Li, H.; Chen, K.; Su, F.; Song, E.; Gong, C. Preoperative CA 15-3 levels predict the prognosis of nonmetastatic luminal A breast cancer. J. Surg. Res. 2014, 189, 48–56. [Google Scholar] [CrossRef]
- Lee, J.S.; Park, S.; Park, J.M.; Cho, J.H.; Kim, S.I.; Park, B.W. Elevated levels of preoperative CA 15-3 and CEA serum levels have independently poor prognostic significance in breast cancer. Ann. Oncol. 2013, 24, 1225–1231. [Google Scholar] [CrossRef]
- Ali, H.Q.; Mahdi, N.K.; Al-Jowher, M.H. The value of CA15-3 in diagnosis, prognosis and treatment response in women with breast cancer. JPMA J. Pak. Med. Assoc. 2013, 63, 1138–1141. [Google Scholar]
- Sandri, M.T.; Salvatici, M.; Botteri, E.; Passerini, R.; Zorzino, L.; Rotmensz, N.; Luini, A.; Mauro, C.; Bagnardi, V.; Cassatella, M.C.; et al. Prognostic role of CA15.3 in 7942 patients with operable breast cancer. Breast Cancer Res. Treat. 2012, 132, 317–326. [Google Scholar] [CrossRef]
- Molina, R.; Auge, J.M.; Farrus, B.; Zanon, G.; Pahisa, J.; Munoz, M.; Torne, A.; Filella, X.; Escudero, J.M.; Fernandez, P.; et al. Prospective evaluation of carcinoembryonic antigen (CEA) and carbohydrate antigen 15.3 (CA 15.3) in patients with primary locoregional breast cancer. Clin. Chem. 2010, 56, 1148–1157. [Google Scholar] [CrossRef] [Green Version]
- Lumachi, F.; Basso, S.M.; Bonamini, M.; Marzano, B.; Milan, E.; Waclaw, B.U.; Chiara, G.B. Relationship between preoperative serum markers CA 15-3 and CEA and relapse of the disease in elderly (>65 years) women with breast cancer. Anticancer Res. 2010, 30, 2331–2334. [Google Scholar] [PubMed]
- Duffy, M.J.; Duggan, C.; Keane, R.; Hill, A.D.; McDermott, E.; Crown, J.; O’Higgins, N. High preoperative CA 15-3 concentrations predict adverse outcome in node-negative and node-positive breast cancer: Study of 600 patients with histologically confirmed breast cancer. Clin. Chem. 2004, 50, 559–563. [Google Scholar] [CrossRef] [PubMed] [Green Version]
- Kumpulainen, E.J.; Keskikuru, R.J.; Johansson, R.T. Serum tumor marker CA 15.3 and stage are the two most powerful predictors of survival in primary breast cancer. Breast Cancer Res. Treat. 2002, 76, 95–102. [Google Scholar] [CrossRef] [PubMed]
- Gion, M.; Boracchi, P.; Dittadi, R.; Biganzoli, E.; Peloso, L.; Mione, R.; Gatti, C.; Paccagnella, A.; Marubini, E. Prognostic role of serum CA15.3 in 362 node-negative breast cancers. An old player for a new game. Eur. J. Cancer 2002, 38, 1181–1188. [Google Scholar] [CrossRef]
- Ebeling, F.G.; Stieber, P.; Untch, M.; Nagel, D.; Konecny, G.E.; Schmitt, U.M.; Fateh-Moghadam, A.; Seidel, D. Serum CEA and CA 15-3 as prognostic factors in primary breast cancer. Br. J. Cancer 2002, 86, 1217–1222. [Google Scholar] [CrossRef] [PubMed]
- Canizares, F.; Sola, J.; Perez, M.; Tovar, I.; De Las Heras, M.; Salinas, J.; Penafiel, R.; Martinez, P. Preoperative values of CA 15-3 and CEA as prognostic factors in breast cancer: A multivariate analysis. Tumour Biol. 2001, 22, 273–281. [Google Scholar]
- Shering, S.G.; Sherry, F.; McDermott, E.W.; O’Higgins, N.J.; Duffy, M.J. Preoperative CA 15-3 concentrations predict outcome of patients with breast carcinoma. Cancer 1998, 83, 2521–2527. [Google Scholar] [CrossRef]
- Molina, R.; Jo, J.; Filella, X.; Zanon, G.; Pahisa, J.; Munoz, M.; Farrus, B.; Latre, M.L.; Escriche, C.; Estape, J.; et al. c-erbB-2 oncoprotein, CEA, and CA 15.3 in patients with breast cancer: Prognostic value. Breast Cancer Res. Treat. 1998, 51, 109–119. [Google Scholar] [CrossRef]
- Di Gioia, D.; Heinemann, V.; Nagel, D.; Untch, M.; Kahlert, S.; Bauerfeind, I.; Koehnke, T.; Stieber, P. Kinetics of CEA and CA15-3 correlate with treatment response in patients undergoing chemotherapy for metastatic breast cancer (MBC). Tumour Biol. 2011, 32, 777–785. [Google Scholar] [CrossRef]
- Laessig, D.; Nagel, D.; Heinemann, V.; Untch, M.; Kahlert, S.; Bauerfeind, I.; Stieber, P. Importance of CEA and CA 15-3 during disease progression in metastatic breast cancer patients. Anticancer Res. 2007, 27, 1963–1968. [Google Scholar]
- de Gregorio, A.; Haberle, L.; Fasching, P.A.; Muller, V.; Schrader, I.; Lorenz, R.; Forstbauer, H.; Friedl, T.W.P.; Bauer, E.; de Gregorio, N.; et al. Gemcitabine as adjuvant chemotherapy in patients with high-risk early breast cancer-results from the randomized phase III SUCCESS-A trial. Breast Cancer Res. 2020, 22, 111. [Google Scholar] [CrossRef] [PubMed]
- von Minckwitz, G.; Arnold, N.; Denkert, C.; Dittmer, J.; Fehm, T.; Harbeck, N.; Janni, W.; Meinhold-Heerlein, I.; Muller, V.; Pantel, K.; et al. Preservation of Biomaterials for translational research in current breast cancer studies: Review and recommendations. Geburtshilfe Frauenheilkd 2007, 67, 451–459. [Google Scholar] [CrossRef]
- Salmen, J.; Neugebauer, J.; Fasching, P.A.; Haeberle, L.; Huober, J.; Wockel, A.; Rauh, C.; Schuetz, F.; Weissenbacher, T.; Kost, B.; et al. Pooled analysis of the prognostic relevance of progesterone receptor status in five German cohort studies. Breast Cancer Res. Treat. 2014, 148, 143–151. [Google Scholar] [CrossRef] [PubMed]
- Hastie, T.; Tibshirani, R. Generalized additive models for medical research. Stat. Methods Med. Res. 1995, 4, 187–196. [Google Scholar] [CrossRef] [PubMed]
- Ripatti, S.; Palmgren, J. Estimation of multivariate frailty models using penalized partial likelihood. Biometrics 2000, 56, 1016–1022. [Google Scholar] [CrossRef]
- Grambsch, P.M.; Therneau, T.M. Proportional Hazards Tests and Diagnostics Based on Weighted Residuals. Biometrika 1994, 81, 515–526. [Google Scholar] [CrossRef]
- Ware, J.H. The limitations of risk factors as prognostic tools. N. Engl. J. Med. 2006, 355, 2615–2617. [Google Scholar] [CrossRef] [Green Version]
- Uno, H.; Cai, T.X.; Tian, L.; Wei, L.J. Evaluating prediction rules for t-year survivors with censored regression models. J. Am. Stat. Assoc. 2007, 102, 527–537. [Google Scholar] [CrossRef]
- McShane, L.M.; Altman, D.G.; Sauerbrei, W.; Taube, S.E.; Gion, M.; Clark, G.M.; Statistics Subcommittee of the NCI-EORTC Working Group on Cancer Diagnostics. REporting recommendations for tumour MARKer prognostic studies (REMARK). Br. J. Cancer 2005, 93, 387–391. [Google Scholar] [CrossRef] [Green Version]
- Stieber, P.; Nagel, D.; Blankenburg, I.; Heinemann, V.; Untch, M.; Bauerfeind, I.; Di Gioia, D. Diagnostic efficacy of CA 15-3 and CEA in the early detection of metastatic breast cancer-A retrospective analysis of kinetics on 743 breast cancer patients. Clin. Chim. Acta 2015, 448, 228–231. [Google Scholar] [CrossRef]
- Pedersen, A.C.; Sorensen, P.D.; Jacobsen, E.H.; Madsen, J.S.; Brandslund, I. Sensitivity of CA 15-3, CEA and serum HER2 in the early detection of recurrence of breast cancer. Clin. Chem. Lab. Med. 2013, 51, 1511–1519. [Google Scholar] [CrossRef] [PubMed]
- Bahrami-Ahmadi, A.; Makarian, F.; Mortazavizadeh, M.R.; Yazdi, M.F.; Chamani, M. Symptomatic metastasis prediction with serial measurements of CA 15.3 in primary breast cancer patients. J. Res. Med. Sci. 2012, 17, 850–854. [Google Scholar] [PubMed]
- Bahrami, A.; Mortazavizadeh, M.R.; Yazdi, M.F.; Chamani, M. Serial tumour markers serum carcinoembryonic antigen and cancer antigen 15-3 assays in detecting symptomatic metastasis in breast cancer patients. East. Mediterr. Health J. 2012, 18, 1055–1059. [Google Scholar] [CrossRef] [PubMed]
- Evangelista, L.; Baretta, Z.; Vinante, L.; Cervino, A.R.; Gregianin, M.; Ghiotto, C.; Bozza, F.; Saladini, G. Could the serial determination of Ca15.3 serum improve the diagnostic accuracy of PET/CT? Results from small population with previous breast cancer. Ann. Nucl. Med. 2011, 25, 469–477. [Google Scholar] [CrossRef]
- Wu, S.C.; Chou, F.F.; Rau, K.M. Clinical significance of a serum CA 15-3 surge and the usefulness of CA 15-3 kinetics in monitoring chemotherapy response in patients with metastatic breast cancer. Breast Cancer Res. Treat. 2010, 124, 879–882. [Google Scholar] [CrossRef]
- Mariani, L.; Miceli, R.; Michilin, S.; Gion, M. Serial determination of CEA and CA 15.3 in breast cancer follow-up: An assessment of their diagnostic accuracy for the detection of tumour recurrences. Biomarkers 2009, 14, 130–136. [Google Scholar] [CrossRef]
- Kim, H.S.; Park, Y.H.; Park, M.J.; Chang, M.H.; Jun, H.J.; Kim, K.H.; Ahn, J.S.; Kang, W.K.; Park, K.; Im, Y.H. Clinical significance of a serum CA15-3 surge and the usefulness of CA15-3 kinetics in monitoring chemotherapy response in patients with metastatic breast cancer. Breast Cancer Res. Treat. 2009, 118, 89–97. [Google Scholar] [CrossRef]
- De La Lande, B.; Hacene, K.; Floiras, J.L.; Alatrakchi, N.; Pichon, M.F. Prognostic value of CA 15.3 kinetics for metastatic breast cancer. Int. J. Biol. Markers 2002, 17, 231–238. [Google Scholar] [CrossRef]
- Jager, W.; Eibner, K.; Loffler, B.; Gleixner, S.; Kramer, S. Serial CEA and CA 15-3 measurements during follow-up of breast cancer patients. Anticancer Res. 2000, 20, 5179–5182. [Google Scholar]
- Gion, M.; Cappelli, G.; Mione, R.; Pistorello, M.; Meo, S.; Vignati, G.; Fortunato, A.; Saracchini, S.; Biasioli, R.; Giulisano, M. Evaluation of critical differences of CEA and CA 15.3 levels in serial samples from patients operated for breast cancer. Int. J. Biol. Markers 1994, 9, 135–139. [Google Scholar] [CrossRef]
- Tang, C.; Wang, P.; Li, X.; Zhao, B.; Yang, H.; Yu, H.; Li, C. Lymph node status have a prognostic impact in breast cancer patients with distant metastasis. PLoS ONE 2017, 12, e0182953. [Google Scholar] [CrossRef] [PubMed] [Green Version]
- Hung, M.; Xu, J.; Nielson, D.; Bounsanga, J.; Gu, Y.; Hansen, A.R.; Voss, M.W. Evaluating the Prediction of Breast Cancer Survival Using Lymph Node Ratio. J. Breast Cancer 2018, 21, 315–320. [Google Scholar] [CrossRef] [PubMed]
- Rack, B.; Schindlbeck, C.; Juckstock, J.; Genss, E.M.; Hepp, P.; Lorenz, R.; Tesch, H.; Schneeweiss, A.; Beckmann, M.W.; Lichtenegger, W.; et al. Prevalence of CA 27.29 in primary breast cancer patients before the start of systemic treatment. Anticancer Res. 2010, 30, 1837–1841. [Google Scholar] [PubMed]
- Pillai, K.; Pourgholami, M.H.; Chua, T.C.; Morris, D.L. MUC1 as a potential target in anticancer therapies. Am. J. Clin. Oncol. 2015, 38, 108–118. [Google Scholar] [CrossRef] [PubMed]
- Acres, B.; Limacher, J.M. MUC1 as a target antigen for cancer immunotherapy. Exp. Rev. Vaccines 2005, 4, 493–502. [Google Scholar] [CrossRef]
- Dhar, P.; McAuley, J. The Role of the Cell Surface Mucin MUC1 as a Barrier to Infection and Regulator of Inflammation. Front. Cell Infect. Microbiol. 2019, 9, 117. [Google Scholar] [CrossRef]
- Konowalchuk, J.D.; Agrawal, B. MUC1 mucin is expressed on human T-regulatory cells: Function in both co-stimulation and co-inhibition. Cell Immunol. 2012, 272, 193–199. [Google Scholar] [CrossRef]
- Konowalchuk, J.D.; Agrawal, B. MUC1 is a novel costimulatory molecule of human T cells and functions in an AP-1-dependent manner. Hum. Immunol. 2012, 73, 448–455. [Google Scholar] [CrossRef]
- Agrawal, B.; Gupta, N.; Konowalchuk, J.D. MUC1 Mucin: A Putative Regulatory (Checkpoint) Molecule of T Cells. Front. Immunol. 2018, 9, 2391. [Google Scholar] [CrossRef] [Green Version]
- Hossain, M.K.; Wall, K.A. Immunological Evaluation of Recent MUC1 Glycopeptide Cancer Vaccines. Vaccines 2016, 4, 25. [Google Scholar] [CrossRef]


| Characteristic | Mean or Count | SD or % |
|---|---|---|
| Age | 53.0 | 10.5 |
| BMI | 26.2 | 5.0 |
| CA27.29 | ||
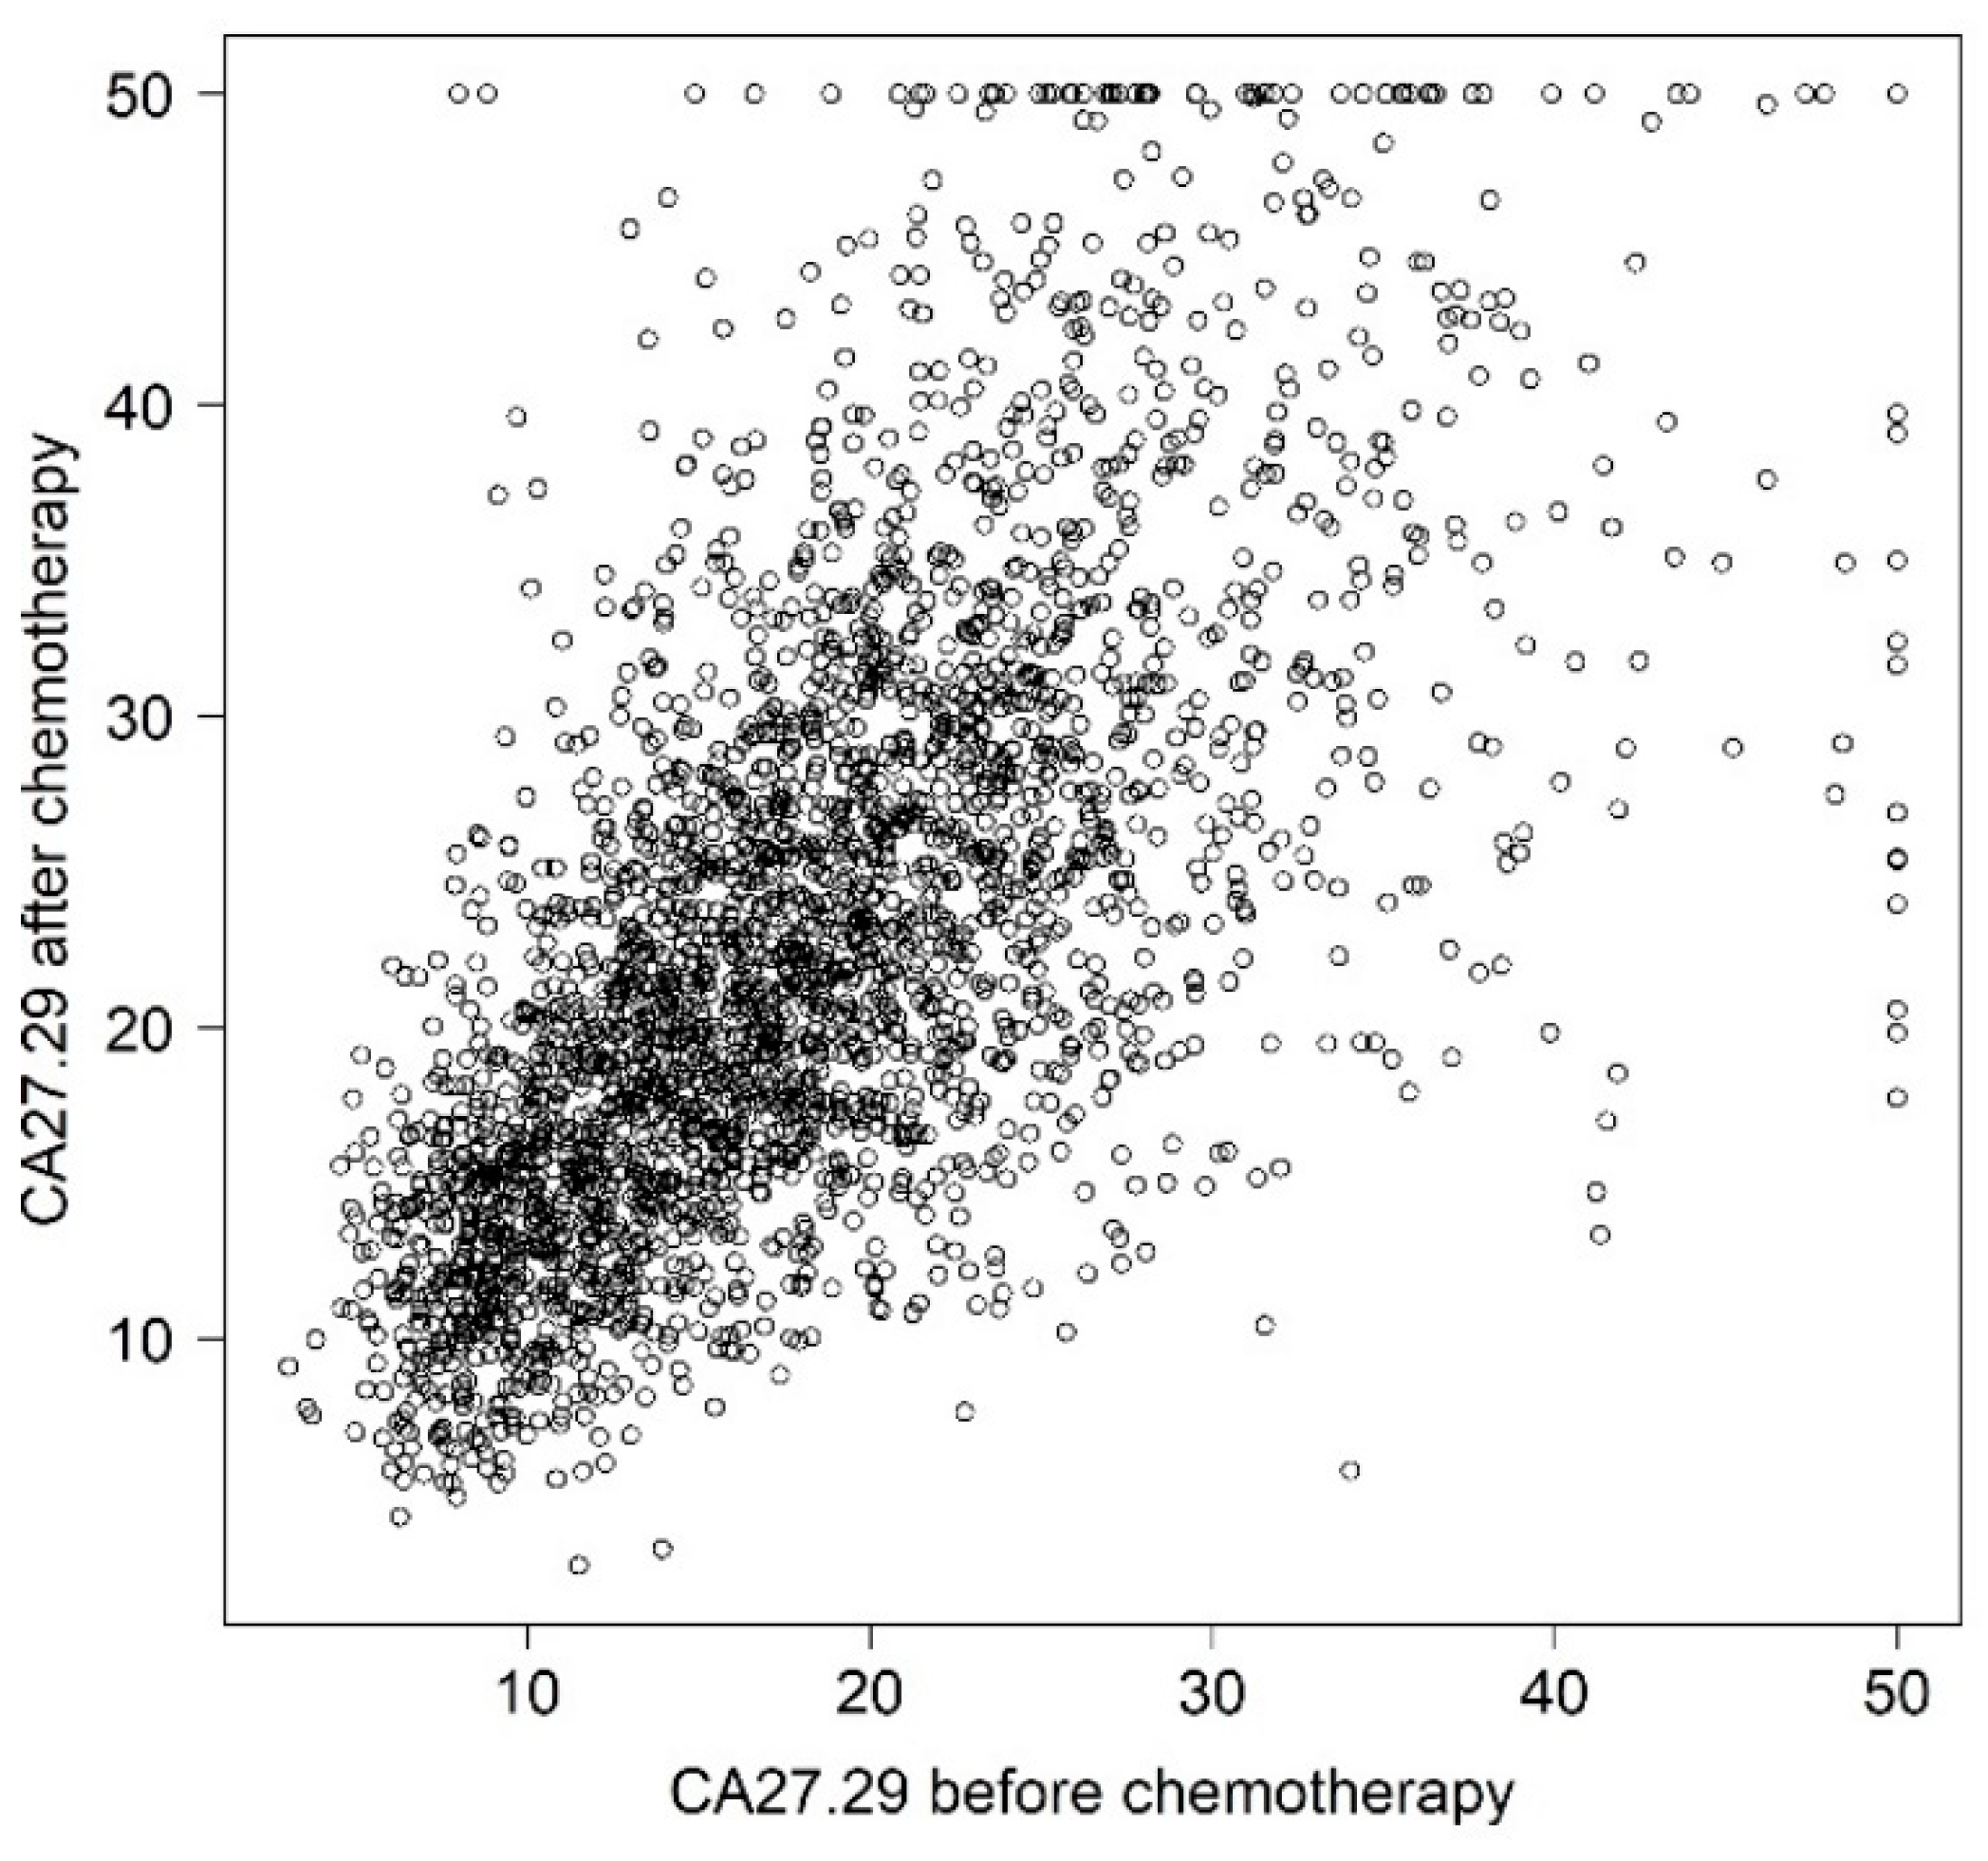
| Before chemotherapy | 18.4 | 8.1 |
| After chemotherapy | 23.1 | 9.8 |
| pT | ||
| pT1 | 1106 | 41.2 |
| pT2 | 1411 | 52.5 |
| pT3 | 137 | 5.1 |
| pT4 | 33 | 1.2 |
| pN | ||
| pN+ | 1764 | 65.6 |
| pN0 | 923 | 34.4 |
| Histology | ||
| Ductal | 2202 | 82.0 |
| Lobular | 302 | 11.2 |
| Other | 183 | 6.8 |
| Grading | ||
| G1 | 118 | 4.4 |
| G2 | 1304 | 48.5 |
| G3 | 1265 | 47.1 |
| ER | ||
| ER− | 922 | 34.3 |
| ER+ | 1765 | 65.7 |
| PR | ||
| PR− | 1091 | 40.6 |
| PR+ | 1596 | 59.4 |
| HER2/neu | ||
| HER2− | 2038 | 75.8 |
| HER2+ | 649 | 24.2 |
| Patient Subgroup | Hazard Ratio (95% Confidence Intervals) for CA27.29 before Chemotherapy | ||
|---|---|---|---|
| Medium vs. Low | High vs. Medium | High vs. Low | |
| pN0 and pT1 | 1.42 (0.77, 2.60) | 0.85 (0.52, 1.39) | 1.20 (0.52, 2.77) |
| pN0 and pT2 | 1.20 (0.70, 2.07) | 0.97 (0.64, 1.46) | 1.17 (0.55, 2.45) |
| pN0 and pT3/4 | 0.55 (0.26, 1.17) | 0.68 (0.41, 1.12) | 0.38 (0.13, 1.08) |
| pN+ and pT1 | 1.23 (0.78, 1.95) | 1.34 (0.94, 1.90) | 1.64 (0.86, 3.14) |
| pN+ and pT2 | 1.04 (0.75, 1.45) | 1.52 (1.25, 1.86) | 1.59 (0.98, 2.59) |
| pN+ and pT3/4 | 0.48 (0.28, 0.83) | 1.07 (0.77, 1.48) | 0.51 (0.23, 1.15) |
| Characteristic | 5-Year Survival Rate (95% Confidence Intervals) | ||
|---|---|---|---|
| Low † CA27.29 before Chemotherapy | Medium CA27.29 before Chemotherapy | High CA27.29 before Chemotherapy | |
| Age ‡ | |||
| Low | 0.89 (0.85, 0.93) | 0.89 (0.86, 0.92) | 0.84 (0.79, 0.89) |
| Medium | 0.90 (0.87, 0.94) | 0.90 (0.87, 0.92) | 0.85 (0.81, 0.89) |
| High | 0.91 (0.88, 0.94) | 0.91 (0.88, 0.93) | 0.86 (0.82, 0.91) |
| BMI | |||
| Low | 0.90 (0.87, 0.94) | 0.90 (0.87, 0.93) | 0.85 (0.81, 0.90) |
| Medium | 0.90 (0.87, 0.94) | 0.90 (0.87, 0.92) | 0.85 (0.81, 0.89) |
| High | 0.90 (0.87, 0.94) | 0.90 (0.87, 0.92) | 0.85 (0.80, 0.90) |
| pT | |||
| pT1 | 0.94 (0.92, 0.97) | 0.93 (0.91, 0.95) | 0.91 (0.87, 0.94) |
| pT2 | 0.90 (0.87, 0.94) | 0.90 (0.87, 0.92) | 0.85 (0.81, 0.89) |
| pT3/4 | 0.73 (0.61, 0.87) | 0.86 (0.80, 0.92) | 0.85 (0.78, 0.93) |
| pN | |||
| pN0 | 0.96 (0.94, 0.98) | 0.95 (0.94, 0.97) | 0.95 (0.93, 0.98) |
| pN+ | 0.90 (0.87, 0.94) | 0.90 (0.87, 0.92) | 0.85 (0.81, 0.89) |
| Histology | |||
| Ductal | 0.90 (0.87, 0.94) | 0.90 (0.87, 0.92) | 0.85 (0.81, 0.89) |
| Lobular | 0.88 (0.83, 0.93) | 0.87 (0.83, 0.91) | 0.81 (0.75, 0.88) |
| Other | 0.93 (0.88, 0.97) | 0.92 (0.88, 0.96) | 0.89 (0.83, 0.95) |
| Grading | |||
| G1 | 0.94 (0.92, 0.97) | 0.94 (0.92, 0.96) | 0.91 (0.88, 0.95) |
| G2 | 0.90 (0.87, 0.94) | 0.90 (0.87, 0.92) | 0.85 (0.81, 0.89) |
| G3 | 0.84 (0.78, 0.89) | 0.83 (0.79, 0.87) | 0.75 (0.69, 0.83) |
| ER | |||
| ER− | 0.86 (0.80, 0.92) | 0.86 (0.81, 0.91) | 0.79 (0.72, 0.87) |
| ER+ | 0.90 (0.87, 0.94) | 0.90 (0.87, 0.92) | 0.85 (0.81, 0.89) |
| PR | |||
| PR− | 0.84 (0.78, 0.91) | 0.84 (0.79, 0.89) | 0.76 (0.69, 0.85) |
| PR+ | 0.90 (0.87, 0.94) | 0.90 (0.87, 0.92) | 0.85 (0.81, 0.89) |
| HER2 | |||
| HER2− | 0.90 (0.87, 0.94) | 0.90 (0.87, 0.92) | 0.85 (0.81, 0.89) |
| HER2+ | 0.93 (0.90, 0.96) | 0.93 (0.90, 0.95) | 0.89 (0.85, 0.93) |
| CA27.29 after chemotherapy | |||
| Low | 0.90 (0.86, 0.93) | 0.89 (0.86, 0.92) | 0.84 (0.79, 0.90) |
| Medium | 0.90 (0.87, 0.94) | 0.90 (0.87, 0.92) | 0.85 (0.81, 0.89) |
| High | 0.91 (0.87, 0.95) | 0.91 (0.88, 0.93) | 0.86 (0.82, 0.90) |
Publisher’s Note: MDPI stays neutral with regard to jurisdictional claims in published maps and institutional affiliations. |
© 2022 by the authors. Licensee MDPI, Basel, Switzerland. This article is an open access article distributed under the terms and conditions of the Creative Commons Attribution (CC BY) license (https://creativecommons.org/licenses/by/4.0/).
Share and Cite
Huebner, H.; Häberle, L.; Müller, V.; Schrader, I.; Lorenz, R.; Forstbauer, H.; Fink, V.; Schochter, F.; Bekes, I.; Mahner, S.; et al. MUC1 (CA27.29) before and after Chemotherapy and Prognosis in High-Risk Early Breast Cancer Patients. Cancers 2022, 14, 1721. https://doi.org/10.3390/cancers14071721
Huebner H, Häberle L, Müller V, Schrader I, Lorenz R, Forstbauer H, Fink V, Schochter F, Bekes I, Mahner S, et al. MUC1 (CA27.29) before and after Chemotherapy and Prognosis in High-Risk Early Breast Cancer Patients. Cancers. 2022; 14(7):1721. https://doi.org/10.3390/cancers14071721
Chicago/Turabian StyleHuebner, Hanna, Lothar Häberle, Volkmar Müller, Iris Schrader, Ralf Lorenz, Helmut Forstbauer, Visnja Fink, Fabienne Schochter, Inga Bekes, Sven Mahner, and et al. 2022. "MUC1 (CA27.29) before and after Chemotherapy and Prognosis in High-Risk Early Breast Cancer Patients" Cancers 14, no. 7: 1721. https://doi.org/10.3390/cancers14071721
APA StyleHuebner, H., Häberle, L., Müller, V., Schrader, I., Lorenz, R., Forstbauer, H., Fink, V., Schochter, F., Bekes, I., Mahner, S., Jückstock, J., Nabieva, N., Schneeweiss, A., Tesch, H., Brucker, S. Y., Blohmer, J.-U., Fehm, T. N., Heinrich, G., Rezai, M., ... Rack, B. (2022). MUC1 (CA27.29) before and after Chemotherapy and Prognosis in High-Risk Early Breast Cancer Patients. Cancers, 14(7), 1721. https://doi.org/10.3390/cancers14071721