
Quantitative Analysis of Radiation-Associated Parenchymal Lung Change

 ,
,
Abstract
:Simple Summary
Abstract
1. Introduction
2. Materials and Methods
3. Results
4. Discussion
5. Conclusions
Supplementary Materials
Author Contributions
Funding
Institutional Review Board Statement
Informed Consent Statement
Data Availability Statement
Conflicts of Interest
References
- Barta, J.A.; Powell, C.A.; Wisnivesky, J.P. Global Epidemiology of Lung Cancer. Ann. Glob. Health 2019, 85, 8. [Google Scholar] [CrossRef] [PubMed] [Green Version]
- Faivre-Finn, C.; Vicente, D.; Kurata, T.; Planchard, D.; Paz-Ares, L.; Vansteenkiste, J.F.; Spigel, D.R.; Garassino, M.C.; Reck, M.; Senan, S.; et al. Four-Year Survival with Durvalumab after Chemoradiotherapy in Stage III NSCLC—An Update from the PACIFIC Trial. J. Thorac. Oncol. 2021, 16, 860–867. [Google Scholar] [CrossRef] [PubMed]
- Giuranno, L.; Ient, J.; De Ruysscher, D.; Vooijs, M.A. Radiation-Induced Lung Injury (RILI). Front. Oncol. 2019, 9, 877. [Google Scholar] [CrossRef] [PubMed] [Green Version]
- Hanania, A.N.; Mainwaring, W.; Ghebre, Y.T.; Hanania, N.A.; Ludwig, M. Radiation-Induced Lung Injury: Assessment and Management. Chest 2019, 156, 150–162. [Google Scholar] [CrossRef]
- Morgan, G.W.; Pharm, B.; Breit, S.N. Radiation and the lung: A reevaluation of the mechanisms mediating pulmonary injury. Int. J. Radiat. Oncol. Biol. Phys. 1995, 31, 361–369. [Google Scholar] [CrossRef]
- Faria, S.L.; Aslani, M.; Tafazoli, F.S.; Souhami, L.; Freeman, C.R. The challenge of scoring radiation-induced lung toxicity. Clin. Oncol. (R. Coll. Radiol.) 2009, 21, 371–375. [Google Scholar] [CrossRef]
- Palma, D.A.; Senan, S.; Tsujino, K.; Barriger, R.B.; Rengan, R.; Moreno, M.; Bradley, J.D.; Kim, T.H.; Ramella, S.; Marks, L.B.; et al. Predicting radiation pneumonitis after chemoradiation therapy for lung cancer: An international individual patient data meta-analysis. Int. J. Radiat. Oncol. Biol. Phys. 2013, 85, 444–450. [Google Scholar] [CrossRef] [Green Version]
- Minami-Shimmyo, Y.; Ohe, Y.; Yamamoto, S.; Sumi, M.; Nokihara, H.; Horinouchi, H.; Yamamoto, N.; Sekine, I.; Kubota, K.; Tamura, T. Risk factors for treatment-related death associated with chemotherapy and thoracic radiotherapy for lung cancer. J. Thorac. Oncol. 2012, 7, 177–182. [Google Scholar] [CrossRef] [Green Version]
- Kong, F.-M.; Wang, S. Nondosimetric Risk Factors for Radiation-Induced Lung Toxicity. Semin. Radiat. Oncol. 2015, 25, 100–109. [Google Scholar] [CrossRef] [Green Version]
- Jain, V.; Berman, A.T. Radiation Pneumonitis: Old Problem, New Tricks. Cancers 2018, 10, 222. [Google Scholar] [CrossRef] [Green Version]
- Delaunay, M.; Prévot, G.; Collot, S.; Guilleminault, L.; Didier, A.; Mazières, J. Management of pulmonary toxicity associated with immune checkpoint inhibitors. Eur. Respir. Rev. 2019, 28, 190012. [Google Scholar] [CrossRef] [PubMed]
- Twyman-Saint Victor, C.; Rech, A.J.; Maity, A.; Rengan, R.; Pauken, K.E.; Stelekati, E.; Benci, J.L.; Xu, B.; Dada, H.; Odorizzi, P.M.; et al. Radiation and dual checkpoint blockade activate non-redundant immune mechanisms in cancer. Nature 2015, 520, 373–377. [Google Scholar] [CrossRef] [Green Version]
- Shaverdian, N.; Lisberg, A.E.; Bornazyan, K.; Veruttipong, D.; Goldman, J.W.; Formenti, S.C.; Garon, E.B.; Lee, P. Previous radiotherapy and the clinical activity and toxicity of pembrolizumab in the treatment of non-small-cell lung cancer: A secondary analysis of the KEYNOTE-001 phase 1 trial. Lancet Oncol. 2017, 18, 895–903. [Google Scholar] [CrossRef]
- Marks, L.B.; Bentzen, S.M.; Deasy, J.O.; Kong, F.-M.S.; Bradley, J.D.; Vogelius, I.S.; El Naqa, I.; Hubbs, J.L.; Lebesque, J.V.; Timmerman, R.D.; et al. Radiation dose-volume effects in the lung. Int. J. Radiat. Oncol. Biol. Phys. 2010, 76 Suppl. S3, S70–S76. [Google Scholar] [CrossRef] [PubMed] [Green Version]
- Bradley, J.D.; Hu, C.; Komaki, R.U.; Masters, G.; Blumenschein, G.R.; Schild, S.E.; Bogart, J.A.; Forster, K.M.; Magliocco, A.; Kavadi, V.S.; et al. Long-Term Results of RTOG 0617: A Randomized Phase 3 Comparison of Standard Dose Versus High Dose Conformal Chemoradiation Therapy +/- Cetuximab for Stage III NSCLC. Int. J. Radiat. Oncol. Biol. Phys. 2017, 99, S105. [Google Scholar] [CrossRef]
- O’Rourke, N.; Roque, I.F.M.; Farre Bernado, N.; Macbeth, F. Concurrent chemoradiotherapy in non-small cell lung cancer. Cochrane Database Syst Rev 2010, 6, Cd002140. [Google Scholar] [CrossRef]
- Libshitz, H.I.; Shuman, L.S. Radiation-Induced Pulmonary Change: CT Findings. J. Comput. Assist. Tomogr. 1984, 8, 15–19. [Google Scholar] [CrossRef]
- Ikezoe, J.; Takashima, S.; Morimoto, S.; Kadowaki, K.; Takeuchi, N.; Yamamoto, T.; Nakanishi, K.; Isaza, M.; Arisawa, J.; Ikeda, H.; et al. CT appearance of acute radiation-induced injury in the lung. AJR Am. J. Roentgenol. 1988, 150, 765–770. [Google Scholar] [CrossRef] [Green Version]
- Trovo, M.; Linda, A.; El Naqa, I.; Javidan-Nejad, C.; Bradley, J. Early and late lung radiographic injury following stereotactic body radiation therapy (SBRT). Lung Cancer 2010, 69, 77–85. [Google Scholar] [CrossRef]
- Koenig, T.R.; Munden, R.F.; Erasmus, J.J.; Sabloff, B.S.; Gladish, G.W.; Komaki, R.; Stevens, C.W. Radiation injury of the lung after three-dimensional conformal radiation therapy. AJR Am. J. Roentgenol. 2002, 178, 1383–1388. [Google Scholar] [CrossRef] [PubMed]
- Linda, A.; Trovo, M.; Bradley, J.D. Radiation injury of the lung after stereotactic body radiation therapy (SBRT) for lung cancer: A timeline and pattern of CT changes. Eur. J. Radiol. 2011, 79, 147–154. [Google Scholar] [CrossRef]
- Veiga, C.; Landau, D.; Devaraj, A.; Doel, T.; White, J.; Ngai, Y.; Hawkes, D.J.; McClelland, J.R. Novel CT-Based Objective Imaging Biomarkers of Long-Term Radiation-Induced Lung Damage. Int. J. Radiat. Oncol. Biol. Phys. 2018, 102, 1287–1298. [Google Scholar] [CrossRef] [PubMed] [Green Version]
- Veiga, C.; Chandy, E.; Jacob, J.; Yip, N.; Szmul, A.; Landau, D.; McClelland, J.R. Investigation of the evolution of radiation-induced lung damage using serial CT imaging and pulmonary function tests. Radiother. Oncol. 2020, 148, 89–96. [Google Scholar] [CrossRef] [PubMed]
- Stavropoulou, A.; Szmul, A.; Chandy, E.; Veiga, C.; Landau, D.; McClelland, J.R. A multichannel feature-based approach for longitudinal lung CT registration in the presence of radiation induced lung damage. Phys. Med. Biol. 2021, 66, 175020. [Google Scholar] [CrossRef] [PubMed]
- Szmul, A.; Chandy, E.; Veiga, C.; Jacob, J.; Stavropoulou, A.; Landau, D.; Hiley, C.; McClelland, J. A novel and automated approach to classify Radiation Induced Lung Tissue Damage on CT scans. Cancers 2021. [Google Scholar]
- Fenwick, J.D.; Landau, D.B.; Baker, A.T.; Bates, A.T.; Eswar, C.; Garcia-Alonso, A.; Harden, S.V.; Illsley, M.C.; Laurence, V.; Malik, Z.; et al. Long-Term Results from the IDEAL-CRT Phase 1/2 Trial of Isotoxically Dose-Escalated Radiation Therapy and Concurrent Chemotherapy for Stage II/III Non-small Cell Lung Cancer. Int. J. Radiat. Oncol. Biol. Phys. 2020, 106, 733–742. [Google Scholar] [CrossRef] [PubMed] [Green Version]
- Libshitz, H.I.; Southard, M.E. Complications of radiation therapy: The thorax. Semin. Roentgenol. 1974, 9, 41–49. [Google Scholar] [CrossRef]
- Pagani, J.J.; Libshitz, H.I. CT Manifestations of Radiation-Induced Change in Chest Tissue. J. Comput. Assist. Tomogr. 1982, 6, 243–248. [Google Scholar] [CrossRef]
- Libshitz, H.I. Radiation changes in the lung. Semin. Roentgenol. 1993, 28, 303–320. [Google Scholar] [CrossRef]
- Bernchou, U.; Christiansen, R.L.; Asmussen, J.T.; Schytte, T.; Hansen, O.; Brink, C. Extent and computed tomography appearance of early radiation induced lung injury for non-small cell lung cancer. Radiother. Oncol. 2017, 123, 93–98. [Google Scholar] [CrossRef]
- Bernchou, U.; Hansen, O.; Schytte, T.; Bertelsen, A.; Hope, A.; Moseley, D.; Brink, C. Prediction of lung density changes after radiotherapy by cone beam computed tomography response markers and pre-treatment factors for non-small cell lung cancer patients. Radiother. Oncol. 2015, 117, 17–22. [Google Scholar] [CrossRef] [PubMed]
- Bernchou, U.; Schytte, T.; Bertelsen, A.; Bentzen, S.M.; Hansen, O.; Brink, C. Time evolution of regional CT density changes in normal lung after IMRT for NSCLC. Radiother. Oncol. 2013, 109, 89–94. [Google Scholar] [CrossRef] [PubMed]
- Frangi, A.F.; Niessen, W.J.; Vincken, K.L.; Viergever, M.A. Multiscale vessel enhancement filtering. In Medical Image Computing and Computer-Assisted Intervention—MICCAI’98; Wells, W.M., Colchester, A., Delp, S., Eds.; Springer: Berlin/Heidelberg, Germany, 1998; pp. 130–137. [Google Scholar]
- Doel, T. 2012. Available online: https://github.com/tomdoel/pulmonarytoolkit (accessed on 12 February 2021).
- Yushkevich, P.A.; Piven, J.; Hazlett, H.C.; Smith, R.G.; Ho, S.; Gee, J.C.; Gerig, G. User-guided 3D active contour segmentation of anatomical structures: Significantly improved efficiency and reliability. Neuroimage 2006, 31, 1116–1128. [Google Scholar] [CrossRef] [PubMed] [Green Version]
- Modat, M.; Ridgway, G.R.; Taylor, Z.A.; Lehmann, M.; Barnes, J.; Hawkes, D.J.; Fox, N.C.; Ourselin, S. Fast free-form deformation using graphics processing units. Comput. Methods Programs Biomed. 2010, 98, 278–284. [Google Scholar] [CrossRef] [Green Version]
- Agnew, M. Spirometry in clinical use: Practical issues. Breathe 2010, 6, 196. [Google Scholar] [CrossRef]
- Tucker, S.L.; Jin, H.; Wei, X.; Wang, S.; Martel, M.K.; Komaki, R.; Liu, H.H.; Mohan, R.; Chen, Y.; Cox, J.D.; et al. Impact of toxicity grade and scoring system on the relationship between mean lung dose and risk of radiation pneumonitis in a large cohort of patients with non-small cell lung cancer. Int. J. Radiat. Oncol. Biol. Phys. 2010, 77, 691–698. [Google Scholar] [CrossRef]
- Schroder, C.; Engenhart-Cabillic, R.; Kirschner, S.; Blank, E.; Buchali, A. Changes of lung parenchyma density following high dose radiation therapy for thoracic carcinomas—An automated analysis of follow up CT scans. Radiat. Oncol. 2019, 14, 72. [Google Scholar] [CrossRef]
- Alharbi, M.; Janssen, S.; Golpon, H.; Bremer, M.; Henkenberens, C. Temporal and spatial dose distribution of radiation pneumonitis after concurrent radiochemotherapy in stage III non-small cell cancer patients. Radiat. Oncol. 2017, 12, 165. [Google Scholar] [CrossRef] [Green Version]
- Defraene, G.; van Elmpt, W.; Crijns, W.; De Ruysscher, D. Regional variability in radiation-induced lung damage can be predicted by baseline CT numbers. Radiother. Oncol. 2017, 122, 300–306. [Google Scholar] [CrossRef]
- Sharifi, H.; van Elmpt, W.; Oberije, C.; Nalbantov, G.; Das, M.; Ollers, M.; Lambin, P.; Dingmans, A.M.; De Ruysscher, D. Quantification of CT-assessed radiation-induced lung damage in lung cancer patients treated with or without chemotherapy and cetuximab. Acta Oncol. 2016, 55, 156–162. [Google Scholar] [CrossRef] [Green Version]
- Defraene, G.; van Elmpt, W.; Crijns, W.; Slagmolen, P.; De Ruysscher, D. CT characteristics allow identification of patient-specific susceptibility for radiation-induced lung damage. Radiother. Oncol. 2015, 117, 29–35. [Google Scholar] [CrossRef] [PubMed]
- Ghobadi, G.; Wiegman, E.M.; Langendijk, J.A.; Widder, J.; Coppes, R.P.; van Luijk, P. A new CT-based method to quantify radiation-induced lung damage in patients. Radiother. Oncol. 2015, 117, 4–8. [Google Scholar] [CrossRef] [PubMed] [Green Version]
- Avanzo, M.; Trovo, M.; Furlan, C.; Barresi, L.; Linda, A.; Stancanello, J.; Andreon, L.; Minatel, E.; Bazzocchi, M.; Trovo, M.G.; et al. Normal tissue complication probability models for severe acute radiological lung injury after radiotherapy for lung cancer. Phys. Med. 2015, 31, 1–8. [Google Scholar] [CrossRef] [PubMed]
- Diot, Q.; Marks, L.B.; Bentzen, S.M.; Senan, S.; Kavanagh, B.D.; Lawrence, M.V.; Miften, M.; Palma, D.A. Comparison of radiation-induced normal lung tissue density changes for patients from multiple institutions receiving conventional or hypofractionated treatments. Int. J. Radiat. Oncol. Biol. Phys. 2014, 89, 626–632. [Google Scholar] [CrossRef]
- De Ruysscher, D.; Sharifi, H.; Defraene, G.; Kerns, S.L.; Christiaens, M.; De Ruyck, K.; Peeters, S.; Vansteenkiste, J.; Jeraj, R.; Van Den Heuvel, F.; et al. Quantification of radiation-induced lung damage with CT scans: The possible benefit for radiogenomics. Acta Oncol. 2013, 52, 1405–1410. [Google Scholar] [CrossRef] [Green Version]
- Lawrence, M.V.; Saynak, M.; Fried, D.V.; Bateman, T.A.; Green, R.L.; Hubbs, J.L.; Jaszczak, R.J.; Wong, T.Z.; Zhou, S.; Das, S.K.; et al. Assessing the impact of radiation-induced changes in soft tissue density thickness on the study of radiation-induced perfusion changes in the lung and heart. Med. Phys. 2012, 39, 7644–7649. [Google Scholar] [CrossRef] [Green Version]
- Mattonen, S.A.; Palma, D.A.; Haasbeek, C.J.; Senan, S.; Ward, A.D. Distinguishing radiation fibrosis from tumour recurrence after stereotactic ablative radiotherapy (SABR) for lung cancer: A quantitative analysis of CT density changes. Acta Oncol. 2013, 52, 910–918. [Google Scholar] [CrossRef]
- Diot, Q.; Kavanagh, B.; Schefter, T.; Gaspar, L.; Stuhr, K.; Miften, M. Regional normal lung tissue density changes in patients treated with stereotactic body radiation therapy for lung tumors. Int. J. Radiat. Oncol. Biol. Phys. 2012, 84, 1024–1030. [Google Scholar] [CrossRef]
- Lee, S.; Stroian, G.; Kopek, N.; AlBahhar, M.; Seuntjens, J.; El Naqa, I. Analytical modelling of regional radiotherapy dose response of lung. Phys. Med. Biol. 2012, 57, 3309–3321. [Google Scholar] [CrossRef]
- Palma, D.A.; van Sornsen de Koste, J.R.; Verbakel, W.F.; Senan, S. A new approach to quantifying lung damage after stereotactic body radiation therapy. Acta Oncol. 2011, 50, 509–517. [Google Scholar] [CrossRef] [PubMed]
- Ghobadi, G.; Hogeweg, L.E.; Faber, H.; Tukker, W.G.; Schippers, J.M.; Brandenburg, S.; Langendijk, J.A.; Coppes, R.P.; van Luijk, P. Quantifying local radiation-induced lung damage from computed tomography. Int. J. Radiat. Oncol. Biol. Phys. 2010, 76, 548–556. [Google Scholar] [CrossRef]
- Al Feghali, K.A.; Wu, Q.C.; Devpura, S.; Liu, C.; Ghanem, A.I.; Wen, N.W.; Ajlouni, M.; Simoff, M.J.; Movsas, B.; Chetty, I.J. Correlation of normal lung density changes with dose after stereotactic body radiotherapy (SBRT) for early stage lung cancer. Clin. Transl. Radiat. Oncol. 2020, 22, 1–8. [Google Scholar] [CrossRef] [PubMed] [Green Version]
- Wuschner, A.E.; Wallat, E.M.; Flakus, M.J.; Shanmuganayagam, D.; Meudt, J.; Christensen, G.E.; Reinhardt, J.M.; Miller, J.R.; Lawless, M.J.; Baschnagel, A.M.; et al. Radiation-induced Hounsfield unit change correlates with dynamic CT perfusion better than 4DCT-based ventilation measures in a novel-swine model. Sci. Rep. 2021, 11, 13156. [Google Scholar] [CrossRef] [PubMed]
- Hirose, T.-A.; Arimura, H.; Ninomiya, K.; Yoshitake, T.; Fukunaga, J.-I.; Shioyama, Y. Radiomic prediction of radiation pneumonitis on pretreatment planning computed tomography images prior to lung cancer stereotactic body radiation therapy. Sci. Rep. 2020, 10, 20424. [Google Scholar] [CrossRef]
- Cunliffe, A.; Armato, S.G., 3rd; Castillo, R.; Pham, N.; Guerrero, T.; Al-Hallaq, H.A. Lung texture in serial thoracic computed tomography scans: Correlation of radiomics-based features with radiation therapy dose and radiation pneumonitis development. Int. J. Radiat. Oncol. Biol. Phys. 2015, 91, 1048–1056. [Google Scholar] [CrossRef] [Green Version]
- Zhang, T.; Zhou, Z.; Bi, N.; Wang, J.; Wang, L.; Deng, L.; Feng, Q.; Liang, J.; Xiao, Z.; Chen, D.; et al. VMAT for Unresectable Locally Advanced NSCLC Does Not Increase the Risk of Radiation Pneumonitis Compared with IMRT. Int. J. Radiat. Oncol. Biol. Phys. 2019, 105, E543. [Google Scholar] [CrossRef] [Green Version]


| Patient Characteristics | Number (%) | Median (Range) | |
|---|---|---|---|
| Age | 64 (42–83) | ||
| Gender | Male | 31 (67) | |
| Female | 15 (33) | ||
| AJCC Stage | IIB | 3 (7) | |
| IIIA | 30 (65) | ||
| IIIB | 13 (28) | ||
| Fractionation Schedule | 6 weeks | 36 (78) | |
| 5 weeks | 10 (22) | ||
| Radiotherapy Technique | Conformal 3D | 45 (98) | |
| VMAT | 1 (2) | ||
| Prescribed dose (Gy) | 66.75 (63–73) | ||
| PTV (Planning Tumour Volume) (cm3) | 360.00 (139–821) | ||
| MLD (Mean Lung Dose) | 14.56 (8.75–19.96) | ||
| Lung V20 Gy | 22.58 (13.86–43.61) | ||
| Progression | All | 20 (43) | |
| Loco-regional | 15 (33) |
| Metric | Time Point | Available (out of 46) |
|---|---|---|
| FVC | Baseline | 46 |
| 3 m | 43 | |
| 6 m | 40 | |
| 12 m | 40 | |
| 24 m | 35 | |
| FEV1 | Baseline | 46 |
| 3 m | 43 | |
| 6 m | 40 | |
| 12 m | 40 | |
| 24 m | 36 | |
| TLCO | Baseline | 46 |
| 3 m | 40 | |
| 6 m | 37 | |
| 12 m | 38 | |
| 24 m | 35 | |
| MRC Score | Baseline | 43 |
| 3 m | 43 | |
| 6 m | 43 | |
| 12 m | 41 | |
| 24 m | 40 |
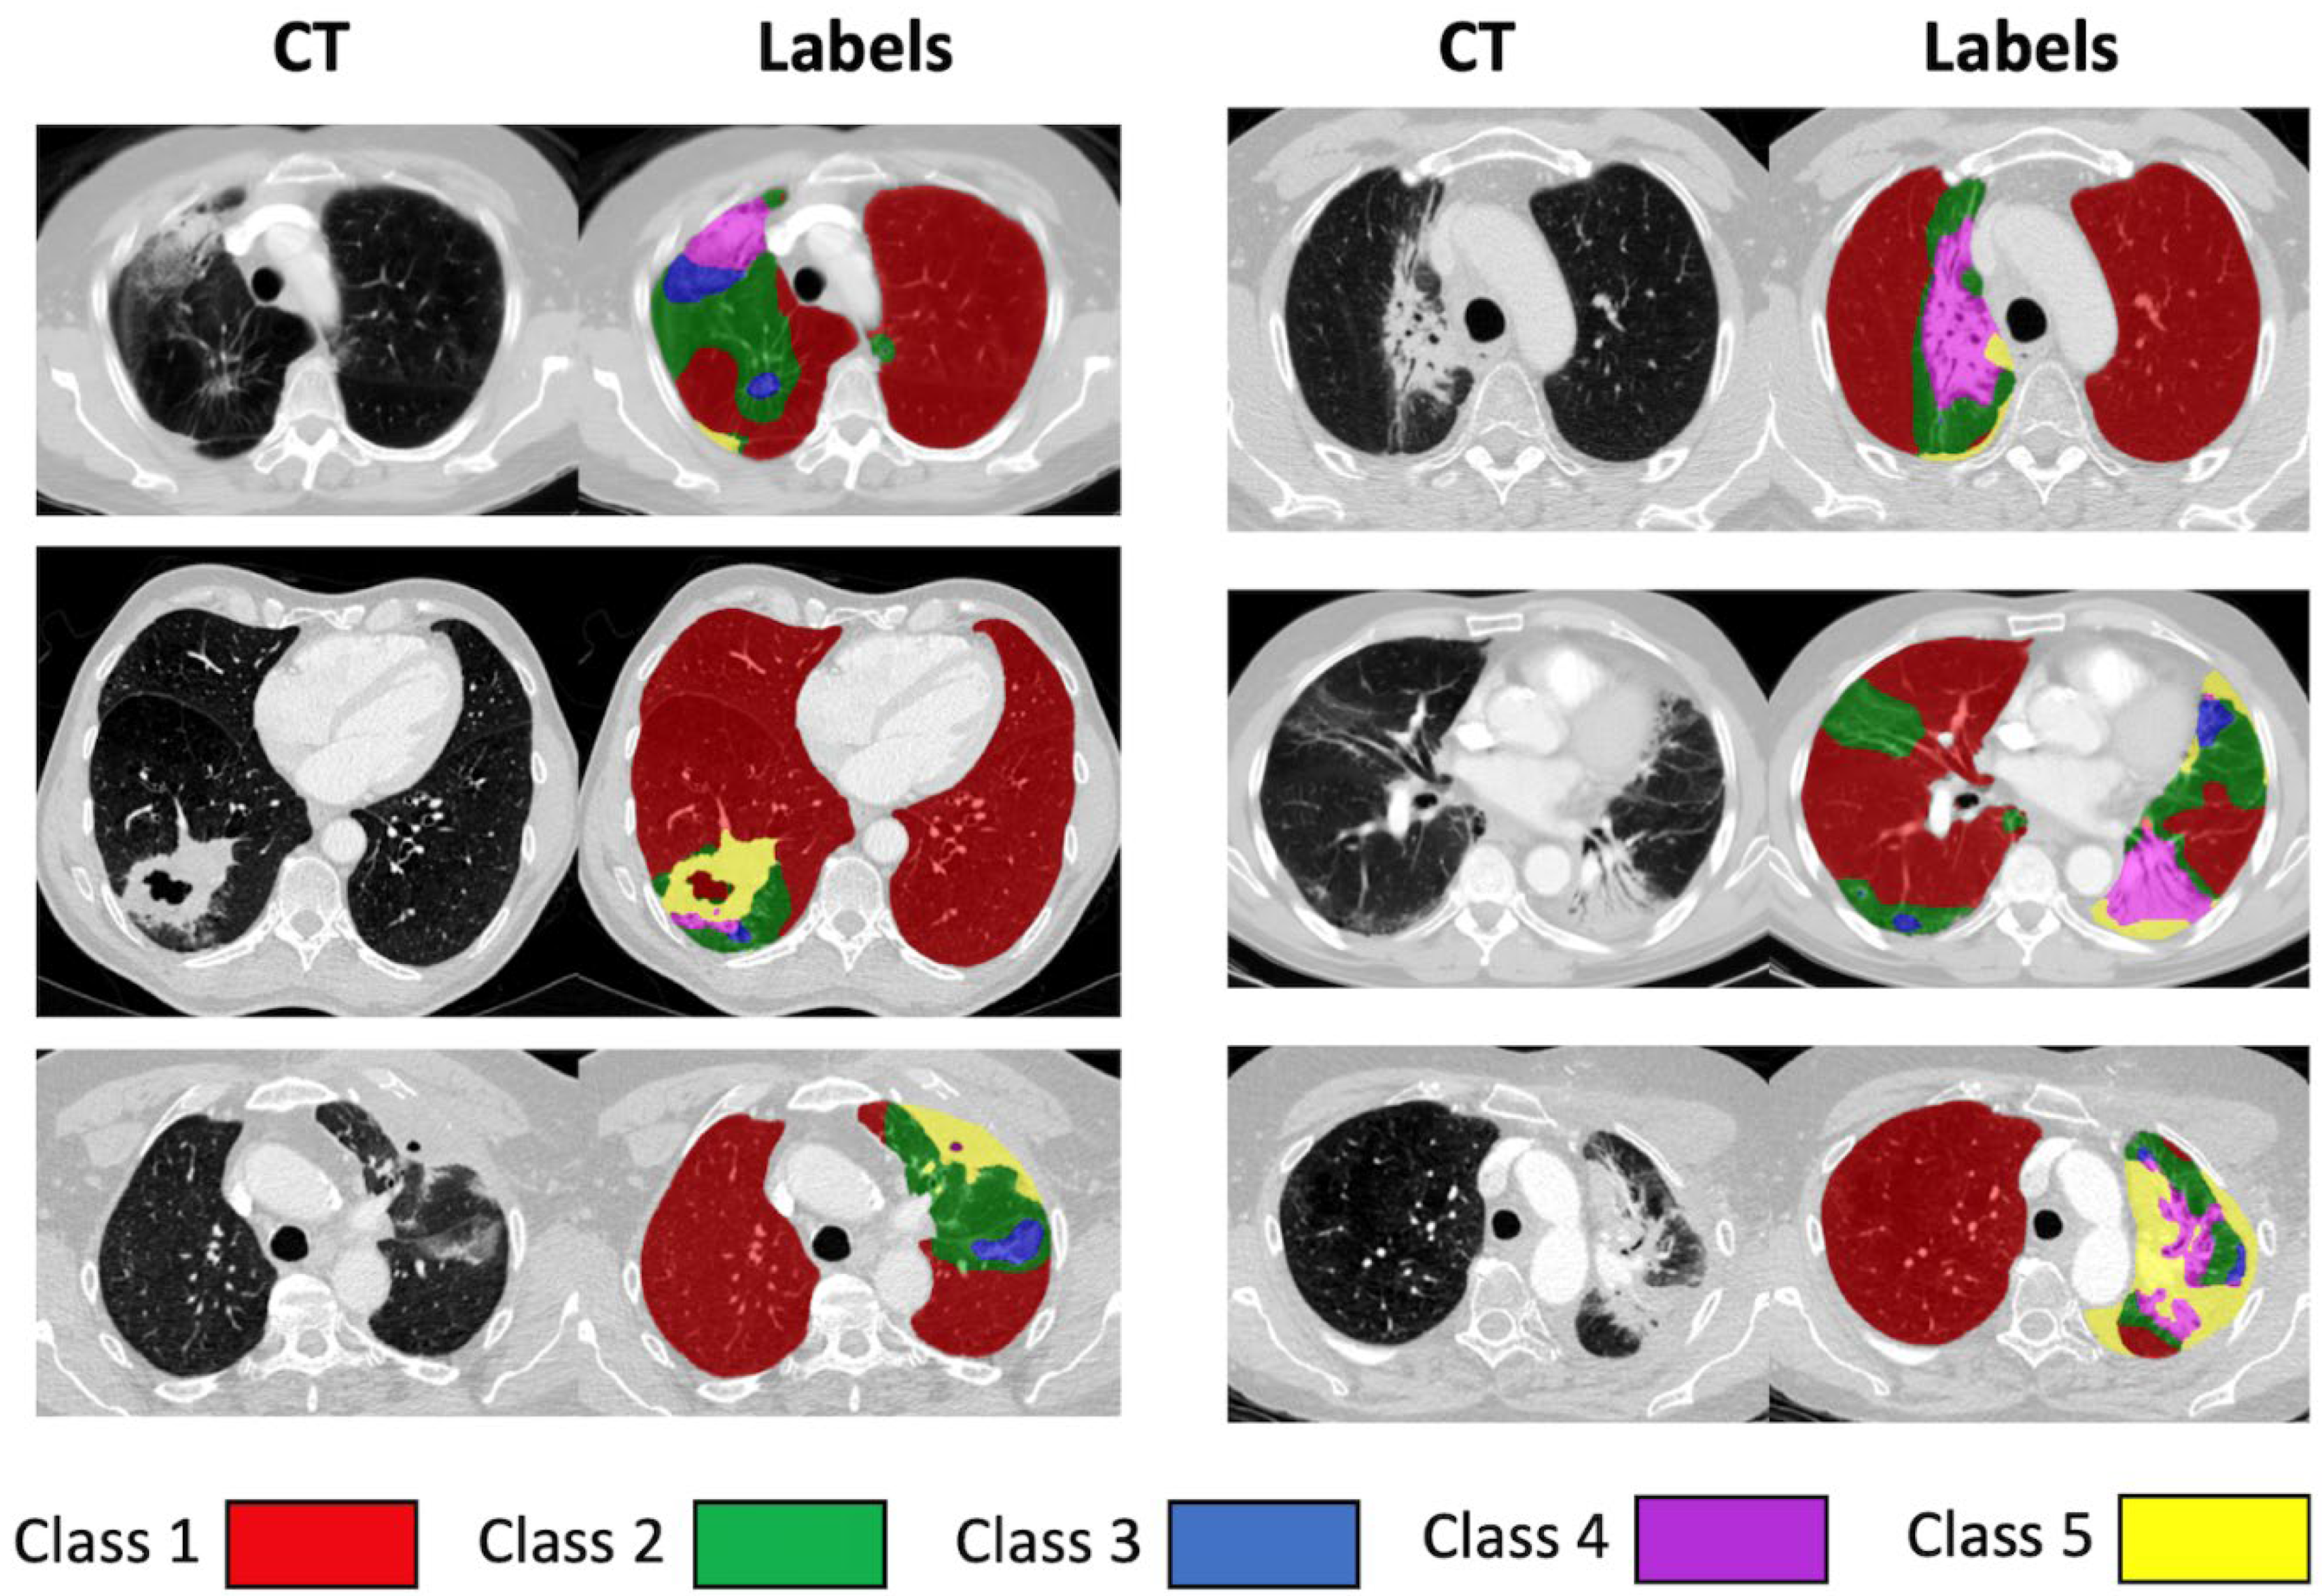
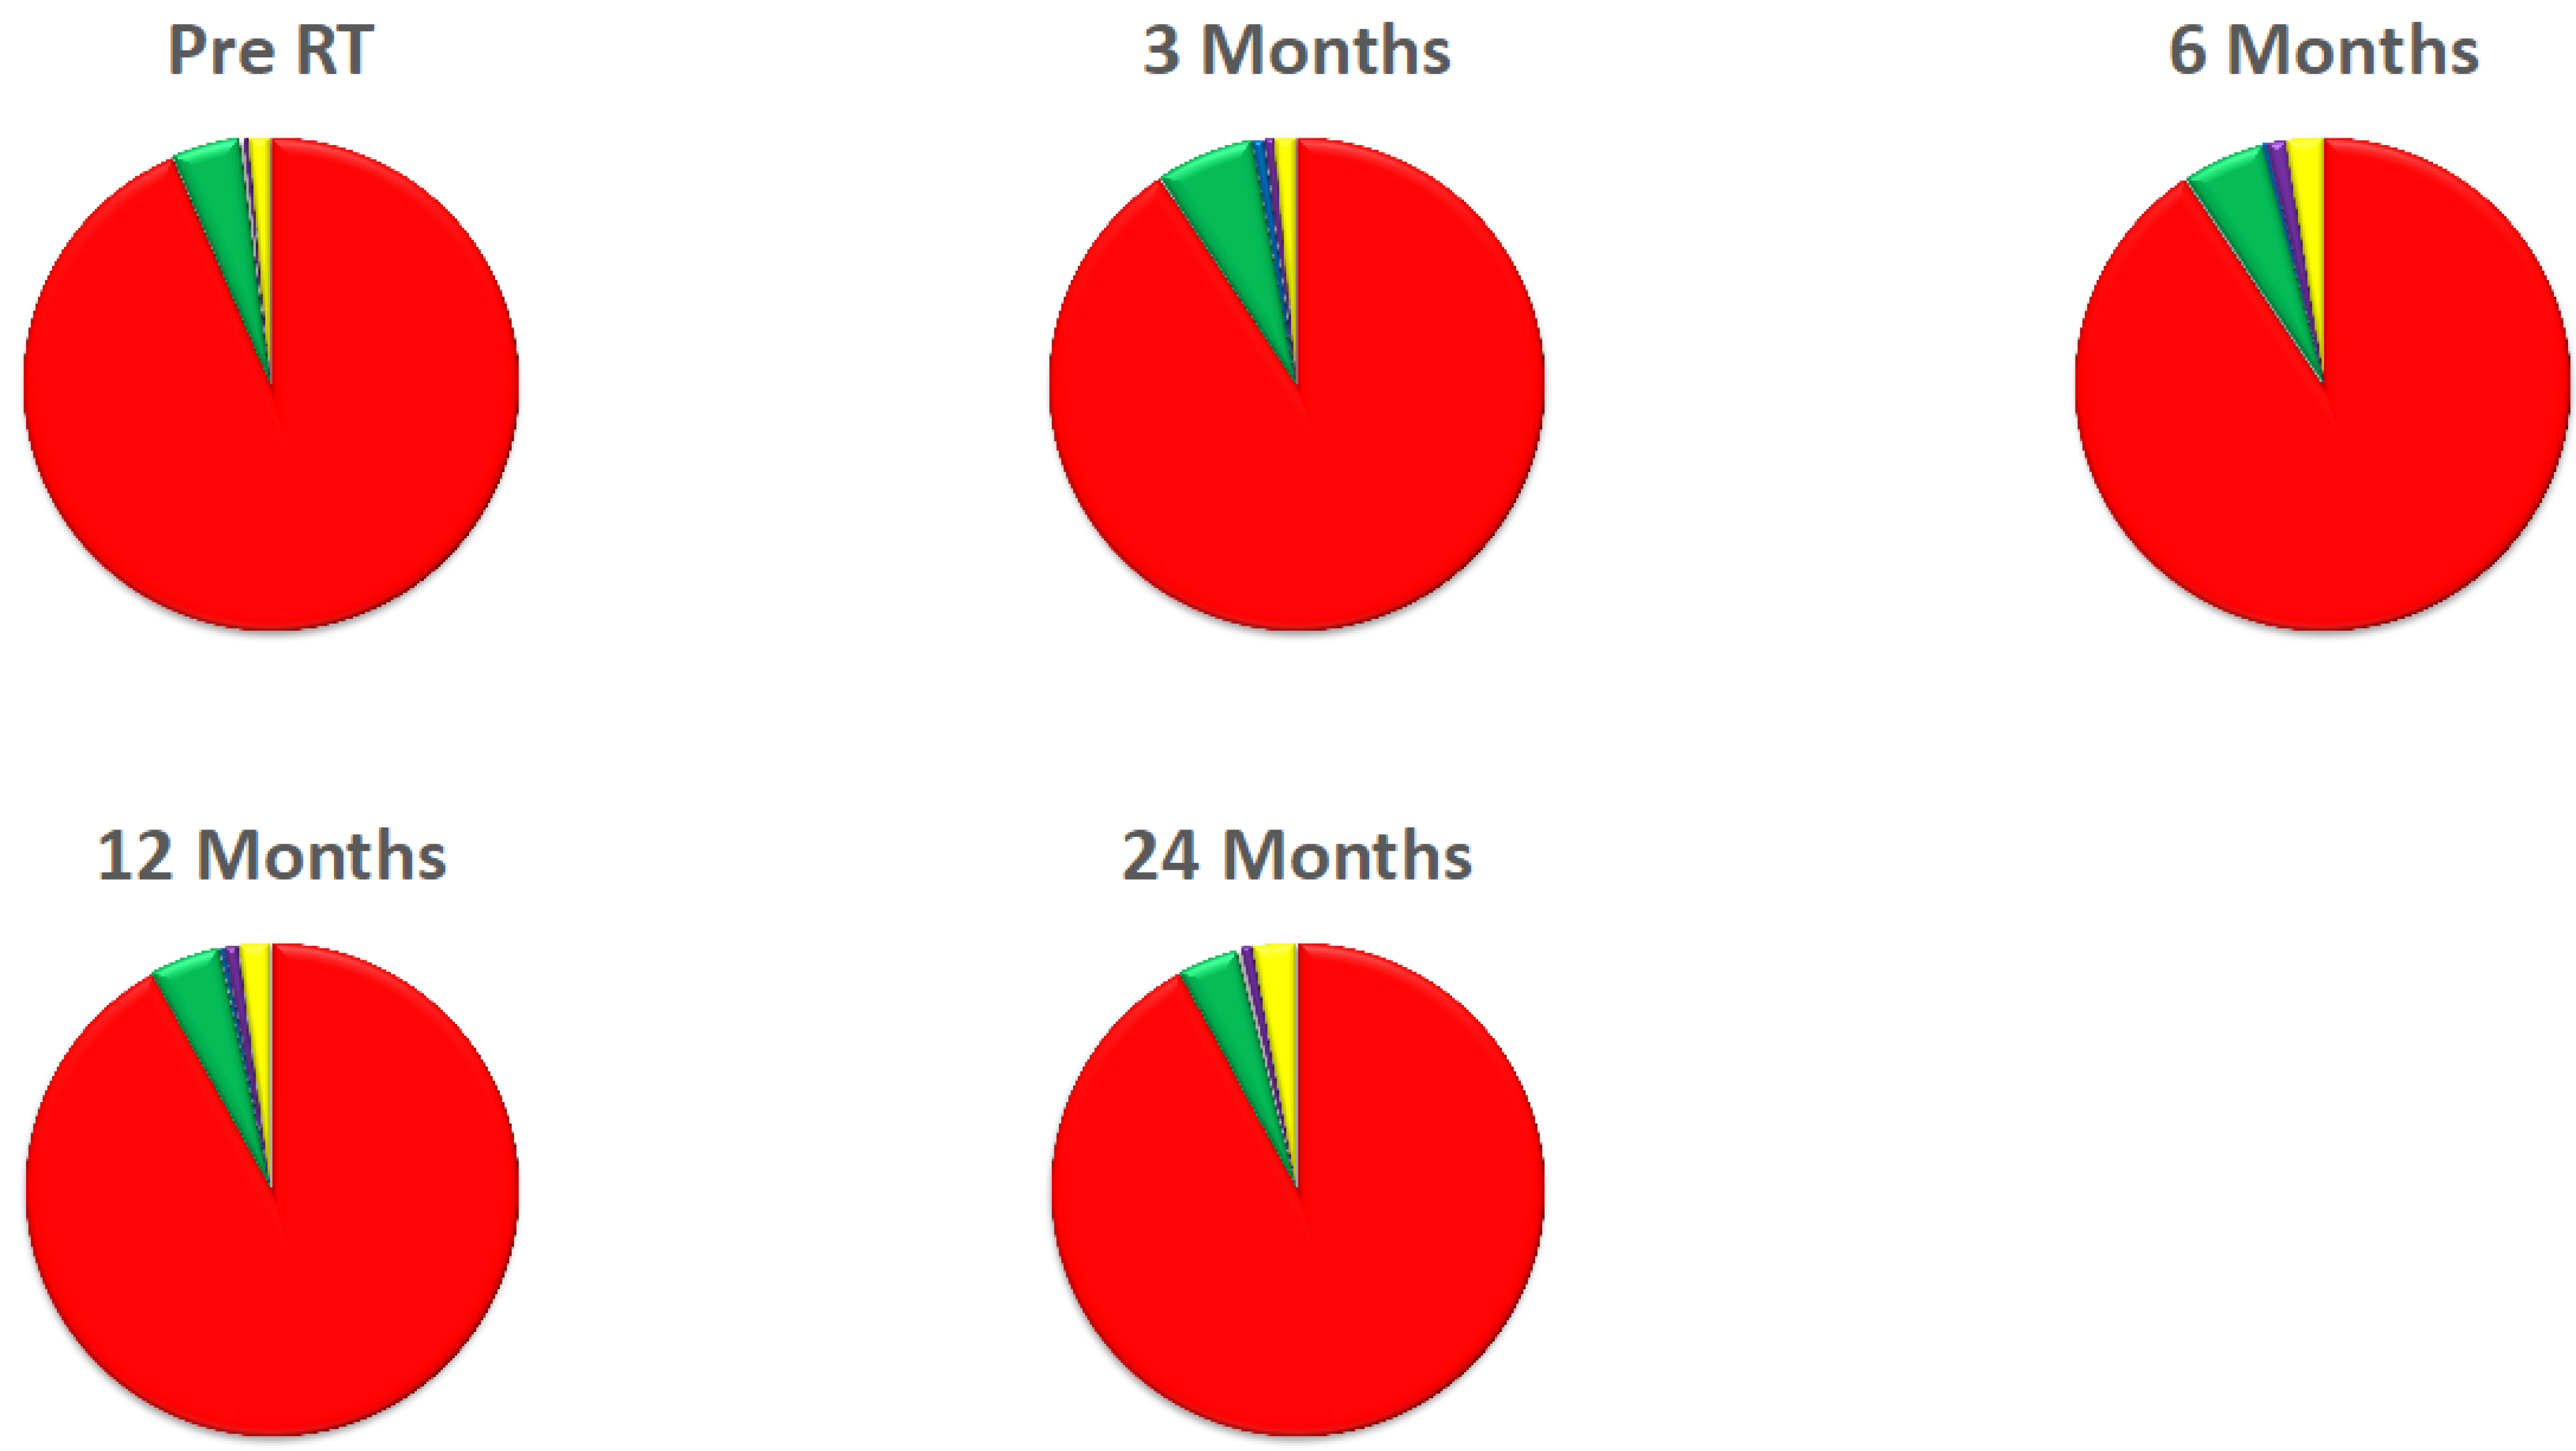
| Class | Description |
|---|---|
| 1 | Normal, healthy or emphysematous lung, without any high-density abnormality and representing most of the lung parenchymal tissue prior to radiation, as well as areas not affected during the radiotherapy. |
| 2 | Areas mostly characterised by changes similar to ground-glass opacity. |
| 3 | Areas with mixed ground-glass opacity and overlaid reticulation. |
| 4 | Mostly solid lung tissue, either aerated opaque tissue or tissue with a density just below dense opacity. |
| 5 | Homogeneous, dense lung tissue, which could represent a number of pathological entities, including tumour, pleural effusion or collapse. |
Publisher’s Note: MDPI stays neutral with regard to jurisdictional claims in published maps and institutional affiliations. |
© 2022 by the authors. Licensee MDPI, Basel, Switzerland. This article is an open access article distributed under the terms and conditions of the Creative Commons Attribution (CC BY) license (https://creativecommons.org/licenses/by/4.0/).
Share and Cite
Chandy, E.; Szmul, A.; Stavropoulou, A.; Jacob, J.; Veiga, C.; Landau, D.; Wilson, J.; Gulliford, S.; Fenwick, J.D.; Hawkins, M.A.; et al. Quantitative Analysis of Radiation-Associated Parenchymal Lung Change. Cancers 2022, 14, 946. https://doi.org/10.3390/cancers14040946
Chandy E, Szmul A, Stavropoulou A, Jacob J, Veiga C, Landau D, Wilson J, Gulliford S, Fenwick JD, Hawkins MA, et al. Quantitative Analysis of Radiation-Associated Parenchymal Lung Change. Cancers. 2022; 14(4):946. https://doi.org/10.3390/cancers14040946
Chicago/Turabian StyleChandy, Edward, Adam Szmul, Alkisti Stavropoulou, Joseph Jacob, Catarina Veiga, David Landau, James Wilson, Sarah Gulliford, John D. Fenwick, Maria A. Hawkins, and et al. 2022. "Quantitative Analysis of Radiation-Associated Parenchymal Lung Change" Cancers 14, no. 4: 946. https://doi.org/10.3390/cancers14040946
APA StyleChandy, E., Szmul, A., Stavropoulou, A., Jacob, J., Veiga, C., Landau, D., Wilson, J., Gulliford, S., Fenwick, J. D., Hawkins, M. A., Hiley, C., & McClelland, J. R. (2022). Quantitative Analysis of Radiation-Associated Parenchymal Lung Change. Cancers, 14(4), 946. https://doi.org/10.3390/cancers14040946