Simple Summary
A deep learning model based on multi-omics data to classify Nottingham prognostic Index score levels. The model represents each omic dataset using 2-dimensional map before integrating all omics maps into the prediction model. The literature confirms the relationship between the extracted omics features with the progression and survival of breast cancer.
Abstract
The Nottingham Prognostics Index (NPI) is a prognostics measure that predicts operable primary breast cancer survival. The NPI value is calculated based on the size of the tumor, the number of lymph nodes, and the tumor grade. Next-generation sequencing advancements have led to measuring different biological indicators called multi-omics data. The availability of multi-omics data triggered the challenge of integrating and analyzing these various biological measures to understand the progression of the diseases. High-dimensional embedding techniques are incorporated to present the features in the lower dimension, i.e., in a 2-dimensional map. The dataset consists of three -omics: gene expression, copy number alteration (CNA), and mRNA from 1885 female patients. The model creates a gene similarity network (GSN) map for each omic using t-distributed stochastic neighbor embedding (t-SNE) before being merged into the residual neural network (ResNet) classification model. The aim of this work was to (i) extract multi-omics biomarkers that are associated with the prognosis and prediction of breast cancer survival; and (ii) build a prediction model for multi-class breast cancer NPI classes. We evaluated this model and compared it to different high-dimensional embedding techniques and neural network combinations. The proposed model outperformed the other methods with an accuracy of 98.48%, and the area under the curve (AUC) equals 0.9999. The findings in the literature confirm associations between some of the extracted omics and breast cancer prognosis and survival including CDCA5, IL17RB, MUC2, NOD2 and NXPH4 from the gene expression dataset; MED30, RAD21, EIF3H and EIF3E from the CNA dataset; and CENPA, MACF1, UGT2B7 and SEMA3B from the mRNA dataset.
1. Introduction
Breast cancer (BC) is one of the most common cancers and leading cause of cancer death in women worldwide [1], accounting for 30% of female cancers [2]. BC is a heterogeneous disease that consists of several subtypes which have been identified at the clinical, molecular, genomic, and histological levels. Early detection and intervention are proven to be effective in increasing survival rates and improving prognosis [3]. The Nottingham Prognosis Index (NPI) is an index to determine prognosis following surgery for BC [4]. Various studies have validated the prognostic discrimination [5,6,7] and NPI is widely used in clinical practice. It is a well-established prognostic classification scheme for patients with breast cancer [8]. NPI combines the nodal status, tumor size and histological grade in a simple formula:
where:
S is the size of the index lesion in centimeters;
N is the node status—0 nodes = 1, 1–3 nodes = 2, >3 nodes = 3;
G is the grade of the tumor—grade I = 1, grade II = 2, and grade III = 3 [9].
Understanding the prognosis of BC is vital for selecting the right treatment [10]. Patients with a very poor prognosis may be considered for aggressive treatment, or those with excellent prognosis may receive light treatment. These practices lead to health side-effects and financial costs [10,11]. In clinical practice, NPI is an important index that influences the decision of whether or not to undergo adjuvant chemotherapy following surgery. Recent studies have indicated that NPI still outperforms other prognostics models [10,12]. Phung et al. studied 58 prognosis models which predict mortality, recurrence, or both. Most of the models perform well in most cohorts but are less accurate on the independent populations, except NPI, which retains its prediction ability in most independent populations [10]. Sejben et al. studied the survival of 136 triple-negative breast cancer (TNBC). TNBC is generally known as a poor prognosis BC subtype. The study compared three prognostics models that are NPI, PREDICT [13] and PrognosTILs [14]. None of the three models are inferior to the others; however, NPI outperforms the others in the area under the curve (AUC) prediction measurement [12].
Machine learning models have also been used in breast cancer prognosis prediction [15,16]. Boeri et al. investigated the standard machine learning classifiers to predict three outcomes that are loco-regional cancer recurrence, systematic cancer recurrence, and death from the disease within 32 months. The results show that the artificial neural network (ANN) and support vector machine (SVM) outperformed some other standard classifiers with an accuracy higher than 95% for the three classes [15]. Ferroni et al. applied a machine learning model based on demographic, clinical, and biochemical data to predict breast cancer survival. The model incorporated multiple kernel learning (MKL) based on support vector machines (SVMs) combined with random optimization (RO) models to extract the discriminative features and build the classification model. The results show that NPI was one of the clinical features that strongly influenced survival [16].
In an earlier work, we proposed a ResNet model based on the t-SNE embedding method to classify two classes of patients; with versus where 3.4 is the cut-off between the high survival rate and low survival rate. The model was applied on two omics that are gene expression and CNA [17]. In this work, we extending the prediction criteria to include all NPI classes that are seen in Table 1. The idea is to extract potential omics biomarkers for all levels of NPI values.

Table 1.
NPI levels and their 5-year survival rate.
2. Materials and Methods
Materials
For the selected samples, we extracted three omics from the METABRIC dataset which were gene expression, mRNA, and copy number alteration (CNA) [18]. The numbers of features for all omics are listed in Table 2.
Table 2.
Datasets after sample and gene mapping.
The clinical characteristics of the study population such as hormone receptor expression, HER2 status, adjuvant treatments, and tumor size and laterality among other features can be found on this portal (https://www.cbioportal.org/study/clinicalData?id$=$brca_metabric accessed on 2 February 2022).
3. Methods
The methods section starts with pre-processing the dataset, applying a hybrid feature selection approach, data embedding, and the prediction model.
3.1. Pre-Processing
Genome-wide data have the characteristics of high-dimensionality. In addition, it also suffers from data incompleteness due to sequencing technology or loss of biological information. To keep the reliability of the data, we dropped the patients with missing values into three omics datasets. As a result, the dataset ended up with 1885 samples.
3.2. Feature Selection
A hybrid feature selection approach was applied to select each omic dataset’s best possible subset of features. It consists of ranker and wrapper feature selection methods. The ranker chi-square was applied to the three omics datasets to choose 1000 top genes, followed by the wrapper that works as the following:
Chi-Square Pearson’s chi-squared test, called chi-square [19], is a statistical ranker-based feature selection method that selects top N features that are sensitive to the label. Equations (2)–(4) show how chi-square works, by which we decided to select the top 1000 features from 16,041 features in the gene expression dataset. For a specific gene, we first sum up the expression level according to the label as the observed values. It then counts the number of samples belonging to each class, divided by the total number of samples, which is the class probability. The class probabilities are multiplied by the sum of the expression level of that gene, and we call the result the expected value.
Finally, the square of the difference between the observed value and the expected value is divided by the expected value. The sum of the obtained results is the chi value of the individual gene. In our experiment, we picked up the top 1000 genes:
where:
is the number of samples belonging to class c;
i is the ith sample, ;
j is the jth feature, ;
c is the cth class, ;
N is the total number of samples.
mRMR is a wrapper feature selection algorithm that finds a compact subset of superior features with the characteristics of maximal relevance to the class, that is D(S,c) and minimal redundancy in the feature subset, that is, R(S), according to the maximal statistical dependency criterion based on mutual information, described in Equations (5) and (6):
where:
S is the subset of superior features;
c is the label class;
, are the sample vectors of the ith and jth features, respectively, with the shape of 1 × N (N is the number of samples).
In this work, mRMR incorporates the random forest classifier [20] with forward search feature selection to obtain the best possible subset of features that represent each omic dataset.
3.3. t-SNE
t-SNE is a non-linear dimensionality reduction technique used to embed high-dimensional data points into a lower-dimensional space to seek a pattern that represents the original feature map [21]. The feature map reflects the underlying relationship among the marker genes in terms of biological pathway or functionality in three datasets, which is called the gene similarity network (GSN) map. The Euclidean distance in the high-dimensional space decides the pairwise similarities among samples in the lower dimensional space. t-SNE applies a t-student distribution to avoid a crowding problem as shown in Equations (7) and (8):
where:
is the joint probability in the high dimensional space;
and are the conditional probability in the high dimensional space.
In the high dimensional space:
where:
is the joint probability in the low-dimensional space:
where:
is the gradient descent.
3.4. ResNet
In a residual neural network [22], the aim is to find a function in the class of function F to best represent the relationship between dataset X and its label y, which means that the distance between X and y is minimal, as shown in Equation (12). In a residual neural network, He et al. suggested an optimal function in the output layer. It can be expressed as the sum of identity mapping and the residual function as shown in Equation (10) [22]:
where:
is the optimal function;
is the residual function;
x is the identity mapping.
In ResNet, the residual learning is applied to every few stacked layers, which is called a block shown in Figure 1. In the output layer of each block, there is an identity mapping by shortcuts, and the output y can be expressed by the product dot of the weight vector and input x, before being added to the identity mapping x, as shown in Formula (11):
where:
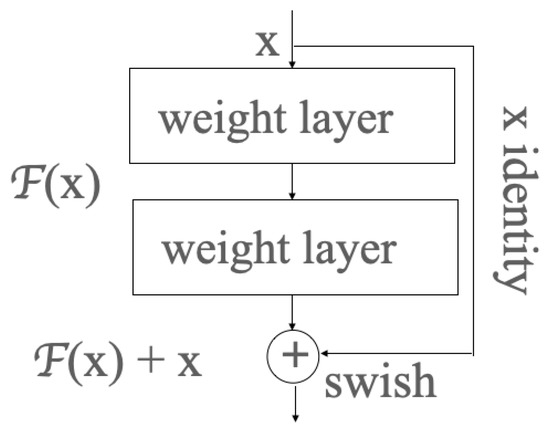
Figure 1.
One block in the residual neural network.
X is the input vector;
Y is the output vector;
represents the residual mapping to be learned:
where:
X is the input data;
y is the label or class;
is the function, in which X can find its minimal distance to y;
F is the class of functions comprising many functions to represent the pattern between input data and labels.
3.5. SOM
SOM is a simple neuron network algorithm that allows us to investigate the intrinsic relationships among samples of a dataset. As such, the data points with the smallest weights to the winning neuron will be grouped in the same cluster, forming the GSN as a result, then colored by the transformed sequencing values of the three omics datasets in a merged way or a concatenated way.
Ideally, the GSN reveals the closeness of the most informative genes in terms of biological pathways or functionality. Therefore, the “colored template” represents each NPI class based on the relationship among their marker genes. Figure 2 and Figure 3 show the t-SNE–GSN and SOM–GSN template creating and coloring in a concatenated way model that is seen in Figure 4. In contrast, the marker genes in the t-SNE–GSN map have an even distribution, leading to a capacity to hold more marker genes inside than the SOM–GSN map.
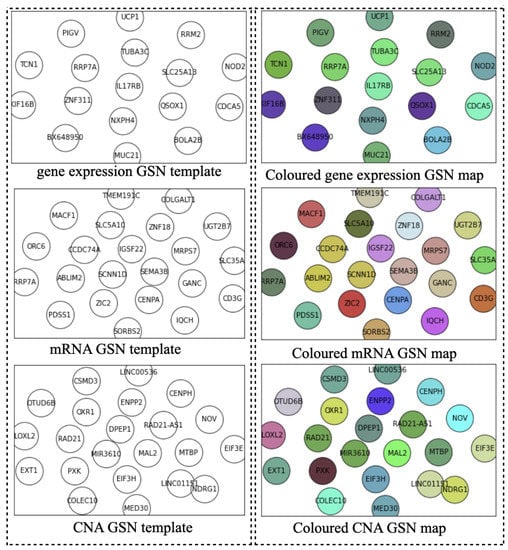
Figure 2.
Templates of three omics datasets embedded by t-SNE (concatenated).
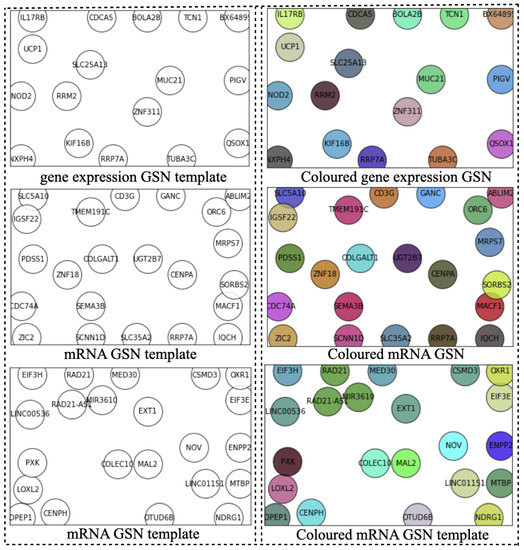
Figure 3.
Templates of three omics datasets embedded by SOM (concatenated).
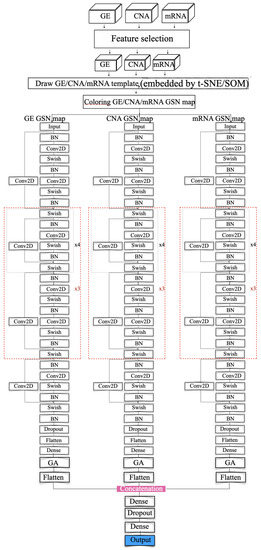
Figure 4.
Resnet modeling (concatenated).
4. Experiments and Results
To keep the highest possible meaningful information in the three omics datasets, the hybrid feature approach selected 1000 genes using chi-square for each omic dataset. Then, the wrapper method selected 17 genes from the gene expression dataset, 22 genes from the mRNA dataset, and 22 target genes from the CNA dataset separately, as shown in Table 3.
Table 3.
Target genes in three datasets.
In the second step, we drew the GSN maps using t-SNE and SOM embedding methods separately for each dataset in a concatenated way, or only using the gene expression dataset in a merged way as seen in Figure 2, Figure 3 and Figure 5B. The left template is created by SOM, and the right template is drawn by t-SNE. Then, the templates are colored by combining the three omic datasets in Figure 5.
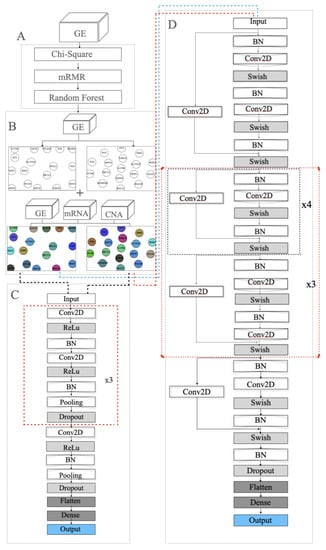
Figure 5.
Modelling in the merged approach: (A) feature selection using chi-square, mRMR and random forest; (B) SOM and t-SNE embedding to draw two 2D templates of the 22 selected genes. The left template was made by SOM and the right template was drawn by t-SNE. The templates are colored by combining the three omic datasets; (C) the 33-layer VGG model; (D) the 112-layer ResNet model.
In the third step, we colored the GSN maps for each sample in the three omic datasets separately. In a concatenated way, the color is the helix values of the normalized genes by logarithmic and z-score normalization methods. In the merged way, the color is the RGB values of the normalized sequencing data, in which R represents the gene expression dataset, G represents the CNA dataset, while B represents the mRNA dataset. Therefore, the colored GSN maps reflect the relationships among the genes in each sample, the characteristics of the position, and the pixel.
Before feeding the ResNet model with the GSN maps as the inputs, the number of colored GSN maps was boosted by applying data augmentation, intending to solve the imbalanced problem and increase the recognition rate. Elastic argumentation was utilized and alpha was set to be 15–18. The new dataset seems fine; the characteristics are in a reasonable range compared with the original images.
In the training step, several models were investigated including VGG and ResNet. Figure 5C,D show the VGG model and modified ResNet model that were applied to train the GSN maps that were embedded by SOM and t-SNE in the merged approach. Figure 4 depicts the proposed model that concatenates three ResNet models to train the three collections of GSN maps, separately extracting the features of position and pixel. Then, the features are combined and build the final classification model.
The ResNet model is an extension of the VGG model, but it removes the dropout layer, pooling layer and adds a one-by-one ConvNet layer to the end of the ResNet block. The model ended up having a ResNet model that consists of 112 layers. In the beginning, batch normalization normalizes the image pixels and feeds the normalized inputs to a ConvNet layer with “same” padding layer to protect the marginal features and the “Swish” activation function to smoothly transform the inputs and repeat. Then the mapping layer, which is another difference with VGG, is added to the end to calculate the residual and optimize the weights. After that, a four-layer ResNet block with a 1 × 1 ConvNet mapping layer is repeated four times and followed by a five-layer ResNet block. The former blocks are repeated three times. Then, a four-layer of the ResNet block is added. At the end of the feature-extraction process, the result is normalized again.
In the classification process, we adopted a flattened layer and a dense layer as VGG does. In the end, the softmax probability function is used for the prediction.
The model has two kinds of ResNet blocks with four and five layers, respectively. Each ConvNet layer has a 7 × 7 kernel, and the stride size is 1. The ConvNet layer contains a 1 × 1 kernel in the mapping layer, and the stride size is 2 for downsampling. At the end of the feature extraction, the VGG model incorporates a flatten layer and fully connected layer with the softmax probability function to output a 5D array with values ranging from 0 and 1.
The ResNet model incorporates the average pooling layer instead of the fully connected layer. The loss functions in the two different models are categorical entropy loss functions. The model uses "accuracy" and "AUC" as performance metrics. It extensively extracts the features and classifies the inputs using softmax for probability calculation. Equation (13) shows the softmax probability function:
where:
X is the sample vector;
is the weight vector of jth feature;
K is the number of features—which here is 22.
Table 4 and Table 5 show the performance of our proposed model and other similar models for comparison. Among eight different models, the models in the concatenated way have higher accuracy and AUC, but lower loss in the training process. Conversely, predicting performance in the merged way outperforms that in the concatenated approach since the models have higher validation accuracy.
Table 4.
Performance comparison among classifiers and embedding methods (merged).
Table 5.
Performance comparison among classifiers and embedding methods (concatenated).
5. Conclusions
The Nottingham Prognosis Index (NPI) is a prognosis measure employing following surgery for BC. In this work, multi-omics features that are associated with NPI classes were extracted using a hybrid feature selection method. The selected features were represented in 2-dimensional GSN maps using the t-SNE method. The maps from different omics were fed into a deep residual neural network for classification.
The main limitation of this work was not considering more clinical features in the analysis including race, age, and response to different therapies. From the computational side, the model can be more flexible to add more sources of data (omics). A future work can be to try the Mahalanobis instead of Euclidean distance in the t-SNE GSN mapping, since it has recently been used in prognostics and survival predictions with interesting results [23,24].
6. Biological Insight
Genes extracted from the gene expression omic dataset that play key roles in the development of breast cancer are CDCA5, IL17RB, MUC2, NOD2, and NXPH4. CDCA5 is a cell division cycle-associated (CDCA) gene family member. Specifically, it controls sister-chromatid cohesion and separation during cell division. Phan et al. screened the mRNA expression of the CDCA genes and found that the expression of CDCA5, along with CDCA3 and CDCA8, was significantly high compared to the control sample. The high expression of these genes in tumors dramatically reduced patient survival, which has the potential for being a target for breast cancer therapies [25]. According to another study by Zhang et al., CDCA5 also has the potential to become a prognostic strategy because it has been found to be significantly upregulated in gastric cancer (GC) tissues. When CDCA5 was inhibited in gastric cancer cells, it suppressed their proliferation, demonstrating how CDCA5 promotes GC tumor progression [26].
IL17RB is a member of the IL17 gene family. IL17 genes encode pro-inflammatory cytokines produced from inflammatory diseases such as breast cancer. One of the IL17 genes is IL17B, which binds to its receptor, IL17RB. The IL17RB signaling pathway plays a key role in its progression, so targeting this pathway is a potential therapeutic pathway for breast cancer inhibition [27]. Alinejad et al. demonstrated that the IL17RB signaling pathway triggers an increase in cell growth through the activation of NF-KB and Bcl-2 [27].
MUC2 is a member of the Mucins family, which are glycoproteins expressed and secreted as mucus by epithelial cells and their malignant counterparts [28]. MUC2 is a protein that is highly expressed in mucin secreted breast cancers. MUC2 plays an important role in mediating the proliferation, apoptosis and metastasis of breast cancer [29].
NOD2 is an innate immune receptor that is associated with the onset and progression of triple-negative breast cancer (TNBC). The overexpression of NOD2 is shown to reduce cell proliferation. The pathways that link NOD1 and NOD2 signaling to tumorigenesis have been studied. Velloso et al. found that the up- and downregulation of inflammatory proteins can promote protein degradation systems and modulate cell cycle and cell adhesion proteins [30].
NXPH4 is a mitochondria-related core gene involved in the progression of breast cancer. Yan et al. found that NXPH4 is upregulated in breast cancer, which can be used as a potential biomarker for breast cancer prognosis and diagnosis [31].
One of the genes found in the CNA omic dataset is MED30, a core subunit in a group of mediator complex subunits that are mutated in various malignancies in glioblastoma (GBM), a malignant form of glial cell cancer. MED30 was found to be overexpressed in GBM tissues and cell lines, and was found to be induced by conditions present in tumor environments, such as hypoxia. MED30 contains hypoxia response elements (HREs) and a p53 binding site in its promoter region, showing that MED30 promotes cell proliferation while reducing migration capabilities in GBM cell lines. Its involvement in GBM pathogenesis has also revealed that MED30 is sensitive to the chemo drug temozolomide, suggesting its diagnostic and therapeutic potential [32]. MED30 has also been reported to be overexpressed in various breast cancer cell lines, along with MED1 and MED24 [33].
RAD21 is a gene that is believed to function in sister chromatid alignment and double-stranded break repair. Expression studies have revealed a 2-fold increased expression of RAD21 in human breast cancer cell lines compared to normal breast tissue. Atienza et al. conducted experiments with RNA interference technology and found that the proliferation of cells with RAD21-specific siRNA was reduced. This suppression of the RAD21 gene also enhanced the cytotoxicity of etoposide and bleomycin (two DNA-damaging chemotherapeutic agents), which revealed that by the induction of DNA damage, RAD21 can be a novel target for developing cancer therapeutics [34].
EIF3H is a gene that is involved in the pathway for the metabolism of proteins [35] and it is involved in the translation inhibition factor activity. Mahmood et al. performed siRNA screening in three breast cancer cell lines for candidate driver genes that are overexpressed in breast tumors. This study identified eight driver genes that were amplified and critical for breast tumor cell proliferation, including the EIF3H gene and some other well-described oncogenic drivers ERBB2, GRB7, RAD21 CHRAC1, and TANC2. Therefore, strategies for inhibiting the expression of these genes are of potential value for the treatment of breast cancers [36].
Another potential gene biomarker in the CNA dataset is EIF3E, a translation factor associated with breast cancer occurrence which is related to EIF3H. It has been previously shown that EIF3E deficiency leads to an impaired DNA damage response along with a marked decrease in DNA repair via homologous recombination. Mahmood et al. found that EIF3E-depleted cells synthesized lower amounts of PARP1 protein, and the mTORC1 signaling pathway is more activated. These PARP1 and mTORC1 dysfunctions are linked to the induction of cellular senescence, which provides mechanistic insights into how EIF3E protects against breast cancer. Findings suggest that these cancers may benefit from mTORC1 inhibitor drugs [37].
Another gene found in the CNA dataset is MAL2, a gene identified to determine the turnover of the antigen-loaded MHC–I complex and reduces antigen presentation on a tumor cell, which promotes immune evasion. Fang et al. showed how MAL2 accomplishes this by promoting the endocytosis of tumor antigens by directly interacting with the MHC–I complex and endosome-associated RAB proteins. It has been shown that the suppression of MAL2 has enhanced the cytotoxicity of tumor-infiltrating CD8+ T cells and suppressed breast tumor growth, which suggests that this gene can be a potential biomarker for breast cancer therapy [38]. Genes extracted from the mRNA dataset, which show great significance in the development of breast cancer, are CENPA, MACF1, UGT2B7 and SEMA3B. Centromere protein-A, also known as CENPA, is a histone-like gene that is important for regulating chromosome segregation that occurs during cell division. It is a commercially available gene for prognostic breast cancer assays. Rajput et al. found that by measuring the immunohistochemical (IHC) expression of CENPA in tissues, breast cancer tissue had higher levels of IHC than normal breast tissue. They found that a higher IHC expression was correlated with a shorter disease-free survival (DFS), making CENPA a potential prognostic biomarker [39].
Microtubule actin cross-linking factor 1, also known as MACF1, is a gene that plays an essential role in various cellular processes such as proliferation and embryo development. It is also known to be a gene responsible for the development of breast cancer. MACF1 also plays a role in cytoskeleton organization in cells, which contributes to tumor progression, and the abnormal expression of MACF1 initiates proliferation, metastasis, and migration in breast cancer [40].
Uridine glucuronosyltransferase 2B7, also known as UGT2B7, is a gene that belongs to the UGT gene family, and it plays an essential role in the elimination of toxic xenobiotics and endogenous compounds. It is found in the microsome membrane [41]. Li et al. studied the occurrence of cytotoxicity in breast cancer patients undergoing chemotherapy along with the expression of the UGT2B7 gene. Their results showed that breast cancer patients with the UGT2B7 gene had a lower occurrence of cardiotoxicity [42]. It has also been found by Mou et al. that a gene in the UGT2B7 gene called RS745335 was associated with breast cancer patients receiving chemotherapy, therefore making RS745335 and UGT2B7 potential biomarkers for breast cancer [43].
Semaphorin 3B, also known as SEMA3B, is a gene that belongs to the semaphorin family and is important in the process of growth cone guidance during neuronal development [44]. Castro-Rivera et al. studied how SEMA3B acts as a tumor suppressor by inducing apoptosis. They found that another growth factor called VEGF165 binds to neuropilin, which is also a receptor for SEMA3B. It decreases the proapoptotic effect that SEMA3B had since it will competitively bind to those receptors. Therefore, it was concluded that VEGF165 was produced by tumor cells and was used as a surviving factor, and SEMA3B has tumor-suppressing effects by blocking this VEGF pathway [45]. In a related study by Castro-Rivera et al., it was found that SEMA3B induces apoptosis by inactivating the Akt signaling pathway through the Np-1 receptor [46].
To validate the used NPI classes as significant prognostics and survival patterns, we applied the Kaplan–Meier curve to estimate the relapse survival rate for each NPI class in the dataset as seen in Figure 6. The average relapse-free survival for NPI levels I, II, III and IV are 120, 125, 109 and 63 months accordingly. Figure 6D depicts the drastic drop in survival periods for NPI level IV samples, which explains the drop in the overall average 63 months down from 109 in level III. Relapse-free status includes those cases which in which there was recurrent loco-regional relapse, distant relapse, or death-specific death. The Figure confirms the different patterns of survivability for the NPI classes.
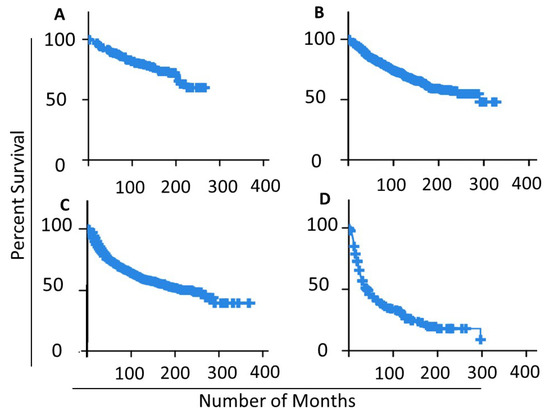
Figure 6.
Kaplan–Meier curve for different NPI classes in the studied samples: (A) NPI Level I samples; (B) NPI Level II samples; (C) NPI Level III samples; (D) NPI Level IV samples.
The advancement in NGS and artificial intelligence yield integrate multi-omics measurements in the prediction model. The literature analysis confirms the association between the extracted omics and the survival and prognosis of breast cancer. However, more wet-lab and data analysis of the extracted omics can verify the role of this subset of omics in the progression of the disease.
Author Contributions
Conceptualization, A.A.; methodology, L.Z.; software, L.Z.; validation, M.R.; formal analysis, L.Z.; investigation, A.A.; data curation, L.Z. All authors participated equally in writing—review and editing; visualization, L.Z.; supervision, A.A.; project administration, A.A.; funding acquisition, A.A. All authors have read and agreed to the published version of the manuscript.
Funding
This research received no external funding.
Institutional Review Board Statement
Not applicable.
Informed Consent Statement
Not applicable.
Data Availability Statement
The origincal dataset can be found at the following link: (https://www.cbioportal.org/study/clinicalData?id$=$brca_metabric, accessed on 2 February 2022).
Conflicts of Interest
The authors declare no conflict of interest.
Abbreviations
The following abbreviations are used in this manuscript:
| NPI | Nottingham Prognostic Index |
| CNA | Copy Number Alteration |
| t-SNE | t-Distributed Stochastic Neighbor Embedding |
| GSN | Gene Similarity Network |
References
- World Health Organization. Available online: https://www.who.int/news-room/fact-sheets/detail/cancer (accessed on 20 December 2021).
- National Nutrition Council Institute, N.N.C. Cancer facts & figures 2020. CA Cancer J. Clin. 2020, 70, 1–76. [Google Scholar]
- Houssami, N.; Ciatto, S.; Martinelli, F.; Bonardi, R.; Duffy, S. Early detection of second breast cancers improves prognosis in breast cancer survivors. Ann. Oncol. 2009, 20, 1505–1510. [Google Scholar] [CrossRef] [PubMed]
- Haybittle, J.; Blamey, R.; Elston, C.; Johnson, J.; Doyle, P.; Campbell, F.; Nicholson, R.; Griffiths, K. A prognostic index in primary breast cancer. Br. J. Cancer 1982, 45, 361–366. [Google Scholar] [CrossRef] [PubMed] [Green Version]
- Galea, M.H.; Blamey, R.W.; Elston, C.E.; Ellis, I.O. The nottingham prognostic index in primary breast cancer. Breast Cancer Res. Treat. 1992, 22, 207–219. [Google Scholar] [CrossRef]
- Todd, J.; Dowle, C.; Williams, M.; Elston, C.; Ellis, I.; Hinton, C.; Blamey, R.; Haybittle, J. Confirmation of a prognostic index in primary breast cancer. Br. J. Cancer 1987, 56, 489–492. [Google Scholar] [CrossRef] [Green Version]
- D’eredita, G.; Giardina, C.; Martellotta, M.; Natale, T.; Ferrarese, F. Prognostic factors in breast cancer: The predictive value of the nottingham prognostic index in patients with a long-term follow-up that were treated in a single institution. Eur. J. Cancer 2001, 37, 591–596. [Google Scholar] [CrossRef]
- Winzer, K.-J.; Buchholz, A.; Schumacher, M.; Sauerbrei, W. Improving the prognostic ability through better use of standard clinical data-the nottingham prognostic index as an example. PLoS ONE 2016, 11, e0149977. [Google Scholar] [CrossRef]
- Rakha, E.; Soria, D.; Green, A.R.; Lemetre, C.; Powe, D.G.; Nolan, C.C.; Garibaldi, J.M.; Ball, G.; Ellis, I.O. Nottingham prognostic index plus (npi+): A modern clinical decision making tool in breast cancer. Br. J. Cancer 2014, 110, 1688–1697. [Google Scholar] [CrossRef] [Green Version]
- Phung, M.T.; Tin, S.T.; Elwood, J.M. Prognostic models for breast cancer: A systematic review. BMC Cancer 2019, 19, 1–18. [Google Scholar] [CrossRef] [Green Version]
- Altman, D.G. Prognostic models: A methodological framework and review of models for breast cancer. Cancer Investig. 2009, 27, 235–243. [Google Scholar] [CrossRef]
- Sejben, A.; Nyári, T.; Zombori, T.; Cserni, G. Comparison of nottingham prognostic index, predict and prognostils in triple negative breast cancer–a retrospective cohort study. Pathol. Oncol. Res. 2020, 26, 2443–2450. [Google Scholar] [CrossRef] [PubMed]
- Wishart, G.C.; Azzato, E.M.; Greenberg, D.C.; Rashbass, J.; Kearins, O.; Lawrence, G.; Caldas, C.; Pharoah, P.D. Predict: A new uk prognostic model that predicts survival following surgery for invasive breast cancer. Breast Cancer Res. 2010, 12, 1–10. [Google Scholar] [CrossRef] [PubMed] [Green Version]
- prognosTILs. Available online: https://cesp-proxy2.vjf.inserm.fr/shiny/prognosTILs/ (accessed on 20 January 2022).
- Boeri, C.; Chiappa, C.; Galli, F.; Berardinis, V.D.; Bardelli, L.; Carcano, G.; Rovera, F. Machine learning techniques in breast cancer prognosis prediction: A primary evaluation. Cancer Med. 2020, 9, 3234–3243. [Google Scholar] [CrossRef] [PubMed]
- Ferroni, P.; Zanzotto, F.M.; Riondino, S.; Scarpato, N.; Guadagni, F.; Roselli, M. Breast cancer prognosis using a machine learning approach. Cancers 2019, 11, 328. [Google Scholar] [CrossRef] [Green Version]
- Zhou, L.; Rueda, M.; Alkhateeb, A. Identifying biomarkers of nottingham prognosis index in breast cancer survivability. In Proceedings of the 12th ACM Conference on Bioinformatics, Computational Biology, and Health Informatics, Gainesville, FL, USA, 1–4 August 2021; pp. 1–9. [Google Scholar]
- Curtis, C.; Shah, S.P.; Chin, S.-F.; Turashvili, G.; Rueda, O.M.; Dunning, M.J.; Speed, D.; Lynch, A.G.; Samarajiwa, S.; Yuan, Y.; et al. The genomic and transcriptomic architecture of 2000 breast tumours reveals novel subgroups. Nature 2012, 486, 346–352. [Google Scholar] [CrossRef]
- Pearson, K.X. on the criterion that a given system of deviations from the probable in the case of a correlated system of variables is such that it can be reasonably supposed to have arisen from random sampling. Lond. Edinb. Dublin Philos. Mag. J. Sci. 1900, 50, 157–175. [Google Scholar] [CrossRef] [Green Version]
- Breiman, L. Random forests. Mach. Learn. 2001, 45, 5–32. [Google Scholar] [CrossRef] [Green Version]
- Van der Maaten, L.; Hinton, G. Visualizing data using t-SNE. J. Mach. Learn. Res. 2008, 9, 2579–2605. [Google Scholar]
- He, K.; Zhang, X.; Ren, S.; Sun, J. Deep residual learning for image recognition. In Proceedings of the IEEE Conference on Computer Vision and Pattern Recognition, Las Vegas, NV, USA, 27–30 June 2016; pp. 770–778. [Google Scholar]
- De Sanctis, R.; Viganò, A.; Giuliani, A.; Gronchi, A.; De Paoli, A.; Navarria, P.; Quagliuolo, V.; Santoro, A.; Colosimo, A. Unsupervised versus supervised identification of prognostic factors in patients with localized retroperitoneal sarcoma: A data clustering and mahalanobis distance approach. BioMed Res. Int. 2018, 2018. [Google Scholar] [CrossRef] [Green Version]
- Bazhenova, L.; Lokker, A.; Snider, J.; Castellanos, E.; Fisher, V.; Fellous, M.; Nanda, S.; Zong, J.; Keating, K.; Jiao, X. Trk fusion cancer: Patient characteristics and survival analysis in the real-world setting. Target. Oncol. 2021, 16, 389–399. [Google Scholar] [CrossRef]
- Phan, N.N.; Wang, C.-Y.; Li, K.-L.; Chen, C.-F.; Chiao, C.-C.; Yu, H.-G.; Huang, P.-L.; Lin, Y.-C. Distinct expression of cdca3, cdca5, and cdca8 leads to shorter relapse free survival in breast cancer patient. Oncotarget 2018, 9, 6977. [Google Scholar] [CrossRef] [PubMed]
- Zhang, Z.; Shen, M.; Zhou, G. Upregulation of cdca5 promotes gastric cancer malignant progression via influencing cyclin e1. Biochem. Biophys. Res. Commun. 2018, 496, 482–489. [Google Scholar] [CrossRef] [PubMed]
- Alinejad, V.; Dolati, S.; Motallebnezhad, M.; Yousefi, M. The role of il17b-il17rb signaling pathway in breast cancer. Biomed. Pharmacother. 2017, 88, 795–803. [Google Scholar] [CrossRef]
- Rakha, E.A.; Boyce, R.W.; El-Rehim, D.A.; Kurien, T.; Green, A.R.; Paish, E.C.; Robertson, J.F.; Ellis, I.O. Expression of mucins (muc1, muc2, muc3, muc4, muc5ac and muc6) and their prognostic significance in human breast cancer. Mod. Pathol. 2005, 18, 1295–1304. [Google Scholar] [CrossRef] [PubMed]
- Astashchanka, A.; Shroka, T.M.; Jacobsen, B.M. Mucin 2 (muc2) modulates the aggressiveness of breast cancer. Breast Cancer Res. Treat. 2019, 173, 289–299. [Google Scholar] [CrossRef]
- Velloso, F.J.; Campos, A.R.; Sogayar, M.C.; Correa, R.G. Proteome profiling of triple negative breast cancer cells overexpressing nod1 and nod2 receptors unveils molecular signatures of malignant cell proliferation. BMC Genom. 2019, 20, 1–20. [Google Scholar] [CrossRef]
- Yan, L.-R.; Wang, A.; Lv, Z.; Yuan, Y.; Xu, Q. Mitochondria-Related Core Genes in Breast Cancer: Potential Diagnostic, Prognostic Markers and Therapeutic Targets; Research Square, 2020. Available online: https://www.researchsquare.com/article/rs-32432/v1 (accessed on 29 December 2021).
- Shukla, A.; Srivastava, S.; Darokar, J.; Kulshreshtha, R. Hif1α and p53 regulated med30, a mediator complex subunit, is involved in regulation of glioblastoma pathogenesis and temozolomide resistance. Cell. Mol. Neurobiol. 2021, 41, 1521–1535. [Google Scholar] [CrossRef]
- Hasegawa, N.; Sumitomo, A.; Fujita, A.; Aritome, N.; Mizuta, S.; Matsui, K.; Ishino, R.; Inoue, K.; Urahama, N.; Nose, J.; et al. Mediator subunits med1 and med24 cooperatively contribute to pubertal mammary gland development and growth of breast carcinoma cells. Mol. Cell. Biol. 2012, 32, 1483–1495. [Google Scholar] [CrossRef] [Green Version]
- Atienza, J.M.; Roth, R.B.; Rosette, C.; Smylie, K.J.; Kammerer, S.; Rehbock, J.; Ekblom, J.; Denissenko, M.F. Suppression of rad21 gene expression decreases cell growth and enhances cytotoxicity of etoposide and bleomycin in human breast cancer cells. Mol. Cancer Ther. 2005, 4, 361–368. [Google Scholar] [CrossRef]
- Eukaryotic Translation Initiation Factor 3 Subunit h. Available online: https://www.genecards.org/cgi-bin/carddisp.pl?gene=EIF3H (accessed on 20 December 2021).
- Mahmood, S.F.; Gruel, N.; Chapeaublanc, E.; Lescure, A.; Jones, T.; Reyal, F.; Vincent-Salomon, A.; Raynal, V.; Pierron, G.; Perez, F.; et al. A sirna screen identifies rad21, eif3h, chrac1 and tanc2 as driver genes within the 8q23, 8q24. 3 and 17q23 amplicons in breast cancer with effects on cell growth, survival and transformation. Carcinogenesis 2014, 35, 670–682. [Google Scholar] [CrossRef] [Green Version]
- Morris, C.; Durand, S.; Jalinot, P. Decreased expression of the translation factor eif3e induces senescence in breast cancer cells via suppression of parp1 and activation of mtorc1. Oncotarget 2021, 12, 649. [Google Scholar] [CrossRef] [PubMed]
- Fang, Y.; Wang, L.; Wan, C.; Sun, Y.; Van der Jeught, K.; Zhou, Z.; Dong, T.; So, K.M.; Yu, T.; Li, Y.; et al. Mal2 drives immune evasion in breast cancer by suppressing tumor antigen presentation. J. Clin. Investig. 2021, 131. [Google Scholar] [CrossRef] [PubMed]
- Rajput, A.B.; Hu, N.; Varma, S.; Chen, C.-H.; Ding, K.; Park, P.C.; Chapman, J.-A.W.; SenGupta, S.K.; Madarnas, Y.; Elliott, B.E.; et al. Immunohistochemical assessment of expression of centromere protein—A (cenpa) in human invasive breast cancer. Cancers 2011, 3, 4212–4227. [Google Scholar] [CrossRef] [PubMed] [Green Version]
- Miao, Z.; Ali, A.; Hu, L.; Zhao, F.; Yin, C.; Chen, C.; Yang, T.; Qian, A. Microtubule actin cross-linking factor 1, a novel potential target in cancer. Cancer Sci. 2017, 108, 1958. [Google Scholar] [CrossRef] [Green Version]
- Gencards-ugt2b7. Available online: https://www.genecards.org/cgi-bin/carddisp.pl?gene=UGT2B7 (accessed on 20 December 2021).
- Li, H.; Hu, B.; Guo, Z.; Jiang, X.; Su, X.; Zhang, X. Correlation of ugt2b7 polymorphism with cardiotoxicity in breast cancer patients undergoing epirubicin/cyclophosphamide-docetaxel adjuvant chemotherapy. Yonsei Med. J. 2019, 60, 30–37. [Google Scholar] [CrossRef]
- Mou, P.; Wang, H.; An, L.; Yin, Q.; Chang, J. Rs7435335 located in the ugt2b7 gene may be a possible genetic marker for the clinical response and prognosis of breast cancer patients receiving neoadjuvant chemotherapy. J. Cell. Biochem. 2019, 120, 7167–7173. [Google Scholar] [CrossRef]
- Gencards-sema3b. Available online: https://www.genecards.org/cgi-bin/carddisp.pl?gene=SEMA3B (accessed on 20 December 2021).
- Castro-Rivera, E.; Ran, S.; Thorpe, P.; Minna, J.D. Semaphorin 3b (sema3b) induces apoptosis in lung and breast cancer, whereas vegf165 antagonizes this effect. Proc. Natl. Acad. Sci. USA 2004, 101, 11432–11437. [Google Scholar] [CrossRef] [Green Version]
- Castro-Rivera, E.; Ran, S.; Brekken, R.A.; Minna, J.D. Semaphorin 3b inhibits the phosphatidylinositol 3-kinase/akt pathway through neuropilin-1 in lung and breast cancer cells. Cancer Res. 2008, 68, 8295–8303. [Google Scholar] [CrossRef] [Green Version]
Publisher’s Note: MDPI stays neutral with regard to jurisdictional claims in published maps and institutional affiliations. |
© 2022 by the authors. Licensee MDPI, Basel, Switzerland. This article is an open access article distributed under the terms and conditions of the Creative Commons Attribution (CC BY) license (https://creativecommons.org/licenses/by/4.0/).