
Global Genomic and Proteomic Analysis Identified Critical Pathways Modulated by Proto-Oncogene PELP1 in TNBC

 , and
, and 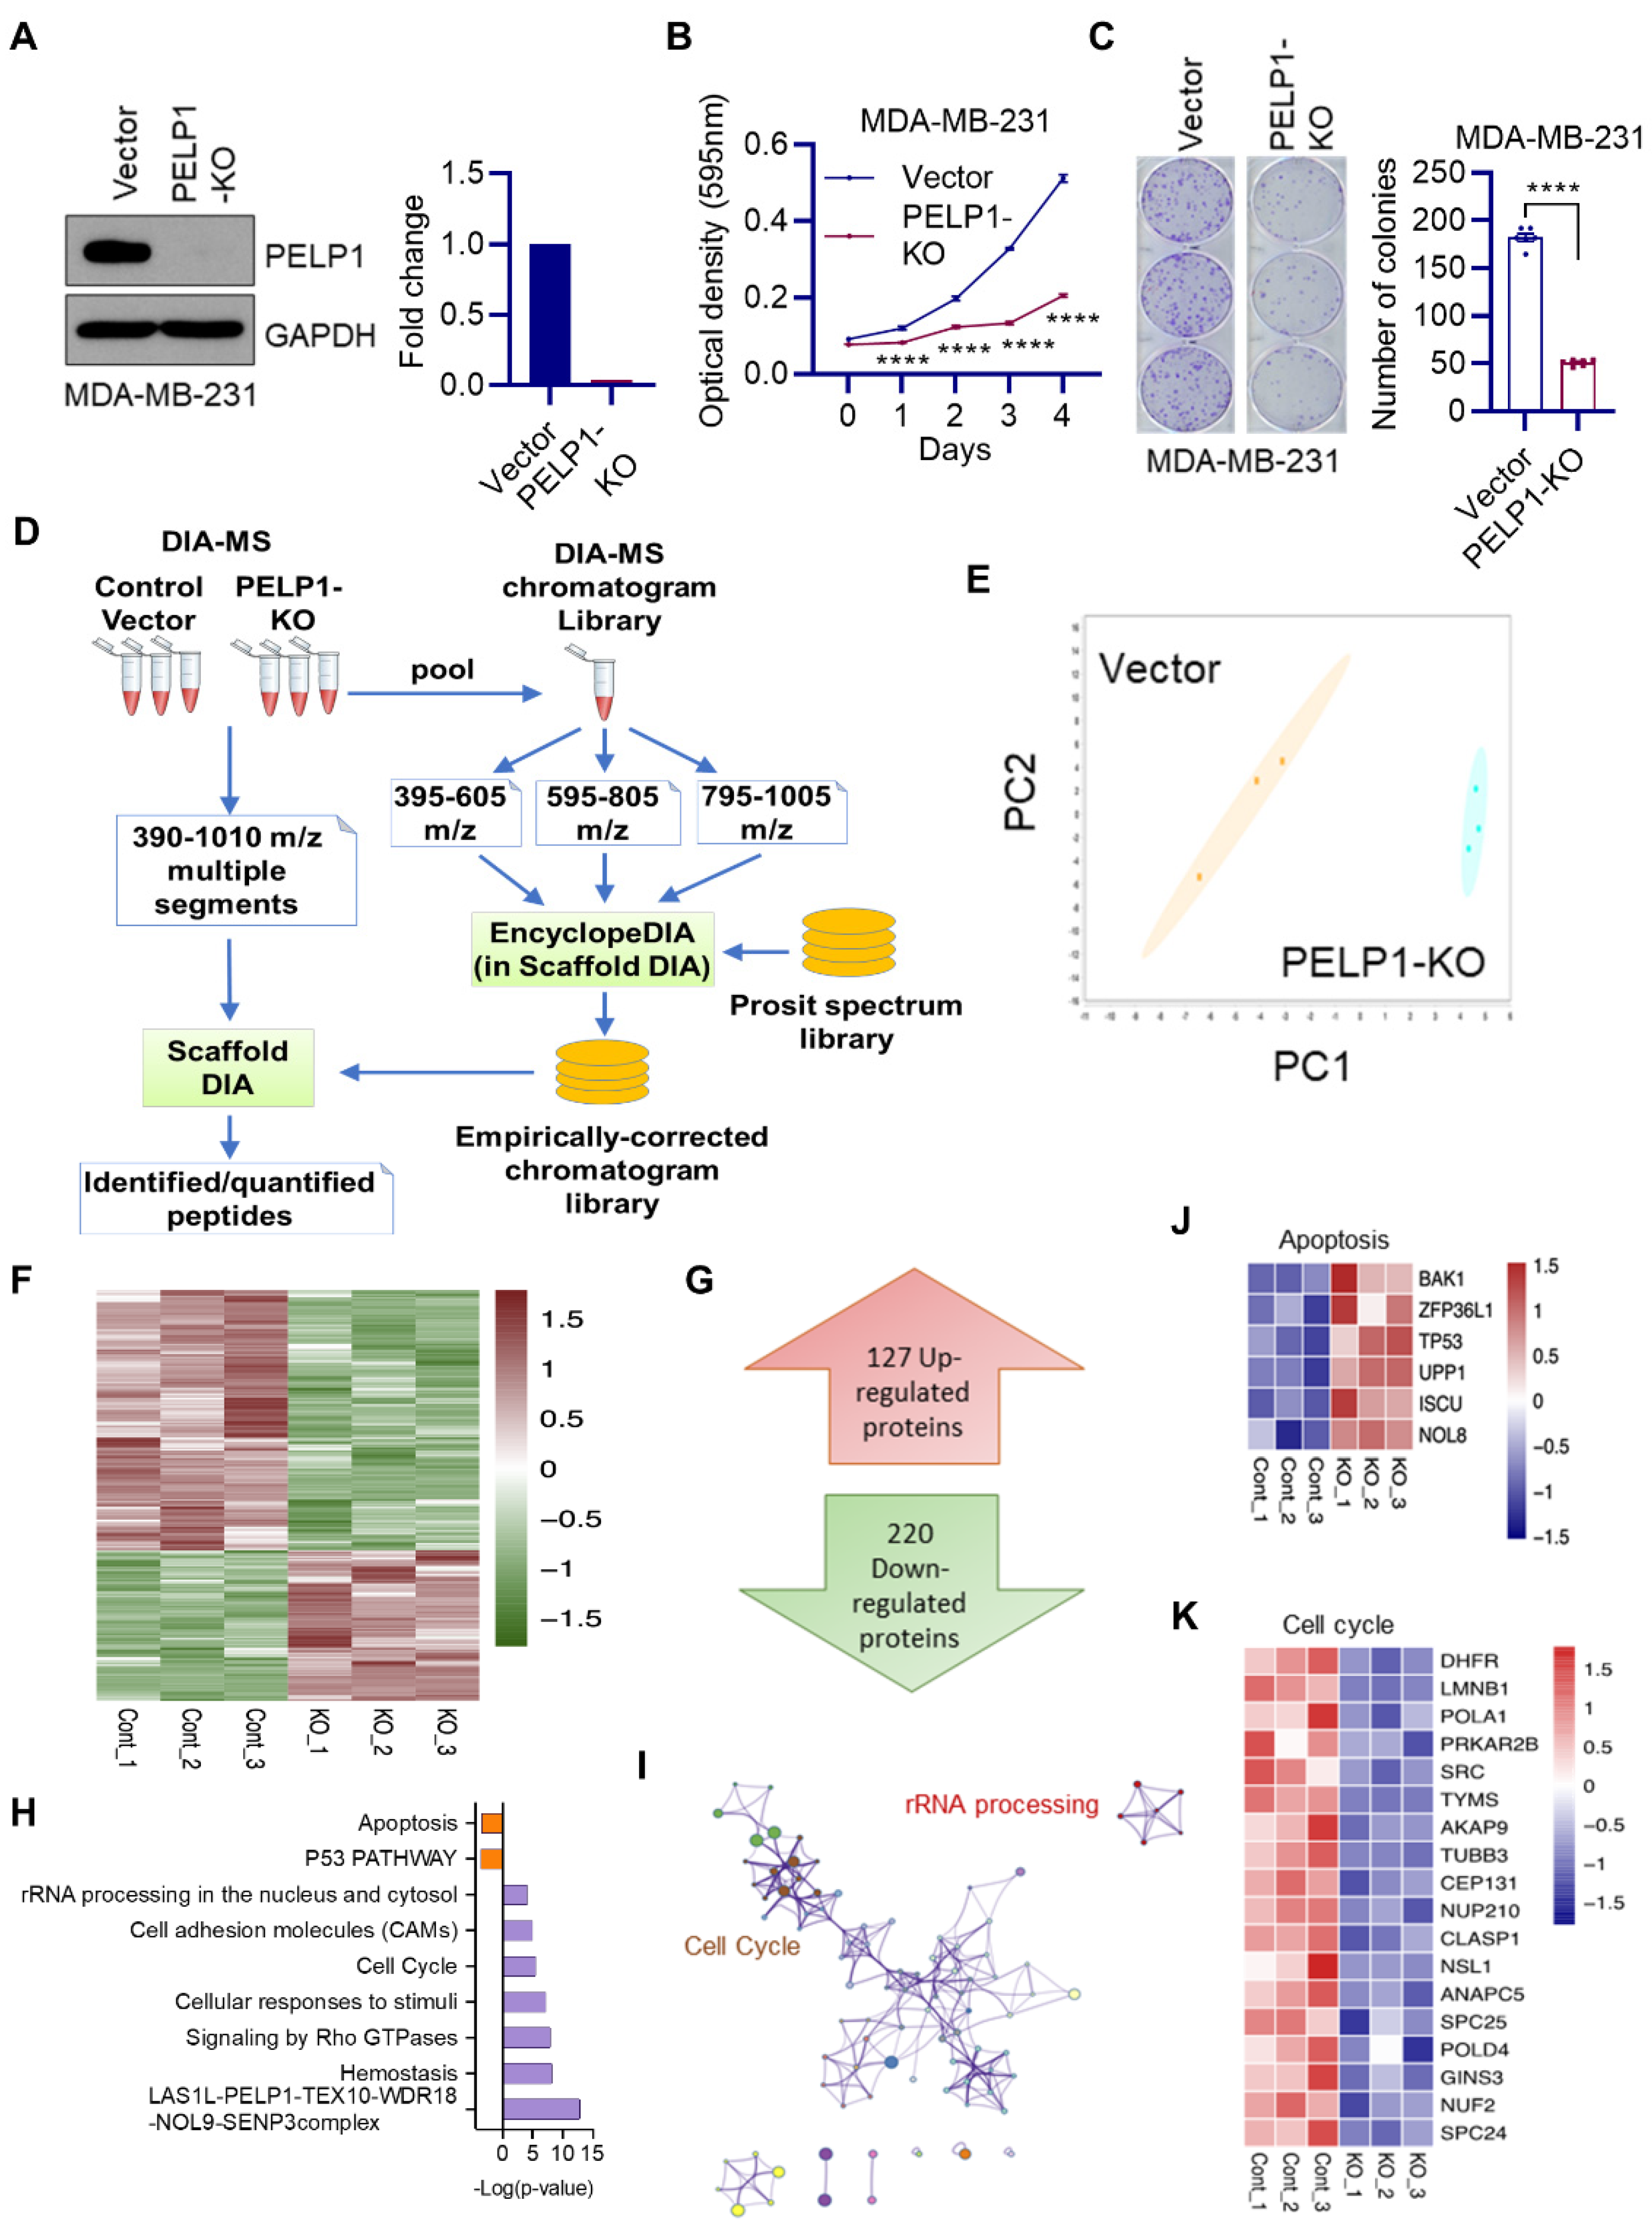
Abstract
Simple Summary
Abstract
1. Introduction
2. Materials and Methods
2.1. Cell Culture and Reagents
2.2. Generation of Model Cell Lines
2.3. Cell Growth, Colony Formation and Western Blotting
2.4. DIA Mass Spectrometry
2.5. RNA Sequencing
2.6. Bioinformatic Analysis
2.7. Statistical Analysis
3. Results
3.1. Global Data-Independent Acquisition Mass Spectrometry (DIA-MS) Identified Unique Pathways Modulated by PELP1
3.2. PELP1 Regulated Proteins in TNBC Cells Play a Critical Role in Ribosome Biogenesis
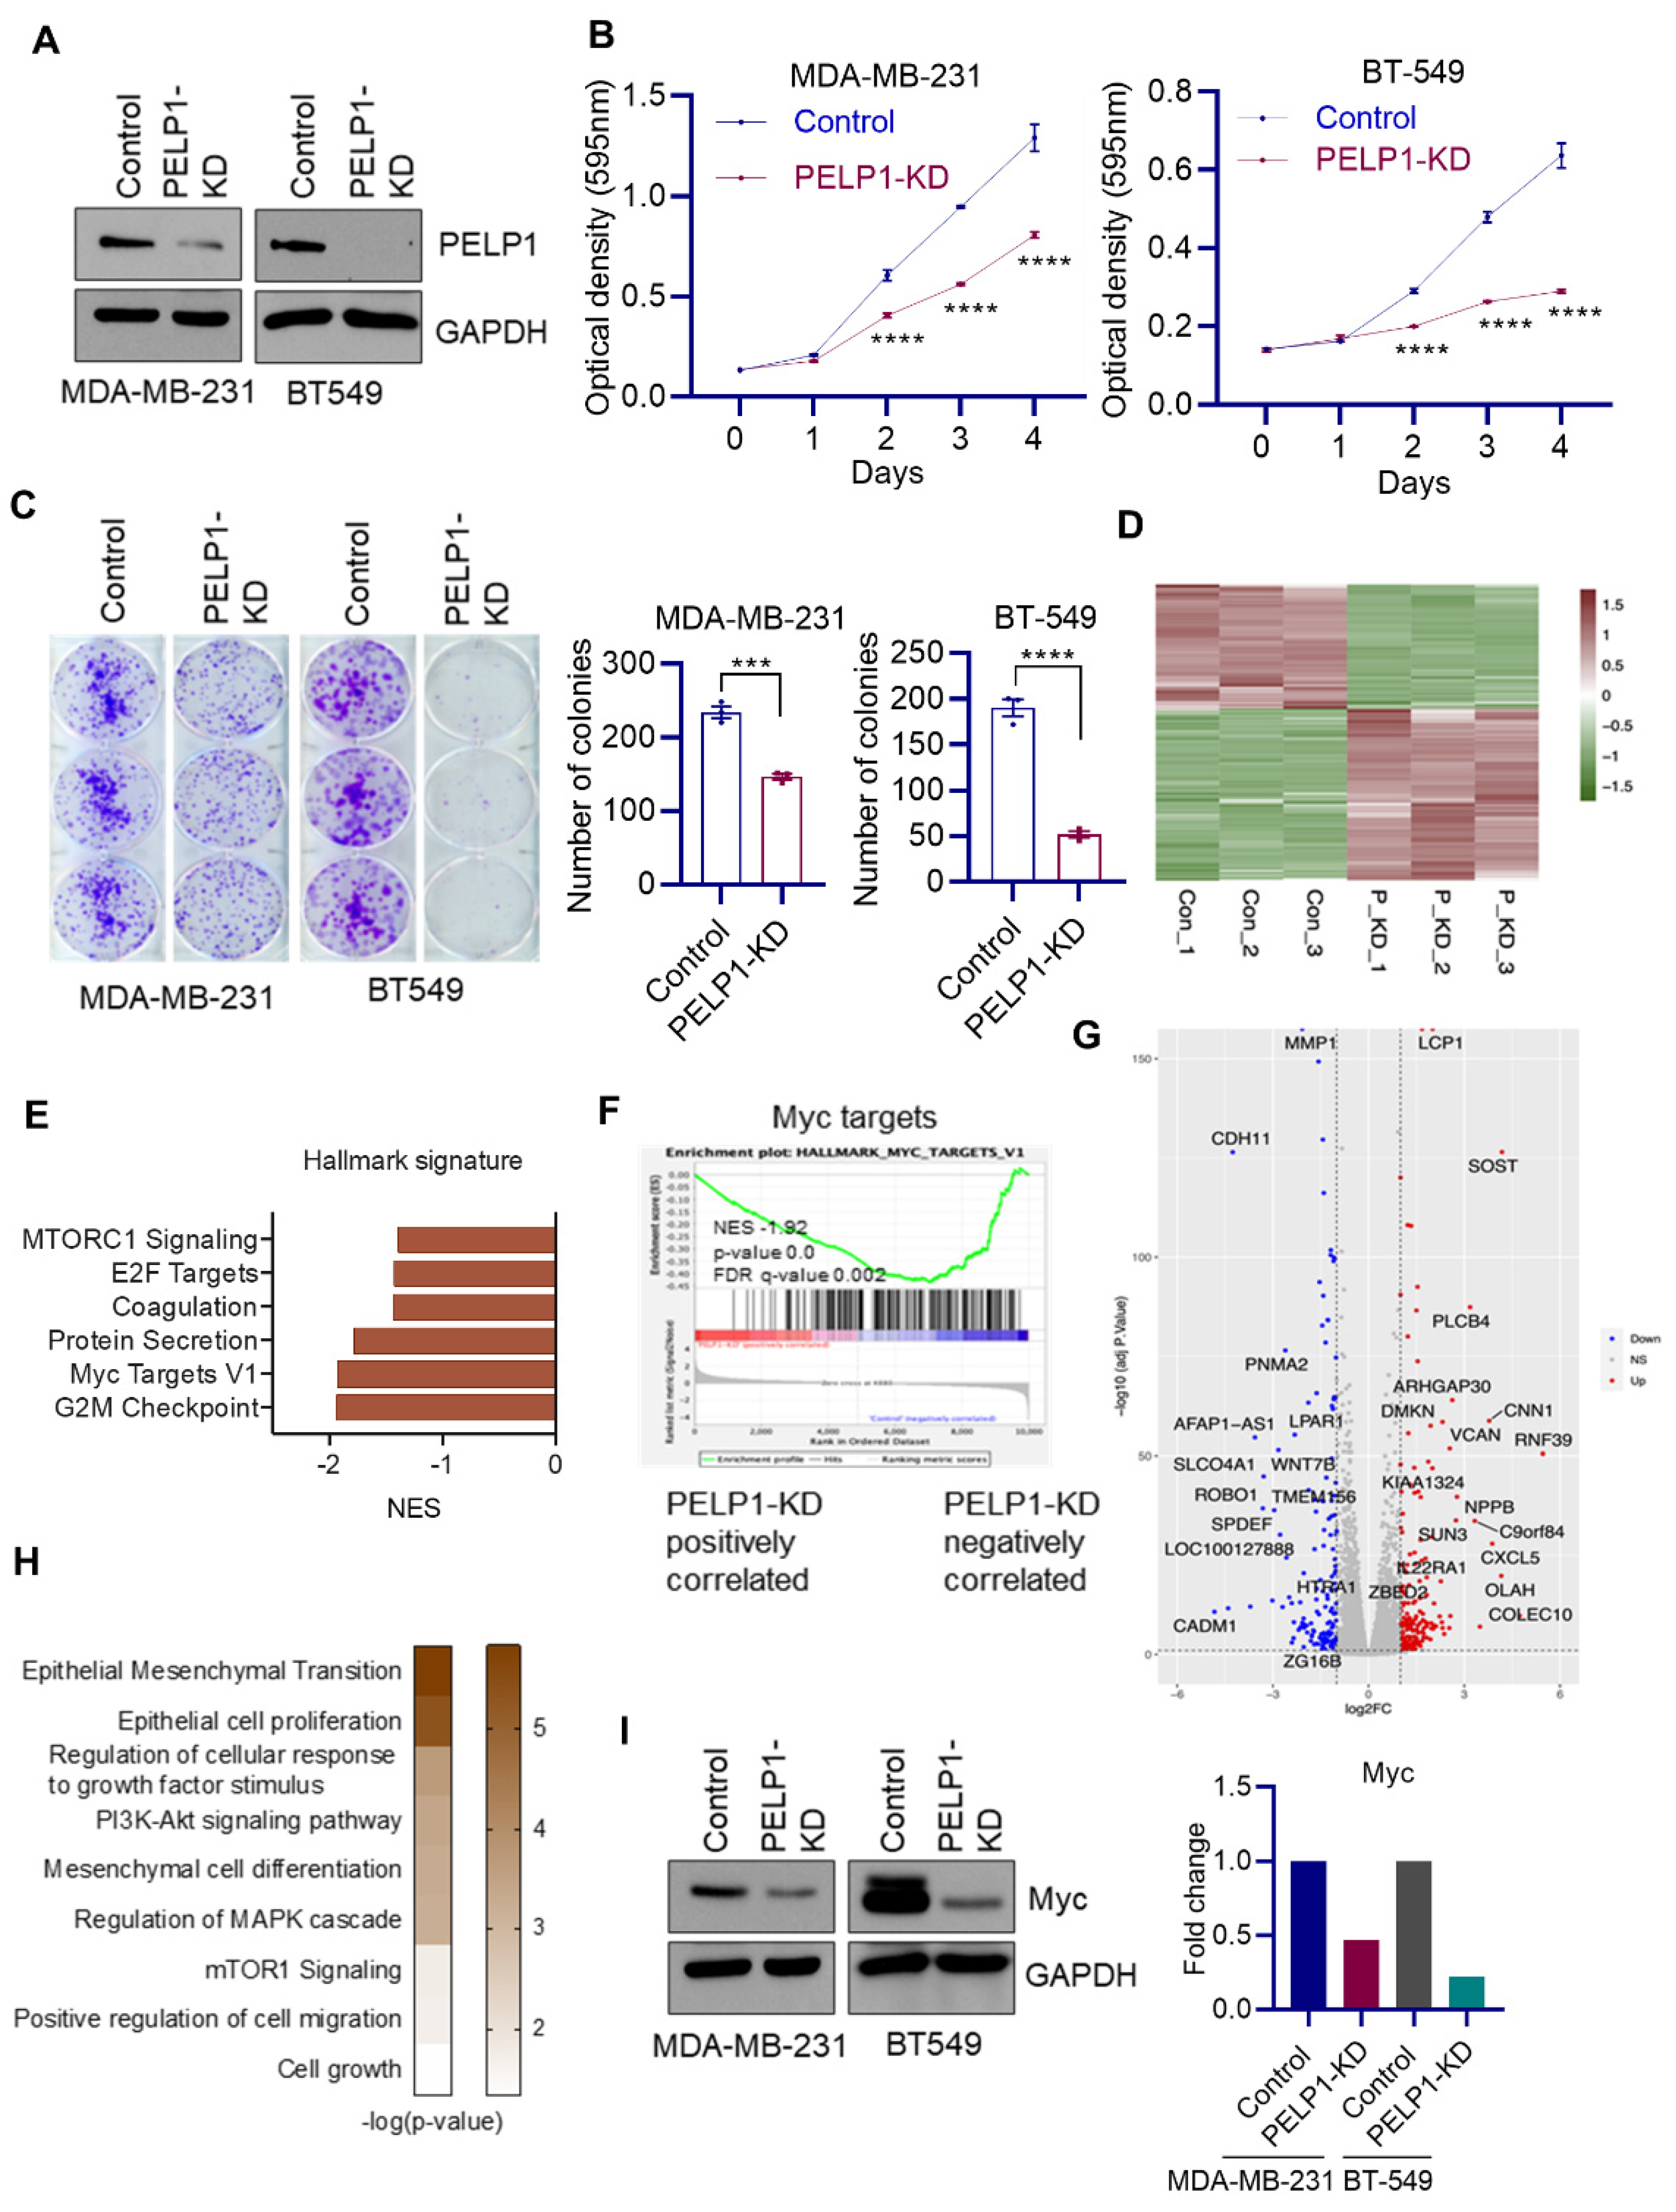
3.3. Global RNA-Seq Analyses Revealed PELP1 Knockdown Impairs Expression of Critical Regulators of Ribosomal Genes Such as c-Myc
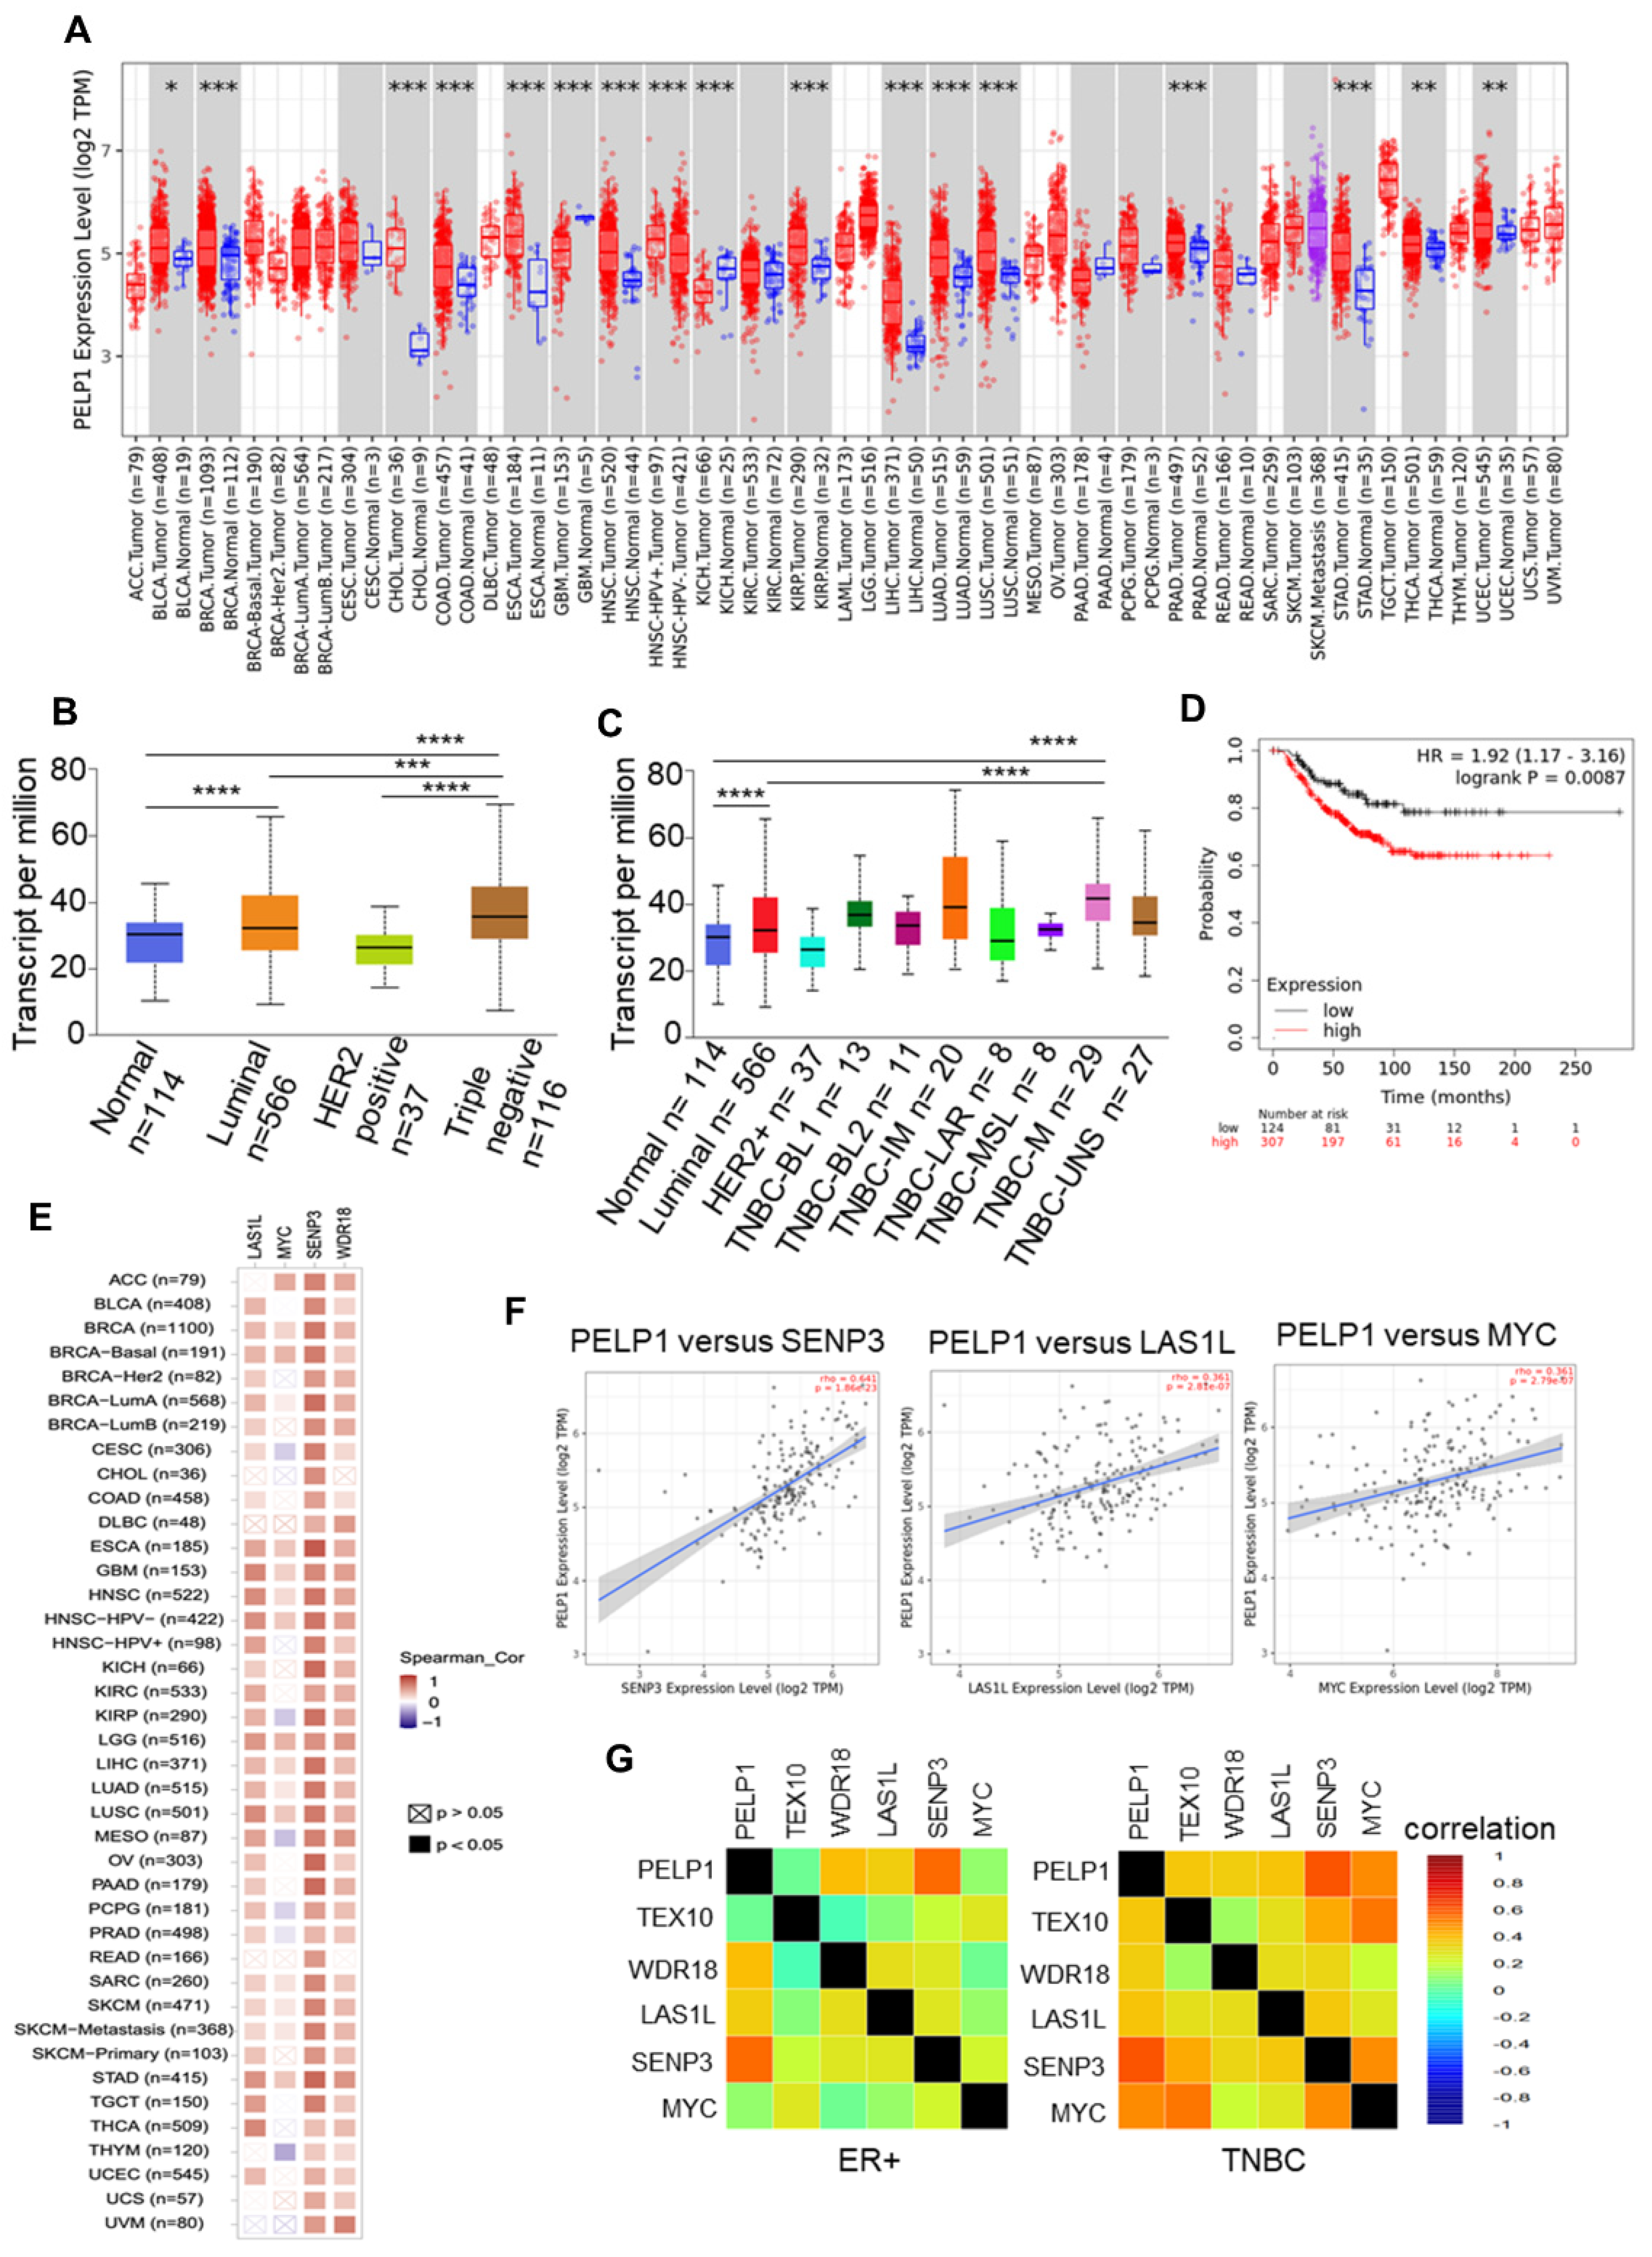
3.4. PELP1 Expression Is Upregulated and Positively Correlates with c-Myc Status and Ribosomal Regulators in TNBC Samples
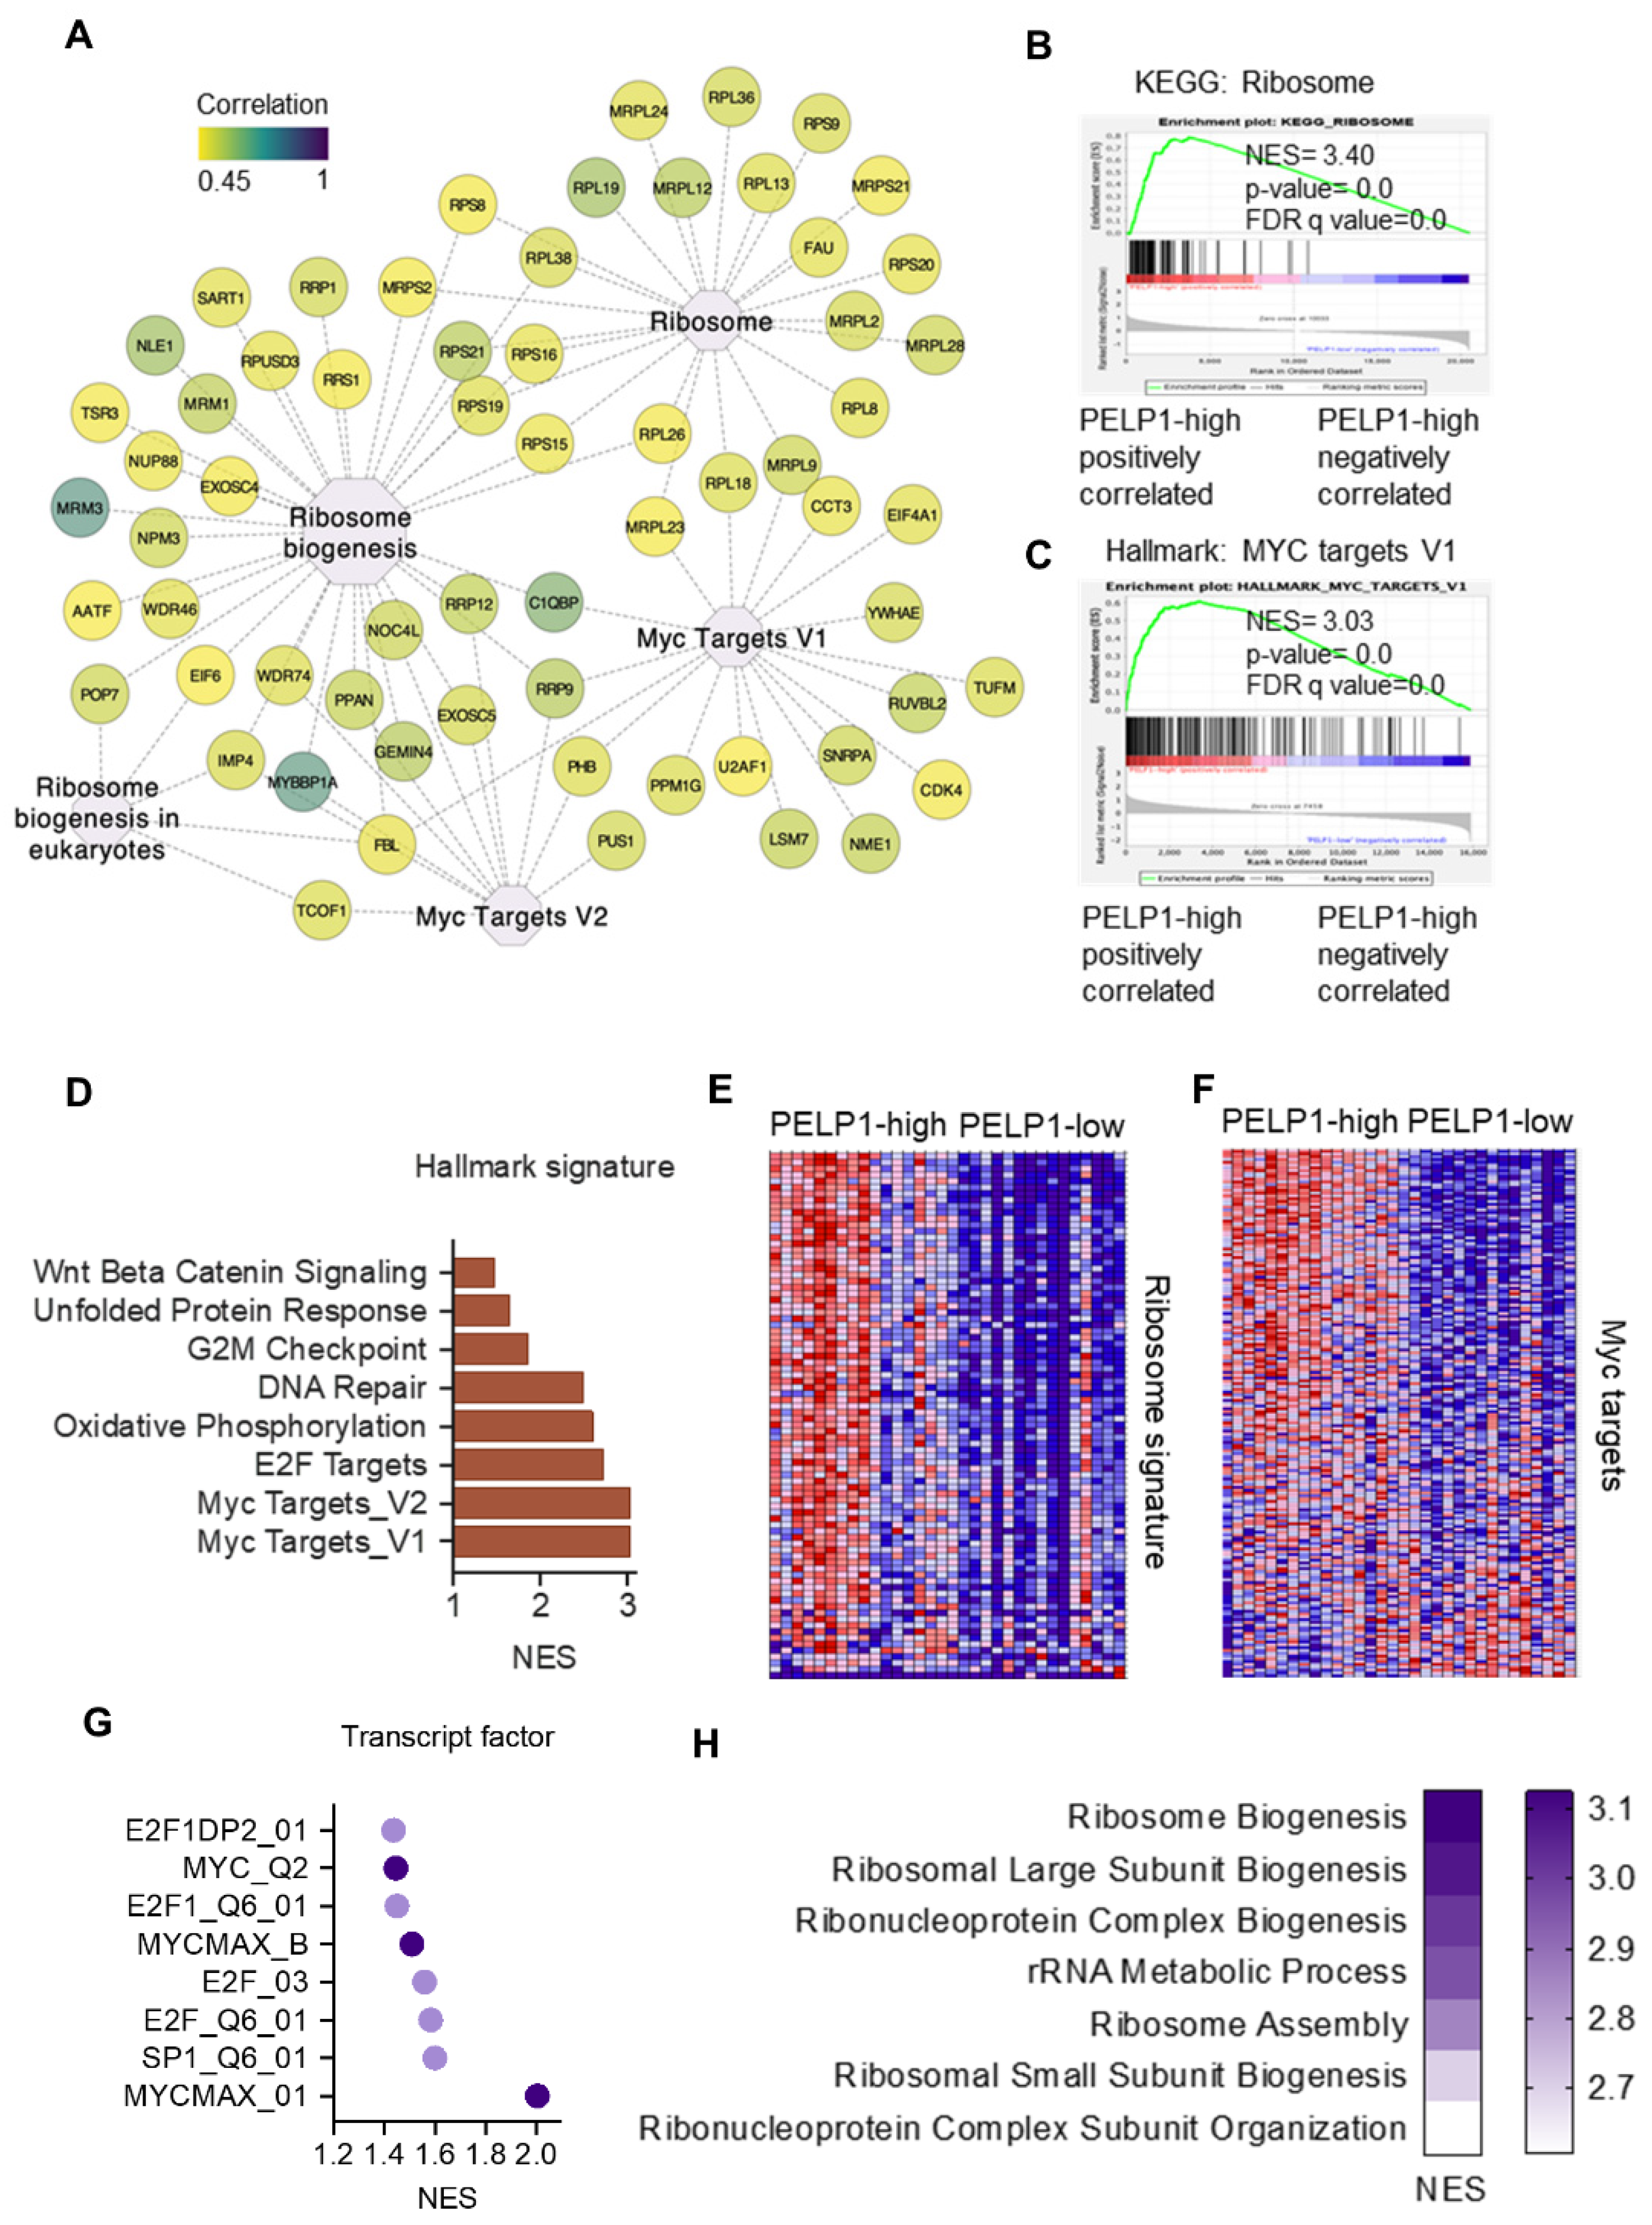
3.5. TCGA-TNBC Cohort RNA-Seq Data Revealed PELP1 Is Involved in Regulation of c-Myc and Ribosome Biogenesis
4. Discussion
5. Conclusions
Supplementary Materials
Author Contributions
Funding
Institutional Review Board Statement
Informed Consent Statement
Data Availability Statement
Acknowledgments
Conflicts of Interest
References
- Foulkes, W.D.; Smith, I.E.; Reis-Filho, J.S. Triple-negative breast cancer. N. Engl. J. Med. 2010, 363, 1938–1948. [Google Scholar] [CrossRef] [PubMed]
- Carey, L.; Winer, E.; Viale, G.; Cameron, D.; Gianni, L. Triple-negative breast cancer: Disease entity or title of convenience? Nat. Rev. Clin. Oncol. 2010, 7, 683–692. [Google Scholar] [CrossRef] [PubMed]
- Bianchini, G.; Balko, J.M.; Mayer, I.A.; Sanders, M.E.; Gianni, L. Triple-negative breast cancer: Challenges and opportunities of a heterogeneous disease. Nat. Rev. Clin. Oncol. 2016, 13, 674–690. [Google Scholar] [CrossRef] [PubMed]
- Vagia, E.; Mahalingam, D.; Cristofanilli, M. The Landscape of Targeted Therapies in TNBC. Cancers 2020, 12, 916. [Google Scholar] [CrossRef] [PubMed]
- Zhao, W.; Li, X.; Nian, W.; Wang, J.; Wang, X.; Sun, L.; Zhu, Y.; Tong, Z. Ribosome Proteins Represented by RPL27A Mark the Development and Metastasis of Triple-Negative Breast Cancer in Mouse and Human. Front. Cell Dev. Biol. 2021, 9, 716730. [Google Scholar] [CrossRef] [PubMed]
- Sulima, S.O.; Hofman, I.J.F.; De Keersmaecker, K.; Dinman, J.D. How Ribosomes Translate Cancer. Cancer Discov. 2017, 7, 1069–1087. [Google Scholar] [CrossRef] [PubMed]
- Ruggero, D.; Pandolfi, P.P. Does the ribosome translate cancer? Nat. Rev. Cancer 2003, 3, 179–192. [Google Scholar] [CrossRef]
- Wu, C.H.; Sahoo, D.; Arvanitis, C.; Bradon, N.; Dill, D.L.; Felsher, D.W. Combined analysis of murine and human microarrays and ChIP analysis reveals genes associated with the ability of MYC to maintain tumorigenesis. PLoS Genet. 2008, 4, e1000090. [Google Scholar] [CrossRef]
- Barna, M.; Pusic, A.; Zollo, O.; Costa, M.; Kondrashov, N.; Rego, E.; Rao, P.H.; Ruggero, D. Suppression of Myc oncogenic activity by ribosomal protein haploinsufficiency. Nature 2008, 456, 971–975. [Google Scholar] [CrossRef]
- Thoreen, C.C.; Chantranupong, L.; Keys, H.R.; Wang, T.; Gray, N.S.; Sabatini, D.M. A unifying model for mTORC1-mediated regulation of mRNA translation. Nature 2012, 485, 109–113. [Google Scholar] [CrossRef]
- Montanaro, L.; Trere, D.; Derenzini, M. Nucleolus, ribosomes, and cancer. Am. J. Pathol. 2008, 173, 301–310. [Google Scholar] [CrossRef] [PubMed]
- Vadlamudi, R.K.; Wang, R.A.; Mazumdar, A.; Kim, Y.; Shin, J.; Sahin, A.; Kumar, R. Molecular cloning and characterization of PELP1, a novel human coregulator of estrogen receptor alpha. J. Biol. Chem. 2001, 276, 38272–38279. [Google Scholar] [CrossRef] [PubMed]
- Regan Anderson, T.M.; Ma, S.H.; Raj, G.V.; Cidlowski, J.A.; Helle, T.M.; Knutson, T.P.; Krutilina, R.I.; Seagroves, T.N.; Lange, C.A. Breast Tumor Kinase (Brk/PTK6) Is Induced by HIF, Glucocorticoid Receptor, and PELP1-Mediated Stress Signaling in Triple-Negative Breast Cancer. Cancer Res. 2016, 76, 653–1663. [Google Scholar] [CrossRef] [PubMed]
- Yang, L.; Ravindranathan, P.; Ramanan, M.; Kapur, P.; Hammes, S.R.; Hsieh, J.T.; Raj, G.V. Central role for PELP1 in nonandrogenic activation of the androgen receptor in prostate cancer. Mol. Endocrinol. 2012, 26, 550–561. [Google Scholar] [CrossRef][Green Version]
- Manavathi, B.; Nair, S.S.; Wang, R.A.; Kumar, R.; Vadlamudi, R.K. Proline-, glutamic acid-, and leucine-rich protein-1 is essential in growth factor regulation of signal transducers and activators of transcription 3 activation. Cancer Res. 2005, 65, 5571–5577. [Google Scholar] [CrossRef]
- Luo, Y.; Li, M.; Pratap, U.P.; Viswanadhapalli, S.; Liu, J.; Venkata, P.P.; Altwegg, K.A.; Palacios, B.E.; Li, X.; Chen, Y.; et al. PELP1 signaling contributes to medulloblastoma progression by regulating the NF-kappaB pathway. Mol. Carcinog. 2020, 59, 281–292. [Google Scholar] [CrossRef]
- Krishnan, S.R.; Nair, B.C.; Sareddy, G.R.; Roy, S.S.; Natarajan, M.; Suzuki, T.; Peng, Y.; Raj, G.; Vadlamudi, R.K. Novel role of PELP1 in regulating chemotherapy response in mutant p53-expressing triple negative breast cancer cells. Breast Cancer Res. Treat. 2015, 150, 487–499. [Google Scholar] [CrossRef]
- Zhang, Y.; Dai, J.; McNamara, K.M.; Bai, B.; Shi, M.; Chan, M.S.; Liu, M.; Sasano, H.; Wang, X.; Li, X.; et al. Prognostic significance of proline, glutamic acid, leucine rich protein 1 (PELP1) in triple-negative breast cancer: A retrospective study on 129 cases. BMC Cancer 2015, 15, 699. [Google Scholar] [CrossRef]
- Roy, S.; Chakravarty, D.; Cortez, V.; De Mukhopadhyay, K.; Bandyopadhyay, A.; Ahn, J.M.; Raj, G.V.; Tekmal, R.R.; Sun, L.; Vadlamudi, R.K. Significance of PELP1 in ER-negative breast cancer metastasis. Mol. Cancer Res. 2012, 10, 25–33. [Google Scholar] [CrossRef]
- Schneider, C.A.; Rasband, W.S.; Eliceiri, K.W. NIH Image to ImageJ: 25 years of image analysis. Nat. Methods 2012, 9, 671–675. [Google Scholar] [CrossRef]
- Liu, J.; Liu, Z.; Li, M.; Tang, W.; Pratap, U.P.; Luo, Y.; Altwegg, K.A.; Li, X.; Zou, Y.; Zhu, H.; et al. Interaction of transcription factor AP-2 gamma with proto-oncogene PELP1 promotes tumorigenesis by enhancing RET signaling. Mol. Oncol. 2021, 15, 1146–1161. [Google Scholar] [CrossRef] [PubMed]
- Viswanadhapalli, S.; Ma, S.; Sareddy, G.R.; Lee, T.K.; Li, M.; Gilbreath, C.; Liu, X.; Luo, Y.; Pratap, U.P.; Zhou, M.; et al. Estrogen receptor coregulator binding modulator (ERX-11) enhances the activity of CDK4/6 inhibitors against estrogen receptor-positive breast cancers. Breast Cancer Res. 2019, 21, 150. [Google Scholar] [CrossRef] [PubMed]
- Searle, B.C.; Pino, L.K.; Egertson, J.D.; Ting, Y.S.; Lawrence, R.T.; MacLean, B.X.; Villen, J.; MacCoss, M.J. Chromatogram libraries improve peptide detection and quantification by data independent acquisition mass spectrometry. Nat. Commun. 2018, 9, 5128. [Google Scholar] [CrossRef] [PubMed]
- Rosenberger, G.; Koh, C.C.; Guo, T.; Rost, H.L.; Kouvonen, P.; Collins, B.C.; Heusel, M.; Liu, Y.; Caron, E.; Vichalkovski, A.; et al. A repository of assays to quantify 10,000 human proteins by SWATH-MS. Sci. Data 2014, 1, 140031. [Google Scholar] [CrossRef] [PubMed]
- Anders, S.; Pyl, P.T.; Huber, W. HTSeq—A Python framework to work with high-throughput sequencing data. Bioinformatics 2015, 31, 166–169. [Google Scholar] [CrossRef] [PubMed]
- Love, M.I.; Huber, W.; Anders, S. Moderated estimation of fold change and dispersion for RNA-seq data with DESeq2. Genome. Biol. 2014, 15, 550. [Google Scholar] [CrossRef]
- Subramanian, A.; Tamayo, P.; Mootha, V.K.; Mukherjee, S.; Ebert, B.L.; Gillette, M.A.; Paulovich, A.; Pomeroy, S.L.; Golub, T.R.; Lander, E.S.; et al. Gene set enrichment analysis: A knowledge-based approach for interpreting genome-wide expression profiles. Proc. Natl. Acad. Sci. USA 2005, 102, 15545–15550. [Google Scholar] [CrossRef] [PubMed]
- Liberzon, A.; Subramanian, A.; Pinchback, R.; Thorvaldsdottir, H.; Tamayo, P.; Mesirov, J.P. Molecular signatures database (MSigDB) 3.0. Bioinformatics 2011, 27, 1739–1740. [Google Scholar] [CrossRef]
- Zhou, Y.; Zhou, B.; Pache, L.; Chang, M.; Khodabakhshi, A.H.; Tanaseichuk, O.; Benner, C.; Chanda, S.K. Metascape provides a biologist-oriented resource for the analysis of systems-level datasets. Nat. Commun. 2019, 10, 1523. [Google Scholar] [CrossRef]
- Chandrashekar, D.S.; Bashel, B.; Balasubramanya, S.A.H.; Creighton, C.J.; Ponce-Rodriguez, I.; Chakravarthi, B.; Varambally, S. UALCAN: A Portal for Facilitating Tumor Subgroup Gene Expression and Survival Analyses. Neoplasia 2017, 19, 649–658. [Google Scholar] [CrossRef]
- Jezequel, P.; Frenel, J.S.; Campion, L.; Guerin-Charbonnel, C.; Gouraud, W.; Ricolleau, G.; Campone, M. bc-GenExMiner 3.0: New mining module computes breast cancer gene expression correlation analyses. Database 2013, 2013, bas060. [Google Scholar] [CrossRef]
- Li, T.; Fu, J.; Zeng, Z.; Cohen, D.; Li, J.; Chen, Q.; Li, B.; Liu, X.S. TIMER2.0 for analysis of tumor-infiltrating immune cells. Nucleic. Acids. Res. 2020, 48, W509–W514. [Google Scholar] [CrossRef]
- Gyorffy, B. Survival analysis across the entire transcriptome identifies biomarkers with the highest prognostic power in breast cancer. Comput. Struct. Biotechnol. J. 2021, 19, 4101–4109. [Google Scholar] [CrossRef]
- Cerami, E.; Gao, J.; Dogrusoz, U.; Gross, B.E.; Sumer, S.O.; Aksoy, B.A.; Jacobsen, A.; Byrne, C.J.; Heuer, M.L.; Larsson, E.; et al. The cBio cancer genomics portal: An open platform for exploring multidimensional cancer genomics data. Cancer Discov. 2012, 2, 401–404. [Google Scholar] [CrossRef] [PubMed]
- Shannon, P.; Markiel, A.; Ozier, O.; Baliga, N.S.; Wang, J.T.; Ramage, D.; Amin, N.; Schwikowski, B.; Ideker, T. Cytoscape: A software environment for integrated models of biomolecular interaction networks. Genom. Res. 2003, 13, 2498–2504. [Google Scholar] [CrossRef] [PubMed]
- Habashy, H.O.; Powe, D.G.; Rakha, E.A.; Ball, G.; Macmillan, R.D.; Green, A.R.; Ellis, I.O. The prognostic significance of PELP1 expression in invasive breast cancer with emphasis on the ER-positive luminal-like subtype. Breast Cancer Res. Treat. 2010, 120, 603–612. [Google Scholar] [CrossRef] [PubMed]
- Finkbeiner, E.; Haindl, M.; Raman, N.; Muller, S. SUMO routes ribosome maturation. Nucleus 2011, 2, 527–532. [Google Scholar] [CrossRef] [PubMed]
- Castle, C.D.; Cassimere, E.K.; Denicourt, C. LAS1L interacts with the mammalian Rix1 complex to regulate ribosome biogenesis. Mol. Biol. Cell 2012, 23, 716–728. [Google Scholar] [CrossRef] [PubMed]
- Raman, N.; Weir, E.; Muller, S. The AAA ATPase MDN1 Acts as a SUMO-Targeted Regulator in Mammalian Pre-ribosome Remodeling. Mol. Cell. 2016, 64, 607–615. [Google Scholar] [CrossRef] [PubMed]
- Ravindranathan, P.; Lange, C.A.; Raj, G.V. Minireview: Deciphering the Cellular Functions of PELP1. Mol. Endocrinol. 2015, 29, 1222–1229. [Google Scholar] [CrossRef]
- Rajhans, R.; Nair, S.; Holden, A.H.; Kumar, R.; Tekmal, R.R.; Vadlamudi, R.K. Oncogenic potential of the nuclear receptor coregulator proline-, glutamic acid-, leucine-rich protein 1/modulator of the nongenomic actions of the estrogen receptor. Cancer Res. 2007, 67, 5505–5512. [Google Scholar] [CrossRef] [PubMed]
- Nair, B.C.; Nair, S.S.; Chakravarty, D.; Challa, R.; Manavathi, B.; Yew, P.R.; Kumar, R.; Tekmal, R.R.; Vadlamudi, R.K. Cyclin-dependent kinase-mediated phosphorylation plays a critical role in the oncogenic functions of PELP1. Cancer Res. 2010, 70, 7166–7175. [Google Scholar] [CrossRef] [PubMed]
- Liao, H.; Gaur, A.; Mauvais, C.; Denicourt, C. p53 induces a survival transcriptional response after nucleolar stress. Mol. Biol. Cell 2021, 32, ar3. [Google Scholar] [CrossRef] [PubMed]
- Gonugunta, V.K.; Nair, B.C.; Rajhans, R.; Sareddy, G.R.; Nair, S.S.; Vadlamudi, R.K. Regulation of rDNA transcription by proto-oncogene PELP1. PLoS ONE 2011, 6, e21095. [Google Scholar] [CrossRef]
- Vadlamudi, R.K.; Balasenthil, S.; Broaddus, R.R.; Gustafsson, J.A.; Kumar, R. Deregulation of estrogen receptor coactivator proline-, glutamic acid-, and leucine-rich protein-1/modulator of nongenomic activity of estrogen receptor in human endometrial tumors. J. Clin. Endocrinol. Metab. 2004, 89, 6130–6138. [Google Scholar] [CrossRef]
- Chakravarty, D.; Roy, S.S.; Babu, C.R.; Dandamudi, R.; Curiel, T.J.; Vivas-Mejia, P.; Lopez-Berestein, G.; Sood, A.K.; Vadlamudi, R.K. Therapeutic targeting of PELP1 prevents ovarian cancer growth and metastasis. Clin. Cancer Res. 2011, 17, 2250–2259. [Google Scholar] [CrossRef]
- Vadlamudi, R.K.; Balasenthil, S.; Sahin, A.A.; Kies, M.; Weber, R.S.; Kumar, R.; El-Naggar, A.K. Novel estrogen receptor coactivator PELP1/MNAR gene and ERbeta expression in salivary duct adenocarcinoma: Potential therapeutic targets. Hum. Pathol. 2005, 36, 670–675. [Google Scholar] [CrossRef]
- Slowikowski, B.K.; Galecki, B.; Dyszkiewicz, W.; Jagodzinski, P.P. Increased expression of proline-, glutamic acid- and leucine-rich protein PELP1 in non-small cell lung cancer. Biomed. Pharmacother. 2015, 73, 97–101. [Google Scholar] [CrossRef]
- Kashiwaya, K.; Nakagawa, H.; Hosokawa, M.; Mochizuki, Y.; Ueda, K.; Piao, L.; Chung, S.; Hamamoto, R.; Eguchi, H.; Ohigashi, H.; et al. Involvement of the tubulin tyrosine ligase-like family member 4 polyglutamylase in PELP1 polyglutamylation and chromatin remodeling in pancreatic cancer cells. Cancer Res. 2010, 70, 4024–4033. [Google Scholar] [CrossRef]
- Ning, Z.; Zhang, Y.; Chen, H.; Wu, J.; Song, T.; Wu, Q.; Liu, F. PELP1 suppression inhibits colorectal cancer through c-Src downregulation. Oxid. Med. Cell. Longev. 2014, 2014, 193523. [Google Scholar] [CrossRef]


Publisher’s Note: MDPI stays neutral with regard to jurisdictional claims in published maps and institutional affiliations. |
© 2022 by the authors. Licensee MDPI, Basel, Switzerland. This article is an open access article distributed under the terms and conditions of the Creative Commons Attribution (CC BY) license (https://creativecommons.org/licenses/by/4.0/).
Share and Cite
Liu, Z.; Altwegg, K.A.; Liu, J.; Weintraub, S.T.; Chen, Y.; Lai, Z.; Sareddy, G.R.; Viswanadhapalli, S.; Vadlamudi, R.K. Global Genomic and Proteomic Analysis Identified Critical Pathways Modulated by Proto-Oncogene PELP1 in TNBC. Cancers 2022, 14, 930. https://doi.org/10.3390/cancers14040930
Liu Z, Altwegg KA, Liu J, Weintraub ST, Chen Y, Lai Z, Sareddy GR, Viswanadhapalli S, Vadlamudi RK. Global Genomic and Proteomic Analysis Identified Critical Pathways Modulated by Proto-Oncogene PELP1 in TNBC. Cancers. 2022; 14(4):930. https://doi.org/10.3390/cancers14040930
Chicago/Turabian StyleLiu, Zexuan, Kristin A. Altwegg, Junhao Liu, Susan T. Weintraub, Yidong Chen, Zhao Lai, Gangadhara R. Sareddy, Suryavathi Viswanadhapalli, and Ratna K. Vadlamudi. 2022. "Global Genomic and Proteomic Analysis Identified Critical Pathways Modulated by Proto-Oncogene PELP1 in TNBC" Cancers 14, no. 4: 930. https://doi.org/10.3390/cancers14040930
APA StyleLiu, Z., Altwegg, K. A., Liu, J., Weintraub, S. T., Chen, Y., Lai, Z., Sareddy, G. R., Viswanadhapalli, S., & Vadlamudi, R. K. (2022). Global Genomic and Proteomic Analysis Identified Critical Pathways Modulated by Proto-Oncogene PELP1 in TNBC. Cancers, 14(4), 930. https://doi.org/10.3390/cancers14040930