Article

Development of Gene Expression-Based Random Forest Model for Predicting Neoadjuvant Chemotherapy Response in Triple-Negative Breast Cancer

Korean Advanced Institute of Science and Technology, Daejeon 34141, Korea
*
Author to whom correspondence should be addressed.
Cancers 2022, 14(4), 881; https://doi.org/10.3390/cancers14040881
Submission received: 3 December 2021 / Revised: 28 January 2022 / Accepted: 2 February 2022 / Published: 10 February 2022

Abstract

:

Simple Summary

Only 20–50% of patients with triple negative breast cancer achieve a pathological complete response from neoadjuvant chemotherapy, a strong indicator of patient survival. Therefore, there is an urgent need for a reliable predictive model of the patient’s pathological complete response prior to actual treatment. The purpose of this study was to develop such a model based on random forest recursive feature elimination and to benchmark the performance of the proposed model against existing predictive models. Our study suggests that an 86-gene-based random forest model associated to DNA repair and cell cycle mechanisms can provide reliable predictions of neoadjuvant chemotherapy response in patients with triple negative breast cancer.

Abstract

Neoadjuvant chemotherapy (NAC) response is an important indicator of patient survival in triple negative breast cancer (TNBC), but predicting chemosensitivity remains a challenge in clinical practice. We developed an 86-gene-based random forest (RF) classifier capable of predicting neoadjuvant chemotherapy response (pathological Complete Response (pCR) or Residual Disease (RD)) in TNBC patients. The performance of pCR classification of the proposed model was evaluated by Receiver Operating Characteristic (ROC) curve and Precision Recall (PR) curve. The AUROC and AUPRC of the proposed model on the test set were 0.891 and 0.829, respectively. At a predefined specificity (>90%), the proposed model shows a superior sensitivity compared to the best performing reported NAC response prediction model (69.2% vs. 36.9%). Moreover, the predicted pCR status by the model well explains the distance recurrence free survival (DRFS) of TNBC patients. In addition, the pCR probabilities of the proposed model using the expression profiles of the CCLE TNBC cell lines show a high Spearman rank correlation with cyclophosphamide sensitivity in the TNBC cell lines (SRCC = 0.697 , p-value = 0.031 ). Associations between the 86 genes and DNA repair/cell cycle mechanisms were provided through function enrichment analysis. Our study suggests that the random forest-based prediction model provides a reliable prediction of the clinical response to neoadjuvant chemotherapy and may explain chemosensitivity in TNBC.

1. Introduction

Triple negative breast cancer (TNBC) is a particularly difficult form of breast cancer to treat because of its rapid growth and high recurrence rate [1]. It accounts for about 15% of all invasive breast cancers and usually has a high histological grade with a low long term survival rate [2]. Compared to the successful application of targeted therapies for other types of breast cancer, targeted therapy for TNBC is difficult due to the lack of major receptors in breast cancer such as ER/PR/HER2 receptors [3,4]. Several targeted therapies for TNBC patients have recently been introduced [5,6,7], but due to the limited applicability of these therapies [8], cytotoxic chemotherapy remains the mainstay of treatment [9].
Due to the aggressive tumor growth in TNBC, NeoAdjuvant Chemotherapy (NAC), which refers to preoperative chemotherapy, is often considered as a first-line treatment for TNBC patients. The main treatment goal of NAC is to achieve a pathological complete response (pCR) and pCR is defined as the complete disappearance of all invasive carcinoma cells in the breast and axillary lymph nodes, which is assessed pathologically in the resected tissue after neoadjuvant chemotherapy [10]. Patients who do not achieve pCR are refer to as having Residual Disease (RD).
The pCR by NAC has been demonstrated to be a strong prognostic factor for TNBC patients [11,12,13]. Therefore, pCR by NAC generally is considered as an appropriate surrogate endpoint for TNBC patients [12] and clinical studies have shown improved survival in TNBC patients who achieved pCR by NAC [14]. Unfortunately, not all patients receiving NAC could achieve pCR and in fact, only about 20–50% of patients with TNBC achieve pCR by NAC [11,12,14,15]. In other words, some patients are experiencing unnecessary side effects that can lead to loss of alternative treatment due to an inadequate and ineffective treatment. Therefore, there is an urgent need for a prediction model of the NAC response in TNBC.
Several previous studies have proposed gene expression-based predictive models to address this issue [16,17,18,19,20,21]. For example, Liedtke et al. reported that a high GGI (Genomic Grade Index) was found to be correlated with increased sensitivity to neoadjuvant chemotherapy [22]. Hess et al. [23], proposed DLDA30 to predict the pCR of patients who received preoperative weekly paclitaxel and fluorouracil-doxorubicin-cyclophosphamide (T/FAC) chemotherapy based on Diagonal Linear Discriminant Analysis (DLDA). Hatzis et al. [18] proposed a prediction model for the NAC response by Taxane + Anthracycline based on the Threshold Gradient Directed Regularization (TGDR) method [24,25]. Masanori Oshi et al. [19], proposed a three-gene-based predictive biomarker for pCR prediction after NAC in TNBC. The same authors also proposed a five-gene-based predictive biomarker for pCR prediction after NAC in ER+/HER2- breast cancer [20]. Fu et al. [21] proposed an immune-associated genomic signature to predict pCR after Neoadjuvant paclitaxel and anthracycline based chemotherapy in breast cancer. Fournier et al. [26] proposed a two-step classification model based on backward regression general linear modeling (BRGLM). Table 1 summarizes the reported studies about NAC response prediction for TNBC and other types of breast cancer.
It is noteworthy that most of the reported studies are based on a combination of feature selection and relatively simple models such as Multivariate Logistic Regression (MLR) or Diagonalized Linear Discriminant Analysis (DLDA). However, because there is no clear correlation between the expression of a gene and a NAC response vector (mean PCC = 0.038 ± 0.103 ), linear models may not be the appropriate choice for classifying the NAC response [28]. In addition, some studies have utilized prior marker information to restrict the search space of optimal markersets, but these studies only utilized the associated genes of predefined mechanisms such as the immune response [29] and the E2F pathway [19,20], which may not fully represent the mechanisms of the NAC response. Moreover, there are only two studies specifically targeting TNBC patients in which pCR prediction by NAC is expected to improve the clinical prognosis.
The Random Forest (RF) is a machine learning model based on an ensemble of decision trees generated by random feature sets [30]. Because it utilizes nonlinear proximity based on bagging of random trees, it can classify samples partitioned by nonlinear decision boundary. It also provides an estimate of the importance of variables in the classification; therefore, if the user wants to reduce the number of variables, it can guide this process according to the importance of the variables. Therefore, it is suitable for developing a gene expression based classification model such as a NAC response prediction model.
To address the aforementioned problems, herein, we propose a novel NAC prediction model based on random forest (RF). We combined prior knowledge of breast cancer disease markers collected from various resources such as the literature, disease databases, drug target databases, and existing marker panels and applied several marker optimization strategies to develop an 86-gene-based RF model that outperforms the reported NAC predictive models in TNBC. To verify data specificity, we performed differential expression analysis and included both prior markers and differentially expressed genes as candidate markers. In addition, the predicted pCR status by the model well explains the distance recurrence free survival (DRFS) of TNBC patients. We also found the associations between the 86 genes and the disease mechanisms of breast cancer such as DNA repair and cell cycle.
There are several issues with reporting a novel NAC response prediction model as follows. First, it is difficult to objectively compare the performance of the existing model and the newly proposed model because there is no definite guideline to select a metric for the performance evaluation. Second, there is no consensus on which model performs best for a given task, because there are no benchmark studies that provide an objective assessment of the performance of NAC response prediction models. Third, it is difficult to replicate the reported studies due to the lack of data and codes used in the reported studies and insufficient reporting on the model development process. Fourth, it was impossible to compare the performance of our model with similarly constructed models in the literature because we could not find any random forest model proposed to predict the NAC response in breast cancer. Therefore, here, we implemented all listed NAC response prediction models in Table 1 and performed a comparative analysis on the same test set.

2. Materials and Methods

2.1. Collection of Datasets

All gene expression datasets were collected from the GEO database. Table 2 summarizes the number of patients and NAC regimens for each dataset used in this study. As shown in the Table 2, T/FAC (Taxol + Fluorouracil, Anthracycline and cyclophosphamide) and T/FEC (Taxol + Fluorouracil, Epirubicin and cyclophosphamide) were the most used NAC regimens. Here, taxol stands for paclitaxel or docetaxel, and anthracycline stands for doxorubicin or epirubicin, which can be substituted for each other in chemotherapy regimens. The GSE32646 data set contains only patients who received the T/FEC regimen, and all other data sets contain more patients who received the T/FAC regimen. All data included different types of breast cancer, so patients were selected based on receptor status (ER-, PR-, and HER2-). Because GSE25066 had the highest number of TNBC patients, we considered this dataset as the development dataset and the three other datasets as the independent validation datasets (GSE20271, GSE20194, and GSE32646).

2.2. Preprocessing

Raw intensity files from the Affymetrix HG U133A or HG U133 Plus 2.0 platforms were processed using the mas5 function in the affy R package [34] to normalize to an average array intensity of 600 and to generate expression values of the probe set level as in Hatzis et al. [18]. Some gene transcripts are recognized as more than one probe set because probe sets represent a set of (perfect match and mismatch) pairs of probes for multiple regions of a single gene transcript sequence. To avoid confusion, we used the average intensity of each probe set that maps to the same gene.

2.3. Collection of Prior Breast Cancer Markers

The statistical significance of certain markers in development data sets may not be reproduced due to their low association with breast cancer. It has been reported that prior knowledge approaches can improve the robustness and true biological relevance of selected markers in gene expression datasets [35]. Therefore, in this study, we not only utilized data specific markers such as differentially expressed genes but also included markers associated with breast cancer as candidate markers. To acquire such a prior knowledge markers, we collected breast cancer marker information from the existing literature [36,37,38,39,40,41,42], databases [43,44,45,46], and gene expression marker panels [23,27,47,48,49,50,51,52,53]. We first gathered information on disease genes primarily listed in existing breast cancer reviews through PubMed and google searches. We selected seven papers that provide comprehensive summaries of disease genes associated with breast cancer, as shown in Table 3. Second, we considered the disease gene database DisGeNet [43] and three drug databases (Drug Central [44], Drug Bank [45] and DGIDB [46]) to collect genes and drug targets associated with breast cancer. We also considered genes in existing breast cancer prognostic/responsive marker panels. We considered genes in nine gene expression marker panels including Oncotype Dx [47], Mammaprint [48], Prosigna [27], Endopredict [49], Breast Cancer Index [50], CureBest [51], GenesWellBCT [52], Genomic Grade Index (GGI) [53], and DLDA30 [23]. The gene symbols collected from all resources are standardized by HGNC Multi Symbol checker (https://www.genenames.org/tools/multi-symbol-checker/, accessed on 15 November 2021) and mapped to NCBI Gene IDs (https://www.ncbi.nlm.nih.gov/gene, accessed on 15 November 2021). In summary, we collected 1079 breast cancer marker genes through this process.

2.4. Differential Expression Analysis

We performed a differential expression analysis using the development dataset (GSE25066) to find the most discriminating genes between pCR vs. RD patients. To avoid false positives due to the relatively small sample number and the skewness of individual gene expression levels in the training dataset, we performed bootstrap t-test using boot.t.test function in the MKinfer R package [54]. We utilized bootstrapped t-test under unequal variance proposed by Janssen et al. [55], and the number of bootstrap replicates was 9999. We adjusted the p-value with the Benjamini-Hotchoberg (BH) method [56] and selected genes with a FDR < 0.05 as differentially expressed genes. To avoid randomness of the bootstrap procedure, we iterated the process 10 times and selected genes that showed FDR < 0.05 in at least one trial.

2.5. Model Training

Because the number of markers is of practical importance for developing cost effective marker panels, all developed marker panels have a relatively small number of genes compared to the number of genes available in the microarray dataset. Therefore, as discussed earlier, we limited the entire search space to the union of prior maker genes (total 1079) and differentially expressed genes (total 52). For Recursive Feature Elimination (RFE), an N of 1000 times was used to derive an optimal set of genes for the RF model (See Supplementary Figure S1). We used 70% of the development dataset as the training set to optimize the marker set. For each trial, we partitioned the training dataset into 3 equal sized folds and trained the RF classifier using 2 folds of the data along with all genes derived from the union of the prior marker genes and the differentially expressed genes. We evaluated the performance of the trained classifier on the remaining fold and evaluated the significance of the feature by the mean decrease of accuracy. After three training and test runs, we derived feature ranks for all genes based on the variable importance and removed the least significant genes from the list of genes. We performed this procedure from the maximum number of genes (1124) to 2 genes and reported the best performing subset. To reduce the search space, here, we searched for the best subset with 10 equally spaced grids, which iteratively search for the best subset when the number of genes in the optimal subset exceeds 100. That is, the trial ends when the number of genes in the optimal subset is less than 100. We repeated this process (N = 1000 times) to obtain candidate models. All models were evaluated on the rest of the test set in the development dataset to find the best performing marker set and RF model. However, because the best model on the Affymetrix U133A dataset did not perform well on the Affymetrix U133 PLUS 2.0 dataset (GSE32646), we considered 30% of the GSE32646 data set as an additional test set to find a robust model for both platforms. To minimize the effect of imbalance in the pCR vs. RD samples, we used Synthetic Minority Oversampling TEchnique (SMOTE) [57] based on the SMOTE function in the DMwR R package [58]. The accuracy was used as a metric to optimize the RF model. In this process, the markers showing the highest accuracy for the test dataset were selected as the marker set for the final model. We used the rfe function in the Caret [59] R package.

2.6. Selection of an Optimal Threshold

Due to the unequal misclassification cost of the pCR prediction, a naive threshold that applies equal probabilities to both pCR and RD may not be an appropriate choice for a pCR prediction model [60]. Because of the unequal misclassification cost, it is recommended to control the type I error (FPR) below a certain level ( α ) [61]. Here, positive means the desired outcome, i.e., pCR. In other words, when misclassifying RD patients as pCR patients, the cost of the misclassification is higher than vice versa because alternative treatment options for RD patients may be lost. On the other hand, even if pCR is misclassified as RD, the risk of misclassification can be minimized by subsequently reassessing the patient for appropriate treatment options. We therefore selected an optimal threshold based on a predefined false positive rate, α , of ≤10%, which is comparable to an ultrasound (US) image-based pCR prediction [62].

2.7. Model Validation

As previously discussed, we used three independent test data sets to validate the proposed RF model. Various binary classification performance metrics were used to evaluate the test performance of the proposed model including Accuracy (ACC), Balanced Accuracy (BACC), Sensitivity (TPR), Specificity (TNR), Precision (PPV), Negative Predictive Value (NPV), F1 score, Metthew Correlation Coefficient (MCC), and Yoden’s Index. Because we predefined α 10 % , the specificity or TNR of the model was about 90%. We also evaluated the AUROC and AUPRC of the proposed model for each test data set and visualized the ROC and PR curves.

2.8. Comparative Analysis

We performed comparative analysis of the proposed model with existing NAC response prediction models. We considered ROR-S [27], GGI [53], DLDA30 [23], Hatzis [18], BA100 [26], three-gene [19], five-gene [20], and Immune associated signatures [21] as comparable models for the NAC response prediction, as discussed earlier. To derive the ROR-S and GGI score, we used the ggi and rorS function in the genefu R package [63]. For the DLDA30 score, we reimplemented the DLDA30 score function available at the author’s web site (http://bioinformatics.mdanderson.org/pubdata.html, accessed on 15 November 2021). For the Hatzis model, we used adaptive LASSO based on the genes of the NAC response for ER-breast cancer patients proposed by the authors [18] because model coefficients and a training algorithm (TGDR) were not available. We newly implemented the BA100 [26], three-gene [19], five-gene [20], and immune associated signature [21] models as described in the original papers. Because the BA100 uses a two step classifier, we evaluated the performance of both classifiers separately. We compared the ROC and PR curves, confusion matrices with prespecified FPR and performance metrics of the binary classification.

2.9. Survival Analysis

A survival analysis was performed to determine if the proposed model could also predict Distant Recurrence Free Survival (DRFS) in patients receiving NAC. Since only one dataset (GSE25066) provides survival information, we investigated whether the predicted pCR and RD classes had differential survival curves in the training and test datasets. We used the survfit function from the survminer R package [64] to fit the survival curves of the pCR versus RD on the training and test sets and visualized the survival curves with the ggsurvplot function in the same package. The statistical significance of the survival difference was calculated by log-rank test.

2.10. Chemosensitivity Analysis

Some projects, such as GDSC [65], CCLE [66], CTRP [67], and PRISM [68] provide TNBC cell line sensitivity to drugs used for T/FAC- or T/FEC-based NAC, i.e., Paclitaxel, Docetaxel, 5-Fluorouracil, Doxorubicin, Epirubicin, and Cyclophosphamide [9]. Because the GDSC project provides the most complete set of sensitivity observations for TNBC cell lines, GDSC profiled cell line sensitivity (AUC of the dose response curves) data were used to investigate the relationship between the pCR probability of the proposed model and the chemosensitivity of TNBC cell lines. To obtain a list of TNBC cell lines, we referred to the study of Chavez et al [69]. Here, we investigated the Spearman rank correlation between the pCR probability and the sensitivity of the TNBC cell lines to these drugs (1 − Area Under the dose response curve, 1 A U C ). CCLE microarray data were preprocessed in the same manner as described in Section 2.2 to obtain the pCR scores of the TNBC cell lines. Among 27 TNBC cell lines listed by [69], 16 cell lines are available in the CCLE dataset (BT20, BT549, Cal51, HCC38, HCC1143, HCC1187, HCC1395, HCC1599, HCC1806, HCC1937, HCC2157, Hs578T, MDA-MB-157, MDA-MB-231, MDA-MB-436, and MDA-MB-468). Some drug responses for a particular cell line could be missing; thus, the Spearman’s correlation was calculated by a different number of data points for each drug. For example, only 10 cell lines have a cyclophosphamide drug response, so we calculated the correlation between the pCR probability and drug response from these 10 TNBC cell lines.

2.11. Function Enrichment Analysis

To investigate the association between the predictors of our model and cellular function, we performed a functional enrichment analysis [70] based on the Fisher exact test in our in-house module database. Briefly, we collected known gene sets from Gene Ontology [71], MSigDB [72], and Enrichr [73] databases. After removing ambiguous and redundant gene collections from these databases, we built a gene module database of 86,769 unique sets of genes with 29,107 unique genes. An ambiguous gene set here refers to a set of genes that have less direct significance in cellular functions, such as chromosomal location, genome browser PWM, NIH grant related gene sets, etc. [73].

2.12. Visualize Error Matrix and Score Distributions

To understand the performance improvement in the proposed 86-gene-based RF model compared to the 8 published NAC response prediction models, we performed several analyses as follows. First, we visualized the sample error matrix according to the prediction of the published models and the proposed model. Second, we visualized the score distribution of the published models and the proposed model to see whether the proposed model has better calibration. Because the score range of the published models differ from each other, we performed min-max normalization as follows:
S c o r e N o r m , i = S c o r e i m i n S c o r e i m a x S c o r e i m i n S c o r e i
The discriminative power of each model was assessed by t-test.

3. Results

3.1. Patient Characteristics

Table 4 shows the characteristics of the patients with TNBC in the development and independent validation datasets. There were no statistically significant differences between the pCR and RD patients for all datasets. Two datasets (GSE20271 and GSE20194) were missing the tumor stage information, and one dataset (GSE32646) was missing the N stage. Stages T2, N0, and Grade 3 had the highest prevalence in the TNBC population in all datasets.

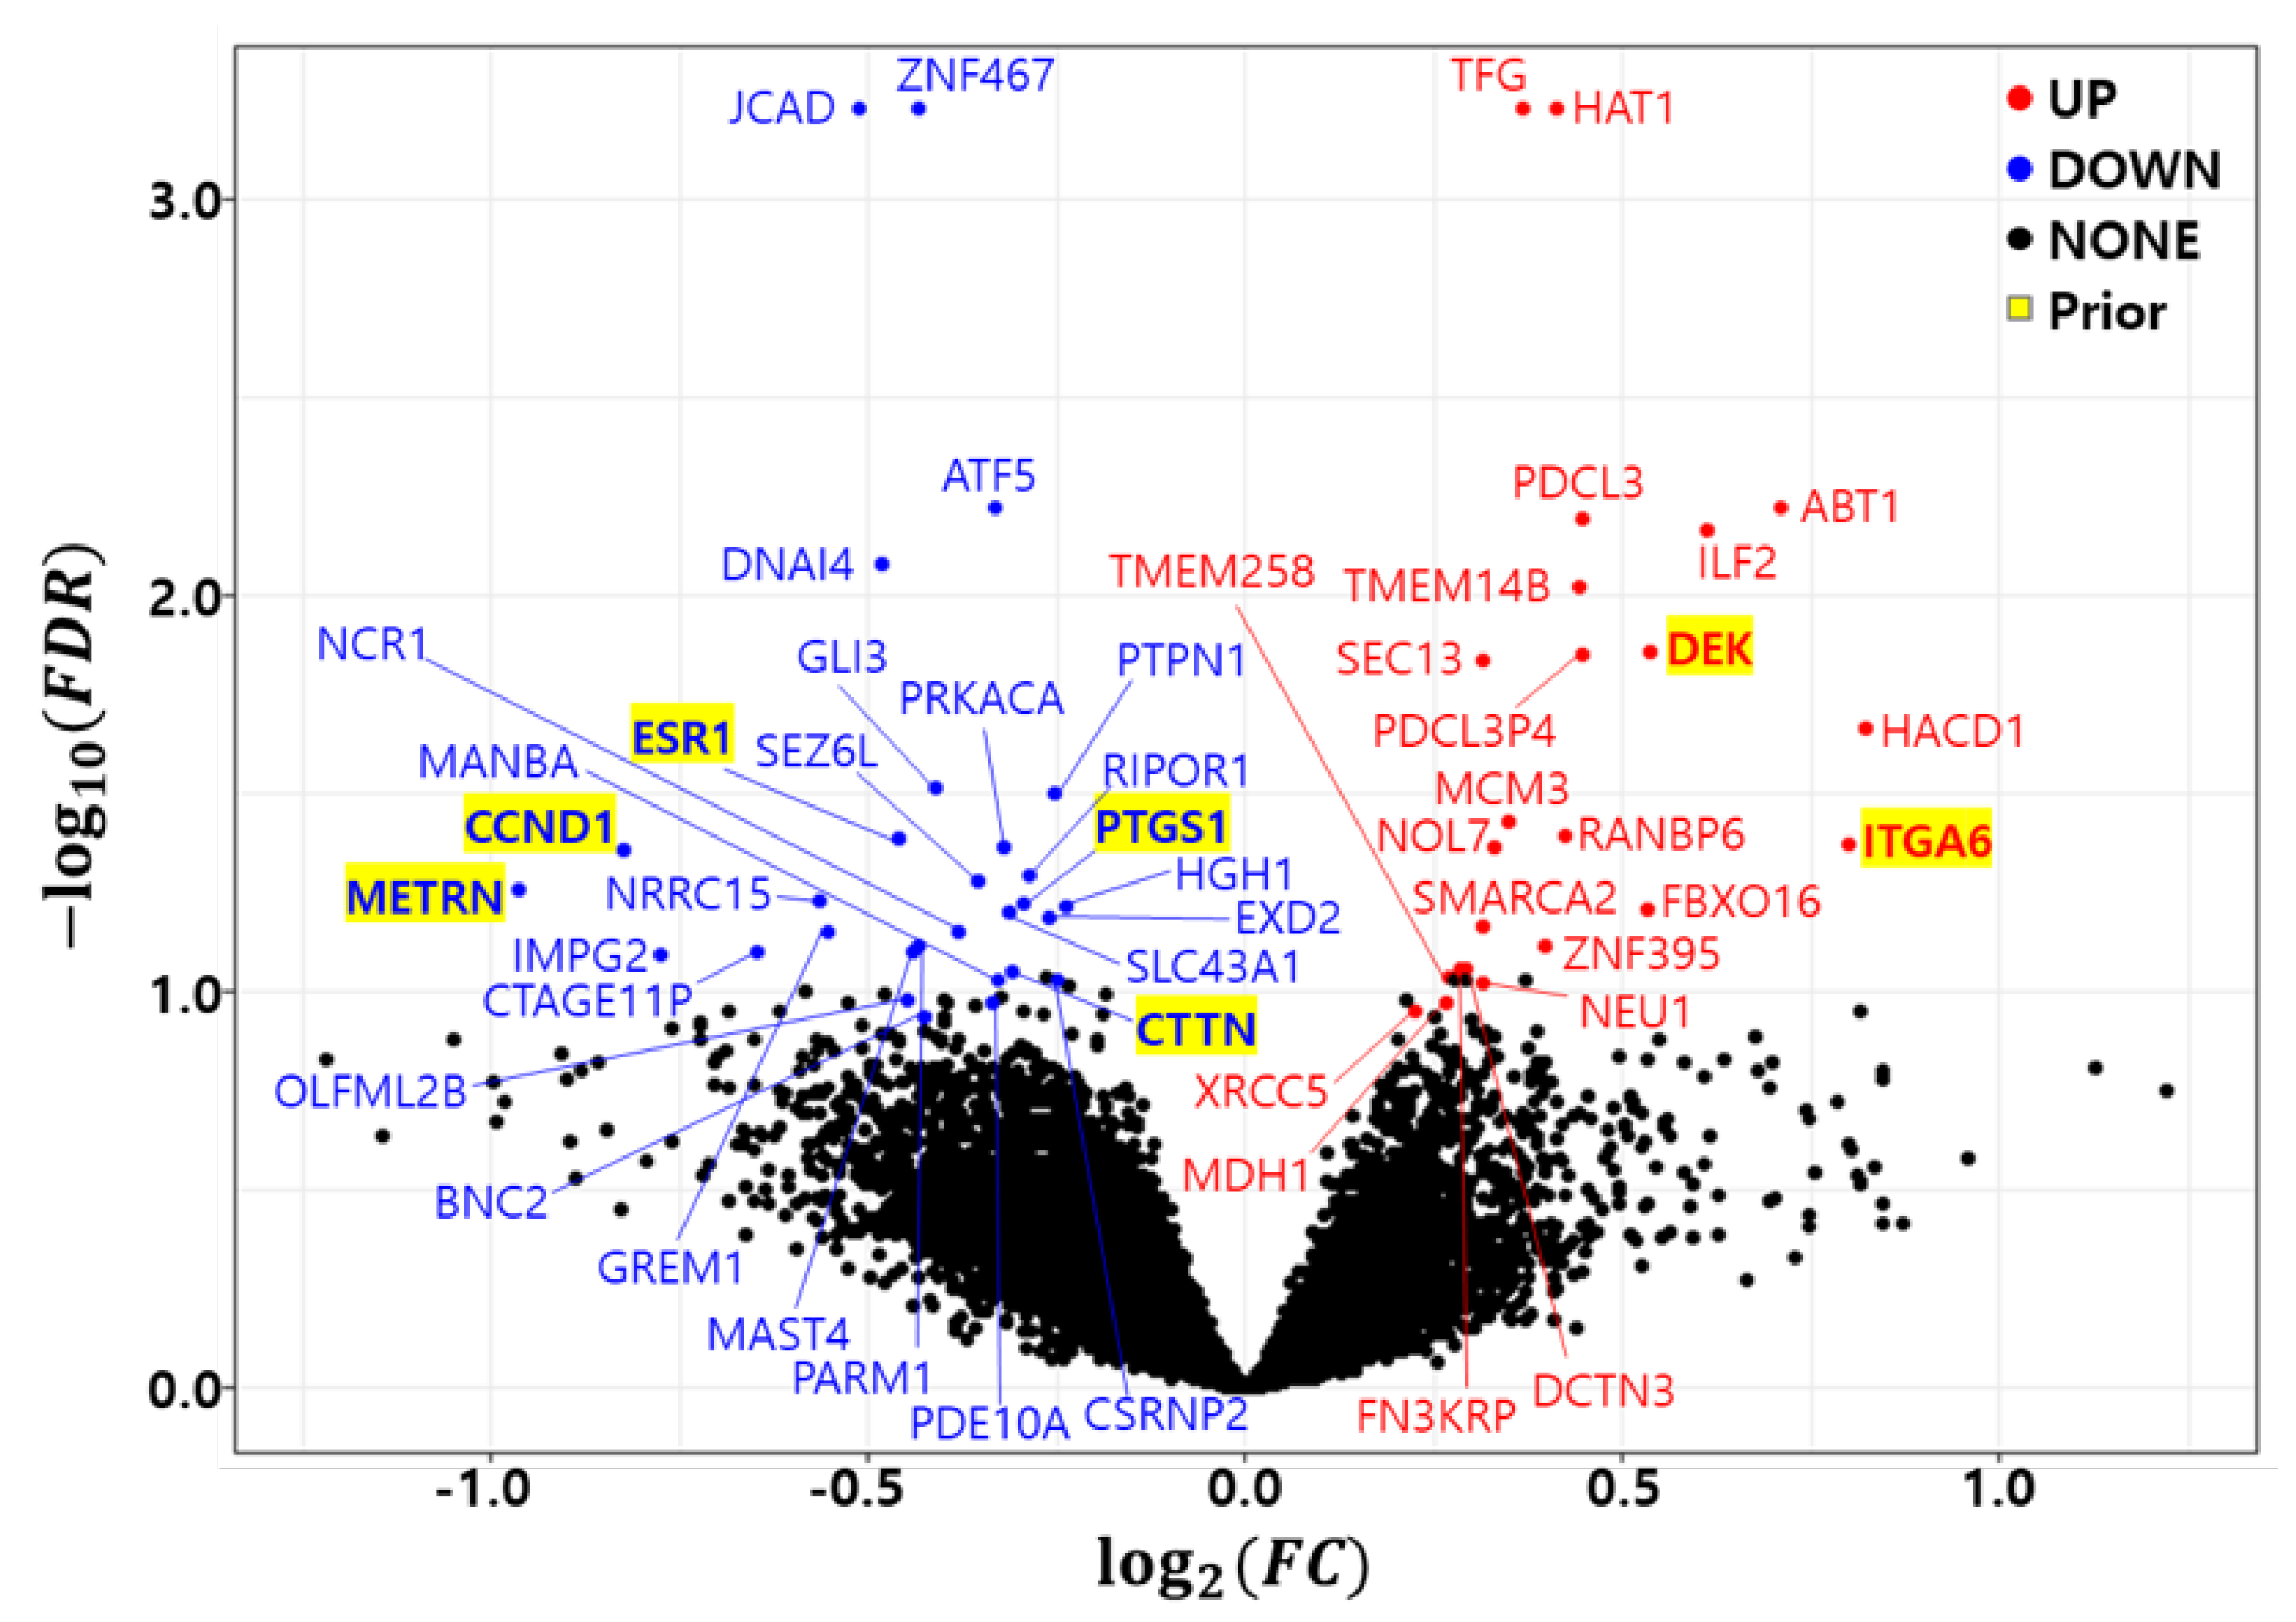
3.2. Differential Expression Analysis

As previously discussed, the bootstrap t-test was repeated 10 times to minimize the randomness of the bootstrap procedure. A gene with a F D R 0.05 in at least one trial was called a differentially expressed gene (DEG). Figure 1 shows a volcano plot of the differentially expressed genes (DEGs) in the development dataset (GSE25066). We found 23 up regulated genes (HAT1, TFG, ABT1, PDCL3, ILF2, TMEM14B, DEK, PDCL3P4, SEC13, HACD1, MCM3, RANBP6, ITGA6, NOL7, FBXO16, SMARCA2, ZNF395, FN3KRP, DCTN3, TMEM258, NEU1, MDH1, and XRCC5) and 29 down regulated genes (JCAD, ZNF467, ATF5, DNAI4, GLI3, PTPN1, ESR1, PRKACA, CCND1, RIPOR1, SEZ6L, METRN, LRRC15, PTGS1, HGH1, SLC43A1, EXD2, GREM1, NCR1, PARM1, MAST4, CTAGE11P, IMPG2, CTTN, MANBA, CSRNP2, OLFML2B, PDE10A, and BNC2). Table 5 summarizes the differentially expressed genes (DEGs) in the development dataset. The column count indicates how many times a gene was called a DEG in the 10 trials. The Fold Change (FC) and False Discovery Rate (FDR) were averaged from 10 trials and placed in the FC and FDR columns of the table. The number of common genes between the prior marker gene and DEGs was only 7.

3.3. Optimal Marker Set and Model Selection by RF-RFE

Random Forest Recursive Feature Elimination (RF-RFE) was used as described in Section 2.5 to derive the optimal combination of markers for the model training from 1124 genes obtained from the union of prior marker genes (1079 genes) and DEGs (52 genes). Here, we used 70% of the development dataset (GSE25066) as the training set (40 pCR vs. 80 RD) and 30% of the data as the test set (17 pCR vs. 33 RD). Figure 2 shows the Receiver Operating Characteristic (ROC) and Precision Recall (PR) curves of the RF-RFE optimized model for the test set. Figure 2A,B show the ROC and PR curves of all 1000 models. It can be seen in the figure that all trained models are working well for the test set (mean BACC = 0.848, AUROC = 0.908 ± 0.019 , AUPRC = 0.891 ± 0.026 ). Figure 2C,D show the ROC and PR curves of the best model consisting of 86 genes (See Supplementary Table S1). The AUROC and AUPRC of the best model were 0.918 and 0.902, respectively. Table 6 shows the binary classification performance metrics for the best model at the predefined threshold of the False Positive Rate (FPR, α 10 % ). Here, positive indicates the desired outcome pCR, and negative indicates the undesired outcome RD.

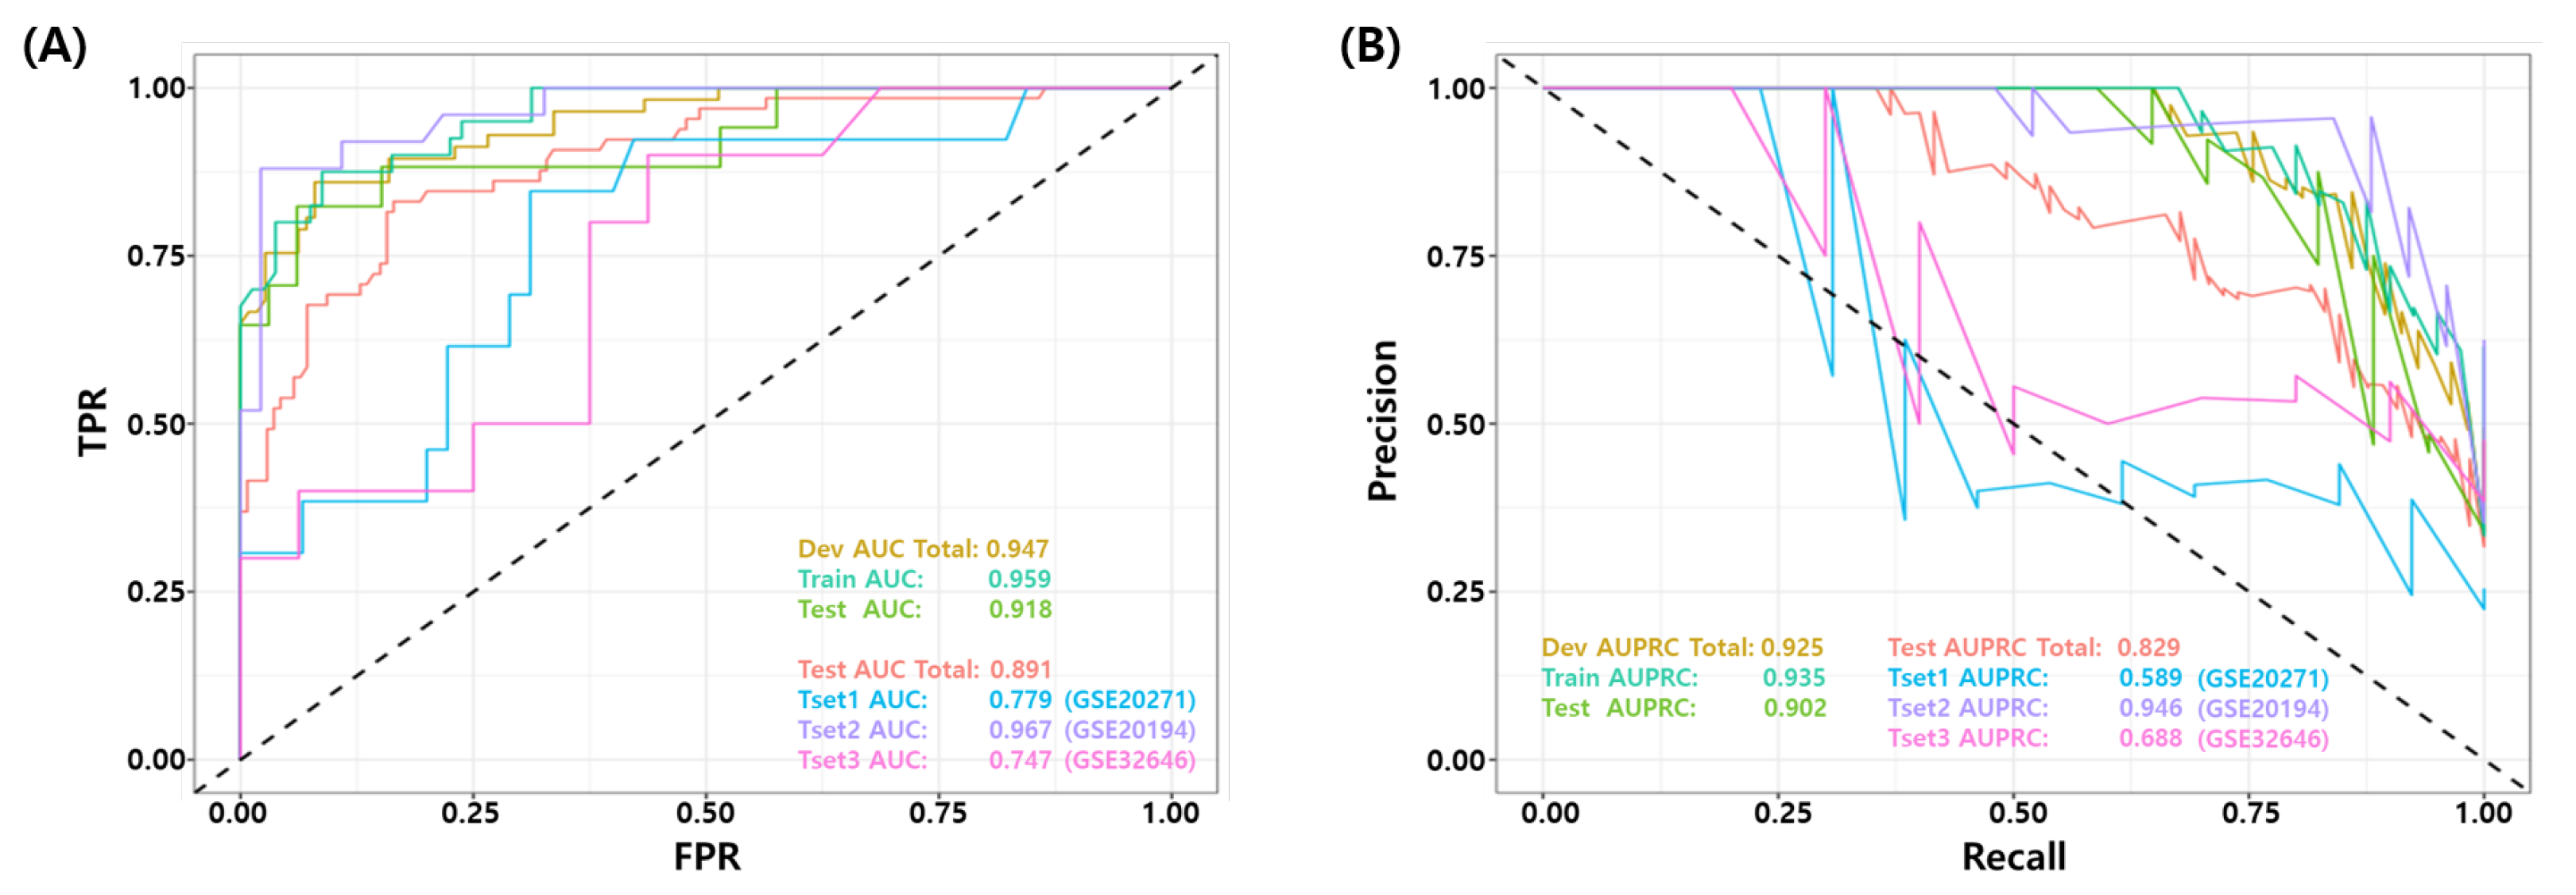
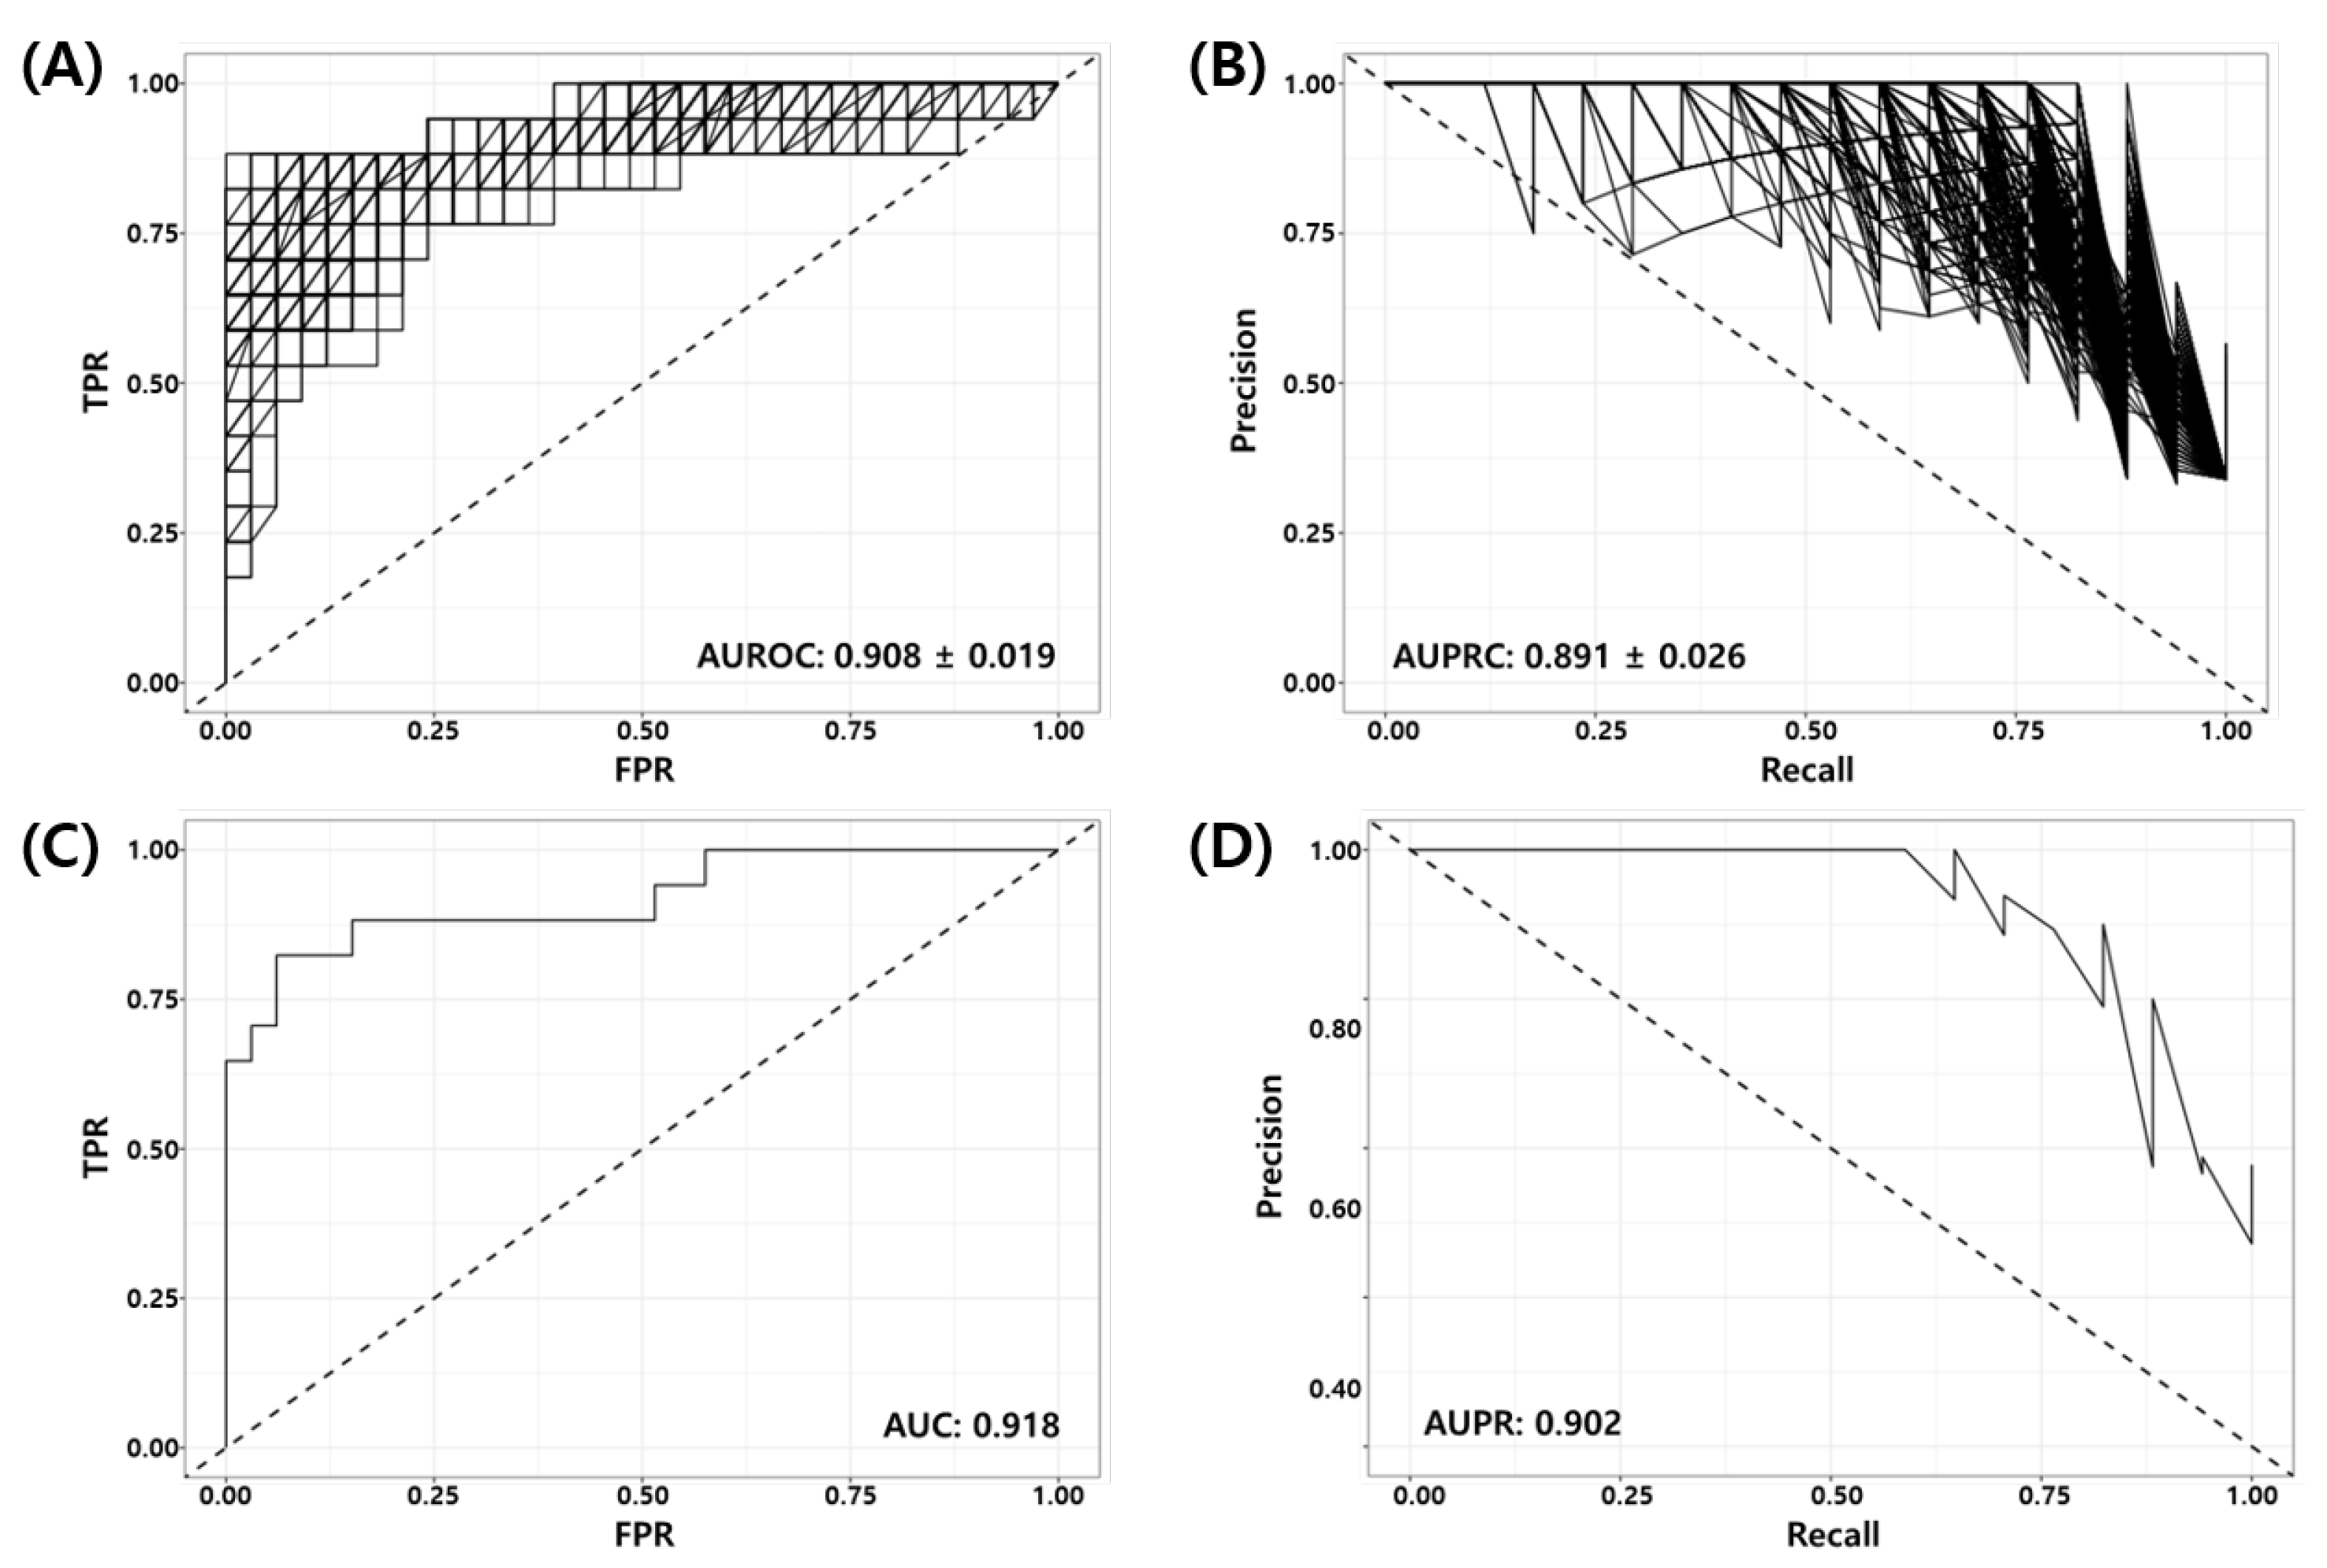
3.4. Validation of the Final Model Using Independent Test Datasets

The final model was validated on three independent data sets (GSE20271, GSE20194, and GSE32646). Figure 3 show the ROC and PR curves of the final model. The test AUROC and AUPRC of the final model for all test samples were 0.891 and 0.829, respectively. The final model performed better on the GSE20194 dataset compared to the other two datasets (GSE20271 and GSE32646), achieving an AUROC 0.967 vs. 0.779 and 0.747, respectively. Table 6 summarizes the binary classification performance of the final model for all test datasets. The average performance for all samples was as follows: BACC 0.800, TPR 0.692, PPV 0.907, NPV 0.864, F1 score 0.732, MCC 0.619, and Yoden’s Index 0.600, respectively. Again, the performance metrics were calculated from a predefined false positive rate (FPR, α 10 % ) threshold.

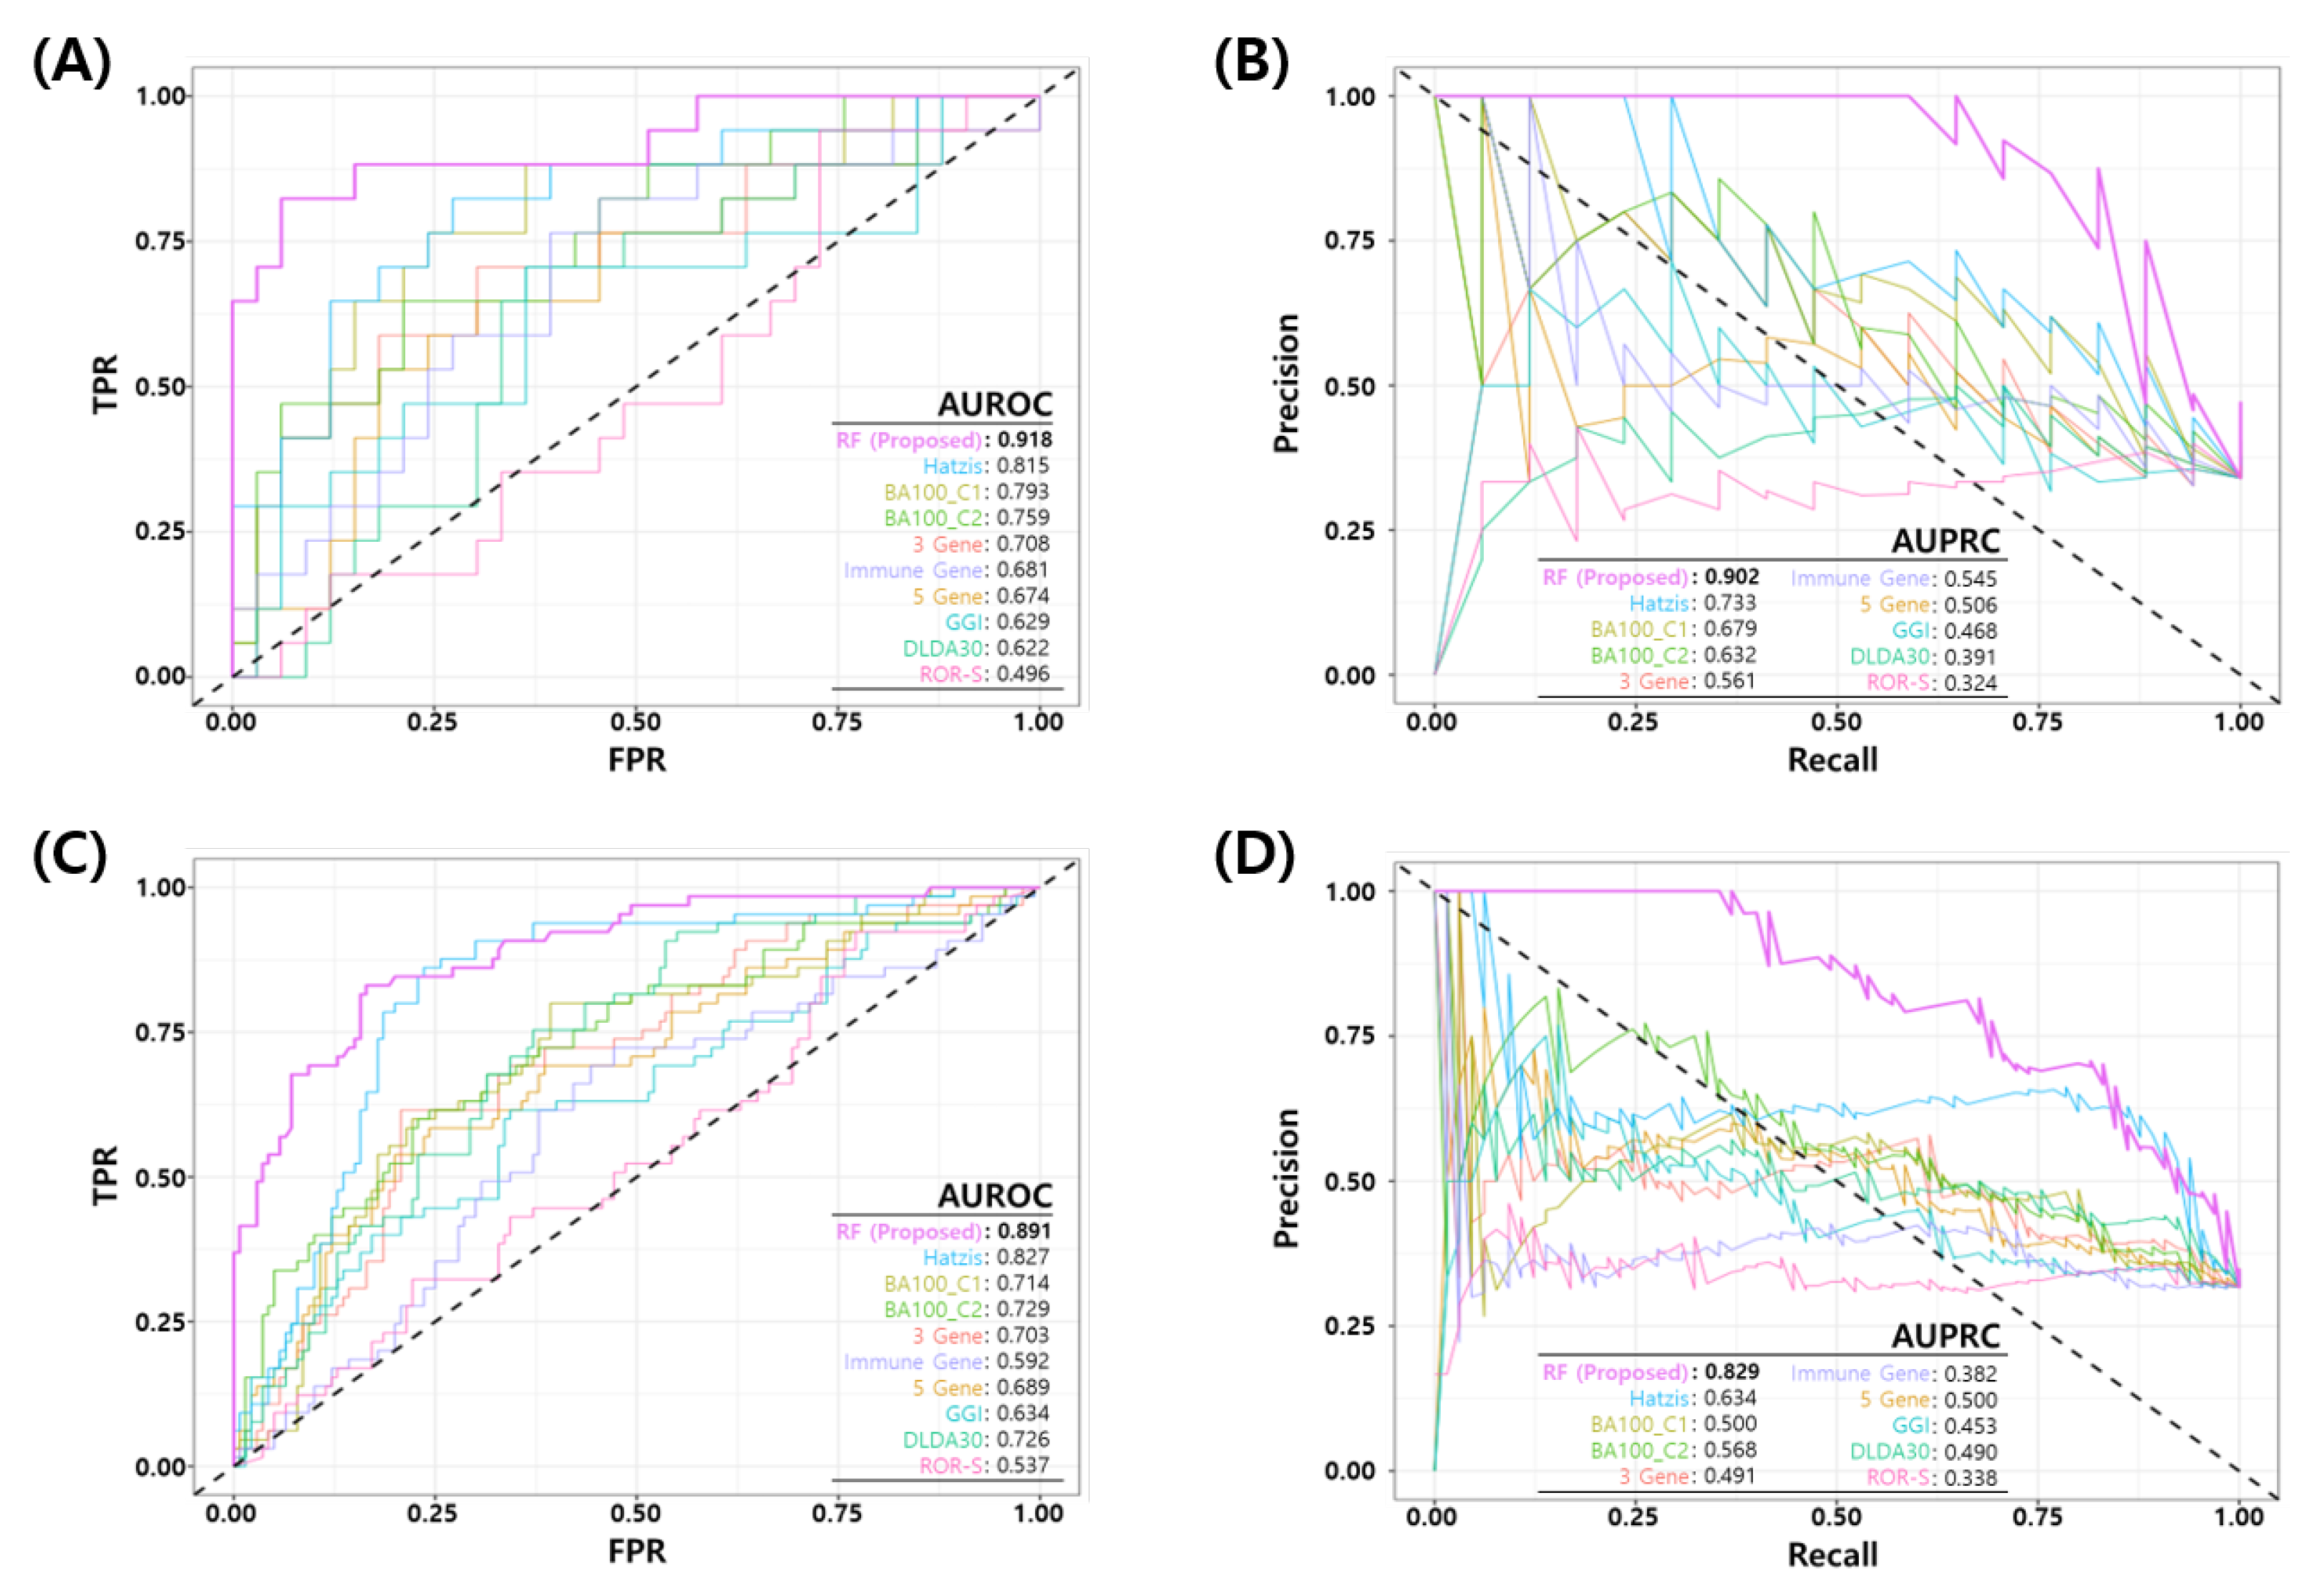
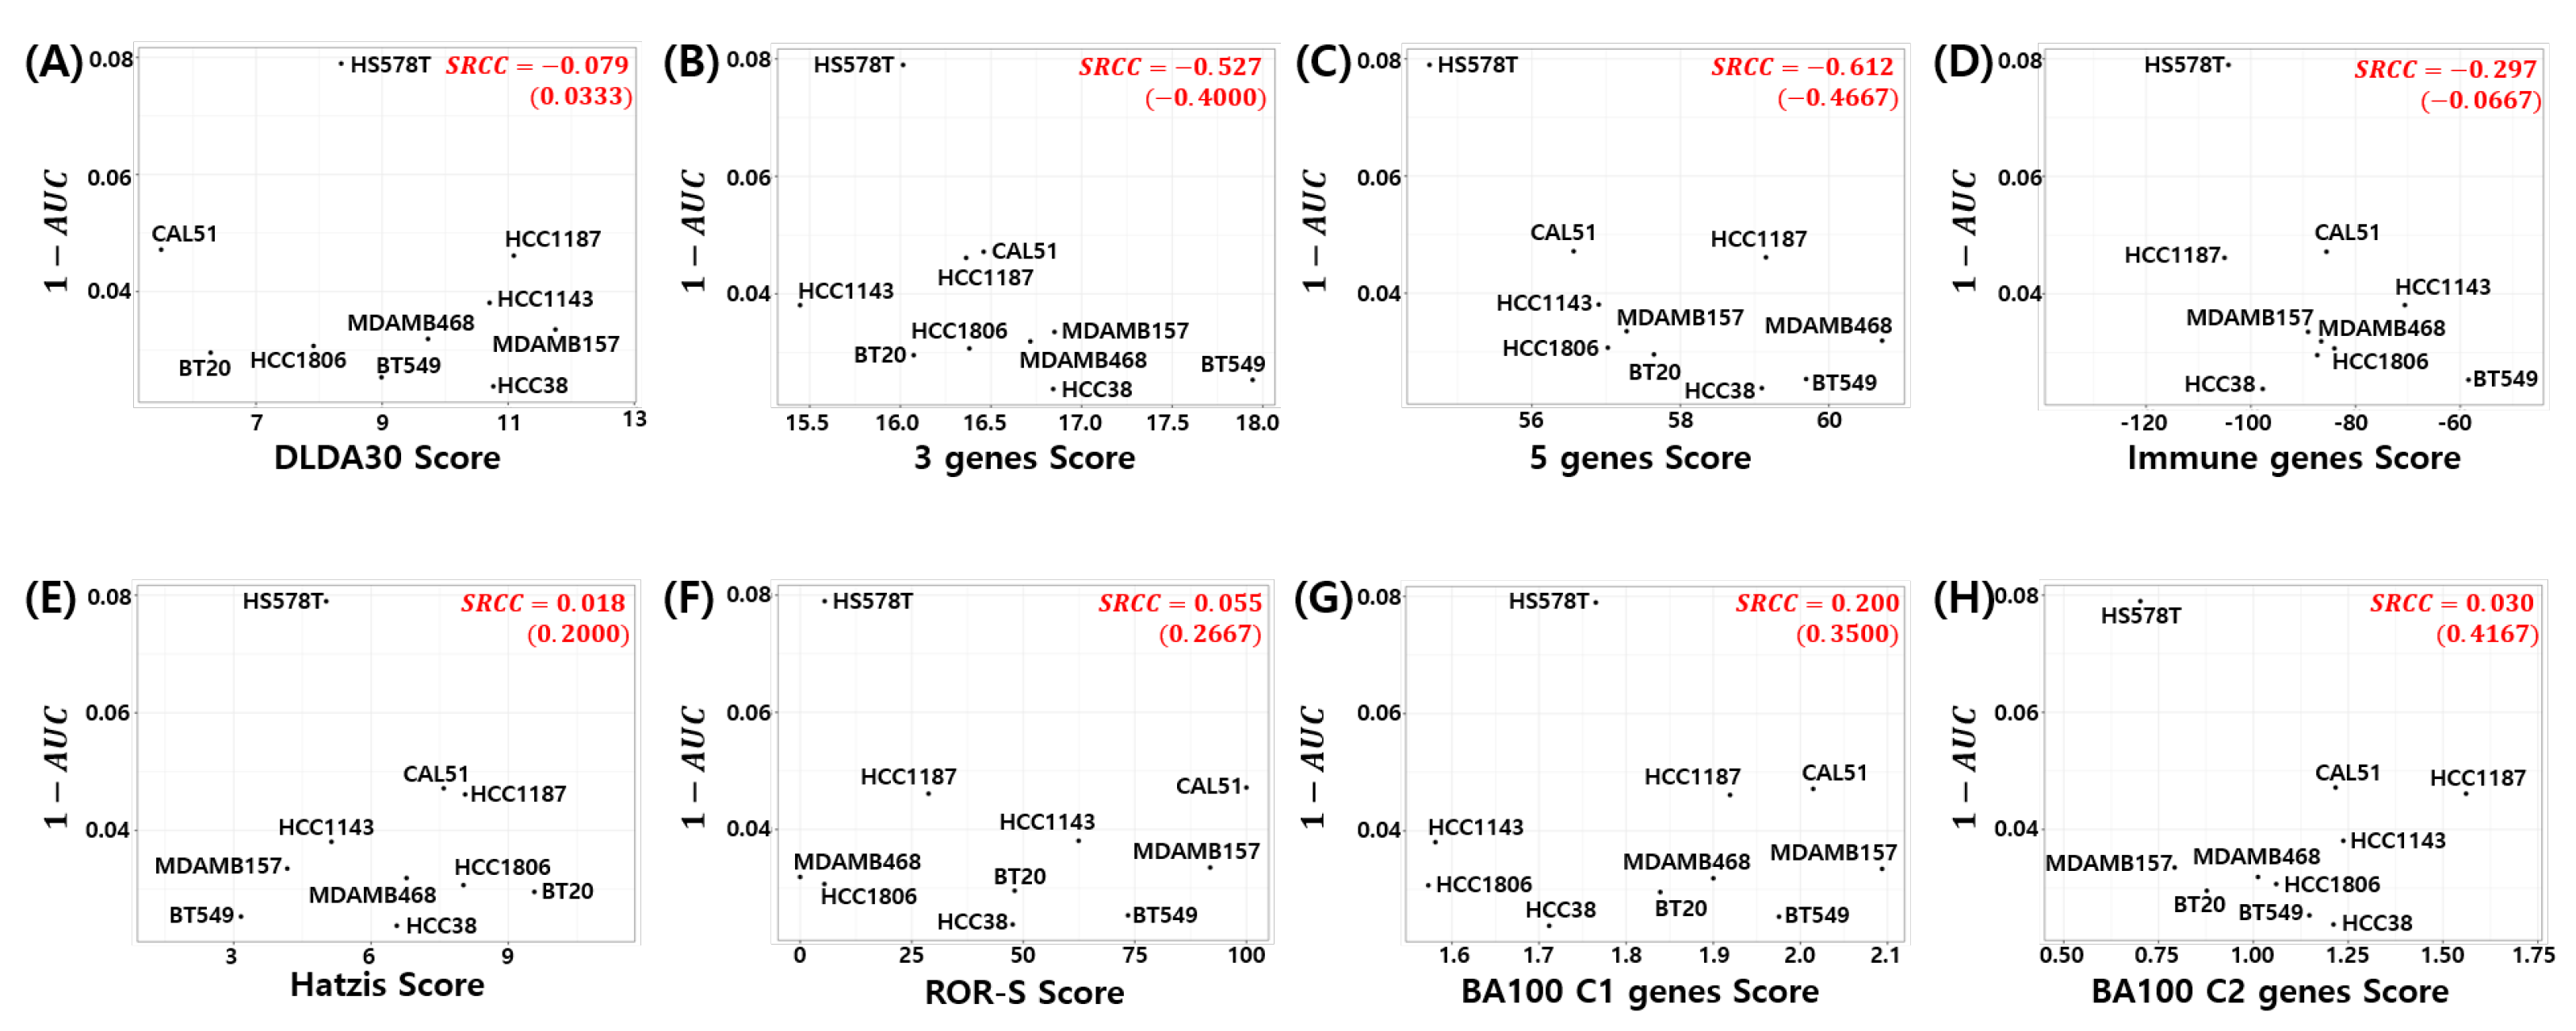
3.5. Comparative Analysis

We compared the performance of the proposed RF model with eight published NAC response prediction models, as discussed earlier. Figure 4 shows the ROC and PR curves of proposed RF and all other prediction models. Figure 4A,B show the ROC and PR curves of the test set in the development dataset (GSE25066) and Figure 4C,D show the ROC and PR curves of all the test sets in development and three independent test sets. The proposed model shows a better performance than all the other published models in terms of the AUROC/AUPRC (0.918/0.902 in development test set and 0.891/0.829 in all the test sets). Table 7 shows a comparison of the binary classification performance metrics for the proposed and eight published models at a predefined FPR threshold ( α 10 % ). For all the test sets, the proposed model shows a superior performance compared to the published models.

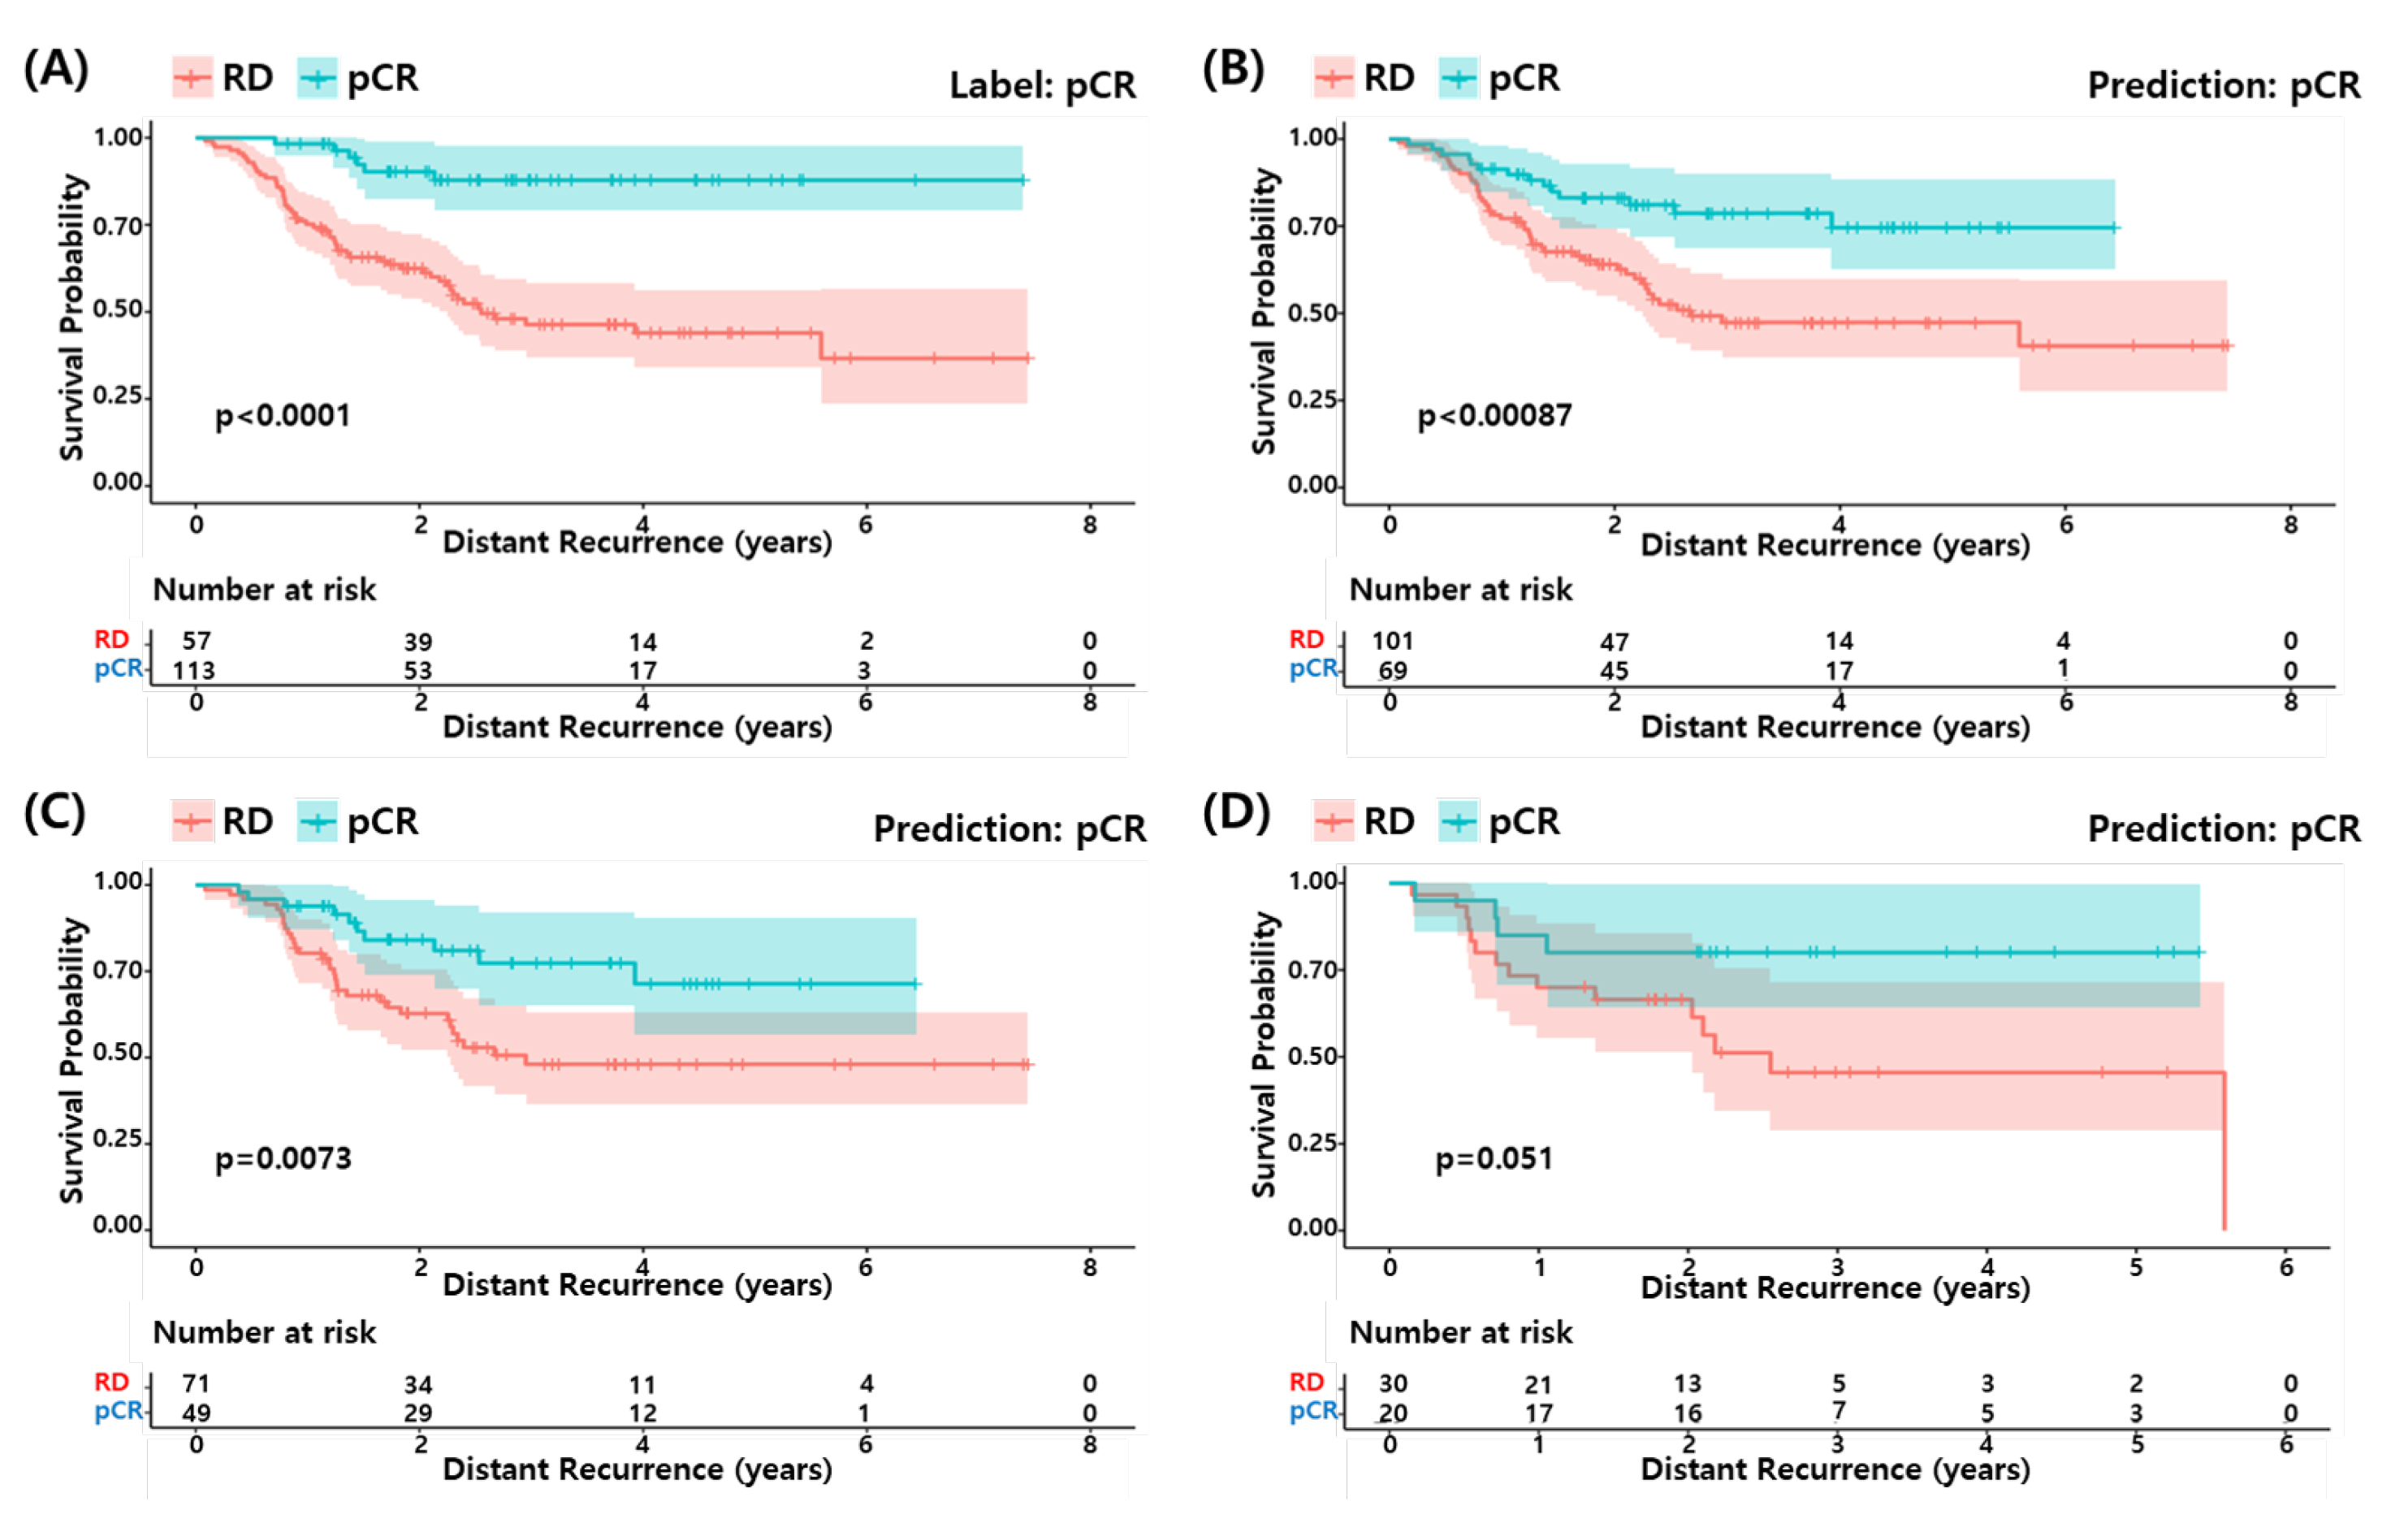
3.6. Survival Analysis

We performed survival analysis to determine if the pCR predicted by our model could predict a longer survival of the patients as the actual pCR. Figure 5 shows the survival curves for the actual pCR (A) and predicted pCR in (B) all, (C) training set and (D) test set of the development data (GSE25066). The predicted pCR showed a longer survival compared to the predicted RD patients in all cases. Although the statistical significance of the test set was relatively low due to the small sample size, the pCR predicted by the proposed RF model explains the differences in survival among the TNBC patients well.

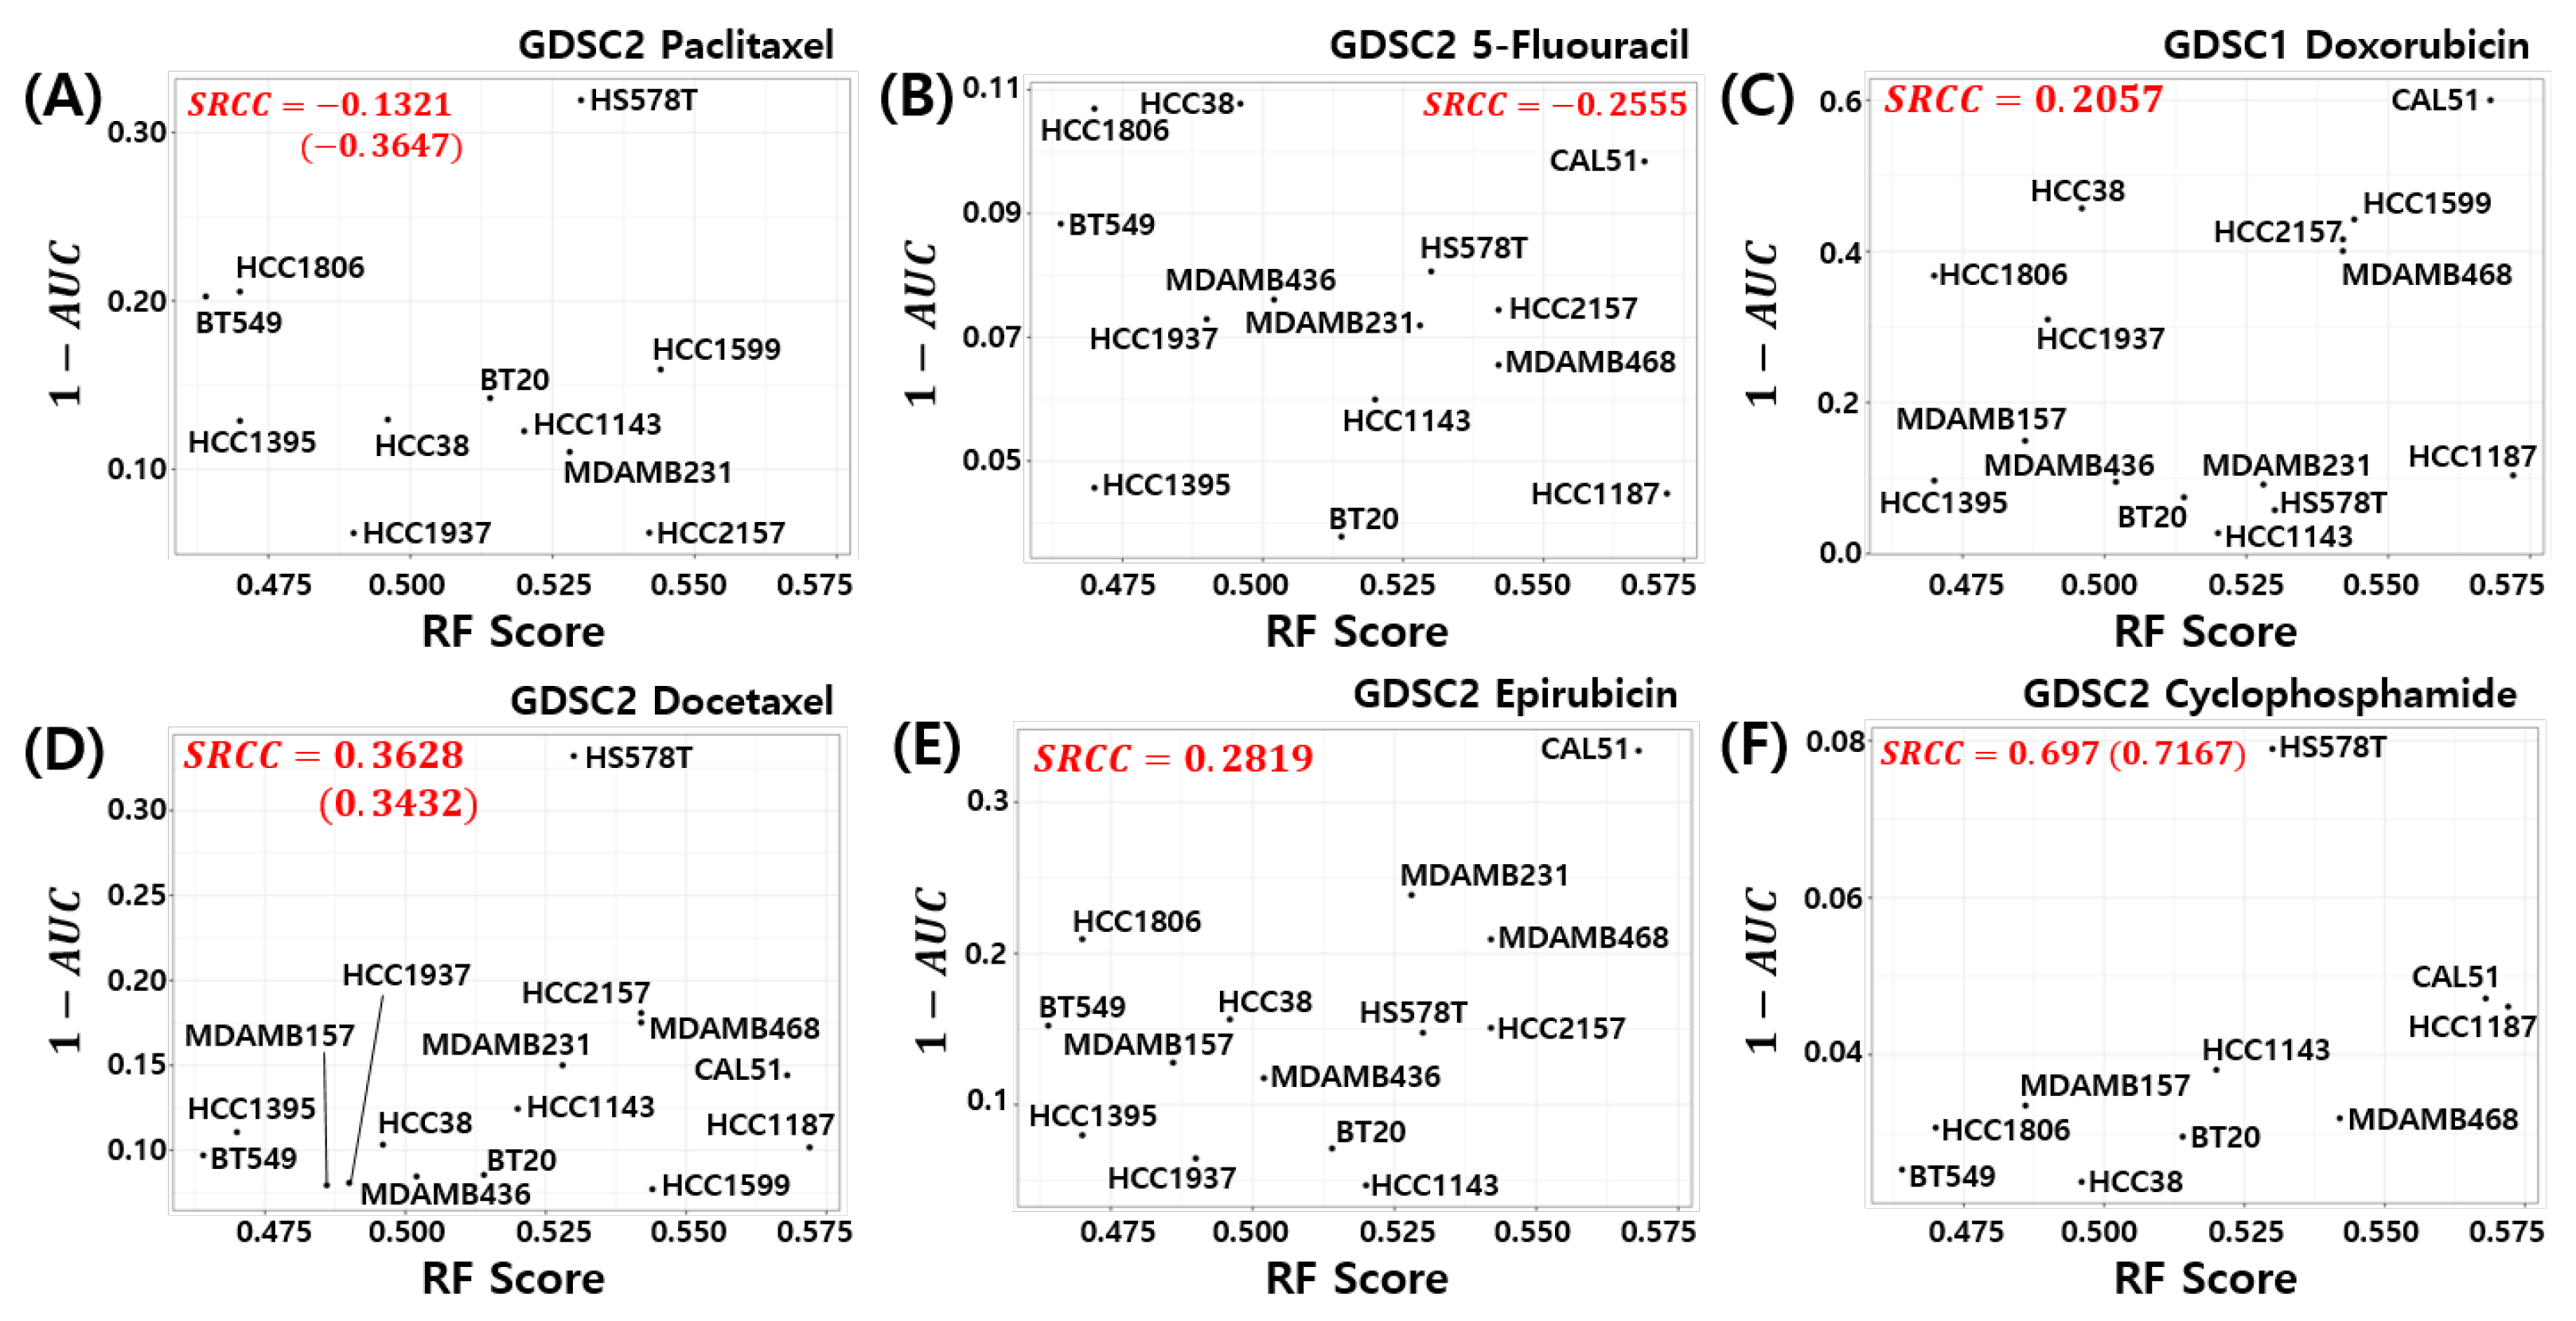
3.7. Relation to Chemosensitivity in TNBC Cell Models

Here, we investigated the relationship between the pCR score of the proposed model and chemosensitivity of the TNBC cell lines. As shown in Figure 6, the pCR score of the proposed model shows the highest Spearman rank correlation for cyclophosphamide sensitivity in the TNBC cell line compared to all other drugs used for the T/FAC or T/FEC treatment (SRCC = 0.697 , p-value = 0.031 ). A high AUC of the dose response curve means a low sensitivity of the cells to the target drug; thus, 1 A U C can be interpreted as the sensitivity score of the drug treated cell line. That is, the proposed model predicts a higher pCR probability when the TNBC cell line has a high sensitivity score to cyclophosphamide. We also investigated the SRCC between the pCR score and the cyclophosphamide chemosensitivity calculated by seven published models; however, as shown in Figure 7, none of the models showed a high positive correlation between the pCR score and the chemosensitivity of the TNBC cell lines. Because the HS578T cell data point appears to be an outlier, we recalculated the SRCC excluding the HS578T data point. As a result, the SRCC increased in all models, but the proposed model (SRCC = 0.7167 , p-value = 0.037 ) showed the highest SRCC. In the case of the BA100 model, the increase in SRCC values was very large when HS578T cells were excluded (SRCC = 0.200, 0.030 vs. 0.3500, 0.4167).

3.8. Cellular Functions Associated with the 86 Genes of the Proposed Model

In addition to the performance of the predictive models, a mechanistic understanding of the genes is important for clinical response prediction. To investigate the association between the 86 genes of our model and cellular function, we performed a function enrichment analysis [70] based on Fisher’s exact test on our in house module database.
Table 8 shows the result of the function enrichment analysis. We excluded phenotypic terms, which may cause confusion. Among the terms including five or more genes ( N g e n e 5 ), cases in which 30% or more of the genes of the corresponding term were mapped to the query genes were selected ( R a t i o m a p p e d 0.3 ). The results show an enrichment of DNA repair and cell cycle gene modules reported to be involved in the NAC response of TNBC [74,75].

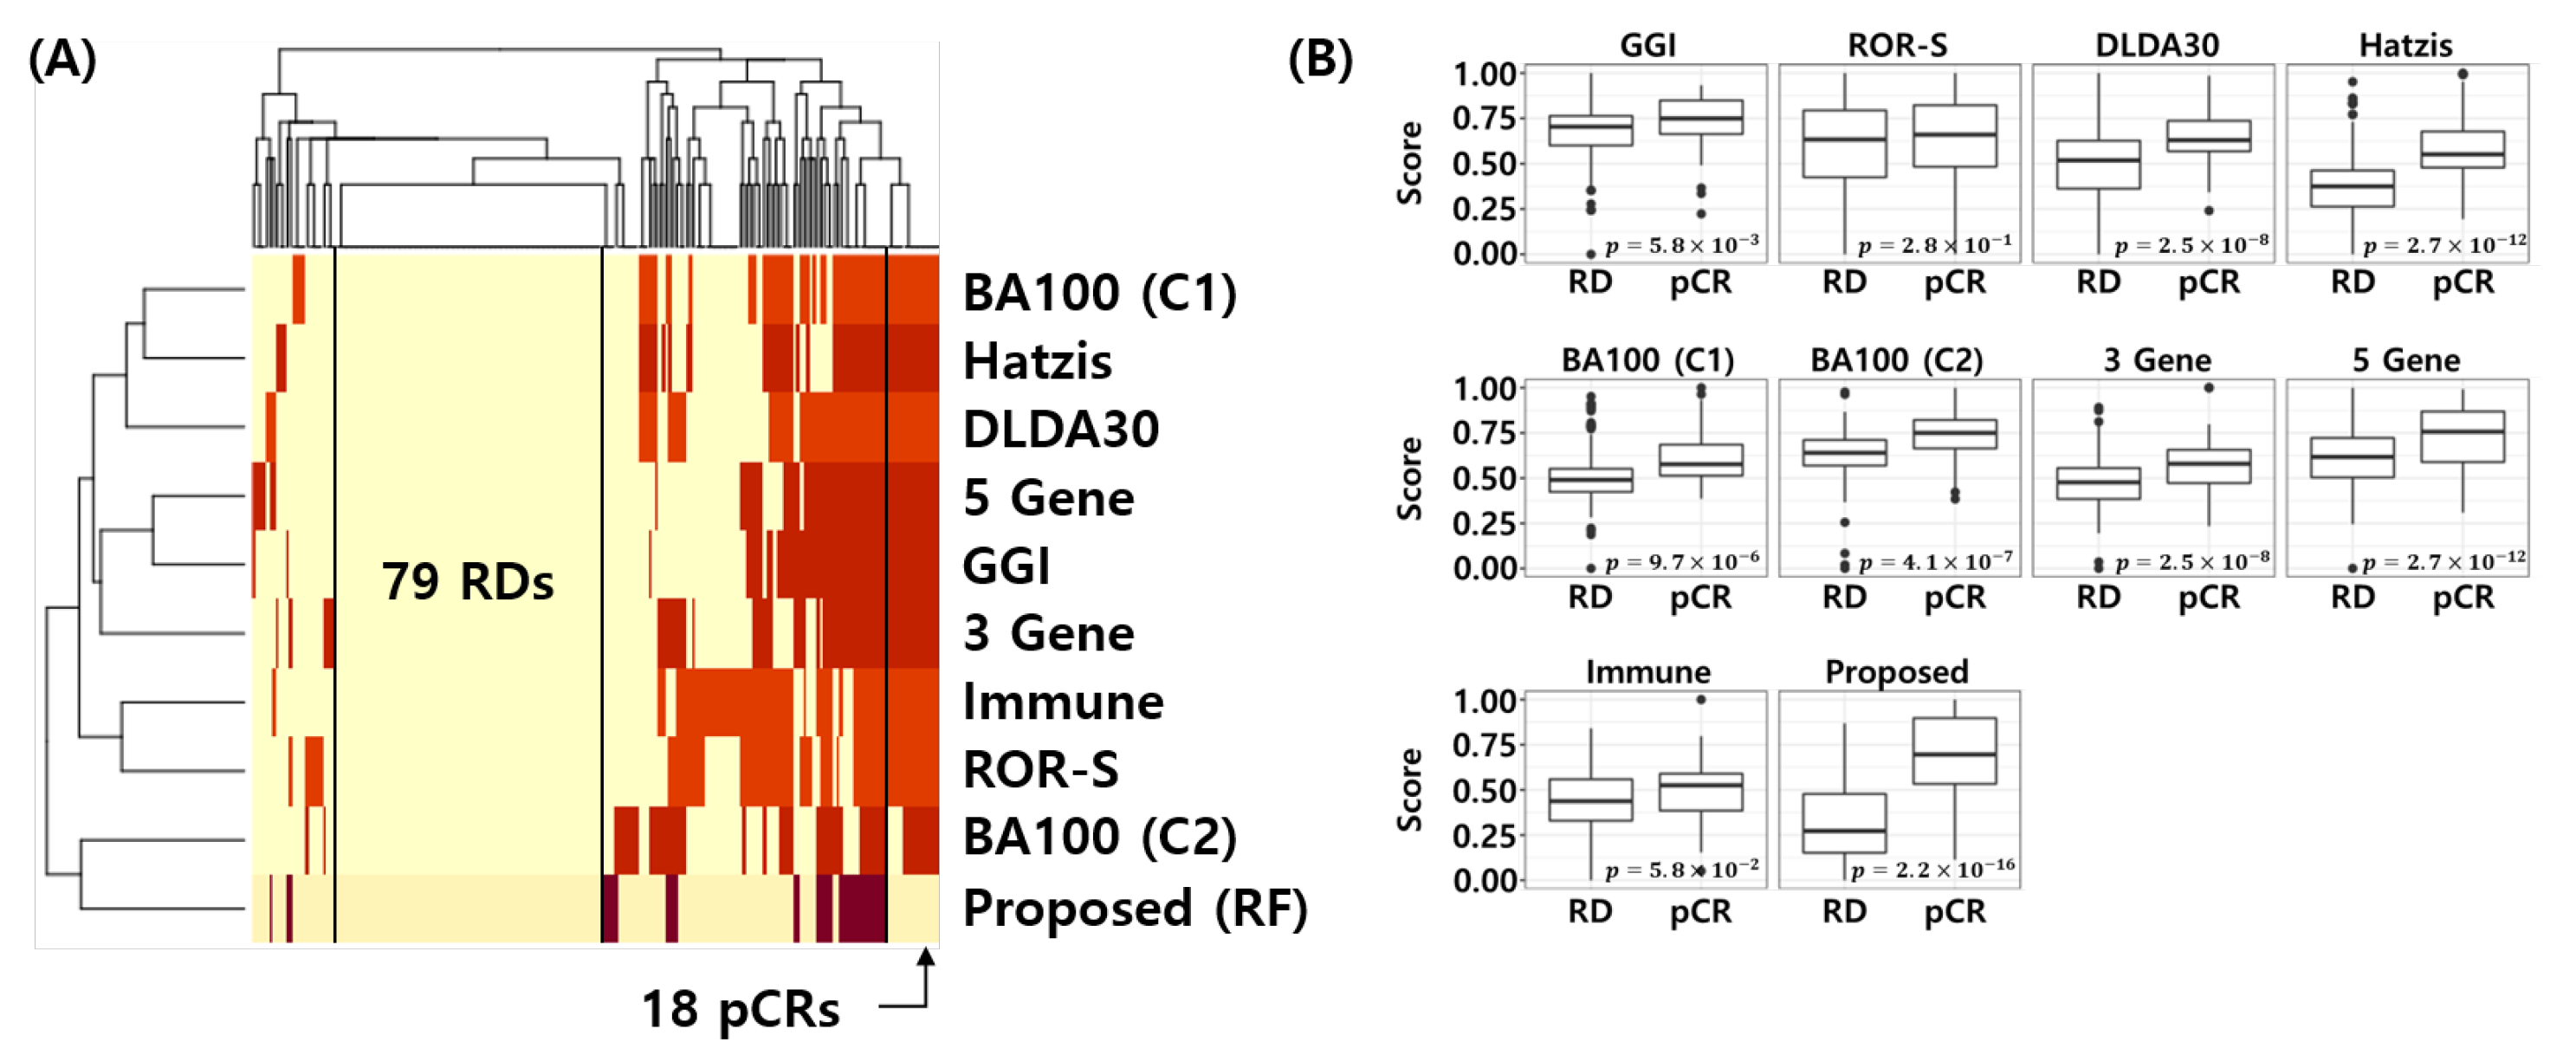
3.9. Visualization of the Error Matrix and Score Distributions

Figure 8A shows the error matrix of the published NAC response prediction models and proposed model. Here, yellow represents correctly classified samples and red represents misclassified samples for each model. Interestingly, all models are correctly classifying 79 RD patients and the proposed model correctly classifies the 18 pCR samples, which were misclassified by all 8 models. Figure 8B shows the min-max normalized score distribution of the NAC response prediction models for all test samples. t-test was used to calculate the p-value of the score difference between pCR and RD. This analysis reconfirms that the proposed model is most discriminative compared to all other models (t-test p-value < 2.2 × 10 16 ) In other words, the proposed model provides a better score distribution, which indicates a better calibration of the model that can separate pCR from RD patients more effectively.

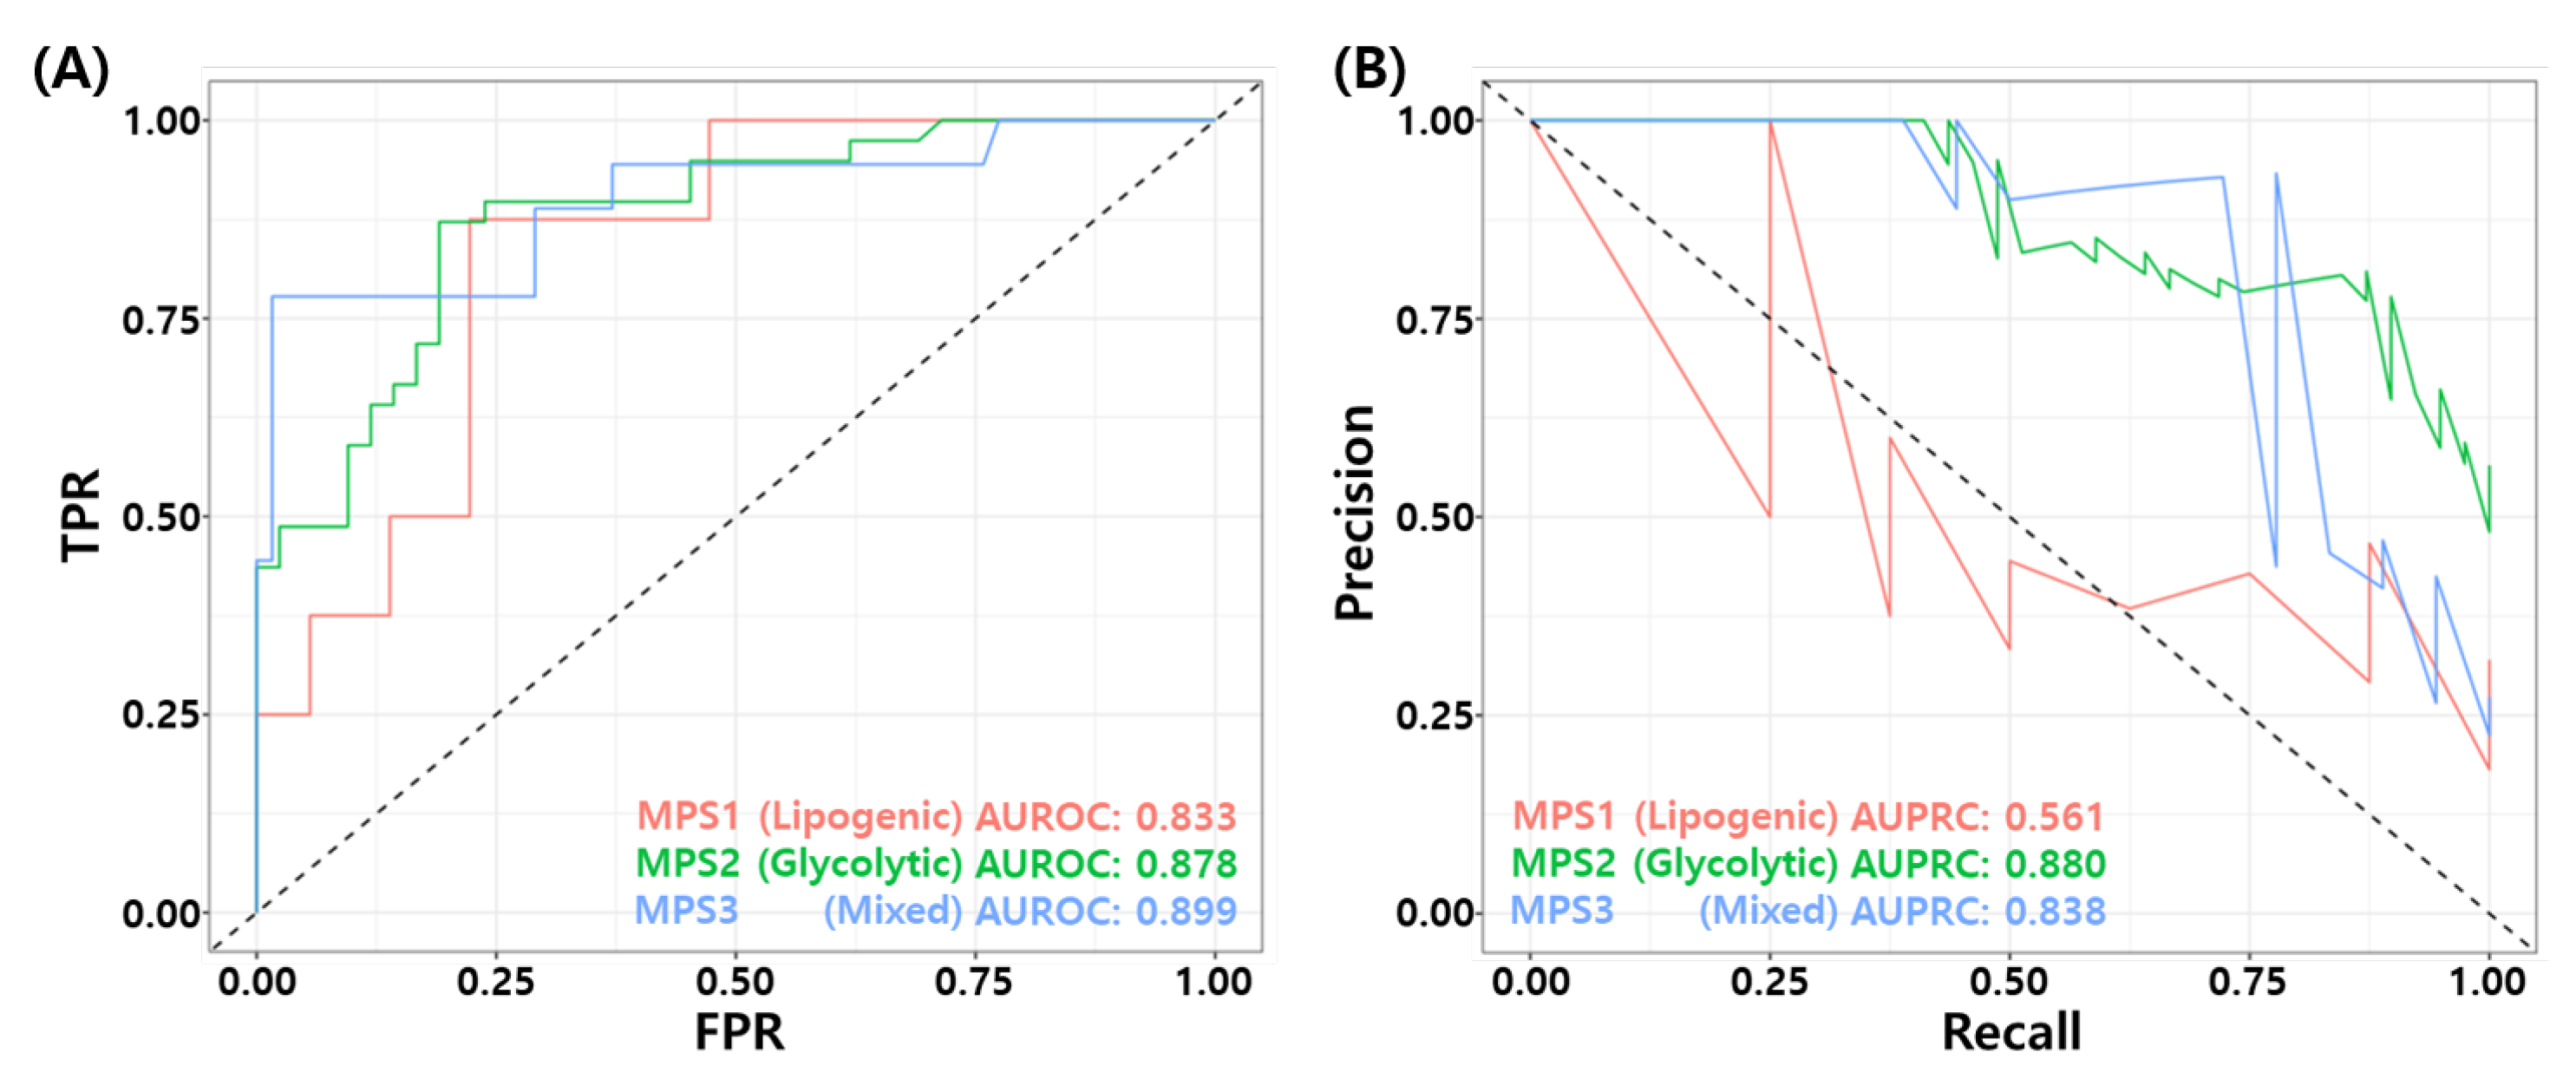
3.10. Association for Metabolic Pathway Based Subtypes

Recently, Gong et al. proposed metabolic-pathway based subtyping (MPS) of triple negative breast cancer to reveal potential therapeutic targets [76]. We stratified our test samples based on the MPS signatures suggested by Gong et al., and evaluate MPS specific performance of the proposed model. We performed GSVA for these MPS genesets on our test datasets. Among 205 samples, 44 samples were classified as MPS1, 81 samples were classified as MPS2, and 80 samples were classified as MPS3. MPS1 and MPS3 samples consist mostly of RD patients. In particular, 81% of MPS1 samples (36/42), and 77.5% of MPS3 samples are RD patients. MPS2 subtype contains 48% of pCR patients (39/81). Figure 9A,B shows the ROC and PR curves for MPS specific prediction by the proposed RF model. The proposed model showed relatively high performance in MPS2 and MPS3 subtypes compared to MPS1 subtype. Table 9 shows the binary classification performance of the proposed model for each MPS subtypes. The BACC of MPS1, MPS2, and MPS3 were 0.646, 0.747, and 0.841, respectively. These results may imply that the TNBC patients who have MPS 2 subtype can have higher probability of pCR with T/FAC or T/FEC based NAC.

4. Discussion

In this study, we developed a gene expression based NAC response prediction model using random forest recursive feature elimination (RF-RFE). Extensive characterization of the model performance using ROC, PR curves, and binary classification metrics at a predefined FPR threshold of 10% showed that the proposed 86 gene-based RF model outperforms the existing 8 NAC response predictive models. In addition, we investigated the relationship between the proposed model and drug sensitivity in the TNBC cell models. Our model shows a high Spearman’s rank correlation with cyclophosphamide sensitivity in TNBC cell lines. Through function enrichment analysis, we found that genes in our model are associated with DNA repair and cell cycle mechanisms.
Compared to prognostic models for ER+/HER2- patients currently used in clinical practice to evaluate the benefits of additional adjuvant chemotherapy [77], neoadjuvant chemotherapy response prediction models for TNBC patients are less convincing for use in clinical practice. The major concerns for these predictive models for NAC response is the misclassification of RD patients as pCR. This is because it not only guides overtreatment but also eliminates alternative treatment options for those patients. In other words, there is an unequal classification risk between the type I and type II errors, and in order to objectively evaluate the NAC response prediction models, it is necessary to control the type I error (FPR) below a certain level. We set this level as less than or equal to 10% and set the threshold based on the test set in the development dataset (GSE25066). The level selected in this study is similar to other types of NAC response prediction models, such as clinical variable based models [78], Ultrasound [79,80], and MRI imaging based [81] NAC response prediction models.
We also performed a literature survey for the association between NAC response and predictors of our model, in terms of their enriched mechanisms. Specifically, the genes mapped to the DNA repair term were MSH2 and MSH6. These genes have been reported to be associated with the NAC response in breast cancer [82,83,84]. Knockdown of MYCN has been reported to be associated with the NAC response of TNBC. [85]. Loss of ENO1 has been reported to correlate with clone forming unit (CFU) potential in MDA-MB-231 and BT-549 cell models associated with susceptibility to paclitaxel [86]. RAD51 [87] has been reported to be associated with homologous recombination deficiency (HRD) of TNBC, which affects the NAC response. Inhibition of CDK2 has been reported to be associated with the chemosensitivity of TNBC cell lines [88]. Inhibition of CDK2 has also been reported to be associated with growth inhibition in TNBC bearing mice [89] and reduced cell migration in TNBC cell lines [90]. E2F3 has been reported to be associated with doxorubicin responses [91] and EMT mechanisms in TNBC [92]. MCM2 and MCM3 have also been reported to have a role in DNA repair mechanisms in breast cancer [93], and these genes have also been reported as predictors of other NAC response predictive models [19,20]. The survey may indicate a possible mechanism of the NAC response in TNBC as DNA repair and cell cycle mechanisms by investigating the relationship between genes in the proposed model and the NAC response mechanism in TNBC.
Recently, Gong et al. proposed stratification of the TNBC patients using metabolic pathway enrichment based subtpying (MPS) [76]. They proposed three distinct subtypes, so called MPS1 (Lipogenic), MPS2 (Glycolytic) and MPS3 (Mixed) and validated their results through xenograft and organoid experiments. To derive the subtype, they performed geneset variation analysis (GSVA) for 86 metabolic pathway gene sets and consensus clustering on the GSVA score matrix. The proposed model best explained MPS2 model, which contains a large number of pCR patients compared to other two MPS subtypes. Because the proposed model is associated with DNA Repair mechanisms, the high performance of the proposed model in MPS2 subtype characterized by upregulation of carbohydrate and nucleotide metabolic pathways can be considered as consistent results with the report of Gong et al.
Although this study shows the utility of the proposed RF model, there are some limitations. First, we only utilized Affymetrix microarray datasets, so the proposed model may not be applicable to other platforms such as other microarray platforms and RNA sequencing datasets. Second, due to the limited number of available samples, the performance evaluated by the current study may be inconclusive. However, our results showed fairly consistent results across multiple cohorts. Third, the relationship between the chemosensitivity of TNBC cell lines and pCR probability drawn by the proposed model was only validated by some of the TNBC cell lines available in the GDSC datasets. Because drug sensitivity profiling projects are continuously expanding, we expect validation of the current results with updated drug profiling of the TNBC cell lines in near future.

5. Conclusions

In conclusion, the proposed 86 gene-based random forest model provides an accurate prediction of pCR after NAC in triple negative breast cancer and may be associated with DNA repair and cell cycle mechanisms. Our study suggests that the random forest based prediction model can provide a reliable prediction of the clinical response to neoadjuvant chemotherapy and may explain chemosensitivity in TNBC.

Supplementary Materials

The following supporting information can be downloaded at: https://www.mdpi.com/article/10.3390/cancers14040881/s1, Figure S1: Flowchart of model training and testing. Table S1: All 86 predictors of the final RF model and their feature importances.

Author Contributions

Methodology, software, formal analysis, data curation, writing—original draft preparation, visualization: S.P. supervision, G.Y. conceptualization, validation, writing—review and editing: S.P. and G.Y. All authors have read and agreed to the published version of the manuscript.

Funding

This study was supported by a grant from the Bio-Synergy Research Project (NRF-2012M3A9C4048759) of the Ministry of Science, ICT, and Future Planning through the National Research Foundation.

Institutional Review Board Statement

Not applicable.

Informed Consent Statement

Not applicable.

Data Availability Statement

Conflicts of Interest

The authors declare no conflict of interest.

References

  1. Foulkes, W.D.; Smith, I.E.; Reis-Filho, J.S. Triple-negative breast cancer. N. Engl. J. Med. 2010, 363, 1938–1948. [Google Scholar] [CrossRef] [Green Version]
  2. Bauer, K.R.; Brown, M.; Cress, R.D.; Parise, C.A.; Caggiano, V. Descriptive analysis of estrogen receptor (ER)-negative, progesterone receptor (PR)-negative, and HER2-negative invasive breast cancer, the so-called triple-negative phenotype: A population-based study from the California cancer Registry. Cancer 2007, 109, 1721–1728. [Google Scholar] [CrossRef] [PubMed]
  3. Lyons, T.G. Targeted therapies for triple-negative breast cancer. Curr. Treat. Options Oncol. 2019, 20, 1–13. [Google Scholar] [CrossRef] [PubMed]
  4. Korde, L.A.; Somerfield, M.R.; Carey, L.A.; Crews, J.R.; Denduluri, N.; Hwang, E.S.; Khan, S.A.; Loibl, S.; Morris, E.A.; Perez, A.; et al. Neoadjuvant chemotherapy, endocrine therapy, and targeted therapy for breast cancer: ASCO guideline. J. Clin. Oncol. Off. J. Am. Soc. Clin. Oncol. 2021, 39, 1485–1505. [Google Scholar] [CrossRef] [PubMed]
  5. Eikesdal, H.P.; Yndestad, S.; Elzawahry, A.; Llop-Guevara, A.; Gilje, B.; Blix, E.S.; Espelid, H.; Lundgren, S.; Geisler, J.; Vagstad, G.; et al. Olaparib monotherapy as primary treatment in unselected triple negative breast cancer. Ann. Oncol. 2021, 32, 240–249. [Google Scholar] [CrossRef] [PubMed]
  6. Schmid, P.; Cortes, J.; Pusztai, L.; McArthur, H.; Kümmel, S.; Bergh, J.; Denkert, C.; Park, Y.H.; Hui, R.; Harbeck, N.; et al. Pembrolizumab for early triple-negative breast cancer. N. Engl. J. Med. 2020, 382, 810–821. [Google Scholar] [CrossRef]
  7. Bardia, A.; Hurvitz, S.A.; Tolaney, S.M.; Loirat, D.; Punie, K.; Oliveira, M.; Brufsky, A.; Sardesai, S.D.; Kalinsky, K.; Zelnak, A.B.; et al. Sacituzumab govitecan in metastatic triple-negative breast cancer. N. Engl. J. Med. 2021, 384, 1529–1541. [Google Scholar] [CrossRef]
  8. Vagia, E.; Mahalingam, D.; Cristofanilli, M. The landscape of targeted therapies in TNBC. Cancers 2020, 12, 916. [Google Scholar] [CrossRef] [Green Version]
  9. Isakoff, S.J. Triple negative breast cancer: Role of specific chemotherapy agents. Cancer J. 2010, 16, 53. [Google Scholar] [CrossRef] [PubMed] [Green Version]
  10. Rapoport, B.; Barnard-Tidy, J.; Van Eeden, R.; Smit, T.; Nayler, S.; Benn, C. Pathological complete response in early breast cancer patients undergoing neoadjuvant chemotherapy: Focus on Ki-67 and molecular subtypes. Ann. Oncol. 2019, 30, iii37. [Google Scholar] [CrossRef]
  11. Esserman, L.J.; Berry, D.A.; DeMichele, A.; Carey, L.; Davis, S.E.; Buxton, M.; Hudis, C.; Gray, J.W.; Perou, C.; Yau, C.; et al. Pathologic complete response predicts recurrence-free survival more effectively by cancer subset: Results from the I-SPY 1 TRIAL—CALGB 150007/150012, ACRIN 6657. J. Clin. Oncol. 2012, 30, 3242. [Google Scholar] [CrossRef] [PubMed] [Green Version]
  12. Von Minckwitz, G.; Untch, M.; Blohmer, J.U.; Costa, S.D.; Eidtmann, H.; Fasching, P.A.; Gerber, B.; Eiermann, W.; Hilfrich, J.; Huober, J.; et al. Definition and impact of pathologic complete response on prognosis after neoadjuvant chemotherapy in various intrinsic breast cancer subtypes. J. Clin. Oncol. 2012, 30, 1796–1804. [Google Scholar] [CrossRef] [Green Version]
  13. Asaoka, M.; Narui, K.; Suganuma, N.; Chishima, T.; Yamada, A.; Sugae, S.; Kawai, S.; Uenaka, N.; Teraoka, S.; Miyahara, K.; et al. Clinical and pathological predictors of recurrence in breast cancer patients achieving pathological complete response to neoadjuvant chemotherapy. Eur. J. Surg. Oncol. 2019, 45, 2289–2294. [Google Scholar] [CrossRef] [PubMed]
  14. Liedtke, C.; Mazouni, C.; Hess, K.R.; André, F.; Tordai, A.; Mejia, J.A.; Symmans, W.F.; Gonzalez-Angulo, A.M.; Hennessy, B.; Green, M.; et al. Response to neoadjuvant therapy and long-term survival in patients with triple-negative breast cancer. J. Clin. Oncol. 2008, 26, 1275–1281. [Google Scholar] [CrossRef]
  15. Bagegni, N.A.; Tao, Y.; Ademuyiwa, F.O. Clinical outcomes with neoadjuvant versus adjuvant chemotherapy for triple negative breast cancer: A report from the National Cancer Database. PLoS ONE 2019, 14, e0222358. [Google Scholar] [CrossRef] [PubMed]
  16. Xu, W.; Chen, X.; Deng, F.; Zhang, J.; Zhang, W.; Tang, J. Predictors of Neoadjuvant Chemotherapy Response in Breast Cancer: A Review. Oncotargets Ther. 2020, 13, 5887. [Google Scholar] [CrossRef]
  17. Kwa, M.; Makris, A.; Esteva, F.J. Clinical utility of gene-expression signatures in early stage breast cancer. Nat. Rev. Clin. Oncol. 2017, 14, 595–610. [Google Scholar] [CrossRef]
  18. Hatzis, C.; Pusztai, L.; Valero, V.; Booser, D.J.; Esserman, L.; Lluch, A.; Vidaurre, T.; Holmes, F.; Souchon, E.; Wang, H.; et al. A genomic predictor of response and survival following taxane-anthracycline chemotherapy for invasive breast cancer. JAMA 2011, 305, 1873–1881. [Google Scholar] [CrossRef] [Green Version]
  19. Oshi, M.; Angarita, F.A.; Tokumaru, Y.; Yan, L.; Matsuyama, R.; Endo, I.; Takabe, K. A Novel Three-Gene Score as a Predictive Biomarker for Pathologically Complete Response after Neoadjuvant Chemotherapy in Triple-Negative Breast Cancer. Cancers 2021, 13, 2401. [Google Scholar] [CrossRef]
  20. Oshi, M.; Gandhi, S.; Angarita, F.A.; Kim, T.H.; Tokumaru, Y.; Yan, L.; Matsuyama, R.; Endo, I.; Takabe, K. A novel five-gene score to predict complete pathological response to neoadjuvant chemotherapy in ER-positive/HER2-negative breast cancer. Am. J. Cancer Res. 2021, 11, 3611. [Google Scholar]
  21. Fu, C.; Liu, Y.; Han, X.; Pan, Y.; Wang, H.Q.; Wang, H.; Dai, H.; Yang, W. An Immune-Associated Genomic Signature Effectively Predicts Pathologic Complete Response to Neoadjuvant Paclitaxel and Anthracycline-Based Chemotherapy in Breast Cancer. Front. Immunol. 2021, 12, 3453. [Google Scholar] [CrossRef]
  22. Liedtke, C.; Hatzis, C.; Symmans, W.F.; Desmedt, C.; Haibe-Kains, B.; Valero, V.; Kuerer, H.; Hortobagyi, G.N.; Piccart-Gebhart, M.; Sotiriou, C.; et al. Genomic grade index is associated with response to chemotherapy in patients with breast cancer. J. Clin. Oncol. 2009, 27, 3185. [Google Scholar] [CrossRef] [Green Version]
  23. Hess, K.R.; Anderson, K.; Symmans, W.F.; Valero, V.; Ibrahim, N.; Mejia, J.A.; Booser, D.; Theriault, R.L.; Buzdar, A.U.; Dempsey, P.J.; et al. Pharmacogenomic predictor of sensitivity to preoperative chemotherapy with paclitaxel and fluorouracil, doxorubicin, and cyclophosphamide in breast cancer. J. Clin. Oncol. 2006, 24, 4236–4244. [Google Scholar] [CrossRef] [Green Version]
  24. Friedman, J.; Popescu, B.E. Gradient Directed Regularization for Linear Regression and Classification; Technical Report; Statistics Department, Stanford University: Stanford, CA, USA, 2003. [Google Scholar]
  25. Ma, S.; Huang, J. Regularized ROC method for disease classification and biomarker selection with microarray data. Bioinformatics 2005, 21, 4356–4362. [Google Scholar] [CrossRef]
  26. Fournier, M.V.; Goodwin, E.C.; Chen, J.; Obenauer, J.C.; Tannenbaum, S.H.; Brufsky, A.M. A predictor of pathological complete response to neoadjuvant chemotherapy stratifies triple negative breast cancer patients with high risk of recurrence. Sci. Rep. 2019, 9, 1–9. [Google Scholar] [CrossRef]
  27. Parker, J.S.; Mullins, M.; Cheang, M.C.; Leung, S.; Voduc, D.; Vickery, T.; Davies, S.; Fauron, C.; He, X.; Hu, Z.; et al. Supervised risk predictor of breast cancer based on intrinsic subtypes. J. Clin. Oncol. 2009, 27, 1160. [Google Scholar] [CrossRef]
  28. Li, Y.; Bellotti, T.; Adams, N. Issues using logistic regression with class imbalance, with a case study from credit risk modelling. Found. Data Sci. 2019, 1, 389. [Google Scholar] [CrossRef] [Green Version]
  29. Sota, Y.; Naoi, Y.; Tsunashima, R.; Kagara, N.; Shimazu, K.; Maruyama, N.; Shimomura, A.; Shimoda, M.; Kishi, K.; Baba, Y.; et al. Construction of novel immune-related signature for prediction of pathological complete response to neoadjuvant chemotherapy in human breast cancer. Ann. Oncol. 2014, 25, 100–106. [Google Scholar] [CrossRef]
  30. Breiman, L. Random forests. Mach. Learn. 2001, 45, 5–32. [Google Scholar] [CrossRef] [Green Version]
  31. Tabchy, A.; Valero, V.; Vidaurre, T.; Lluch, A.; Gomez, H.; Martin, M.; Qi, Y.; Barajas-Figueroa, L.J.; Souchon, E.; Coutant, C.; et al. Evaluation of a 30-gene paclitaxel, fluorouracil, doxorubicin, and cyclophosphamide chemotherapy response predictor in a multicenter randomized trial in breast cancer. Clin. Cancer Res. 2010, 16, 5351–5361. [Google Scholar] [CrossRef] [Green Version]
  32. Shi, L.; Campbell, G.; Jones, W.D.; Campagne, F.; Wen, Z.; Walker, S.J.; Su, Z.; Chu, T.M.; Goodsaid, F.M.; Pusztai, L.; et al. The MicroArray Quality Control (MAQC)-II study of common practices for the development and validation of microarray-based predictive models. Nat. Biotechnol. 2010, 28, 827–838. [Google Scholar]
  33. Miyake, T.; Nakayama, T.; Naoi, Y.; Yamamoto, N.; Otani, Y.; Kim, S.J.; Shimazu, K.; Shimomura, A.; Maruyama, N.; Tamaki, Y.; et al. GSTP 1 expression predicts poor pathological complete response to neoadjuvant chemotherapy in ER-negative breast cancer. Cancer Sci. 2012, 103, 913–920. [Google Scholar] [CrossRef]
  34. Gautier, L.; Cope, L.; Bolstad, B.M.; Irizarry, R.A. Affy—analysis of Affymetrix GeneChip data at the probe level. Bioinformatics 2004, 20, 307–315. [Google Scholar] [CrossRef]
  35. Perscheid, C. Integrative biomarker detection on high-dimensional gene expression data sets: A survey on prior knowledge approaches. Briefings Bioinform. 2021, 22, bbaa151. [Google Scholar] [CrossRef]
  36. Harbeck, N.; Gnant, M. Breast cancer. Lancet 2016, 389, 1134–1150. [Google Scholar] [CrossRef]
  37. Bertucci, F.; Ng, C.K.; Patsouris, A.; Droin, N.; Piscuoglio, S.; Carbuccia, N.; Soria, J.C.; Dien, A.T.; Adnani, Y.; Kamal, M.; et al. Genomic characterization of metastatic breast cancers. Nature 2019, 569, 560–564. [Google Scholar] [CrossRef]
  38. Sanchez-Vega, F.; Mina, M.; Armenia, J.; Chatila, W.K.; Luna, A.; La, K.C.; Dimitriadoy, S.; Liu, D.L.; Kantheti, H.S.; Saghafinia, S.; et al. Oncogenic signaling pathways in the cancer genome atlas. Cell 2018, 173, 321–337. [Google Scholar] [CrossRef] [Green Version]
  39. Leo, C.P.; Leo, C.; Szucs, T.D. Breast cancer drug approvals by the US FDA from 1949 to 2018. Nat. Rev. Drug Discov. 2020, 19, 11–12. [Google Scholar] [CrossRef]
  40. Dai, X.; Xiang, L.; Li, T.; Bai, Z. Cancer hallmarks, biomarkers and breast cancer molecular subtypes. J. Cancer 2016, 7, 1281. [Google Scholar] [CrossRef] [Green Version]
  41. Nik-Zainal, S.; Davies, H.; Staaf, J.; Ramakrishna, M.; Glodzik, D.; Zou, X.; Martincorena, I.; Alexandrov, L.B.; Martin, S.; Wedge, D.C.; et al. Landscape of somatic mutations in 560 breast cancer whole-genome sequences. Nature 2016, 534, 47–54. [Google Scholar] [CrossRef]
  42. Koboldt, D.; Fulton, R.; McLellan, M.; Schmidt, H.; Kalicki-Veizer, J.; McMichael, J.; Fulton, L.; Dooling, D.; Ding, L.; Mardis, E.; et al. Comprehensive molecular portraits of human breast tumours. Nature 2012, 490, 61–70. [Google Scholar]
  43. Piñero, J.; Ramírez-Anguita, J.M.; Saüch-Pitarch, J.; Ronzano, F.; Centeno, E.; Sanz, F.; Furlong, L.I. The DisGeNET knowledge platform for disease genomics: 2019 update. Nucleic Acids Res. 2020, 48, D845–D855. [Google Scholar] [CrossRef] [Green Version]
  44. Ursu, O.; Holmes, J.; Knockel, J.; Bologa, C.G.; Yang, J.J.; Mathias, S.L.; Nelson, S.J.; Oprea, T.I. DrugCentral: Online drug compendium. Nucleic Acids Res. 2016, 45, D932–D939. [Google Scholar] [CrossRef]
  45. Wishart, D.S.; Feunang, Y.D.; Guo, A.C.; Lo, E.J.; Marcu, A.; Grant, J.R.; Sajed, T.; Johnson, D.; Li, C.; Sayeeda, Z.; et al. DrugBank 5.0: A major update to the DrugBank database for 2018. Nucleic Acids Res. 2018, 46, D1074–D1082. [Google Scholar] [CrossRef]
  46. Freshour, S.L.; Kiwala, S.; Cotto, K.C.; Coffman, A.C.; McMichael, J.F.; Song, J.J.; Griffith, M.; Griffith, O.L.; Wagner, A.H. Integration of the Drug–Gene Interaction Database (DGIdb 4.0) with open crowdsource efforts. Nucleic Acids Res. 2021, 49, D1144–D1151. [Google Scholar] [CrossRef]
  47. Paik, S.; Shak, S.; Tang, G.; Kim, C.; Baker, J.; Cronin, M.; Baehner, F.L.; Walker, M.G.; Watson, D.; Park, T.; et al. A multigene assay to predict recurrence of tamoxifen-treated, node-negative breast cancer. N. Engl. J. Med. 2004, 351, 2817–2826. [Google Scholar] [CrossRef] [Green Version]
  48. Van’t Veer, L.J.; Dai, H.; Van De Vijver, M.J.; He, Y.D.; Hart, A.A.; Mao, M.; Peterse, H.L.; Van Der Kooy, K.; Marton, M.J.; Witteveen, A.T.; et al. Gene expression profiling predicts clinical outcome of breast cancer. Nature 2002, 415, 530–536. [Google Scholar] [CrossRef] [Green Version]
  49. Filipits, M.; Rudas, M.; Jakesz, R.; Dubsky, P.; Fitzal, F.; Singer, C.F.; Dietze, O.; Greil, R.; Jelen, A.; Sevelda, P.; et al. A new molecular predictor of distant recurrence in ER-positive, HER2-negative breast cancer adds independent information to conventional clinical risk factors. Clin. Cancer Res. 2011, 17, 6012–6020. [Google Scholar] [CrossRef] [Green Version]
  50. Jerevall, P.L.; Ma, X.J.; Li, H.; Salunga, R.; Kesty, N.C.; Erlander, M.G.; Sgroi, D.; Holmlund, B.; Skoog, L.; Fornander, T.; et al. Prognostic utility of HOXB13: IL17BR and molecular grade index in early-stage breast cancer patients from the Stockholm trial. Br. J. Cancer 2011, 104, 1762–1769. [Google Scholar] [CrossRef]
  51. Naoi, Y.; Kishi, K.; Tanei, T.; Tsunashima, R.; Tominaga, N.; Baba, Y.; Kim, S.J.; Taguchi, T.; Tamaki, Y.; Noguchi, S. Development of 95-gene classifier as a powerful predictor of recurrences in node-negative and ER-positive breast cancer patients. Breast Cancer Res. Treat. 2011, 128, 633–641. [Google Scholar] [CrossRef]
  52. Oh, E.; Choi, Y.L.; Park, T.; Lee, S.; Nam, S.J.; Shin, Y.K. A prognostic model for lymph node-negative breast cancer patients based on the integration of proliferation and immunity. Breast Cancer Res. Treat. 2012, 132, 499–509. [Google Scholar] [CrossRef]
  53. Sotiriou, C.; Wirapati, P.; Loi, S.; Harris, A.; Fox, S.; Smeds, J.; Nordgren, H.; Farmer, P.; Praz, V.; Haibe-Kains, B.; et al. Gene expression profiling in breast cancer: Understanding the molecular basis of histologic grade to improve prognosis. J. Natl. Cancer Inst. 2006, 98, 262–272. [Google Scholar] [CrossRef]
  54. Kohl, M. MKinfer: Inferential Statistics, R Package Version 0.6; 2020. Available online: https://cran.r-project.org/web/packages/MKinfer/index.html (accessed on 15 December 2021).
  55. Janssen, A. Studentized permutation tests for non-iid hypotheses and the generalized Behrens-Fisher problem. Stat. Probab. Lett. 1997, 36, 9–21. [Google Scholar] [CrossRef]
  56. Benjamini, Y.; Hochberg, Y. Controlling the false discovery rate: A practical and powerful approach to multiple testing. J. R. Stat. Soc. Ser. B 1995, 57, 289–300. [Google Scholar] [CrossRef]
  57. Chawla, N.V.; Bowyer, K.W.; Hall, L.O.; Kegelmeyer, W.P. SMOTE: Synthetic minority over-sampling technique. J. Artif. Intell. Res. 2002, 16, 321–357. [Google Scholar] [CrossRef]
  58. Torgo, L. Data Mining with R: Learning with Case Studies; CRC Press: Boca Raton, FL, USA, 2011. [Google Scholar]
  59. Kuhn, M. Building predictive models in R using the caret package. J. Stat. Softw. 2008, 28, 1–26. [Google Scholar] [CrossRef] [Green Version]
  60. Karapanagiotis, S.; Benedetto, U.; Mukherjee, S.; Kirk, P.D.; Newcombe, P.J. Tailored Bayes: A risk modelling framework under unequal misclassification costs. arXiv 2021, arXiv:2104.01822. [Google Scholar] [CrossRef]
  61. Tong, X.; Feng, Y.; Li, J.J. Neyman-Pearson classification algorithms and NP receiver operating characteristics. Sci. Adv. 2018, 4, eaao1659. [Google Scholar] [CrossRef] [Green Version]
  62. Zhang, K.; Li, J.; Zhu, Q.; Chang, C. Prediction of pathologic complete response by ultrasonography and magnetic resonance imaging after neoadjuvant chemotherapy in patients with breast cancer. Cancer Manag. Res. 2020, 12, 2603. [Google Scholar] [CrossRef] [Green Version]
  63. Gendoo, D.M.; Ratanasirigulchai, N.; Schröder, M.S.; Paré, L.; Parker, J.S.; Prat, A.; Haibe-Kains, B. Genefu: An R/Bioconductor package for computation of gene expression-based signatures in breast cancer. Bioinformatics 2016, 32, 1097–1099. [Google Scholar] [CrossRef] [Green Version]
  64. Kassambara, A.; Kosinski, M.; Biecek, P.; Fabian, S. Survminer: Drawing Survival Curves using ‘ggplot2’. R Package Version 0.4.9. 2021. Available online: https://cran.r-project.org/web/packages/survminer/index.html (accessed on 15 December 2021).
  65. Yang, W.; Soares, J.; Greninger, P.; Edelman, E.J.; Lightfoot, H.; Forbes, S.; Bindal, N.; Beare, D.; Smith, J.A.; Thompson, I.R.; et al. Genomics of Drug Sensitivity in Cancer (GDSC): A resource for therapeutic biomarker discovery in cancer cells. Nucleic Acids Res. 2012, 41, D955–D961. [Google Scholar] [CrossRef] [Green Version]
  66. Bouhaddou, M.; DiStefano, M.S.; Riesel, E.A.; Carrasco, E.; Holzapfel, H.Y.; Jones, D.C.; Smith, G.R.; Stern, A.D.; Somani, S.S.; Thompson, T.V.; et al. Drug response consistency in CCLE and CGP. Nature 2016, 540, E9–E10. [Google Scholar] [CrossRef]
  67. Rees, M.G.; Seashore-Ludlow, B.; Cheah, J.H.; Adams, D.J.; Price, E.V.; Gill, S.; Javaid, S.; Coletti, M.E.; Jones, V.L.; Bodycombe, N.E.; et al. Correlating chemical sensitivity and basal gene expression reveals mechanism of action. Nat. Chem. Biol. 2016, 12, 109–116. [Google Scholar] [CrossRef]
  68. Corsello, S.M.; Nagari, R.T.; Spangler, R.D.; Rossen, J.; Kocak, M.; Bryan, J.G.; Humeidi, R.; Peck, D.; Wu, X.; Tang, A.A.; et al. Discovering the anticancer potential of non-oncology drugs by systematic viability profiling. Nat. Cancer 2020, 1, 235–248. [Google Scholar] [CrossRef] [Green Version]
  69. Chavez, K.J.; Garimella, S.V.; Lipkowitz, S. Triple negative breast cancer cell lines: One tool in the search for better treatment of triple negative breast cancer. Breast Dis. 2010, 32, 35. [Google Scholar] [CrossRef] [Green Version]
  70. Khatri, P.; Drăghici, S. Ontological analysis of gene expression data: Current tools, limitations, and open problems. Bioinformatics 2005, 21, 3587–3595. [Google Scholar] [CrossRef] [PubMed] [Green Version]
  71. Consortium, G.O. The gene ontology resource: 20 years and still GOing strong. Nucleic Acids Res. 2019, 47, D330–D338. [Google Scholar]
  72. Liberzon, A.; Subramanian, A.; Pinchback, R.; Thorvaldsdóttir, H.; Tamayo, P.; Mesirov, J.P. Molecular signatures database (MSigDB) 3.0. Bioinformatics 2011, 27, 1739–1740. [Google Scholar] [CrossRef] [PubMed]
  73. Kuleshov, M.V.; Jones, M.R.; Rouillard, A.D.; Fernandez, N.F.; Duan, Q.; Wang, Z.; Koplev, S.; Jenkins, S.L.; Jagodnik, K.M.; Lachmann, A.; et al. Enrichr: A comprehensive gene set enrichment analysis web server 2016 update. Nucleic Acids Res. 2016, 44, W90–W97. [Google Scholar] [CrossRef] [Green Version]
  74. Anand, K.; Patel, T.; Niravath, P.; Rodriguez, A.; Darcourt, J.; Belcheva, A.; Boone, T.; Ensor, J.; Chang, J. Targeting mTOR and DNA repair pathways in residual triple negative breast cancer post neoadjuvant chemotherapy. Sci. Rep. 2021, 11, 1–8. [Google Scholar]
  75. Radosevic-Robin, N.; Selenica, P.; Zhu, Y.; Won, H.H.; Berger, M.F.; Ferrando, L.; Cocco, E.; Privat, M.; Ponelle-Chachuat, F.; Abrial, C.; et al. Recurrence biomarkers of triple negative breast cancer treated with neoadjuvant chemotherapy and anti-EGFR antibodies. NPJ Breast Cancer 2021, 7, 1–10. [Google Scholar] [CrossRef]
  76. Gong, Y.; Ji, P.; Yang, Y.S.; Xie, S.; Yu, T.J.; Xiao, Y.; Jin, M.L.; Ma, D.; Guo, L.W.; Pei, Y.C.; et al. Metabolic-pathway-based subtyping of triple-negative breast cancer reveals potential therapeutic targets. Cell Metab. 2021, 33, 51–64. [Google Scholar] [CrossRef] [PubMed]
  77. Andre, F.; Ismaila, N.; Henry, N.L.; Somerfield, M.R.; Bast, R.C.; Barlow, W.; Collyar, D.E.; Hammond, M.E.; Kuderer, N.M.; Liu, M.C.; et al. Use of biomarkers to guide decisions on adjuvant systemic therapy for women with early-stage invasive breast cancer: ASCO clinical practice guideline update—integration of results from TAILORx. J. Clin. Oncol. 2019, 37, 1956–1964. [Google Scholar] [CrossRef] [Green Version]
  78. Meti, N.; Saednia, K.; Lagree, A.; Tabbarah, S.; Mohebpour, M.; Kiss, A.; Lu, F.I.; Slodkowska, E.; Gandhi, S.; Jerzak, K.J.; et al. Machine learning frameworks to predict neoadjuvant chemotherapy response in breast cancer using clinical and pathological features. JCO Clin. Cancer Inf. 2021, 5, 66–80. [Google Scholar] [CrossRef] [PubMed]
  79. Wang, J.; Chu, Y.; Wang, B.; Jiang, T. A Narrative Review of Ultrasound Technologies for the Prediction of Neoadjuvant Chemotherapy Response in Breast Cancer. Cancer Manag. Res. 2021, 13, 7885. [Google Scholar] [CrossRef] [PubMed]
  80. Baumgartner, A.; Tausch, C.; Hosch, S.; Papassotiropoulos, B.; Varga, Z.; Rageth, C.; Baege, A. Ultrasound-based prediction of pathologic response to neoadjuvant chemotherapy in breast cancer patients. Breast 2018, 39, 19–23. [Google Scholar] [CrossRef] [PubMed]
  81. Comes, M.C.; Fanizzi, A.; Bove, S.; Didonna, V.; Diotaiuti, S.; La Forgia, D.; Latorre, A.; Martinelli, E.; Mencattini, A.; Nardone, A.; et al. Early prediction of neoadjuvant chemotherapy response by exploiting a transfer learning approach on breast DCE-MRIs. Sci. Rep. 2021, 11, 1–12. [Google Scholar] [CrossRef] [PubMed]
  82. Dasgupta, H.; Islam, S.; Alam, N.; Roy, A.; Roychoudhury, S.; Panda, C.K. Hypomethylation of mismatch repair genes MLH1 and MSH2 is associated with chemotolerance of breast carcinoma: Clinical significance. J. Surg. Oncol. 2019, 119, 88–100. [Google Scholar] [CrossRef] [PubMed] [Green Version]
  83. O’Reilly, E.A.; Gubbins, L.; Sharma, S.; Tully, R.; Guang, M.H.Z.; Weiner-Gorzel, K.; McCaffrey, J.; Harrison, M.; Furlong, F.; Kell, M.; et al. The fate of chemoresistance in triple negative breast cancer (TNBC). BBA Clin. 2015, 3, 257–275. [Google Scholar] [CrossRef] [Green Version]
  84. Ren, X.y.; Song, Y.; Wang, J.; Chen, L.y.; Pang, J.y.; Zhou, L.R.; Shen, S.j.; Cao, X.; Wang, Y.x.; Shao, M.m.; et al. Mismatch repair deficiency and microsatellite instability in triple-negative breast cancer: A retrospective study of 440 patients. Front. Oncol. 2021, 11, 570623. [Google Scholar] [CrossRef]
  85. Schafer, J.M.; Lehmann, B.D.; Gonzalez-Ericsson, P.I.; Marshall, C.B.; Beeler, J.S.; Redman, L.N.; Jin, H.; Sanchez, V.; Stubbs, M.C.; Scherle, P.; et al. Targeting MYCN-expressing triple-negative breast cancer with BET and MEK inhibitors. Sci. Transl. Med. 2020, 12, 534. [Google Scholar] [CrossRef] [PubMed]
  86. Vishnubalaji, R.; Alajez, N.M. Transcriptional landscape associated with TNBC resistance to neoadjuvant chemotherapy revealed by single-cell RNA-seq. Mol.-Ther.-Oncolytics 2021, 23, 151–162. [Google Scholar] [CrossRef] [PubMed]
  87. Llop-Guevara, A.; Loibl, S.; Villacampa, G.; Vladimirova, V.; Schneeweiss, A.; Karn, T.; Zahm, D.M.; Herencia-Ropero, A.; Jank, P.; van Mackelenbergh, M.; et al. Association of RAD51 with homologous recombination deficiency (HRD) and clinical outcomes in untreated triple-negative breast cancer (TNBC): Analysis of the GeparSixto randomized clinical trial. Ann. Oncol. 2021, 32, 1590–1596. [Google Scholar] [CrossRef] [PubMed]
  88. Opyrchal, M.; Salisbury, J.L.; Iankov, I.; Goetz, M.P.; McCubrey, J.; Gambino, M.W.; Malatino, L.; Puccia, G.; Ingle, J.N.; Galanis, E.; et al. Inhibition of Cdk2 kinase activity selectively targets the CD44+/CD24-/Low stem-like subpopulation and restores chemosensitivity of SUM149PT triple-negative breast cancer cells. Int. J. Oncol. 2014, 45, 1193–1199. [Google Scholar] [CrossRef] [Green Version]
  89. Nie, L.; Wei, Y.; Zhang, F.; Hsu, Y.H.; Chan, L.C.; Xia, W.; Ke, B.; Zhu, C.; Deng, R.; Tang, J.; et al. CDK2-mediated site-specific phosphorylation of EZH2 drives and maintains triple-negative breast cancer. Nat. Commun. 2019, 10, 1–15. [Google Scholar] [CrossRef] [PubMed]
  90. Tarasewicz, E.; Rivas, L.; Hamdan, R.; Dokic, D.; Parimi, V.; Bernabe, B.P.; Thomas, A.; Shea, L.D.; Jeruss, J.S. Inhibition of CDK-mediated phosphorylation of Smad3 results in decreased oncogenesis in triple negative breast cancer cells. Cell Cycle 2014, 13, 3191–3201. [Google Scholar] [CrossRef] [Green Version]
  91. Tormo, E.; Ballester, S.; Adam-Artigues, A.; Burgués, O.; Alonso, E.; Bermejo, B.; Menéndez, S.; Zazo, S.; Madoz-Gúrpide, J.; Rovira, A.; et al. The miRNA-449 family mediates doxorubicin resistance in triple-negative breast cancer by regulating cell cycle factors. Sci. Rep. 2019, 9, 1–14. [Google Scholar] [CrossRef] [Green Version]
  92. Jusino, S.; Rivera-Rivera, Y.; Chardón-Colón, C.; Ruiz-Justiz, A.J.; Vélez-Velázquez, J.; Isidro, A.; Cruz-Robles, M.E.; Bonilla-Claudio, M.; Armaiz-Pena, G.N.; Saavedra, H.I. E2F3 drives the epithelial-to-mesenchymal transition, cell invasion, and metastasis in breast cancer. Exp. Biol. Med. 2021, 246, 2057–2071. [Google Scholar] [CrossRef]
  93. Issac, M.S.M.; Yousef, E.; Tahir, M.R.; Gaboury, L.A. MCM2, MCM4, and MCM6 in breast cancer: Clinical utility in diagnosis and prognosis. Neoplasia 2019, 21, 1015–1035. [Google Scholar] [CrossRef]
Figure 1. Volcano plot of differentially expressed genes in development dataset (GSE25066). Red: Up regulated genes, Blue: Down regulated genes, Yellow background: Prior marker genes.
Cancers 14 00881 g001
Figure 2. Receiver Operating Characteristic (ROC) and Precision Recall (PR) curves of RF-RFE optimized models for test set (GSE25066, 17 pCR, 33 RD); (A) ROC and (B) PR curves for all models, (C) ROC and (D) PR curves for the best model.
Cancers 14 00881 g002
Figure 3. Receiver Operating Characteristic (ROC) and Precision Recall curve of the best models for test set. (GSE20271, GSE20194, GSE32646) (A) ROC curve and (B) PR curve for independent test datasets.
Cancers 14 00881 g003
Figure 4. Comparison of Receiver Operating Characteristic (ROC) and Precision Recall (PR) curves of the final model and published NAC prediction models. (A) ROC and (B) PR curves for the test set in the development dataset (GSE25066). (C) ROC and (D) PR curves for all test sets in four datasets (development test set + three independent test datasets).
Cancers 14 00881 g004
Figure 5. Survival analysis of proposed model. (A) pCR label and (B) pCR prediction by proposed model in development dataset. (C) pCR prediction in the train set and (D) pCR prediction in the test set.
Cancers 14 00881 g005
Figure 6. Visualization of pCR scores of the proposed model and chemosensitivity of TNBC cell lines. Six drugs used to treat T/FAC or T/FEC were investigated: (A) Paclitaxel, (B) 5-FU, (C) Doxorubicin, (D) Docetaxel, (E) Epirubicin, and (F) Cyclophosphamide.
Cancers 14 00881 g006
Figure 7. Visualization of pCR score of the seven published models vs. Cyclophosphamide sensitivity in TNBC cell lines: (A) DLDA30, (B) 3 genes, (C) 5 genes, (D) Immune genes, (E) Hatzis, (F) ROR-S, (G) BA100 Classifier 1, and (H) BA100 Classifier 2. SRCC values in parentheses exclude HS578T data point.
Cancers 14 00881 g007
Figure 8. Visualization of error matrix and score distribution of NAC response prediction models. (A) Heatmap of the error matrix. Yellow represents correctly classified samples and red represents misclassified samples. (B) Score distribution of NAC response prediction models. t-test is used to calculate p-value for difference between pCR and RD score of NAC response prediction models.
Cancers 14 00881 g008
Figure 9. MPS specific performance of the final RF model. (A) ROC curves and (B) PR curves.
Cancers 14 00881 g009
Table 1. Summary of NAC response prediction studies.
StudyAbb. N gene Target PopulationPreprocessingBatch CorrectionPerformance (AUC)
Hess et al., 2006, JCO [23]DLDA3030AlldChipNot Reported0.877
Parker et al., 2009, JCO [27]ROR-S52AllNot ReportedNot Reported0.781
Liedtke et al., 2009, JCO [22]GGI97AllNot ReportedNot Reported0.735
Hatzis et al., 2011, JAMA [18]Hatzis206HER2-MAS5Not ReportedNot Reported
Fournier et al., 2019, Sci. Rep. [26]BA10032TNBCMAS5ComBat, QtNormNot Reported
Masanori et al., 2021, Cancers [19]3 gene3TNBCNot ReportedNot Reported0.735
Masanori et al., 2021, Am. J. Cancer Res. [20]5 gene5ER+/HER2-Not ReportedNot Reported0.813
Changfang Fu et al., 2021, Front. Immunol. [21]Immune gene25AllRMAComBat0.956
Table 2. Summary of gene expression datasets used in this study.
StudyGSEGPLPlatformNAC RegimenpCRRDTotal
Hatzis et al., 2011, JAMA [18]GSE25066GPL96Affymetrix HG U133AT/FAC (75%), T/FEC (18%), other (7%)57113170
Tabchy A et al., 2010, Clin. Cancer. Res. [31]GSE20271GPL96Affymetrix HG U133AT/FAC (36.2%), T/FEC (27.6%), FAC (10.3%), FEC (17.2%), other (1.70%)134558
Shi L et al., 2010, Nat. Biotech. [32]GSE20194GPL96Affymetrix HG U133AT/FAC (67.6%), T/FEC (16.9%), FAC (4.23%), FEC (1.41%), other (9.87%)254671
Miyake T et al., 2012, Cancer Sci. [33]GSE32646GPL570Affymetrix HG U133 Plus 2.0T/FEC (100%)101626
Table 3. Summary of existing publications providing breast cancer marker genes.
YearAuthorsTitleJournalReferences
2019Nadia Harbeck et al.Breast CancerNat. Rev. Dis. PrimersPMID: 31548545 [36]
2019Francois Bertucci et al.Genomic Characterization of Metastatic Breast CancersNaturePMID: 31118521 [37]
2018Francisco Sanchez-Vega et al.Oncogenic Signaling Pathways in The Cancer Genome AtlasCellPMID: 29625050 [38]
2018Chandra P. Leo et al.Breast Cancer Drug Approvals by the US FDA From 1949 to 2018NRDDPMID: 31907423 [39]
2016Xiaofeng Dai et al.Cancer Hallmarks, Biomarkers and Breast Cancer Molecular SubtypesJ. CancerPMID: 27390604 [40]
2016Serena Nik-Zainal et al.Landscape of Somatic Mutations in 560 Breast Cancer Whole-Genome SequencesNaturePMID: 27135926 [41]
2012Cancer Genome Atlas NetworkComprehensive Molecular Portraits of Human Breast TumoursNaturePMID: 23000897 [42]
Table 4. Patient characteristics of the development (1 Dataset—GSE25066) and Validation Datasets (3 Datasets—GSE20271, GSE20194, GSE32646).
CharacteristicGSE25066GSE20271GSE20194GSE32646
pCRRDp-ValuepCRRDp-ValuepCRRDp-ValuepCRRDp-Value
N57113 1345 2546 1016
Age (Med, IQR)48 (41–53)50 (40–60)0.153 (49–58)51 (40–58)0.4748 (44–53)51 (42–61)0.1760 (54–67)56 (43–63)0.46
T Stage 0.28 0.42 0.95 0.73
T13 (5%)5 (4%) 0 (0%)1 (2%) 2 (8%)4 (9%) 1 (10%)0 (0%)
T232 (56%)47 (42%) 8 (62%)15 (33%) 13 (52%)20 (43%) 8 (80%)12 (75%)
T315 (26%)38 (34%) 2 (15%)13 (29%) 5 (20%)9 (20%) 1 (10%)3 (19%)
T47 (12%)23 (20%) 3 (23%)16 (36%) 5 (20%)12 (26%) 0 (0%)1 (6%)
Missing0 (0%)0 (0%) 0 (0%)0 (0%) 0 (0%)1 (2%)
N Stage 0.86 0.61 0.32 NA
N015 (26%)26 (23%) 4 (31%)14 (31%) 2 (8%)9 (20%)
N126 (46%)52 (46%) 7 (54%)16 (36%) 16 (64%)18 (39%)
N28 (14%)21 (19%) 2 (15%)12 (27%) 3 (12%)8 (17%)
N38 (14%)14 (12%) 0 (0%)3 (7%) 3 (12%)7 (15%)
Missing0 (0%)0 (0%) 0 (0%)0 (0%) 1 (4%)4 (9%)
Grade 0.34 1 0.19 0.32
G10 (0%)1 (1%) 0 (0%)1 (2%) 0 (0%)0 (0%) 0 (0%)1 (6%)
G24 (7%)16 (14%) 2 (15%)6 (13%) 2 (8%)9 (20%) 4 (40%)10 (62%)
G348 (84%)86 (76%) 9 (69%)26 (58%) 22 (88%)31 (67%) 6 (60%)5 (31%)
Missing5 (9%)10 (9%) 2 (15%)12 (27%) 1 (4%)6 (13%) 0 (0%)0 (0%)
Tumor Stage 0.79 NA NA 0.54
I1 (2%)2 (2%) 0 (0%)0 (0%)
IIA10 (18%)15 (13%) 1 (10%)4 (25%)
IIB20 (35%)34 (30%) 8 (80%)8 (50%)
IIIA11 (19%)32 (28%) 1 (10%)3 (19%)
IIIB10 (18%)21 (19%) 0 (0%)1 (6%)
IIIC5 (9%)7 (6%) 0 (0%)0 (0%)
Inflammatory0 (0%)2 (2%) 0 (0%)0 (0%)
pCR: pathlogical Complete Response, RD: Residual Disease.
Table 5. Differentially expressed prior marker genes between pCR vs. RD in development dataset (GSE25066). Bold text indicates prior marker genes.
SymbolNCBI IDCountFCFDRDirectionSymbolNCBI IDCountFCFDRDirection
HAT18520101.3300.00UpLRRC1513157830.6765.89 × 10 2 Down
TFG10342101.2880.00UpPTGS1574230.8166.03 × 10 2 Down
JCAD57608100.7010.00DownHGH15123630.8476.05 × 10 2 Down
ZNF467168544100.7400.00DownFBXO1615757431.4476.16 × 10 2 Up
ATF52280990.7955.97 × 10 3 DownSLC43A1850130.8066.25 × 10 2 Down
ABT12977791.6365.97 × 10 3 UpEXD25521820.8346.47 × 10 2 Down
PDCL37903191.3616.39 × 10 3 UpSMARCA2659521.2436.80 × 10 2 Up
ILF2360891.5286.87 × 10 3 UpGREM12658520.6817.02 × 10 2 Down
DNAI47981990.7168.33 × 10 3 DownNCR1943720.7687.05 × 10 2 Down
TMEM14B8185391.3609.48 × 10 3 UpPARM12584920.7417.67 × 10 2 Down
DEK791381.4501.38 × 10 2 UpZNF3955589321.3177.72 × 10 2 Up
PDCL3P428535981.3611.41 × 10 2 UpMAST437544910.7377.90 × 10 2 Down
SEC13639681.2441.45 × 10 2 UpCTAGE11P64728810.6387.94 × 10 2 Down
HACD1920071.7682.15 × 10 2 UpIMPG25093910.5858.02 × 10 2 Down
GLI3273760.7523.03 × 10 2 DownFN3KRP7967211.2188.72 × 10 2 Up
PTPN1577060.8383.15 × 10 2 DownDCTN31125811.2258.80 × 10 2 Up
MCM3417261.2743.71 × 10 2 UpCTTN201710.8088.93 × 10 2 Down
RANBP62695351.3414.04 × 10 2 UpTMEM25874611.2059.16 × 10 2 Up
ESR1209950.7284.13 × 10 2 DownMANBA412610.7989.35 × 10 2 Down
ITGA6365551.7404.23 × 10 2 UpCSRNP28156610.8429.40 × 10 2 Down
NOL75140641.2564.32 × 10 2 UpNEU1475811.2459.44 × 10 2 Up
PRKACA556640.8014.34 × 10 2 DownOLFML2B2590310.7331.04 × 10 1 Down
CCND159540.5644.41 × 10 2 DownMDH1419011.2031.06 × 10 1 Up
RIPOR17956740.8205.07 × 10 2 DownPDE10A1084610.7931.06 × 10 1 Down
SEZ6L2354440.7825.23 × 10 2 DownXRCC5752011.1671.12 × 10 1 Up
METRN7900630.5135.56 × 10 2 DownBNC25479610.7441.15 × 10 1 Down
Table 6. Binary classification performance of the final model for all test sets.
DatasetpCR
(Positive)
RD
(Negative)
TPFPFNTNACCBACCTPRTNRPPVNPVFNRF1MCCYoden’s IndexAUROCAUPRC
GSE2506617331433300.8800.8660.8240.9090.9090.9090.1770.8240.7330.7330.9180.902
GSE202711345548410.7930.6480.3850.9110.9110.8370.6150.4550.3410.2960.7790.589
GSE2019425462243420.9010.8970.8800.9130.9130.9330.1200.8630.7860.7930.9670.946
GSE326461016416150.7310.6690.4000.9380.9380.7140.6000.5330.4170.3380.7470.688
Total651404513201270.8390.8000.6920.9070.9070.8640.3080.7320.6190.5990.8910.829
TP: True Positive, FP: False Positive, FN: False Negative, TN: True Negative, ACC: Accuracy, BACC: Balanced Accuracy, TPR: True Positive Rate, TNR: True Negative Rate, PPV: Positive Predictive Value, NPV: Negative Predictive Value, FNR: False Negative Rate, MCC: Mathew Correlation Coefficient, AUROC: Area Under Reciever Operating Characteristic Curve, AUPRC: Area Under Precision Recall Curve. Here, positive samples refer to the pCR samples.
Table 7. Comparison of binary classification performance of best model and published NAC prediction models.
DatasetpCRRDTPFPFNTNACCBACCTPRTNRPPVNPVFNRF1MCCYoden’s IndexAUROCAUPRCMethod
Test Set
(GSE25066)
17335212310.7200.6170.2940.9390.9390.7210.7060.4170.3190.2340.6290.468GGI
2315300.6400.5130.1180.9090.9090.6670.8820.1820.0420.0270.4960.324ROR-S
7210310.7600.6760.4120.9390.9390.7560.5880.5390.4330.3510.8150.733Hatzis
7210310.7600.6760.4120.9390.9390.7560.5880.5390.4330.3510.7080.5613 Gene
2115320.6800.5440.1180.9700.9700.6810.8820.2000.1740.0870.6740.5065 Gene
4313300.6800.5720.2350.9090.9090.6980.7650.3330.1970.1440.6810.545Immune
7210310.7600.6760.4120.9390.9390.7560.5880.5390.4330.3510.7930.679BA100 C1
829310.7800.7050.4710.9390.9390.7750.5290.5930.4860.4100.7590.632BA100 C2
1316300.6200.4840.0590.9090.9090.6520.9410.095-0.056-0.0320.6220.391DLDA30
1423310.9000.8820.8240.9390.9390.9120.1770.8490.7750.7630.9180.902Proposed
All Testsets651411214531270.6750.5430.1850.9010.9010.7060.8150.2640.1190.0850.6060.406GGI
914561270.6600.5200.1390.9010.9010.6940.8620.2050.0580.0390.5450.344ROR-S
2414411270.7330.6350.3690.9010.9010.7560.6310.4660.3230.2700.8270.634Hatzis
1612491290.7040.5810.2460.9150.9150.7250.7540.3440.2180.1610.7050.4903 Gene
1813471280.7090.5920.2770.9080.9080.7310.7230.3750.2400.1850.6910.4995 Gene
914561270.6600.5200.1390.9010.9010.6940.8620.2050.0580.0390.5930.381Immune
1914461270.7090.5970.2920.9010.9010.7340.7080.3880.2450.1930.7160.500BA100 C1
2614391270.7430.6500.4000.9010.9010.7650.6000.4950.3530.3010.7290.567BA100 C2
1513501280.6940.5690.2310.9080.9080.7190.7690.3230.1880.1390.7280.490DLDA30
4513201280.8400.8000.6920.9080.9080.8650.3080.7320.6200.6000.8920.829Proposed
TP: True Positive, FP: False Positive, FN: False Negative, TN: True Negative, ACC: Accuracy, BACC: Balanced Accuracy, TPR: True Positive Rate, TNR: True Negative Rate, PPV: Positive Predictive Value, NPV: Negative Predictive Value, FNR: False Negative Rate, MCC: Mathew Correlation Coefficient, AUROC: Area Under Reciever Operating Characteristic Curve, AUPRC: Area Under Precision Recall Curve. Here, positive samples refer to the pCR samples.
Table 8. Cellular function associated with 86 genes of the RF model. N g e n e : the number of gene in the term. N m a p p e d : the number of mapped query genes to the term. r a t i o m a p p e d The ratio of gene in the term mapped with query genes, i.e., N m a p p e d / N g e n e .
SRC DBGeneset NameCategory N gene N mapped ratio mapped p-ValueGene Mapped
Gene OntologyGO:0043570: maintenance of DNA repeat elementsCell_Function520.4008.78 × 10 5 MSH2, MSH6
Gene OntologyGO:0032135: DNA insertion or deletion bindingCell_Function620.3331.31 × 10 4 MSH2, MSH6
Jensen_COMPARTMENTSMismatch_repair_complexCell_Localization620.3331.31 × 10 4 MSH2, MSH6
TF_Perturbations_Followed_by_ExpressionMYCN_SHRNA_IMR575_HUMAN_GSE80397_6HR_RNASEQ_UPTranscription Factor620.3331.31 × 10 4 ENO1, MCM3
CORUMMSH2/6-BLM-p53-RAD51 complex (human)Protein_Complex530.6002.57 × 10 7 RAD51, MSH2, MSH6
CORUMPCNA-MutS-alpha-MutL-alpha-DNA complex (human)Protein_Complex520.4008.78 × 10 5 MSH2, MSH6
CORUMMCM complex (human)Protein_Complex620.3331.31 × 10 4 MCM2, MCM3
ReactomeR-HSA-68911: G2 PhasePathway520.4008.78 × 10 5 CDK2, E2F3
SRC DB: Source Database, N g e n e : Number of genes annotated for the geneset, N m a p p e d : Number of mapped genes from query genes, r a t i o m a p p e d : N m a p p e d / N g e n e , p-value: Fisher’s Exact test p-value.
Table 9. Comparison of metabolic pathway based subtype (MPS) specific performance of the proposed RF model.
MPS SubtypespCRRDTPFPFNTNACCBACCTPRTNRPPVNPVFNRF1MCCYoden’s IndexAUROCAUPRC
MPS1 (Lipogenic)836335330.8180.6460.3750.9170.9170.8680.6250.4290.3280.2920.8330.561
MPS2 (Glycolytic)394223416380.7530.7470.5900.9050.9050.7040.4100.6970.5240.4950.8780.880
MPS3 (Mixed)18621464560.8750.8410.7780.9030.9030.9330.2220.7370.6570.6810.8990.838
TP: True Positive, FP: False Positive, FN: False Negative, TN: True Negative, ACC: Accuracy, BACC: Balanced Accuracy, TPR: True Positive Rate, TNR: True Negative Rate, PPV: Positive Predictive Value, NPV: Negative Predictive Value, FNR: False Negative Rate, MCC: Mathew Correlation Coefficient, AUROC: Area Under Reciever Operating Characteristic Curve, AUPRC: Area Under Precision Recall Curve. Here, positive samples refer to the pCR samples.
Publisher’s Note: MDPI stays neutral with regard to jurisdictional claims in published maps and institutional affiliations.

