Article

ATP8B1 Knockdown Activated the Choline Metabolism Pathway and Induced High-Level Intracellular REDOX Homeostasis in Lung Squamous Cell Carcinoma

1
Cancer Molecular Diagnostics Core, National Clinical Research Center of Caner, Key Laboratory of Cancer Prevention and Therapy, Key Laboratory of Cancer Immunology and Biotherapy, Tianjin Medical University Cancer Institute & Hospital, Tianjin 300060, China
2
Tianjin’s Clinical Research Center for Cancer, Tianjin 300060, China
3
National Clinical Research Center of Caner, Tianjin’s Clinical Research Center for Cancer, Key Laboratory of Cancer Immunology and Biotherapy, Department of Immunology, Tianjin Medical University Cancer Institute & Hospital, Tianjin 300060, China
*
Author to whom correspondence should be addressed.
These authors contribute equally to the work.
Cancers 2022, 14(3), 835; https://doi.org/10.3390/cancers14030835
Submission received: 1 December 2021 / Revised: 14 January 2022 / Accepted: 2 February 2022 / Published: 7 February 2022
(This article belongs to the Topic Application of Big Medical Data in Precision Medicine)

Abstract

:

Simple Summary

We found that low expression of ATP8B1 was associated with poor prognosis, and involved in the dysregulation of glutathione (GSH) synthesis and choline metabolism in lung squamous cell carcinoma (LUSC) samples of The Cancer Genome Atlas (TCGA) and Tianjin Medical University Cancer Institute and Hospital (TJMUCH) cohort. We further constructed ATP8B1 knockdown of LUSC cell lines H520SH-ATP8B1 and SK-MES-1SH-ATP8B1 to investigate how ATP8B1 knockdown promoted cell proliferation, migration, and invasion in vitro and in vivo via upregulation of the CHKA-dependent choline metabolism pathway. We identified that ATP8B1 knockdown and CHKA upregulation can lead to mitochondrial dysfunction and high reduction-oxidation (REDOX) homeostasis, which may be involved in the roles of cardiolipin in maintaining mitochondrial dynamics and phospholipid homeostasis. Therefore, we proposed ATP8B1 as a novel predictive biomarker in LUSC and targeting ATP8B1-driven specific metabolic disorder might be a promising therapeutic strategy for LUSC.

Abstract

The flippase ATPase class I type 8b member 1 (ATP8B1) is essential for maintaining the stability and polarity of the epithelial membrane and can translocate specific phospholipids from the outer membrane to the inner membrane of the cell. Although ATP8B1 plays important roles in cell functions, ATP8B1 has been poorly studied in tumors and its prognostic value in patients with lung squamous cell carcinoma (LUSC) remains unclear. By investigating the whole genomic expression profiles of LUSC samples from The Cancer Genome Atlas (TCGA) database and Tianjin Medical University Cancer Institute and Hospital (TJMUCH) cohort, we found that low expression of ATP8B1 was associated with poor prognosis of LUSC patients. The results from cellular experiments and a xenograft-bearing mice model indicated that ATP8B1 knockdown firstly induced mitochondrial dysfunction and promoted ROS production. Secondly, ATP8B1 knockdown promoted glutathione synthesis via upregulation of the CHKA-dependent choline metabolism pathway, therefore producing and maintaining high-level intracellular REDOX homeostasis to aggravate carcinogenesis and progression of LUSC. In summary, we proposed ATP8B1 as a novel predictive biomarker in LUSC and targeting ATP8B1-driven specific metabolic disorder might be a promising therapeutic strategy for LUSC.
Keywords:
ATP8B1; LUSC; CHKA; REDOX

1. Introduction

Lung cancer is a heterogeneous disease with extensive clinicopathological features, among which non-small cell lung cancer (NSCLC) accounts for 85% of the total diagnoses. Treatment of advanced lung cancer is based on the pathological subtype. Lung squamous cell carcinoma (LUSC) is the major subtype of NSCLC with limited treatment options [1], with low sensitivity to chemotherapy and a lack of targetable mutations and immune responses, which limits the benefits of chemotherapy, targeted therapy, and immune monotherapy [2,3]. Therefore, the discovery of predictive biomarkers and novel treatments for LUSC is urgently required.
Metabolic reprogramming is a hallmark of cancer and in some cases, reprogrammed metabolic activities can be used to diagnose, monitor, and treat cancer. Tumor metabolism is a flexible network that enables tissues to meet the needs of homeostasis and growth and to evolve during tumor progression [4]. Lung cancer cells rewire their metabolic and energy production networks to support survival and rapid proliferation [5]. However, cancer metabolism is heterogeneous, so specific metabolic pathways should be targeted for intervention to achieve the best therapeutic effects [6].
Long interspersed nuclear element-1 (LINE-1) retrotransposition has become a major marker of cancer and has been considered as a cis-regulatory element to regulate the expression of host genes in recent years [7]. We previously discovered the role of LINE-1 in promoting the malignant progression of LUSC by regulating metabolism-related genes, in which LINE-1 interferes with the ATP8B1 gene and facilitates poor prognosis of LUSC [8].
ATP8B1 encodes a P4-ATPase, which is reported to be a flippase ATPase class I member and associated with progressive familial intrahepatic cholestasis (PFIC). ATP8B1 is essential for maintaining the stability and polarity of the epithelial membrane and can transport certain phospholipids (phosphatidylserine, cardiolipin) from the outer monolayer to the intima of the plasma membrane [9]. However, the function of ATP8B1 in carcinogenesis has been seldom studied [10,11], and downregulation of ATP8B1 was reported to be associated with poor prognosis in colorectal cancer without any further explanation of the underlying regulatory mechanism.
Here, we found that low expression of ATP8B1 was associated with poor prognosis and involved in the dysregulation of glutathione (GSH) synthesis and choline metabolism in LUSC samples of The Cancer Genome Atlas (TCGA) and Tianjin Medical University Cancer Institute and Hospital (TJMUCH) cohort. We further constructed ATP8B1 knockdown of LUSC cell lines H520SH-ATP8B1 and SK-MES-1SH-ATP8B1 to investigate how ATP8B1 knockdown promoted cell proliferation, migration, and invasion in vitro and in vivo via upregulation of the CHKA-dependent choline metabolism pathway. We identified that ATP8B1 knockdown and CHKA upregulation can lead to mitochondrial dysfunction and high reduction-oxidation (REDOX) homeostasis, which may be involved in the roles of cardiolipin in maintaining mitochondrial dynamics and phospholipid homeostasis [12]. Therefore, we proposed ATP8B1 as a novel predictive biomarker in LUSC and targeting ATP8B1-driven specific metabolic disorder might be a promising therapeutic strategy for LUSC.

2. Results

2.1. Low Expression of ATP8B1 Was Associated with Poor Prognosis of LUSC

According to our previous research [8], we analyzed the frequency of 13 LINE-1 insertions in 109 sequenced tissue samples from the TJMUCH cohort, and found that the occurrence frequency of L1-ATP8B1 was the highest in LUSC patients suffering from a shorter survival (survival time ≤ 40 months) (Figure 1A). The patients were stratified into two groups by the expression level of L1-ATP8B1 by RT-qPCR and the transcriptome sequencing data indicated that ATP8B1 mRNA expression was downregulated in the L1-ATP8B1+ group (Figure 1B), suggesting low expression of ATP8B1 might play a role in promoting LUSC progression. According to the transcriptome results, we then divided all samples into two groups according to the expression level of the ATP8B1 gene: the ATP8B1 low expression (ATP8B1low) group and ATP8B1 high expression (ATP8B1high) group. A high ratio of L1-ATP8B1+ samples was observed in ATP8B1low tumor tissues (Figure 1B). The survival analysis using the Kaplan–Meier method revealed that low expression of ATP8B1 was significantly correlated with poor prognosis in the TJMUCH cohort (Figure 1C). Further, we obtained clinical information from 407 LUSC samples from The Cancer Genome Atlas (TCGA) dataset, and divided them into two groups according to the expression level of ATP8B1. The result of the survival analysis in the TCGA dataset was consistent with that in the TJMUCH cohort (Figure 1D). We compared differentially expressed genes between the ATP8B1low and ATP8B1high groups either in the TJMUCH cohort or TCGA database, followed by pathway enrichment analysis based on Kyoto Encyclopedia of Genes and Genomes (KEGG). Most differentially expressed genes were enriched in metabolic pathways, including drug metabolism, serotonergic synapse, retinol metabolism, ascorbate and aldarate metabolism, metabolism of xenobiotics by cytochrome P450, and glutamatergic synapse (Figure 1E,F). These results implied that dysregulation of metabolic pathways might be involved in low expression of ATP8B1 associated with poor prognosis of LUSC.

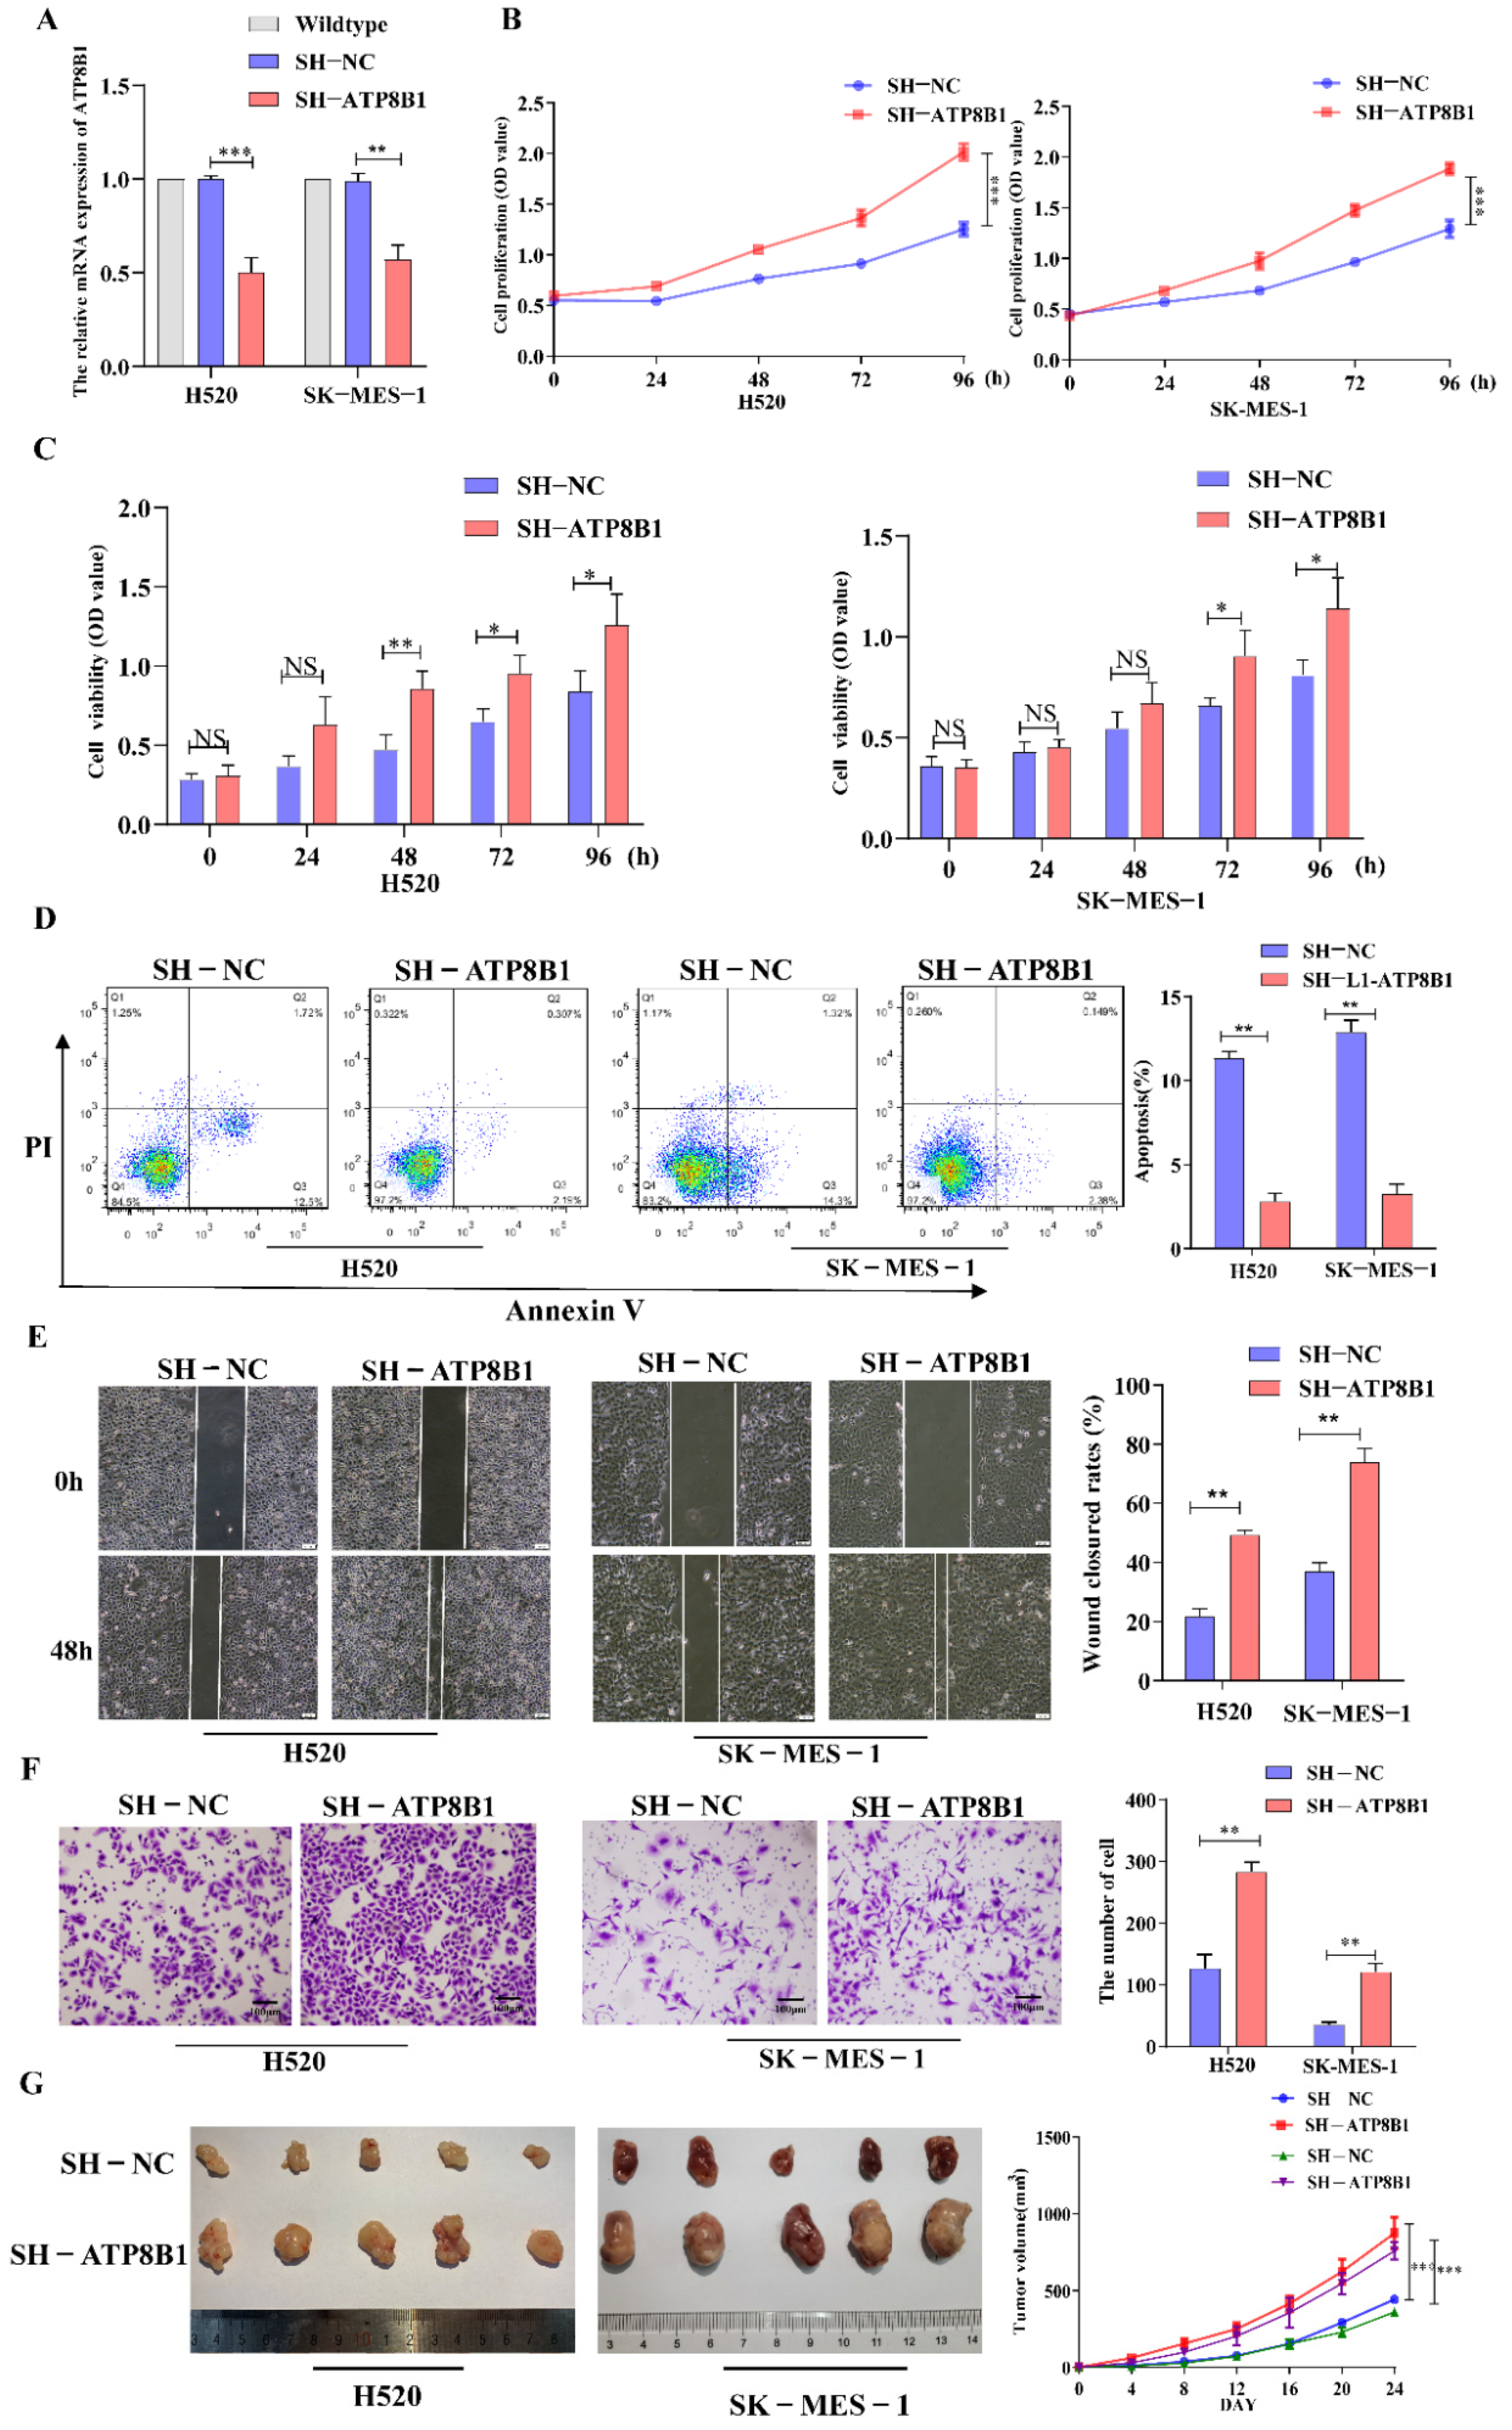
2.2. ATP8B1 Knockdown Promoted Proliferation, Inhibited Apoptosis, and Aggravated Invasion and Migration of LUSC Cells In Vitro and In Vivo

To further investigate the roles of ATP8B1 in cell functions, we infected LUSC cell lines (H520 and SK-MES-1) with a recombinant lentivirus with the ATP8B1 shRNA sequence to knockdown the ATP8B1 gene (H520SH-ATP8B1 and SK-MES-1SH-ATP8B1). Using H520 cells without any treatment for control normalization, we compared the expression of ATP8B1 in H520 cells infected with control lentivirus or SH-ATP8B1 lentivirus, and found that the mRNA level of ATP8B1 was significantly reduced in H520SH-ATP8B1(Figure 2A). Consistent results were detected in SK-MES-1SH-ATP8B1. Using the Cell Counting Kit 8 (CCK8) proliferation assay, we found that the proliferation rate of either H520SH-ATP8B1 or SK-MES-1SH-ATP8B1 significantly increased compared with the controls (Figure 2B). Moreover, the results of the MTT assay showed that the cell viability increased in H520SH-ATP8B1 and SK-MES-1SH-ATP8B1 (Figure 2C). The Annexin-V apoptosis assay showed that the apoptotic rates in H520SH-ATP8B1 and SK-MES-1SH-ATP8B1 decreased (Figure 2D). We then evaluated the roles of ATP8B1 in cell migration and invasion via the wound healing and trans-well invasion assay. The results showed that the wound closure rates (WCRs) of H520SH-ATP8B1 and SK-MES-1SH-ATP8B1 were significantly higher than those of the controls (Figure 2E). Similarly, the cell numbers of H520SH-ATP8B1 and SK-MES-1SH-ATP8B1 that migrated through the matrigel layer after 48h were significantly higher, indicating that the invasion ability was significantly enhanced by knockdown of ATP8B1 (Figure 2F). Furthermore, H520SH-ATP8B1, SK-MES-1SH-ATP8B1, and the control cells were subcutaneously injected into NOD-SCID mice. After 24 days, the average volume of xenografts in the H520SH-ATP8B1 and SK-MES-1SH-ATP8B1 groups was at least 2-fold higher than that in the control group. Accordingly, the tumor growth rate was significantly higher in the H520SH-ATP8B1 and SK-MES-1SH-ATP8B1 groups compared to that in the control group (Figure 2G). In conclusion, ATP8B1 knockdown promoted proliferation, inhibited apoptosis, and aggravated invasion and migration in vitro and in vivo.

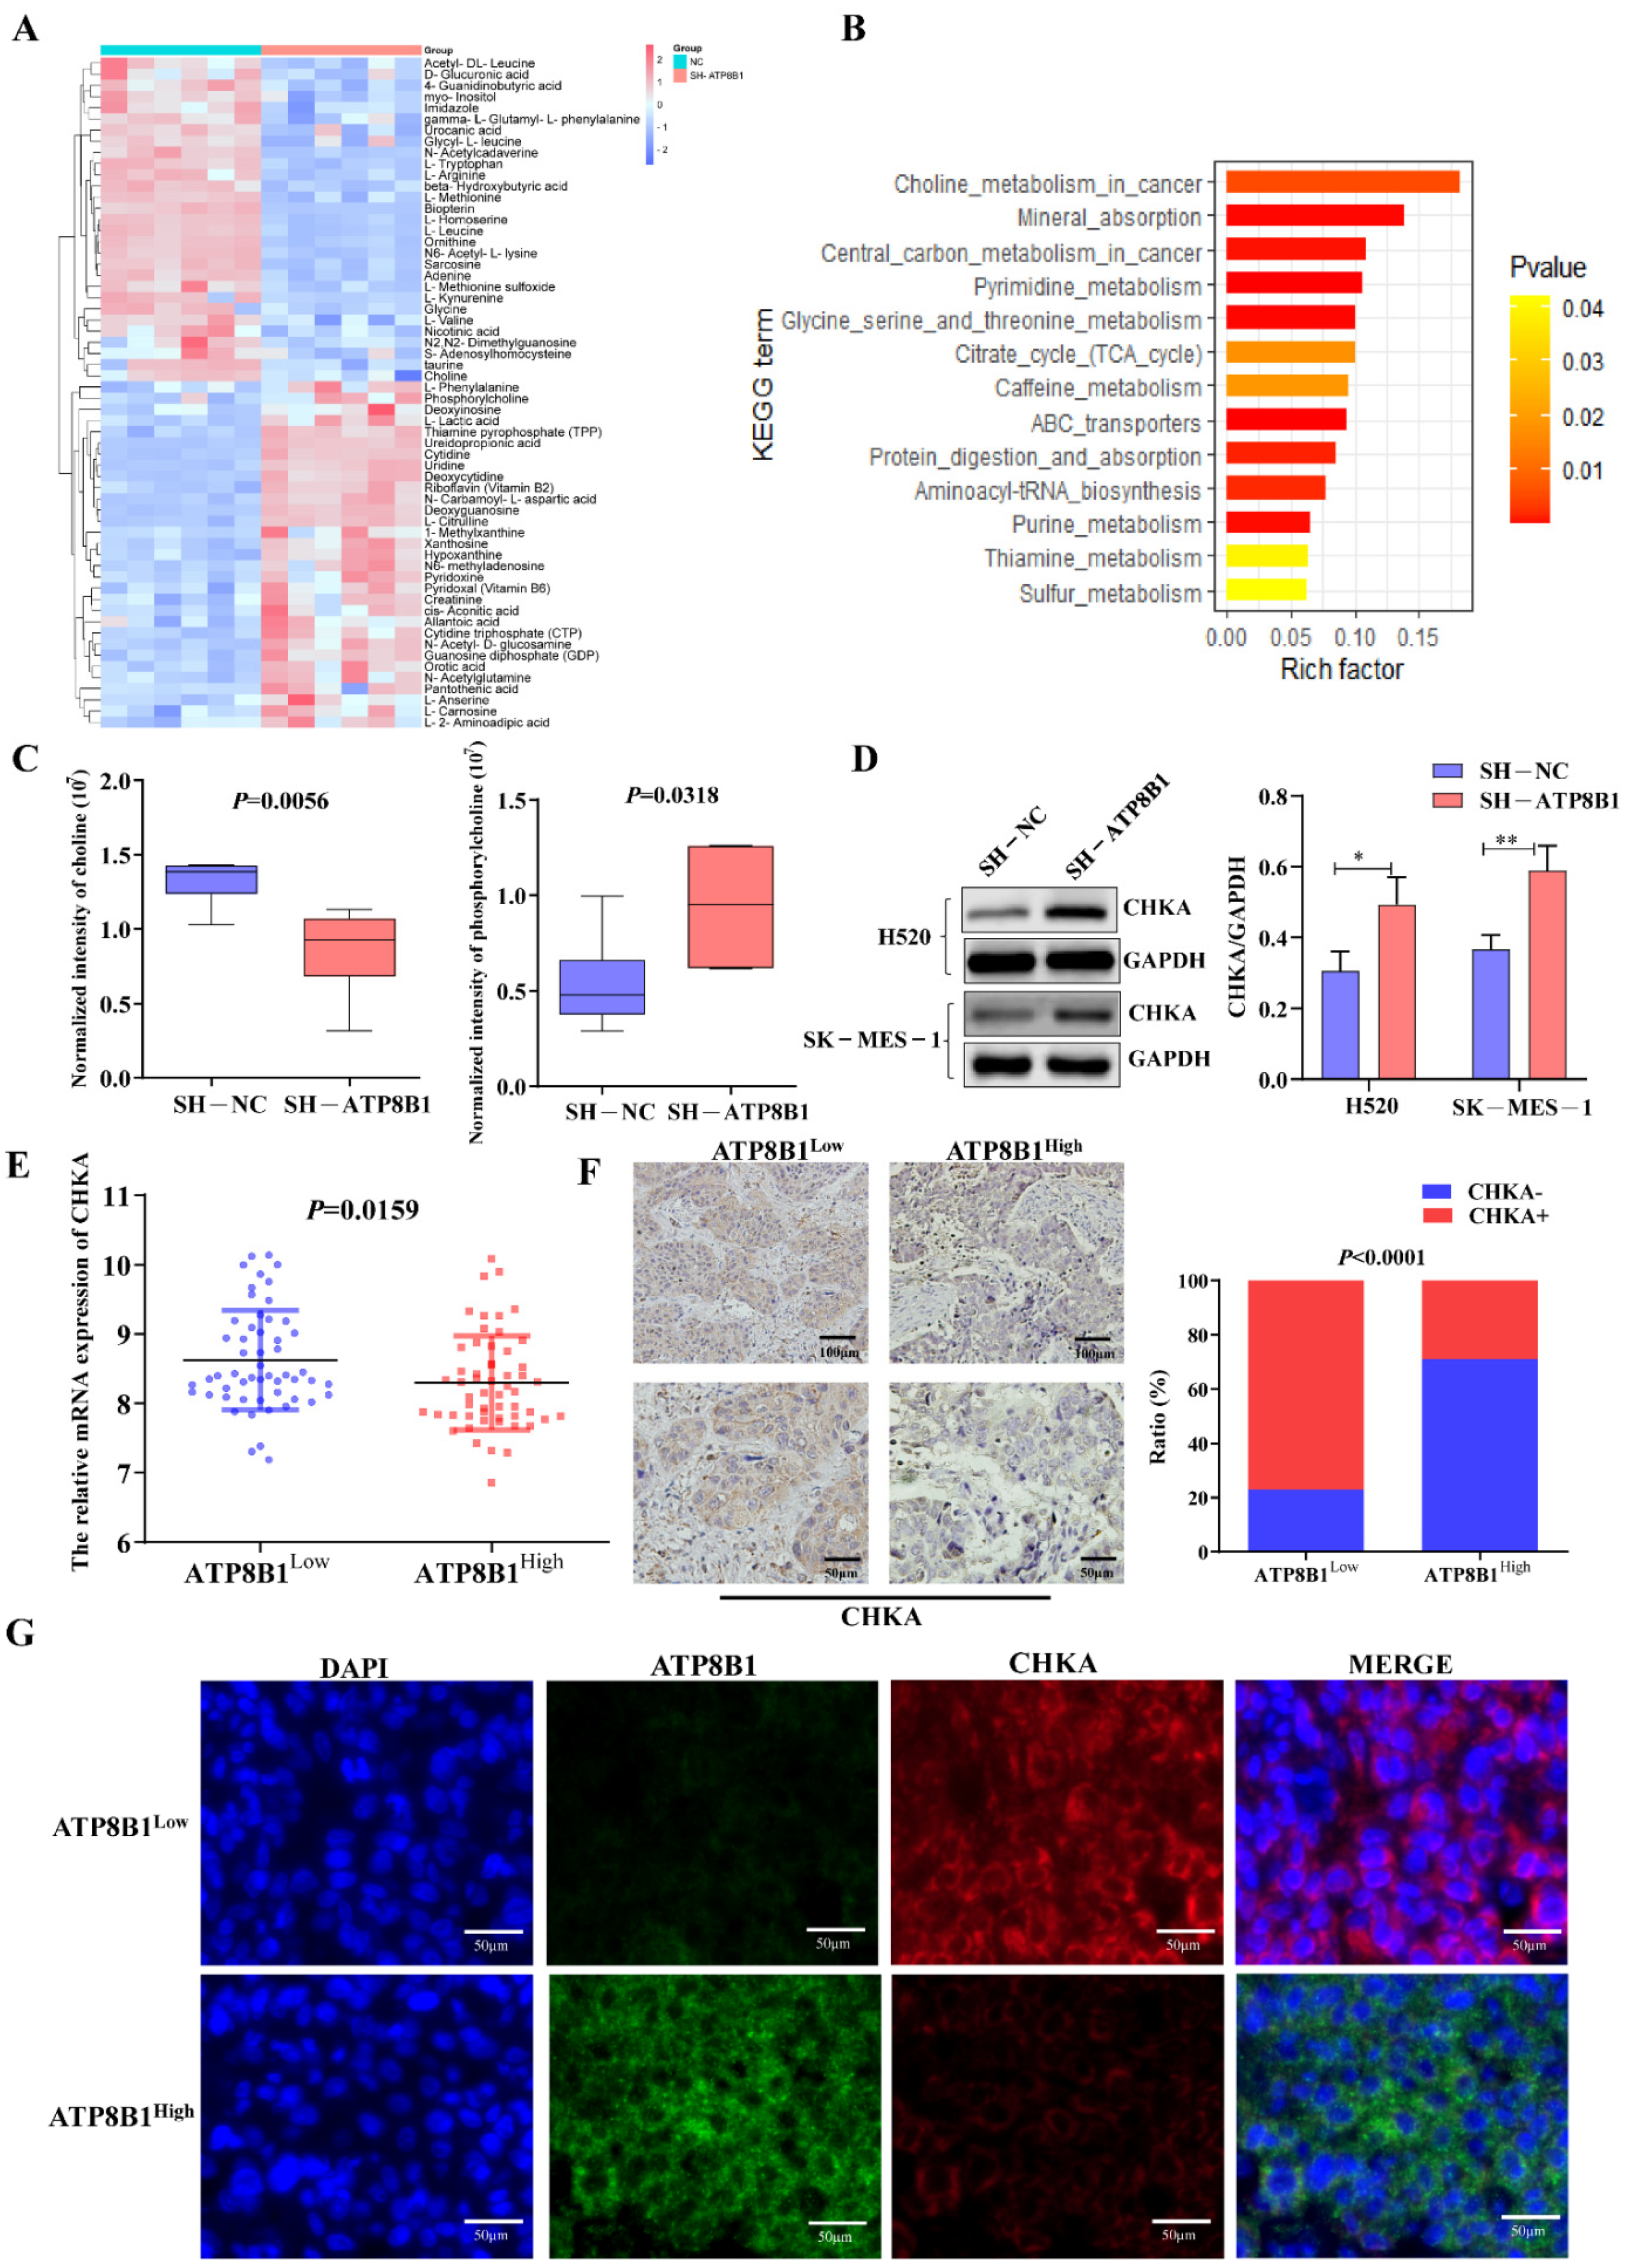
2.3. ATP8B1 Knockdown Activated the Choline Metabolic Pathway via Upregulation of Choline Kinase Expression

We performed metabolomics analysis on H520SH-ATP8B1 and compared it with H520SH-NC. The most highly differentially activated metabolic pathway was the choline metabolic pathway in H520SH-ATP8B1 (Figure 3A,B), in which the levels of choline decreased and phosphorylcholine increased (Figure 3C). Since choline is phosphorylated by choline kinase α (CHKA) to form phosphorylcholine, which is an important precursor of phosphatidylcholine and necessary for cell growth [13], we detected the expression of CHKA by Western blot. The result revealed that the level of CHKA protein was higher in H520SH-ATP8B1 compared to controls, which was consistent with SK-MES-1SH-ATP8B1 (Figure 3D). Among the primary LUSC tissues from the TJMUCH cohort, the mRNA and protein levels of CHKA were upregulated in the ATP8B1low group (Figure 3E,F). Similarly, the results of the tissue immunofluorescence assay identified that the expression level of CHKA was negatively correlated with that of ATP8B1 in LUSC cells, with a mutually exclusive pattern (Figure 3G). As phospholipases (including PLA, PLC, and PLD) are essential mediators in the catabolic process of phosphatidylcholine in the choline metabolism pathway [14,15,16], we detected the expression levels of PLA, PLC, and PLD in H520SH-ATP8B1 cells by Western blot. We found that the protein expression levels of PLC and PLD did not change significantly while only PLA was upregulated in H520SH-ATP8B1 cells (Figure S1A,B), which can decompose phosphatidylcholine into fatty acids, thus promoting fatty acid metabolism and providing energy for cell growth [16]. These results indicated that ATP8B1 knockdown activated the choline metabolic pathway via upregulation of CHKA expression, thereby increasing cellular phosphorylcholine.

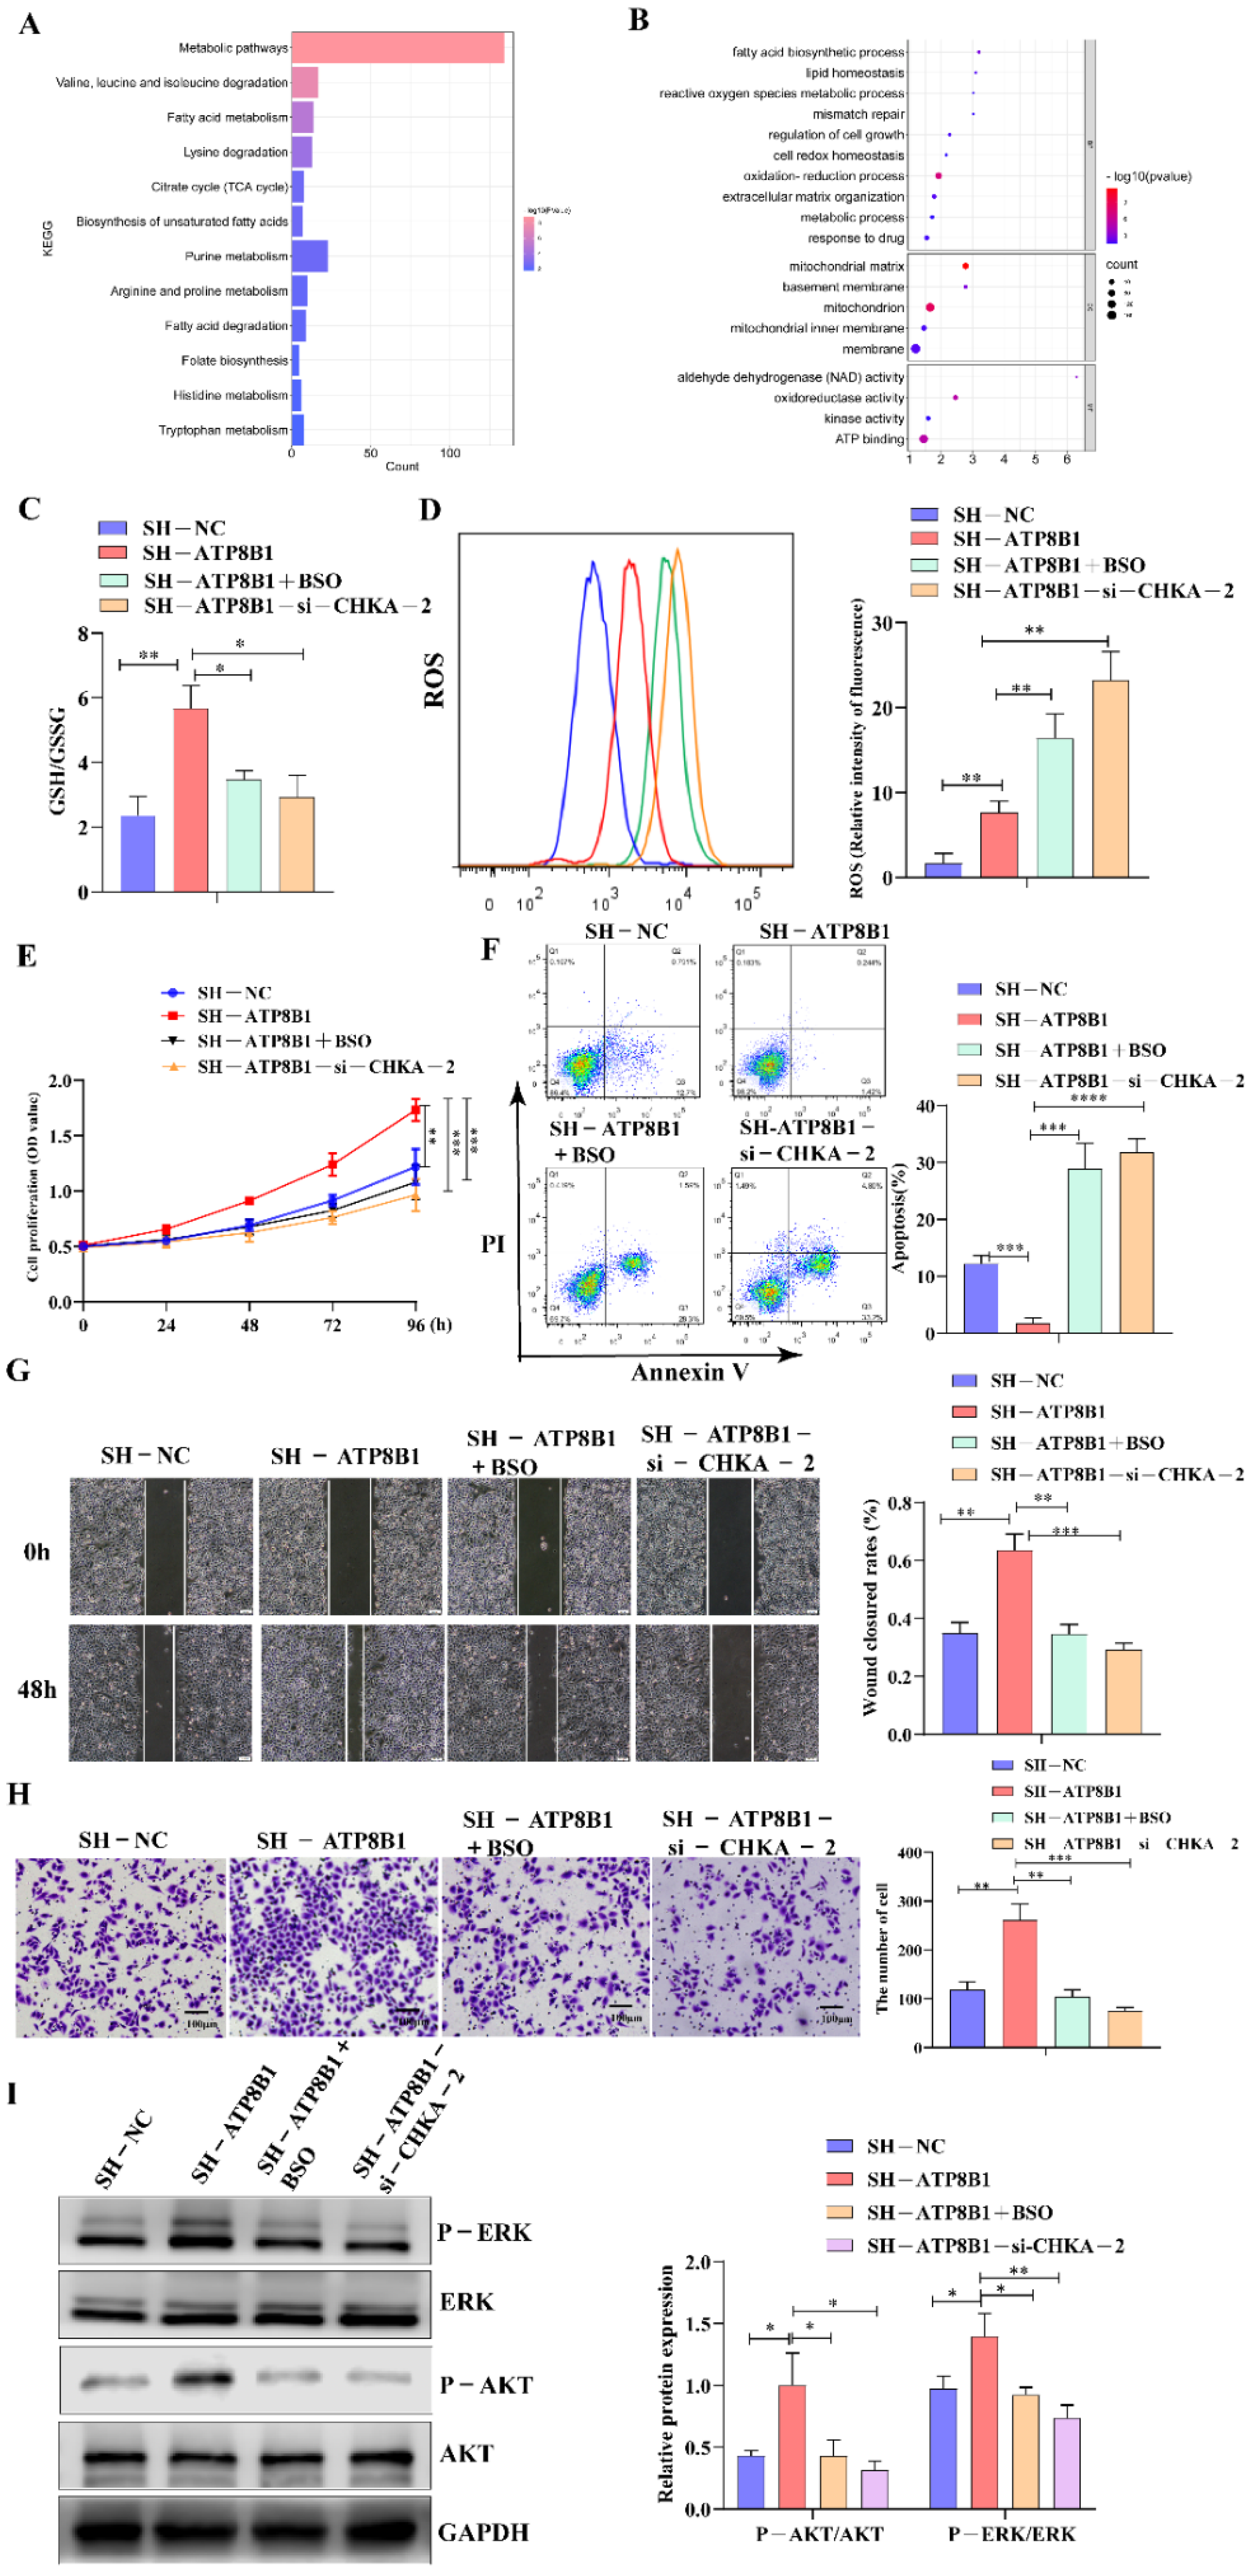
2.4. ATP8B1 Knockdown Promoted Cell Proliferation and Invasion in LUSC in A CHKA-Dependent Manner

In order to further investigate the roles of CHKA in ATP8B1-related carcinogenesis and tumor progression, we then interfered with the CHKA gene via siRNAs in H520SH-ATP8B1 cells. The mRNA and protein levels of CHKA were dramatically reduced in H520SH-ATP8B1-si-CHKA cells (Figure 4A,B). Besides that, the levels of metabolites involved in the choline metabolism pathway, phosphorylcholine and phosphatidylcholine, were both decreased significantly in cells with CHKA knockdown (Figure 4C). We found that after CHKA knockdown, the proliferation rate of H520SH-ATP8B1 cells significantly decreased (Figure 4D), and the apoptotic rate accordingly increased (Figure 4E). Furthermore, after CHKA knockdown, the migration and invasion capacity of H520SH-ATP8B1 cells significantly decreased (Figure 4F,G). As an oncogene, CHKA is highly expressed in a variety of tumors. It can has a carcinogenic role by activating the MAPK and PI3K/AKT signaling pathways [17]. We found that the phosphorylation level of ERK and AKT was increased in H520SH-ATP8B1 cells. When we knocked down CHKA, the phosphorylation level of ERK and AKT was significantly reduced (Figure 4H). All the results in SK-MES-1 cells were consistent with those in H520 cells (Figure S2). These results further suggest that ATP8B1 knockdown promoted cell proliferation and invasion in LUSC in a CHKA-dependent manner.

2.5. ATP8B1 Knockdown Activated the Choline Metabolism Pathway and Induced High-Level Intracellular REDOX Homeostasis in LUSC

The mechanism by which CHKA activation plays a tumor-promoting role in ATP8B1 knockdown cell lines remains unclear. KEGG and GO enrichment analysis of highly differentially expressed genes in H520SH-ATP8B1 cells found that they were mainly enriched in cellular metabolic pathways, which indicated the correlation between ATP8B1 knockdown and upregulation of intracellular reduction-oxidation (REDOX) homeostasis, including the oxidation-reduction process, cell REDOX homeostasis, reactive oxygen species (ROS) metabolic process, and regulation of cell growth pathways (Figure 5A,B). Since glutathione (GSH) plays a role in inducing and maintaining REDOX homeostasis in cancer cells [18], we examined the level of GSH in H520SH-ATP8B1 cells. The GSH level was higher in H520SH-ATP8B1 cells compared to the controls while the ROS level was higher in H520SH-ATP8B1 cells compared to the controls (Figure 5C,D). After CHKA knockdown, the level of GSH decreased but the level of ROS increased significantly in H520SH-ATP8B1 cells (Figure 5D). We disrupted the intracellular REDOX homeostasis by inhibiting GSH synthesis and stimulating ROS production via buthionine sulfoximine (BSO) [19], and found that the intracellular levels of GSH deceased and ROS increased in H520SH-ATP8B1 cells simultaneously (Figure 5C,D). In addition, we found that BSO significantly inhibited cell proliferation, migration, and invasion but stimulated cell apoptosis of H520SH-ATP8B1 cells (Figure 5E–H). When we treated cells with BSO, we also found that the phosphorylation level of ERK and AKT decreased (Figure 5I). These results imply that ATP8B1 knockdown activated the choline metabolism pathway and induced high-level intracellular REDOX homeostasis to promote carcinogenesis and progression in LUSC.

3. Discussion

ATP8B1 has mostly been studied in progressive familial intrahepatic cholestasis type 1 (PFIC1) [20]. It has only been demonstrated that its low expression was involved in the development of colorectal cancer through regulation of phospholipid homeostasis [10]. We reported for the first time that ATP8B1 regulates choline metabolism to maintain REDOX homeostasis and promotes carcinogenesis and progression of LUSC.
Activated choline metabolism is a hallmark of cancer [21,22], which leads to elevated phosphorylcholine levels in multiple types of cancer, triggering a more aggressive cancer phenotype [16,23,24]. Through gene expressing profiling analysis of LUSC tissue samples from the TCGA database and TJMUCH cohort, we found that low expression of ATP8B1 was associated with poor prognosis, and involved in dysregulation of choline metabolism. Metabolomics analysis indicated that ATP8B1 knockdown activated the choline metabolic pathway via upregulation of CHKA expression, therefore decreasing the level of intracellular choline and increasing the level of phosphorylcholine.
CHKA has an enzymatic activity that phosphorylates choline to form phosphorylcholine. High expression of CHKA is associated with a higher tumor grade and poor prognosis of NSCLC [25], and silencing of CHKA reduces cell proliferation, migration, and invasion capability [26]. In this study, after CHKA knockdown, we observed that the cell proliferation, invasion, and migration capacity of H520SH-ATP8B1 and SK-MES-1SH-ATP8B1 cells was significantly reduced, which indicates that ATP8B1 knockdown promoted carcinogenesis and progression of LUSC in a CHKA-dependent manner. Moreover, CHKA is usually considered as an oncogene that activates the MAPK and PI3K/AKT pathways [17]. We found that the phosphorylation level of ERK and AKT increased in H520SH-ATP8B1 and SK-MES-1SH-ATP8B1 cell lines. When CHKA was knocked down, the phosphorylation level decreased. Therefore, blocking the choline metabolic pathway via a CHKA inhibitor might be a promising therapeutic strategy for LUSC. Until now, 14 CHKA inhibitors have been proposed at Research Collaboratory for Structural Bioinformatics (RCSB), among which TCD-717 has completed a phase I clinical trial and displayed long-term toxic antitumor efficacy in colon adenocarcinomas, non-lung squamous cell carcinomas, and breast adenocarcinomas [27,28,29,30].
Cancer cells can extensively reprogram their metabolic pathways to fulfill increased biosynthesis and bioenergy needs. The metabolism reprogramming of cancer cells always increases oxidative stress [18]. It was reported that ATP8B1 encodes a cardiolipin transporter that mediates the flip of cardiolipin from the outside to the inside of the mitochondrial inner membrane [4]. Since cardiolipin was reported to interact directly with a number of essential protein complexes on the mitochondrial membrane, including respiratory chain complexes I-V [5], ATP8B1 deficiency might lead to decreased mitochondrial complex enzyme activity via cardiolipin remodeling, resulting in ROS production upregulation [12]. Transcriptome analysis showed that most of the differentially expressed genes were enriched in the REDOX homeostasis pathway in ATP8B1-knockdown LUSC cells. REDOX homeostasis refers to the balance between oxidizing and reducing metabolites in cells. Compared with normal tissues, ROS production increases in tumor tissues, and the expression of antioxidant proteins, which are both involved in maintaining intracellular REDOX homeostasis to promote tumor cell signaling and maintain resistance to apoptosis [31].
In this study, we noticed that the glutamate energy metabolic pathway, which can regulate GSH metabolism and maintain the REDOX balance in cells, was highly differentially expressed either in LUSC tissues with low expression of ATP8B1 or LUSC cells with ATP8B1 knockdown [32,33,34]. It has been reported that CHKA silencing can significantly inhibit the content of GSH, thereby impairing antioxidant cell defense and possibly enhancing cellular response to drug therapy [23]. We proved that interference in CHKA expression in ATP8B1 knockdown cell lines could reduce the GSH content and increase the ROS level. Furthermore, the GSH inhibitor BSO could dramatically disrupt the high-level intracellular REDOX homeostasis to inhibit cell proliferation, invasion, and migration of LUSC cells as efficiently as CHKA knockdown. The destruction of REDOX homeostasis can also inhibit the activation of the MAPK and PI3K/AKT signaling pathway [35,36]. Here, we validated that interference with CHKA and REDOX homeostasis can decrease the phosphorylation level of both ERK and AKT, suggesting that ERK and AKT activation could be regulated by REDOX homeostasis (Figure S3).
In conclusion, ATP8B1 knockdown leads to abnormal phospholipid metabolism both on the cell membrane and mitochondrial membrane. The abnormal phospholipid metabolism on the mitochondrial membrane might cause dysfunction of the electron transport chain in mitochondria, resulting in increased ROS. In contrast, the abnormal phospholipid metabolism on the cell membrane might participate in choline metabolism reprogramming, CHKA activation and GSH production, and even oxidative stress resistance, which facilitate the maintenance of high-level intracellular REDOX homeostasis in cells, thus activating the MAPK and PI3K/AKT pathway to promote carcinogenesis and progression of LUSC cells. Therefore, for the first time, we propose ATP8B1 as a novel predictive biomarker in LUSC and targeting ATP8B1-driven specific metabolic disorder might be a promising therapeutic strategy for LUSC.

4. Materials and Methods

4.1. Patient Information

We obtained 109 cases of partial lung resection performed in Tianjin Medical University Cancer Institute and Hospital (TJMUCH) from the Cancer Biobank of TJMUCH (Table 1 and Table 2). This project was approved by the Ethics Committee of Tianjin Medical University (Approved No.: Ek2021143) and written informed consent was obtained from the patients. All experiments were performed in accordance with the principles of the Declaration of Helsinki.

4.2. Cell Lines and Cell Treatment

NCI-H520 and SK-MES-1 were purchased from Cellcook Co., Ltd. (Guangzhou, China) with cell authentication via the STR multi-amplification method. NCI-H520 was cultured in RPMI1640 (Gibco BRL). SK-MES-1 was cultured in Eagle’s Minimum Essential Medium. All medium contained 10% FBS and 1% penicillin/streptomycin. The cells were cultured at 37°, under 5% CO2. BSO (yuanye, Shanghai, China) was dissolved in H2O. BSO was diluted to 249.7uM, followed by replacing the cell medium 12h after cells seeded. All experiments were completed less than 2 months after establishing stable cell lines or thawing early passage cells.

4.3. Mouse Models

NOD-SCID mice, 5 weeks old, weighing about 17–18 g, were obtained from Beijing Vital River Laboratory Animal Technology Co., Ltd. (Beijing, China). All mice are housed in the SPF animal facility. We obtained different H520 and SK-MES-1 cells carrying constructed lentiviruses (SH-NC and SH-ATP8B1) and resuspended 5 × 10⁴ cells in 100 μL of PBS with Matrigel, followed by administration of the cells to the flanks of NOD-SCID mice via subcutaneous injection. Each group included 5 mice. After the mice were constructed, the weight and tumor size of each mouse were monitored every 4 days. The calculation formula of the tumor volume (V) is V = π × L × W × H/6 (L: length, W: width, H: height). All animal protocols were approved by the Ethics Committee for Animal Experiments of TJMUCH (Approved No.: NSFC-AE-2021179), and were performed in accordance with the Guide for the Care and Use of Laboratory Animals. The Wistar IACUC guideline was followed to determine the time at which the survival experiments were ended (tumor burden exceeds 10% of the body weight).

4.4. Lentivirus Construction and Plasmid Transfection

For SH-ATP8B1 insertion lentivirus construction, the SH-ATP8B1 fragment was amplified by PCR using the complementary DNA (cDNA) of H520 and SK-MES-1 cells as a template. Then, the amplified SH-ATP8B1 fragment was inserted into Phblv-CMV-MCS-EF1-T2A-Puro lentiviral vectors (Hanbio Co., Ltd., Shanghai, China) and the constructed positive plasmid was confirmed by DNA sequencing.

4.5. RNA Extraction, Reverse Transcription-Polymerase Chain Reaction (RT-PCR), and Quantitative Real-Time PCR (qPCR) Analysis

As mentioned earlier, RNA extraction, cDNA synthesis, RT-PCR, and qPCR analysis were performed in accordance with the manufacturer’s protocol. The primer sequence is shown in Table S1.

4.6. RNA Library Preparation, Sequencing, and Enrichment Analysis

In short, the library was sequenced on Illumina® (NEB, Ipswich, MA, USA) according to the manufacturer’s recommendations. The RNA sequencing data were uploaded to the GEO database (accession number: GSE181042).

4.7. Immunohistochemistry

All procedures are executed as described above. The antibodies we used here are shown in Table S2 and biotinylated secondary goat anti-mouse IgG antibody (Santa Cruz, CA, USA), according to the manufacturer’s instructions, using the DAB staining kit (Maixin Biotechnology, Beijing, China) with streptavidin-horseradish peroxidase (HRP) labeling. For the negative control, IgG1 was used to replace each primary antibody. Positive staining areas were counted in 5 fields at 200× magnification.

4.8. Multispectral Fluorescent Immunohistochemistry

First, the slide was heated, then xylene was used to remove residual paraffin, and then rehydrated in graded alcohol. AR6 buffer and microwave processing were used for antigen retrieval. Then, the blocking solution was used for blocking. Then, the first primary antibody, position1, was applied and allowed to incubate. The opal polymer HRP Ms + Rb (Perkin Elmer, Hopkington, MA, USA) was used as the secondary antibody. The slides were washed and Tyramine Signal Amplification (TSA) dye was applied at position 1 (Opal 7 Color Kit, Perkin Elmer, Hopkington, MA, USA). The slides were then microwaved to peel off the primary and secondary antibodies, washed, and blocked again with a blocking solution. The second primary antibody was applied at position 2, and the process repeated, in which DAPI was applied after the unbound DAPI was washed away, and the slide was covered with LongtTM Gold anti-quenching reagent (Invitrogen, Carlsbad, CA, USA). Five fields at 200× magnification from the single-color slides were imaged, and StrataQuest Image Analysis software (v.6.0.1.181) was used to generate a spectral library for unmixing.

4.9. Cell Proliferation Assay

The Cell Counting Kit 8 (CCK8, Beyotime Biotechnology, Shanghai, China) assay was used to detect the proliferation ability. Cells were inoculated in 96-well plates at a density of 2 × 10³ cells/100 μL/well. Then, 10 μL of CCK-8 reagent were added to each well. The cells were incubated at 37 °C for 2 h and the absorbance at 450/650 nm was measured by a microplate reader (Synergy HT). The mean values of the three replicates were calculated.
The cells were inoculated into 96-well plates at a density of 3000 cells/well and grown in 1640/MEM supplemented with 10% FBS. Cell viability was determined by Solarbio’s MTT reagent (Solarbio, Beijing, China). On the day of determination, 10 μL of MTT solution were added and incubated at 37 °C for 4 h in fresh 1640/MEM + 10% FBS medium. Another 110 μL of Formazan solution were added. The light absorption at 490 nm was measured using microplate reader (Synergy HT) quantification. Each experiment was repeated at least three times.

4.10. Cell Apoptosis Assay

An Annexin-V-APC Apoptosis Assay Kit (BioBay, Tianjin, China) was used to detect cell apoptosis. After the cells were collected, they were washed with PBS and resuspended at a concentration of 1 × 10⁵ cells/mL to prepare a single-cell suspension. Subsequently, 5 μL of Annexin-V and 5 μL of APC were added to the cell suspension and the mixture was incubated in the dark for 15 min. The proportion of apoptotic cells (Annexin-V+ APC-) was determined by flow cytometry.

4.11. Wound Healing Assay

Cells were inoculated in 6-well plates. When the density reached 90~100%, a line was drawn on the monolayer cells with a 20 μL pipette tip to form “scratches”. The cells were rinsed with PBS to remove cell debris, and then cultured in fresh medium. In total, 5 fields were selected under the microscope at 0 and 48 h after scribbling. The scratch distance was measured three times each time to find the average value. Cell migration rate = (0 h scratch distance–48 h scratch distance)/0 h scratch distance × 100%.

4.12. Trans-Well Invasion Assay

The invasion ability was detected using Matrigel gel and the Trans-Well plate. The cells were inoculated in Matrigel and 200 μL of serum-free RPMI-1640 at a density of 2 × 10⁴ cells. The cells were inoculated in a 24-well plate trans-well system with an 8 μm polycarbonate filter membrane in the lower chamber and with medium containing 10% FBS. After incubation for 48 h, cells on the submembrane surface were fixed with methanol and stained with crystal violet. The stained membrane was photographed with a microscope. The number of cells was counted from five randomly selected fields, and the average value of the three complex pores was calculated.

4.13. Western Blot

Protein was quantified using the BCA protein assay kit (Solarbio, Beijing, China). Protein (20μg) was separated by 10% sodium dodecyl sulfate polyacrylamide gel electrophoresis and transferred to a polyvinylidene fluoride membrane (PVDF). The membrane was blocked with 5% skim milk, and then incubated with the primary antibody overnight at 4 °C. The antibodies used are shown in Table S2. After incubating with HRP-conjugated α-rabbit or α-mouse secondary antibody for 1 h, the ChemiDoc imaging system (Bio-Rad, Hercules, CA, USA) was used to detect protein bands with a chemiluminescent substrate (Perkin Elmer).

4.14. Metabonomics

Metabolomics analysis was performed by Shanghai Bioprofile Technology Company Ltd. Cells were washed three times with sterile pre-cooled PBS and harvested for metabolic analysis. Then, a 100 mg sample was incorporated into 1 mL of cold methanol/acetonitrile/H2O (2:2:1, v/v/v) and adequately vortexed. The lysate was homogenized by an MP homogenizer. The homogenate was sonicated at a low temperature (30 min/once, twice). The mixture was centrifuged for 20 min. The supernatants were collected and dried in a vacuum centrifuge. Then, the lyophilized samples were reconstituted in 100 μL of acetonitrile/water (1:1, v/v) and adequately vortexed, and then centrifuged. The supernatants were collected for HPLC-MS/MS analysis using an UHPLC (1260 Infinity LC, Agilent Technologies, Santa Clara, CA, USA) coupled to a triple quadrupole mass spectrometer (Agilent 6460 QqQAgilent Technologies).

4.15. Determination of Intracellular Reactive Oxygen Species (ROS)

ROS was determined using a ROS detection kit (Beyotime Biotechnology, Shanghai, China) according to the manufacturer’s instructions. The cells were collected and incubated with DCFH-DA at 37 °C for 30 min, and then washed with serum-free medium. Flow cytometry was used to detect the DCF fluorescence of 1 × 10⁷/mL cells at an excitation wavelength of 488 nm and emission wavelength of 525 nm.

4.16. Glutathione (GSH) Detection Assay

The level of GSH was measured in cell or tumor lysates according to the instructions of the GSH and GSSG Assay Kit (Beyotime Biotechnology, Shanghai, China).

4.17. Phosphorylcholine Detection

We used an ELISA kit (Jianglaibio, Shanghai, China) to detect intracellular phosphorylcholine and phosphatidylcholine.

4.18. Statistical Analysis

Follow the manufacturer’s instructions, we analyzed the data using SPSS 22.0 and GraphPad Prism 8.0 software. The measurement data are expressed as the median (interquartile range) and were compared using the χ2 test. Quantitative data are presented in the form of average ± standard deviation, and were compared through analysis of variance and the LSD test. The Spearman rank test and linear regression analysis were used to evaluate the correlation between the expression levels detected by RT-qPCR. Univariate Cox regression and multivariate Cox regression analysis were used to identify common genes related to OS, and the cumulative survival rate was determined by the Kaplan–Meier method. The univariate survival rate of LUSC patients with different LINE-1 insertion and OS was analyzed by the two-sided log-rank test. The statistical significance was set as p < 0.05.

5. Conclusions

In conclusion, for the first time, we demonstrated that ATP8B1 could be used a novel predictive biomarker in LUSC. Our important findings of the oncogenic role of ATP8B1 knockdown-driven metabolic disorder in LUSC carcinogenesis are likely applicable to other cancers. We propose that targeting ATP8B1-driven specific metabolic disorder might be a promising therapeutic strategy for LUSC.

Supplementary Materials

The following supporting information can be downloaded at: https://www.mdpi.com/article/10.3390/cancers14030835/s1, Figure S1: Phosphatidylcholine catabolism, Figure S2: Interfering with CHKA expression in SH-ATP8B1 cell lines, inhibiting tumor progression, Figure S3: Model of ATP8B1 function, Figure S4: Original Blots, Table S1: The sequences of primers for detection, Table S2: The list of antibodies in the research

Author Contributions

J.Y. conceived and designed the experiments. X.Z. and R.Z. (Rui Zhang) performed the experiments. X.Z., R.Z. (Rui Zhang) and J.Y. prepared all of the figures and wrote the manuscript. P.L. and R.Z. (Runjiao Zhang) collected the LUSC samples. J.N., W.Y. and Y.Y. analyzed the data. All authors have read and agreed to the published version of the manuscript.

Funding

This work was supported by the National Natural Science Foundation of China (grant No. 82173198 and 82072588), the National Science and Technology Support Program of China (grant No. 2018ZX09201015), the Project of Science and Technology of Tianjin (grant No. 18JCQNJC82700), Tianjin Research Innovation Project for Postgraduate Students (grant No. 2020YJSB166).

Institutional Review Board Statement

The study was conducted according to the guidelines of the Declaration of Helsinki, and approved by the Ethics Committee of Tianjin Medical University granted approval for this study (Approved No.: Ek2021143; date: 1 March 2021).

Informed Consent Statement

Informed consent was obtained from all subjects involved in the study.

Data Availability Statement

The data presented in this study are all available within the article or Supplementary Material.

Acknowledgments

Thanks to Weijia Zhang in Icahn School of Medicine at Mount Sinai, New York for his guidance in biological information.

Conflicts of Interest

The authors declare no conflict of interest.

References

  1. Pan, Y.; Han, H.; Labbe, K.E.; Zhang, H.; Wong, K.-K. Recent advances in preclinical models for lung squamous cell carcinoma. Oncogene 2021, 40, 2817–2829. [Google Scholar] [CrossRef] [PubMed]
  2. Thai, A.A.; Solomon, B.J.; Sequist, L.V.; Gainor, J.F.; Heist, R.S. Lung cancer. Lancet 2021, 398, 535–554. [Google Scholar] [CrossRef]
  3. Alvarez, J.G.B.; González-Cao, M.; Karachaliou, N.; Santarpia, M.; Viteri, S.; Teixidó, C.; Rosell, R. Advances in immunotherapy for treatment of lung cancer. Cancer Biol. Med. 2015, 12, 209–222. [Google Scholar] [CrossRef]
  4. Faubert, B.; Solmonson, A.; DeBerardinis, R.J. Metabolic reprogramming and cancer progression. Science 2020, 368, eaaw5473. [Google Scholar] [CrossRef] [PubMed]
  5. Vanhove, K.; Derveaux, E.; Graulus, G.-J.; Mesotten, L.; Thomeer, M.; Noben, J.-P.; Guedens, W.; Adriaensens, P. Glutamine Addiction and Therapeutic Strategies in Lung Cancer. Int. J. Mol. Sci. 2019, 20, 252. [Google Scholar] [CrossRef] [Green Version]
  6. DeBerardinis, R.J.; Chandel, N.S. Fundamentals of cancer metabolism. Sci. Adv. 2016, 2, e1600200. [Google Scholar] [CrossRef] [Green Version]
  7. Zhang, X.; Zhang, R.; Yu, J. New Understanding of the Relevant Role of LINE-1 Retrotransposition in Human Disease and Immune Modulation. Front. Cell Dev. Biol. 2020, 8, 657. [Google Scholar] [CrossRef]
  8. Zhang, R.; Zhang, F.; Sun, Z.; Liu, P.; Zhang, X.; Ye, Y.; Cai, B.; Walsh, M.J.; Ren, X.; Hao, X.; et al. LINE-1 Retrotransposition Promotes the Development and Progression of Lung Squamous Cell Carcinoma by Disrupting the Tumor-Suppressor Gene FGGY. Cancer Res. 2019, 79, 4453–4465. [Google Scholar] [CrossRef] [Green Version]
  9. Korneenko, T.V.; Pestov, N.B.; Okkelman, I.A.; Modyanov, N.N.; Shakhparonov, M.I. P4-ATP-ase Atp8b1/FIC1: Structural properties and (patho)physiological functions. Bioorg. Khim. 2015, 41, 3–12. [Google Scholar] [CrossRef]
  10. Deng, L.; Niu, G.-M.; Ren, J.; Ke, C.-W.; Loura, L. Identification of ATP8B1 as a Tumor Suppressor Gene for Colorectal Cancer and Its Involvement in Phospholipid Homeostasis. BioMed Res. Int. 2020, 2020, 2015648. [Google Scholar] [CrossRef]
  11. Alyabsi, M.; Alhumaid, A.; Allah-Bakhsh, H.; Alkelya, M.; Aziz, M.A. Colorectal cancer in Saudi Arabia as the proof-of-principle model for implementing strategies of predictive, preventive, and personalized medicine in healthcare. EPMA J. 2019, 11, 119–131. [Google Scholar] [CrossRef]
  12. Fukumoto, J.; Leung, J.; Cox, R.; Czachor, A.; Parthasarathy, P.T.; Lagishetty, V.; Mandry, M.; Hosseinian, N.; Patel, P.; Perry, B.; et al. Oxidative stress induces club cell proliferation and pulmonary fibrosis in Atp8b1 mutant mice. Aging 2019, 11, 209–229. [Google Scholar] [CrossRef]
  13. Falcon, S.C.; Hudson, C.S.; Huang, Y.; Mortimore, M.; Golec, J.M.; A Charlton, P.; Weber, P.; Sundaram, H. A non-catalytic role of choline kinase alpha is important in promoting cancer cell survival. Oncogenesis 2013, 2, e38. [Google Scholar] [CrossRef] [PubMed] [Green Version]
  14. Spadaro, F.; Ramoni, C.; Mezzanzanica, D.; Miotti, S.; Alberti, P.; Cecchetti, S.; Iorio, E.; Dolo, V.; Canevari, S.; Podo, F.; et al. Phosphatidylcholine-Specific Phospholipase C Activation in Epithelial Ovarian Cancer Cells. Cancer Res. 2008, 68, 6541–6549. [Google Scholar] [CrossRef] [PubMed] [Green Version]
  15. Paris, L.; Cecchetti, S.; Spadaro, F.; Abalsamo, L.; Lugini, L.; Pisanu, M.E.; Iorio, E.; Natali, P.G.; Ramoni, C.; Podo, F. Inhibition of phosphatidylcholine-specific phospholipase C downregulates HER2 overexpression on plasma membrane of breast cancer cells. Breast Cancer Res. 2010, 12, R27. [Google Scholar] [CrossRef] [PubMed] [Green Version]
  16. Glunde, K.; Bhujwalla, Z.M.; Ronen, S.M. Choline metabolism in malignant transformation. Nat. Cancer 2011, 11, 835–848. [Google Scholar] [CrossRef] [Green Version]
  17. Clem, B.F.; Clem, A.L.; Yalcin, A.; Goswami, U.; Arumugam, S.; Telang, S.; Trent, J.O.; Chesney, J. A novel small molecule antagonist of choline kinase-α that simultaneously suppresses MAPK and PI3K/AKT signaling. Oncogene 2011, 30, 3370–3380. [Google Scholar] [CrossRef] [Green Version]
  18. Chio, I.I.C.; Tuveson, D.A. ROS in Cancer: The Burning Question. Trends Mol. Med. 2017, 23, 411–429. [Google Scholar] [CrossRef] [Green Version]
  19. Vogg, A.T.J.; Drude, N.; Mottaghy, F.M.; Morgenroth, A.; Miran, T. Modulation of glutathione promotes apoptosis in triple-negative breast cancer cells. FASEB J. 2018, 32, 2803–2813. [Google Scholar] [CrossRef] [Green Version]
  20. Nayagam, J.S.; Williamson, C.; Joshi, D.; Thompson, R.J. Review article: Liver disease in adults with variants in the cholestasis-related genes ABCB11, ABCB4 and ATP8B1. Aliment. Pharmacol. Ther. 2020, 52, 1628–1639. [Google Scholar]
  21. Cheng, M.; Rizwan, A.; Jiang, L.; Bhujwalla, Z.M.; Glunde, K. Molecular Effects of Doxorubicin on Choline Metabolism in Breast Cancer. Neoplasia 2017, 19, 617–627. [Google Scholar] [CrossRef] [PubMed]
  22. Sonkar, K.; Ayyappan, V.; Tressler, C.; Adelaja, O.; Cai, R.; Cheng, M.; Glunde, K. Focus on the glycerophosphocholine pathway in choline phospholipid metabolism of cancer. NMR Biomed. 2019, 32, e4112. [Google Scholar] [CrossRef] [PubMed]
  23. Granata, A.; Nicoletti, R.; Perego, P.; Iorio, E.; Krishnamachary, B.; Benigni, F.; Ricci, A.; Podo, F.; Bhujwalla, Z.M.; Canevari, S.; et al. Global metabolic profile identifies choline kinase alpha as a key regulator of glutathione-dependent antioxidant cell defense in ovarian carcinoma. Oncotarget 2015, 6, 11216–11230. [Google Scholar] [CrossRef] [PubMed] [Green Version]
  24. Trousil, S.; Lee, P.; Pinato, D.J.; Ellis, J.K.; Dina, R.; Aboagye, E.O.; Keun, H.C.; Sharma, R. Alterations of Choline Phospholipid Metabolism in Endometrial Cancer Are Caused by Choline Kinase Alpha Overexpression and a Hyperactivated Deacylation Pathway. Cancer Res. 2014, 74, 6867–6877. [Google Scholar] [CrossRef] [Green Version]
  25. de Molina, A.R.; Estrada, J.S.; Iniesta, C.B.; Tarón, M.; de Molina, V.R.; Cejas, P.; Skrzypski, M.; Gallego-Ortega, D.; de Castro, J.; Casado, E.; et al. Expression of choline kinase alpha to predict outcome in patients with early-stage non-small-cell lung cancer: A retrospective study. Lancet Oncol. 2007, 8, 889–897. [Google Scholar] [CrossRef]
  26. De Molina, A.R.; De La Cueva, A.; Machado-Pinilla, R.; Rodriguez-Fanjul, V.; Del Pulgar, T.G.; Cebrian, A.; Perona, R.; Lacal, J.C. Acid ceramidase as a chemotherapeutic target to overcome resistance to the antitumoral effect of choline kinase α inhibition. Curr. Cancer Drug Targets 2012, 12, 617–624. [Google Scholar] [CrossRef] [Green Version]
  27. Kall, S.L.; Delikatny, E.J.; Lavie, A. Identification of a Unique Inhibitor-Binding Site on Choline Kinase α. Biochemistry 2018, 57, 1316–1325. [Google Scholar] [CrossRef]
  28. Lacal, J.C.; Campos, J. Preclinical Characterization of RSM-932A, a Novel Anticancer Drug Targeting the Human Choline Kinase Alpha, an Enzyme Involved in Increased Lipid Metabolism of Cancer Cells. Mol. Cancer Ther. 2014, 14, 31–39. [Google Scholar] [CrossRef] [Green Version]
  29. Rubio-Ruiz, B.; Figuerola-Conchas, A.; Ramos-Torrecillas, J.; Capitán-Cañadas, F.; Ríos-Marco, P.; Carrasco, M.P.; Gallo, M.; Espinosa, A.; Marco, C.; Ruiz, C.; et al. Discovery of a New Binding Site on Human Choline Kinase α1: Design, Synthesis, Crystallographic Studies, and Biological Evaluation of Asymmetrical Bispyridinium Derivatives. J. Med. Chem. 2014, 57, 507–515. [Google Scholar] [CrossRef]
  30. Sahún-Roncero, M.; Rubio-Ruiz, B.; Saladino, G.; Conejo-García, A.; Espinosa, A.; Velazquez-Campoy, A.; Gervasio, F.L.; Entrena, A.; Hurtado-Guerrero, R. The Mechanism of Allosteric Coupling in Choline Kinase α1 Revealed by the Action of a Rationally Designed Inhibitor. Angew. Chem. 2013, 52, 4582–4586. [Google Scholar] [CrossRef]
  31. Moloney, J.N.; Cotter, T.G. ROS signalling in the biology of cancer. Semin. Cell Dev. Biol. 2018, 80, 50–64. [Google Scholar] [CrossRef] [PubMed]
  32. Schraut, K.; Kalnytska, O.; Lamp, D.; Jastroch, M.; Eder, M.; Hausch, F.; Gassen, N.C.; Moore, S.; Nagaraj, N.; Lopez, J.P.; et al. Loss of the psychiatric risk factor SLC6A15 is associated with increased metabolic functions in primary hippocampal neurons. Eur. J. Neurosci. 2020, 53, 390–401. [Google Scholar] [CrossRef] [PubMed]
  33. Da Silva, J.C.; Amaral, A.U.; Cecatto, C.; Wajner, A.; Godoy, K.D.S.; Ribeiro, R.T.; Gonçalves, A.D.M.; Zanatta, Â.; Da Rosa, M.S.; Loureiro, S.O.; et al. α-Ketoadipic Acid and α-Aminoadipic Acid Cause Disturbance of Glutamatergic Neurotransmission and Induction of Oxidative Stress In Vitro in Brain of Adolescent Rats. Neurotox. Res. 2017, 32, 276–290. [Google Scholar] [CrossRef]
  34. Bolaños, J.P. Bioenergetics and redox adaptations of astrocytes to neuronal activity. J. Neurochem. 2016, 139, 115–125. [Google Scholar] [CrossRef] [PubMed]
  35. Xie, C.; Yi, J.; Lu, J.; Nie, M.; Huang, M.; Rong, J.; Zhu, Z.; Chen, J.; Zhou, X.; Li, B.; et al. N-Acetylcysteine Reduces ROS-Mediated Oxidative DNA Damage and PI3K/Akt Pathway Activation Induced by Helicobacter pylori Infection. Oxidative Med. Cell. Longev. 2018, 2018, 1874985. [Google Scholar] [CrossRef] [PubMed] [Green Version]
  36. Ji, A.-R.; Ku, S.-Y.; Cho, M.S.; Kim, Y.Y.; Kim, Y.J.; Oh, S.K.; Kim, S.H.; Moon, S.Y.; Choi, Y.M. Reactive oxygen species enhance differentiation of human embryonic stem cells into mesendodermal lineage. Exp. Mol. Med. 2010, 42, 175–186. [Google Scholar] [CrossRef] [PubMed] [Green Version]
Figure 1. Low expression of ATP8B1 promotes poor prognosis for the tumor by regulating metabolism. (A) The frequency of 13 LINE-1 insertions in LUSC tissue samples from the TJMUCH cohort. The occurrence frequency of L1-ATP8B1 was the highest in the group with poor prognosis (survival time ≤ 40). (B) We divided LUSC samples from the TJMUCH cohort into L1-ATP8B1+ and L1-ATP8B1 groups according to the relative mRNA expression level of L1-ATP8B1. The transcriptome sequencing data indicated that ATP8B1 mRNA expression was downregulated in the L1-ATP8B1+ group. In 109 LUSC tissues, ATP8B1 expression was divided into high- and low-expression groups according to the median of the expression values, and a high ratio of L1-ATP8B1+ samples was observed in ATP8B1low tumor tissues. (C) Low expression of ATP8B1 was significantly associated with poor prognosis (p = 0.0001). (D) Low expression of ATP8B1 was associated with poor prognosis in patients with LUSC at 5-year survival in the TCGA database (p = 0.041). (E) Pathway enrichment of differentially expressed genes was associated with ATP8B1 in 109 tissues. (F) Pathway enrichment of differentially expressed genes was associated with ATP8B1 in the TCGA database.
Cancers 14 00835 g001
Figure 2. Interference of ATP8B1 promotes malignant progression in vitro and in vivo. (A) Expression of ATP8B1 in H520 and SK-MES-1 cells. All the RT-qPCR results shown for H520SH-NC and H520SH-ATP8B1 were relative mRNA expression values compared to wildtype H520 cell without virus infection for normalization while all the RT-qPCR results shown for SK-MES-1SH-NC and SK-MES-1SH-ATP8B1 were relative mRNA expression values compared to wildtype SK-MES-1 cells. (B) Cell proliferation results. (C) MTT assay results. (D) Cell apoptosis results. (E) Representative images of the wound healing assays. (F) Representative images of the trans-well invasion assays. (G) H520SH-ATP8B1, SK-MES-1SH-ATP8B1, and their control cells were subcutaneously injected into NOD-SCID mice as xenografts. Representative images of the forming tumors and the tumor volume growth curve at various time points are shown. * p < 0.05; ** p < 0.01; *** p < 0.001; Scale bar: 100 μm.
Cancers 14 00835 g002
Figure 3. Low expression of ATP8B1 activates choline kinase and promotes the production of phosphorylcholine. (A) Six pairs of H520SH-ATP8B1 and H520SH-NC samples were tested using metabolomics analysis. (B) KEGG pathway enrichment was carried out for different metabolites. (C) The cell metabolomics results showed that choline levels decreased and phosphorylcholine levels increased in the ATP8B1 knockdown cell lines. (D) Upregulated CHKA protein expression was detected in H520SH-ATP8B1 at the protein level in both cell lines. Original blots see Figure S4. (E) The results showed the relative mRNA expression of CHKA from the transcriptome sequencing data of TJMUCH LUSC tissues. (F) IHC results in 46 cases of LUSC showed that CHKA was highly expressed in the ATP8B1low group. (G) Multispectral fluorescent immunohistochemistry proved that in LUSC, CHKA was highly expressed in the ATP8B1low group. * p < 0.05; ** p < 0.01. Scale bar: 50 μm; 100 μm.
Cancers 14 00835 g003
Figure 4. Interfering with CHKA expression in H520SH-ATP8B1 inhibited tumor progression. (A) Expression of CHKA in different cells at the mRNA level. All the RT-qPCR results shown for H520SH-ATP8B1 and H520SH-ATP8B1-si-CHKAsi-CHKA were relative mRNA expression values compared to H520SH-NC for normalization. (B) Expression of CHKA in different cells at the protein level. (C) The ELISA results of phosphorylcholine and phosphatidylcholine. (D) Cell proliferation results. (E) Cell apoptosis results. (F) Representative images of the wound healing assays. (G) Representative images of the trans-well invasion assays. (H) Analysis of phosphorylated ERK and phosphorylated AKT by Western blot. Original blots see Figure S4. * p < 0.05; ** p < 0.01; *** p < 0.001; Scale bar: 100 μm.
Cancers 14 00835 g004
Figure 5. CHKA maintains REDOX balance by regulating the level of intracellular GSH. (A) KEGG pathway enrichment analysis of differential genes in H520SH-ATP8B1 and H520SH-NC by transcriptome sequencing. (B) GO pathway enrichment analysis of differential genes in H520SH-ATP8B1 and H520SH-NC. (C) The level of intracellular GSH/GSSG. (D) Flow cytometry results of intracellular ROS. (E) Cell proliferation results. (F) Cell apoptosis results. (G) Representative images of the wound healing assays. (H) Representative images of the trans-well invasion assays. (I) Analysis of phosphorylated ERK and AKT by Western blot. Original blots see Figure S4. * p < 0.05; ** p < 0.01; *** p < 0.001; **** p < 0.0001; Scale bar: 100 μm.
Cancers 14 00835 g005
Table 1. The basic clinical pathological information of all patients.
Clinical Pathological ParametersNumber of Patients
Total109
Gender
Male81
Female28
Age
<6052
≥6057
Stage
I–II67
III–IV42
T stage
1–276
3–433
N stage
0–177
2–332
M stage
096
113
Metastatic site
Negative96
Lung6
Bone5
Brain1
Others2
Location
Central50
Periphery59
Smoking
Negative20
Positive89
Table 2. Distributions of the clinical pathological parameters of patients with different ATP8B1 expression levels.
Clinical Pathological ParametersATP8B1p
Low ExpressionHigh Expression
No. of patients5455-
Gender 0.094
Male4048
Female147
Age 0.567
<602630
≥602825
OS 0.004
≤403823
>401632
T stage 0.002
1–23046
3–4249
N stage 0.003
0–13123
2–3239
M stage 0.042
04452
1103
Location 0.848
Periphery3029
Central2426
Smoking 0.332
Negative128
Positive4247
Publisher’s Note: MDPI stays neutral with regard to jurisdictional claims in published maps and institutional affiliations.

