
Loss of Neuropilin-2 in Murine Mesenchymal-like Colon Cancer Organoids Causes Mesenchymal-to-Epithelial Transition and an Acquired Dependency on Insulin-Receptor Signaling and Autophagy

 , and
, and 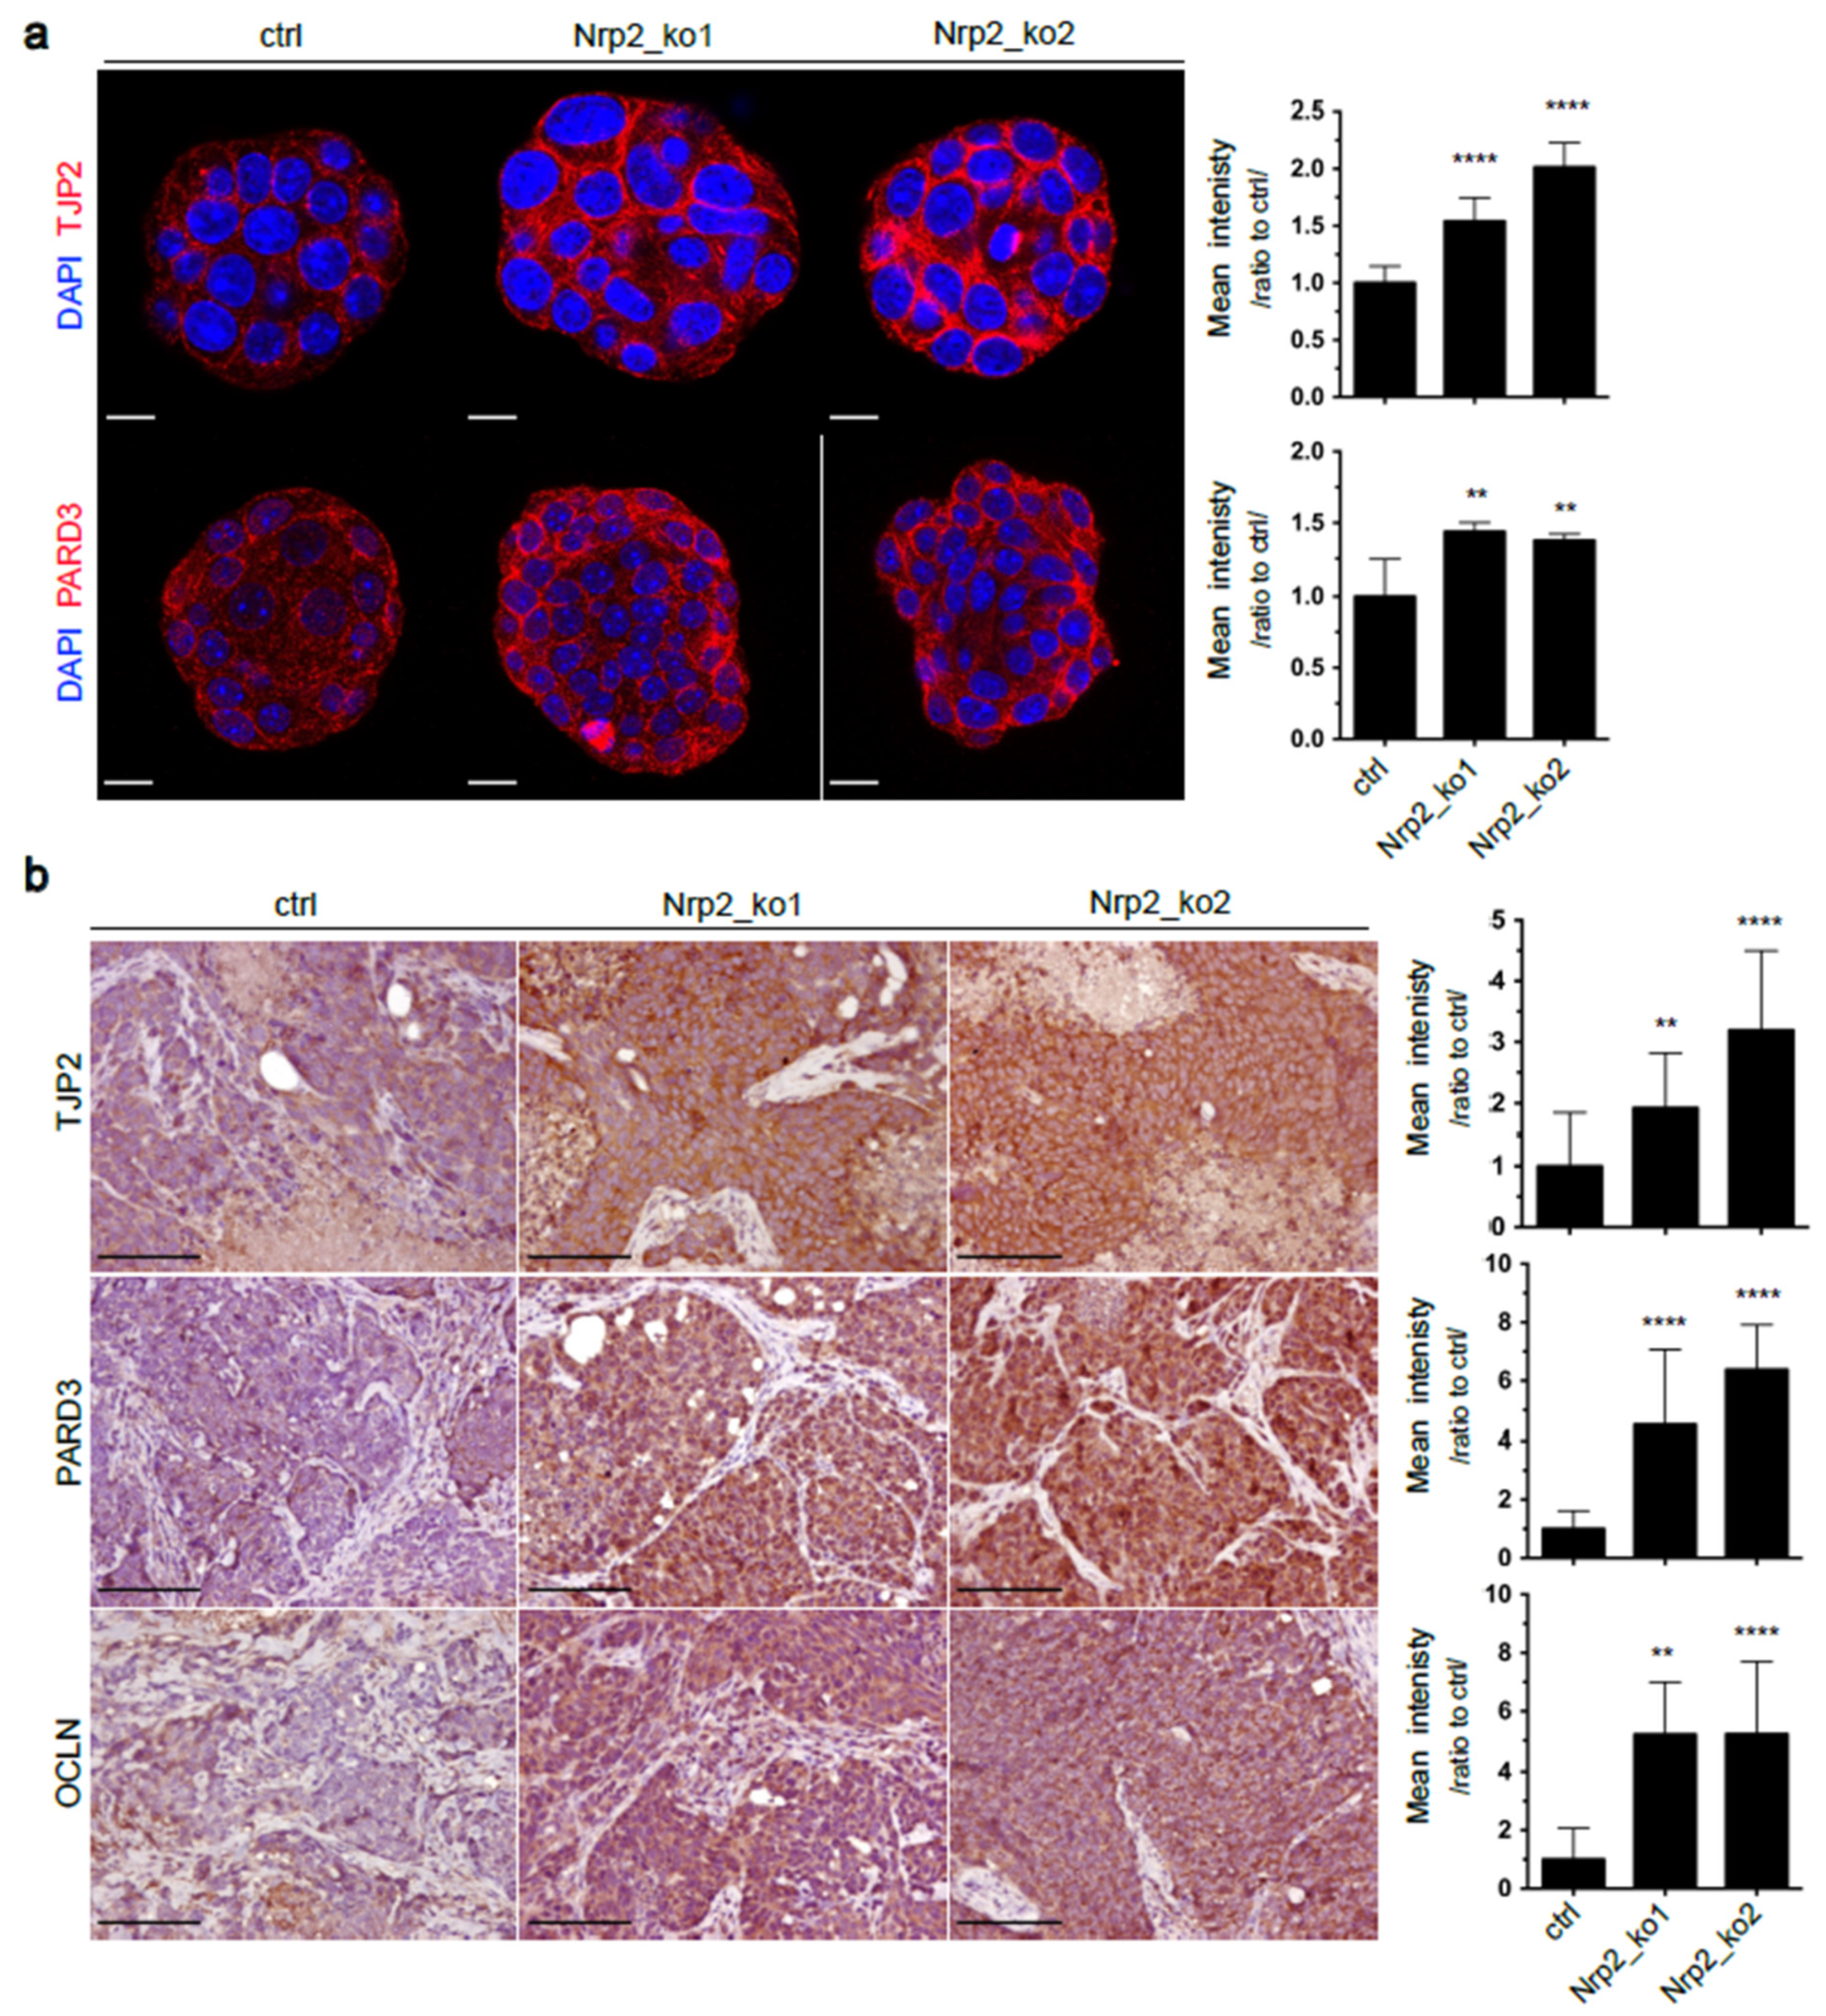
Abstract
:Simple Summary
Abstract
1. Introduction
2. Materials and Methods
2.1. In Vitro 3D Organoid Culture and Treatment
2.2. RNA Sequencing and Data Analysis
2.3. In Vivo Subcutaneous Tumorigenesis
2.4. Immunohistochemistry (IHC) and Immunofluorescence (IF)
2.5. Western Blot Analysis
2.6. Statistical Analyzes
3. Results
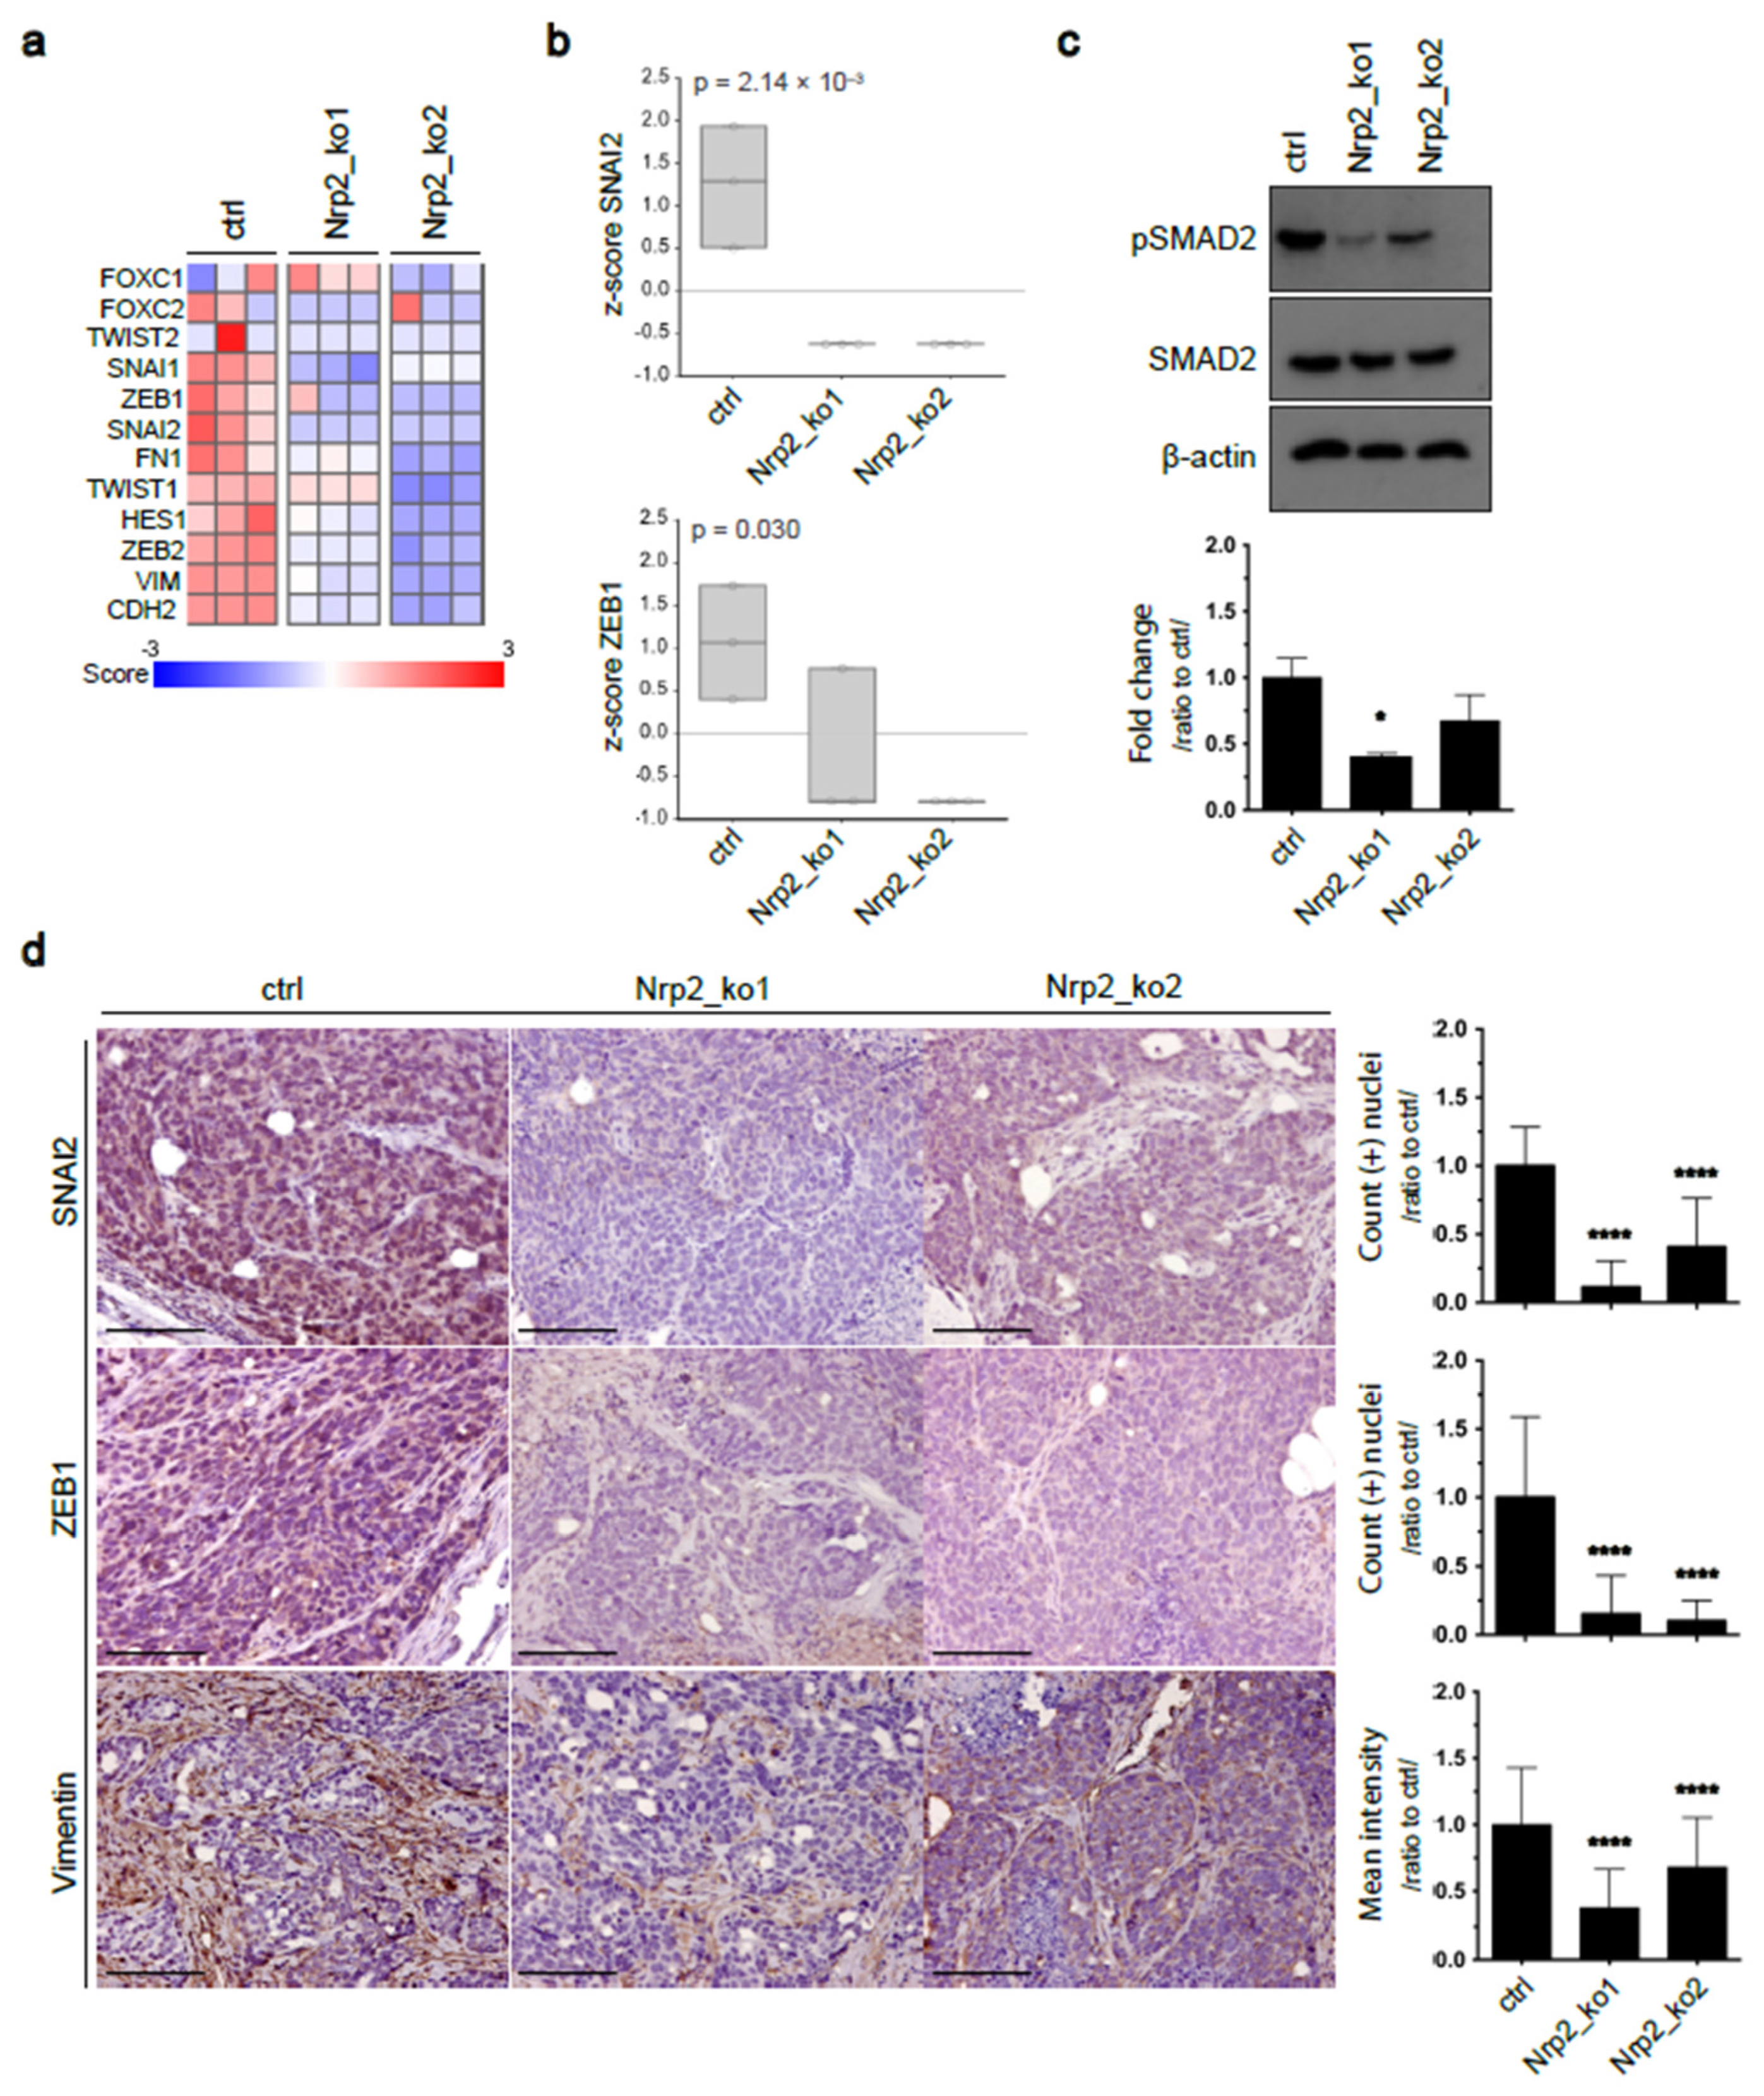
3.1. Nrp2 Knockout in Mouse CRC Organoids Induces Tight Junction Stabilization and EMT Reduction
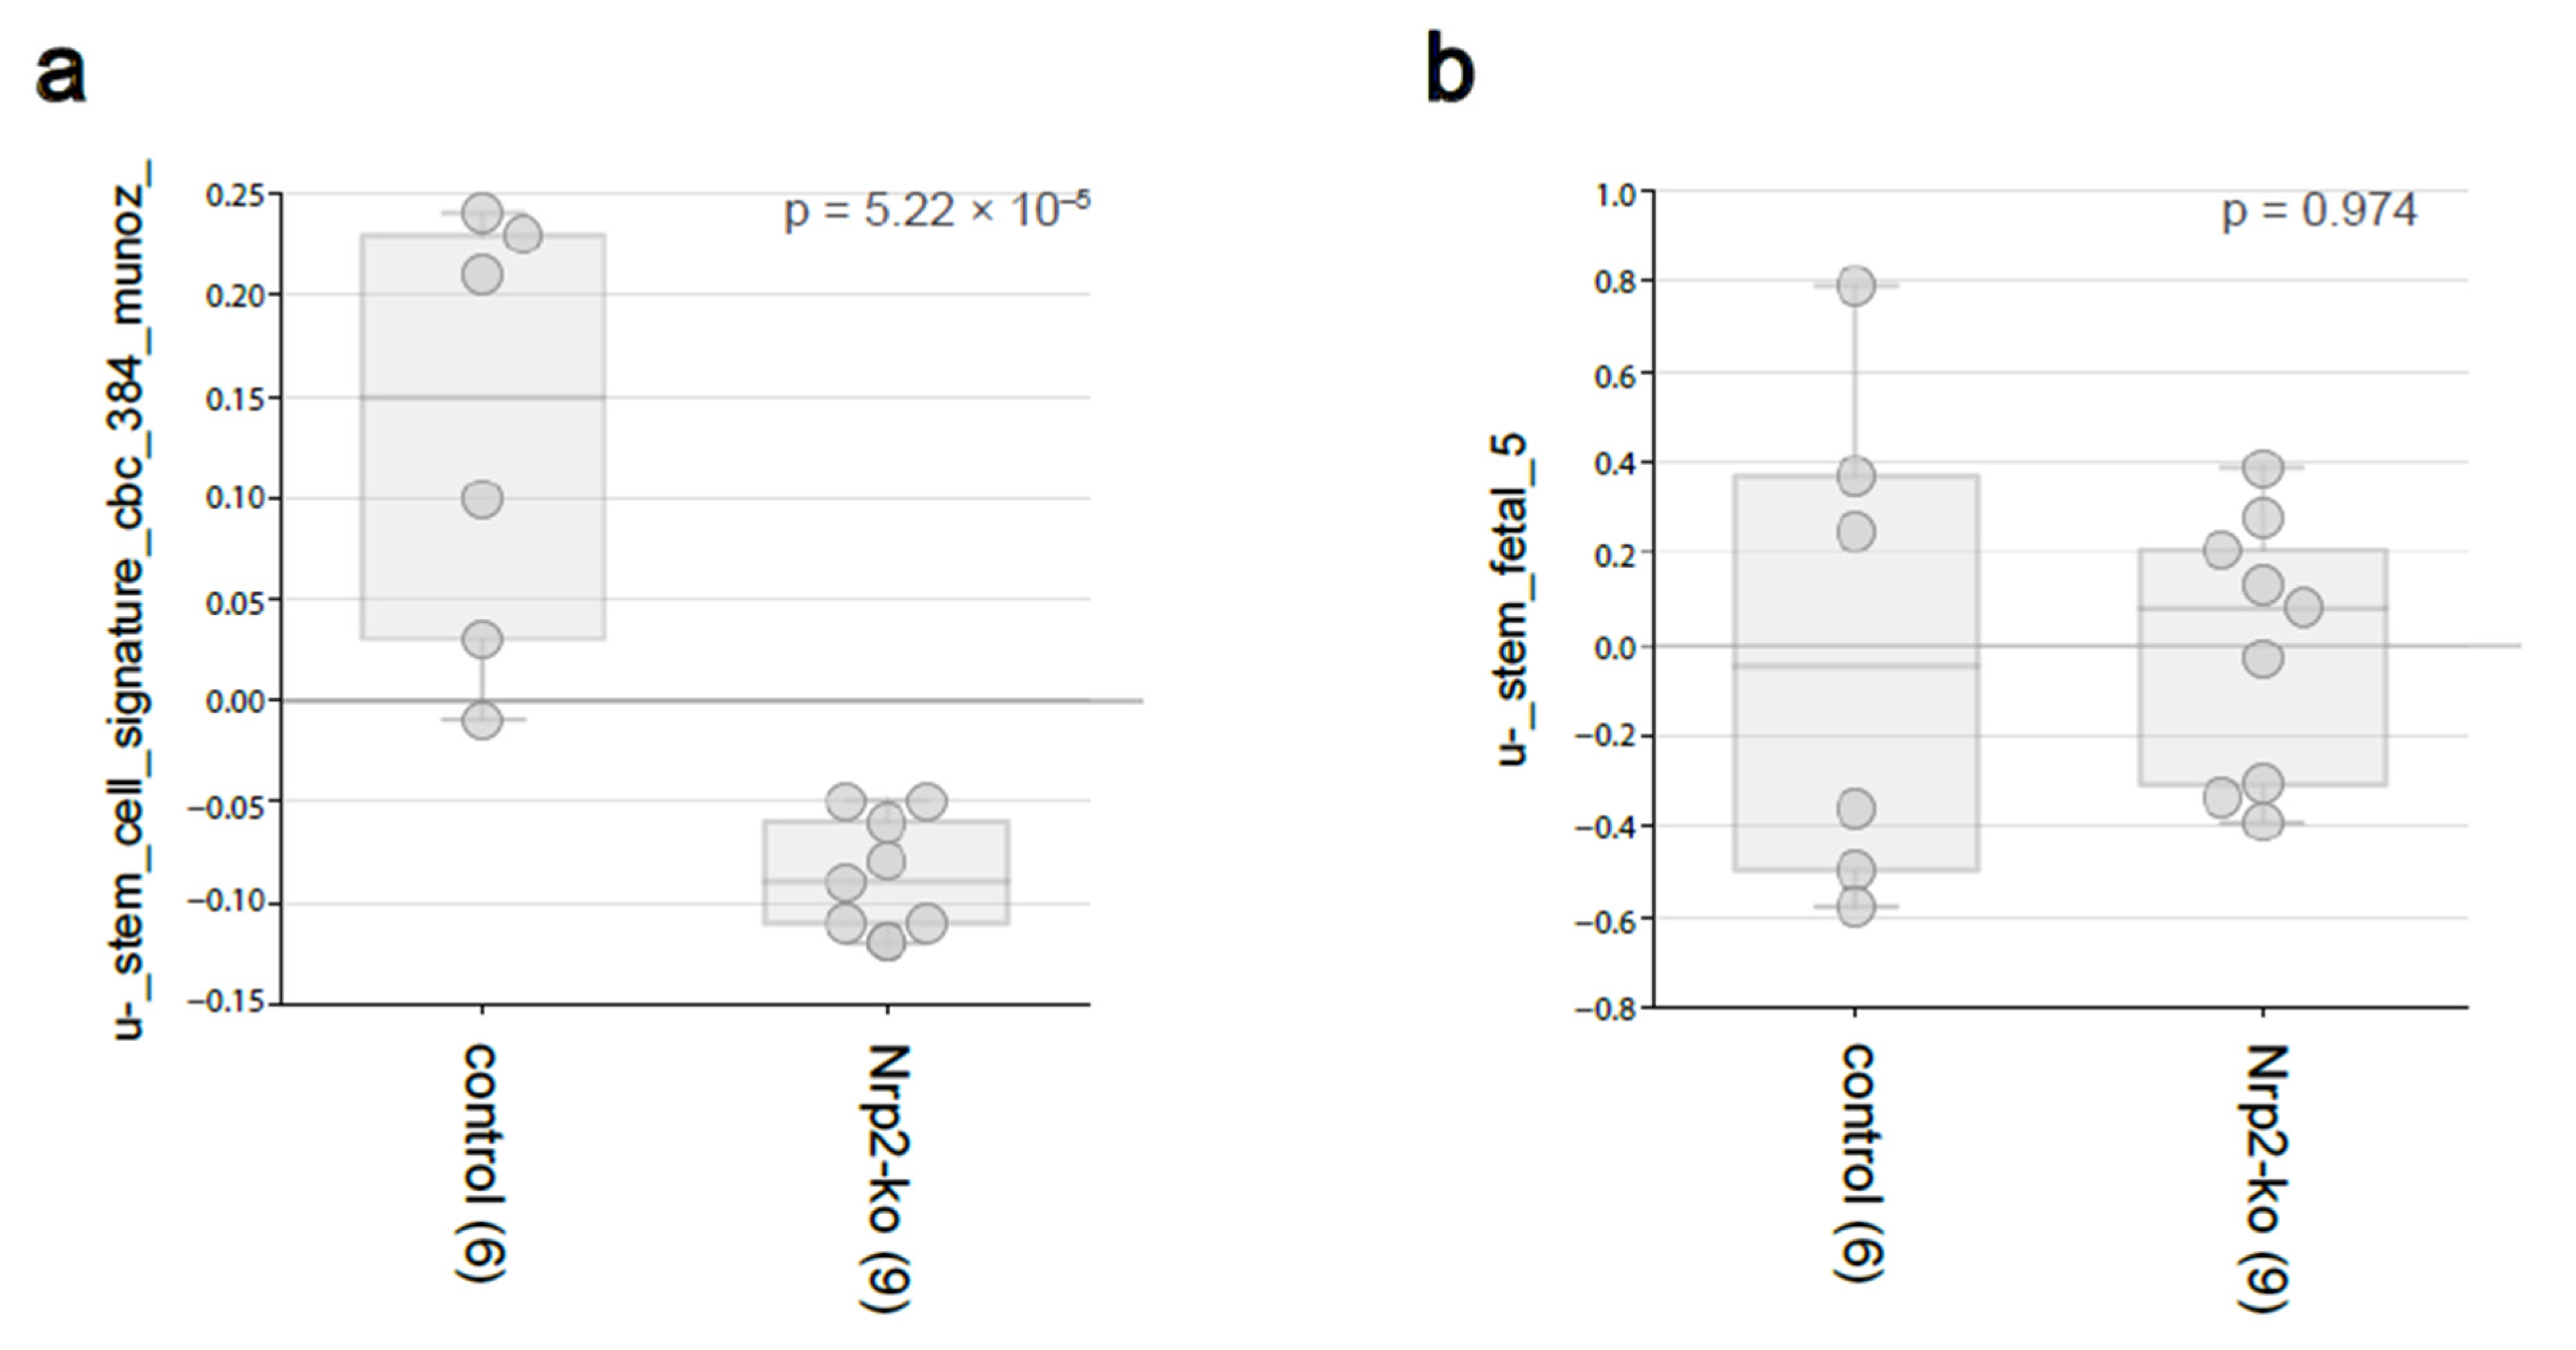
3.2. Nrp2 Knockout in Mouse CRC Organoids Reduces Adult Intestinal Stem Cell Gene Expression without Influencing Fetal Intestinal Stem Cell Signature
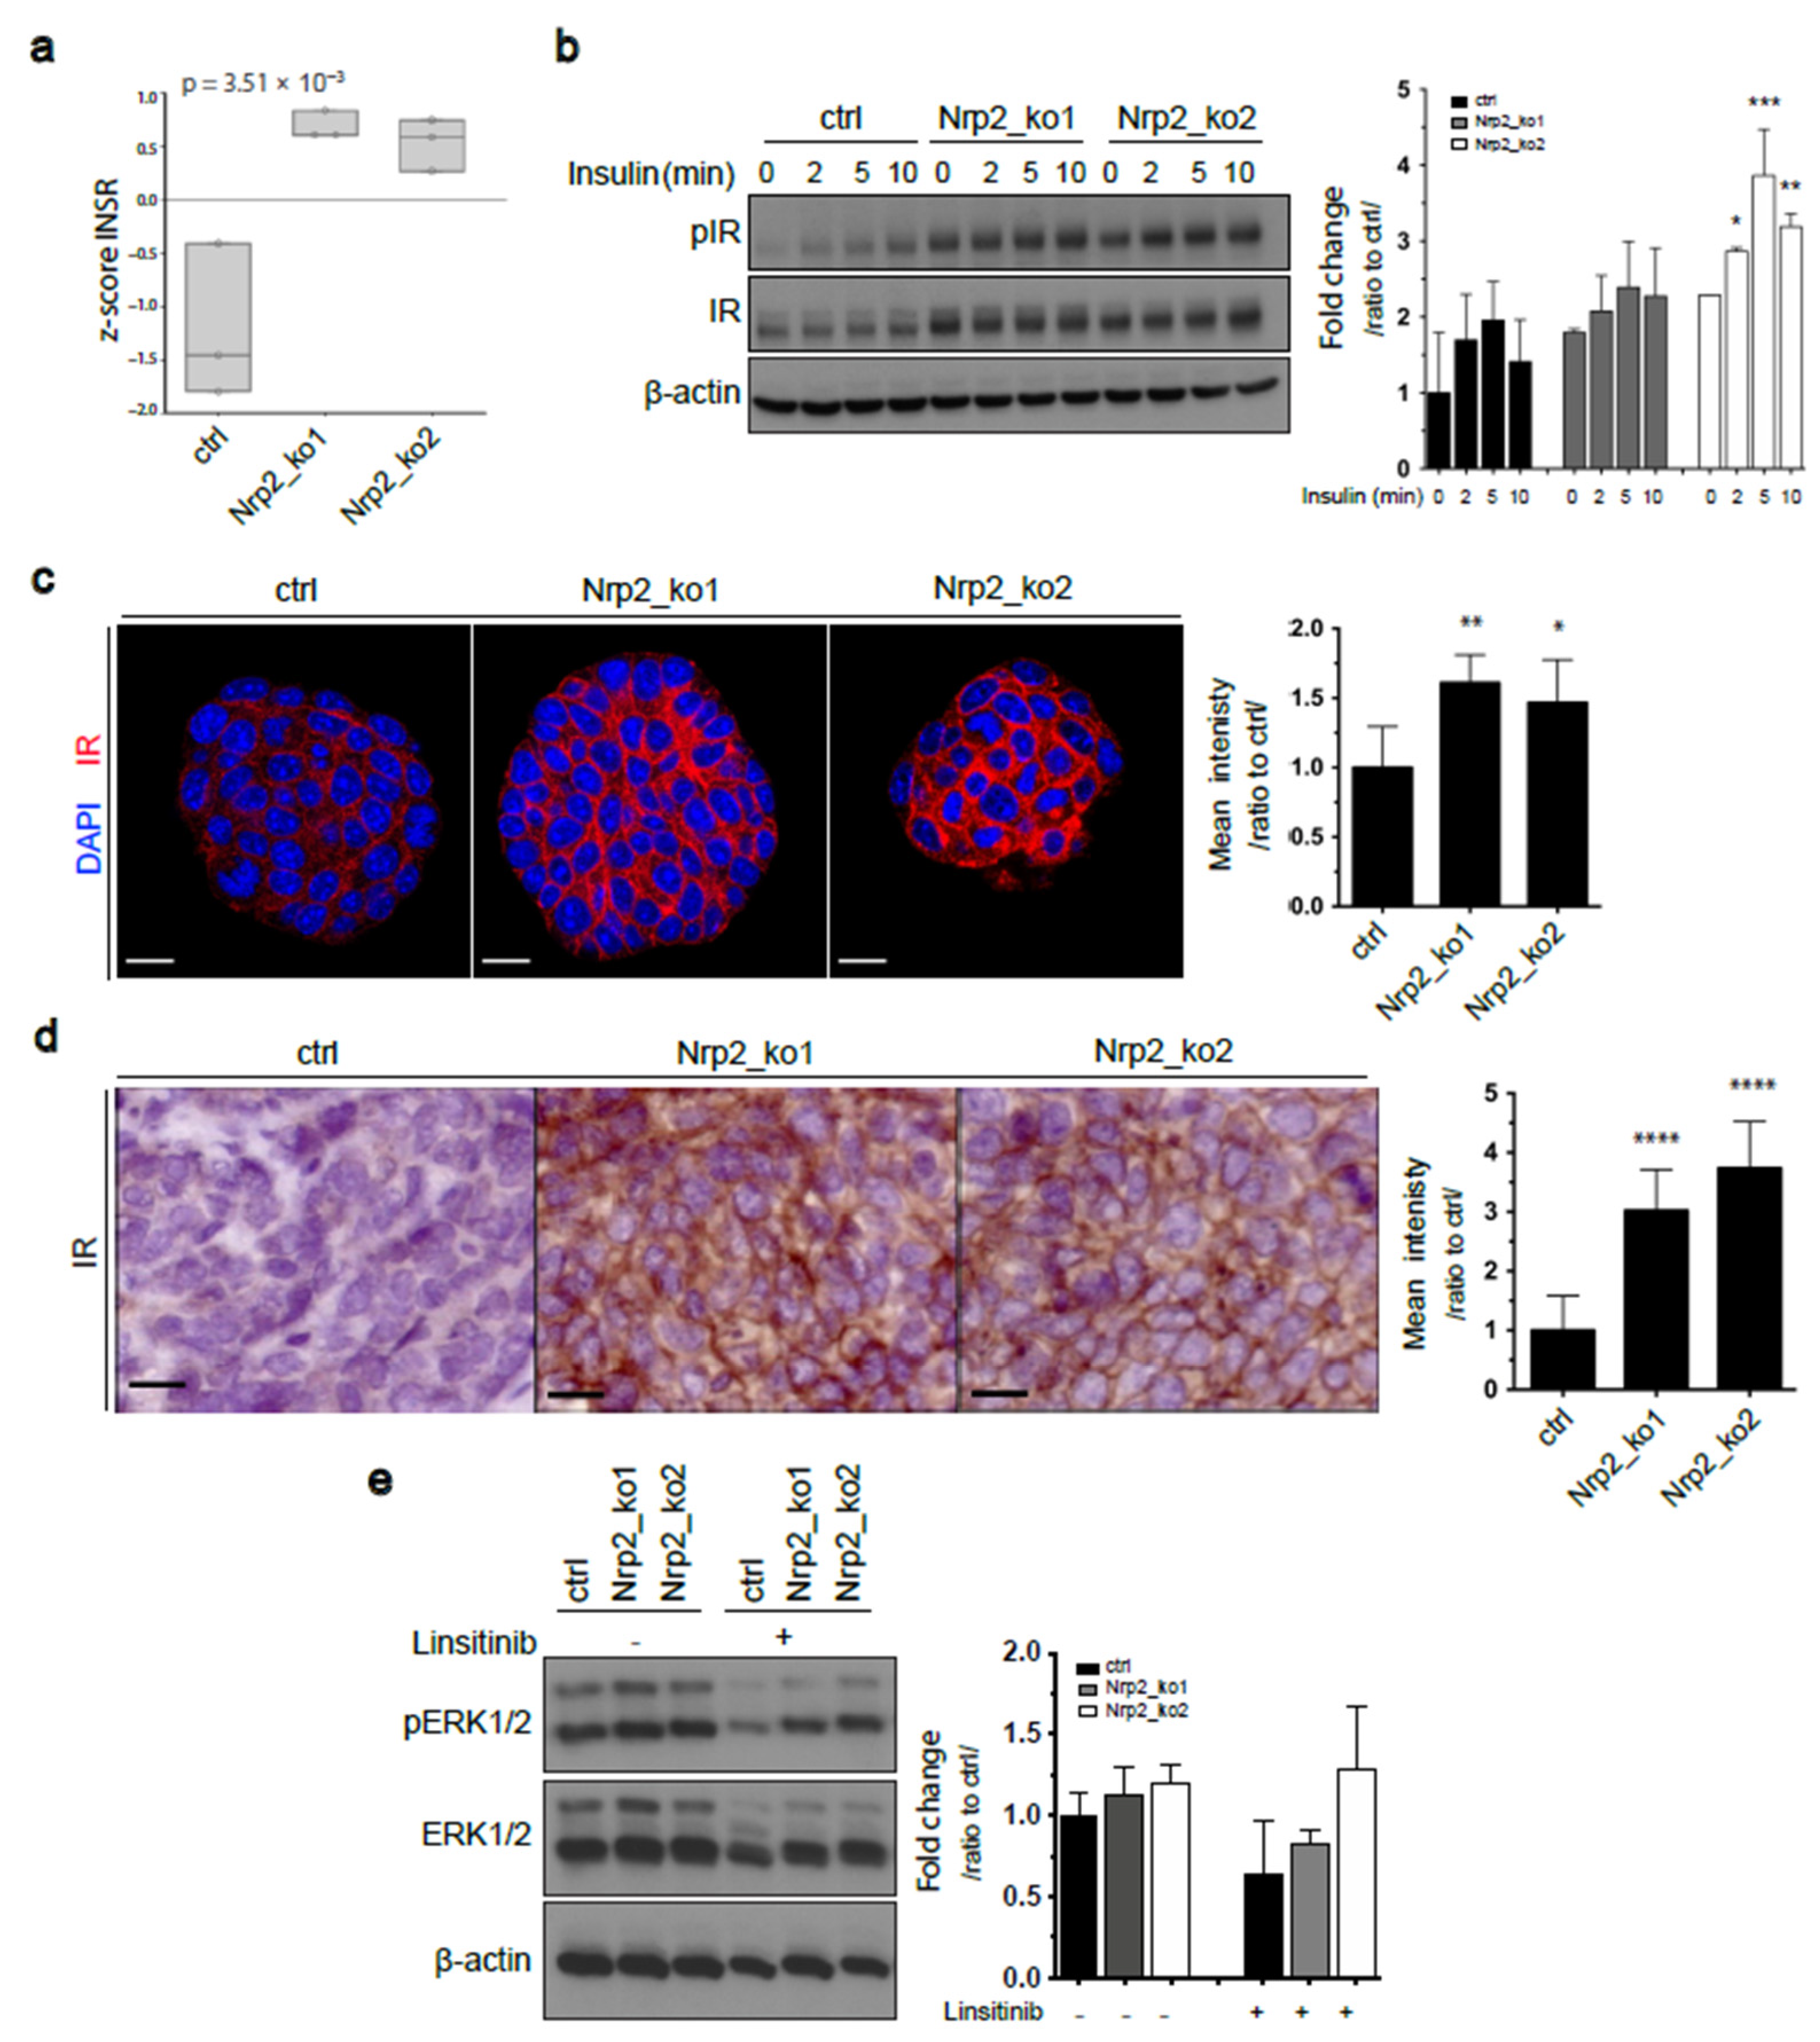
3.3. Nrp2 Knockout in Mouse CRC Organoids Induces Insulin Receptor Signaling Upregulation
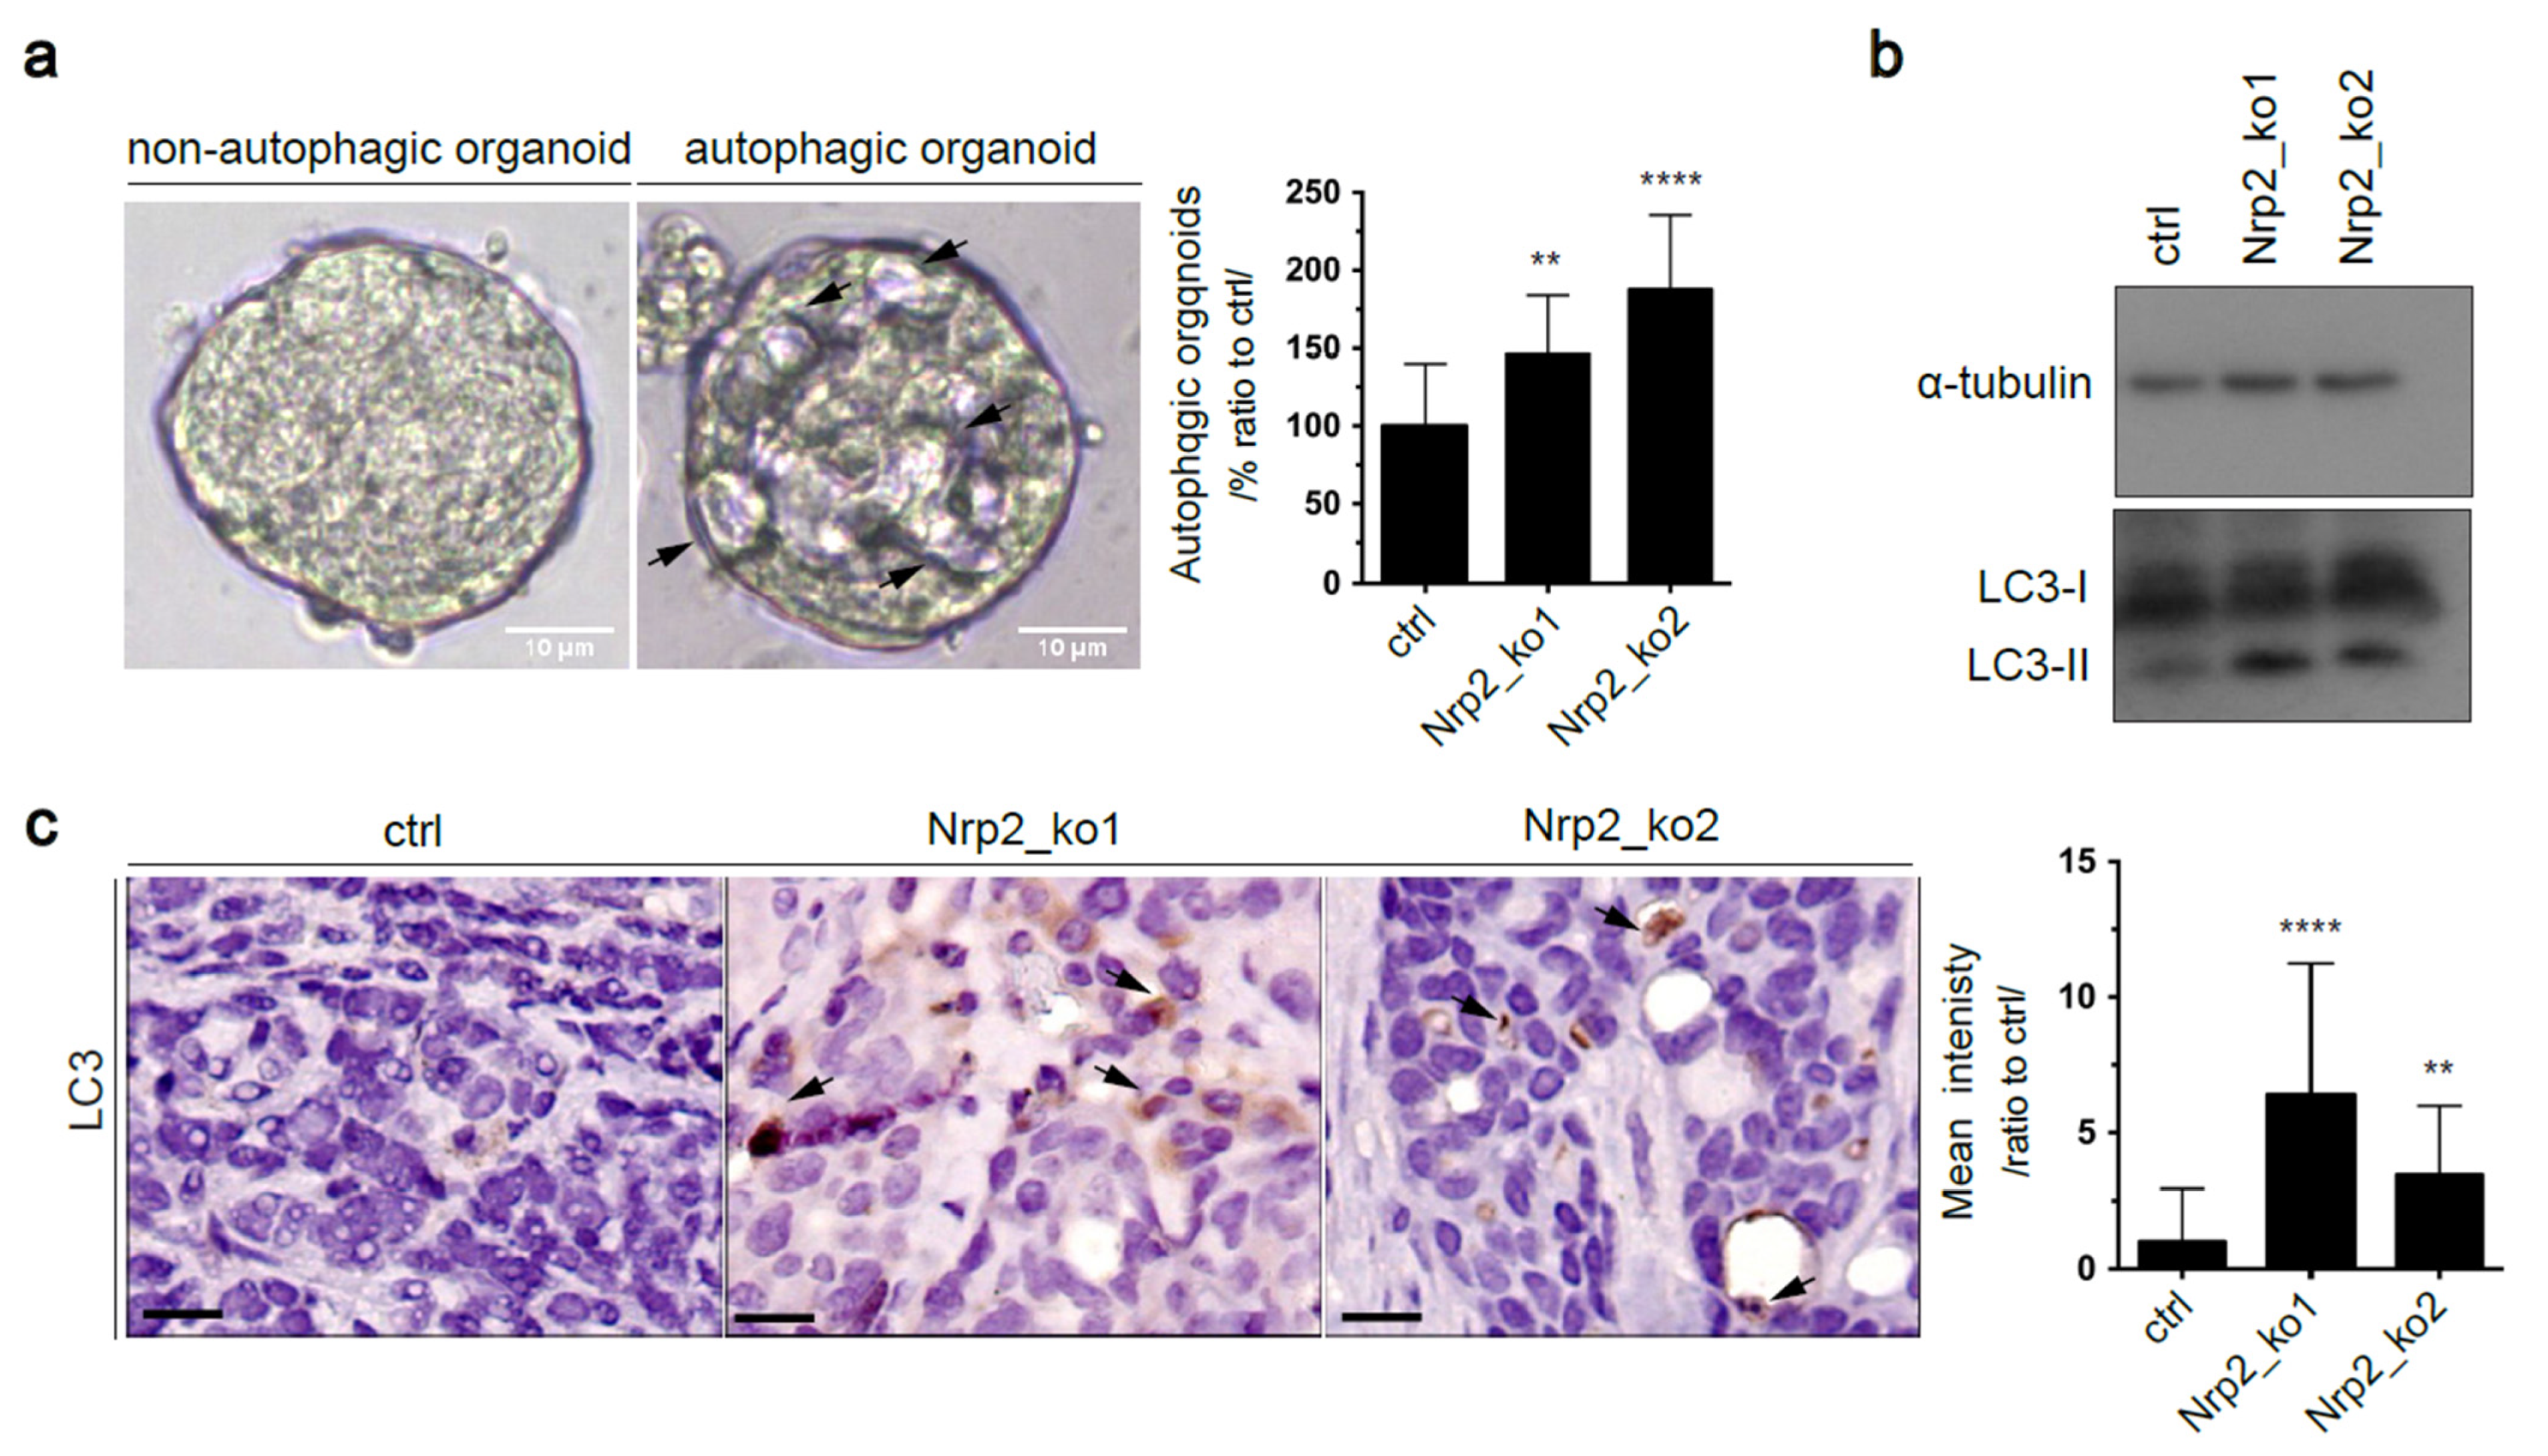
3.4. Nrp2 Depletion in Mouse CRC Organoids Activates Autophagy
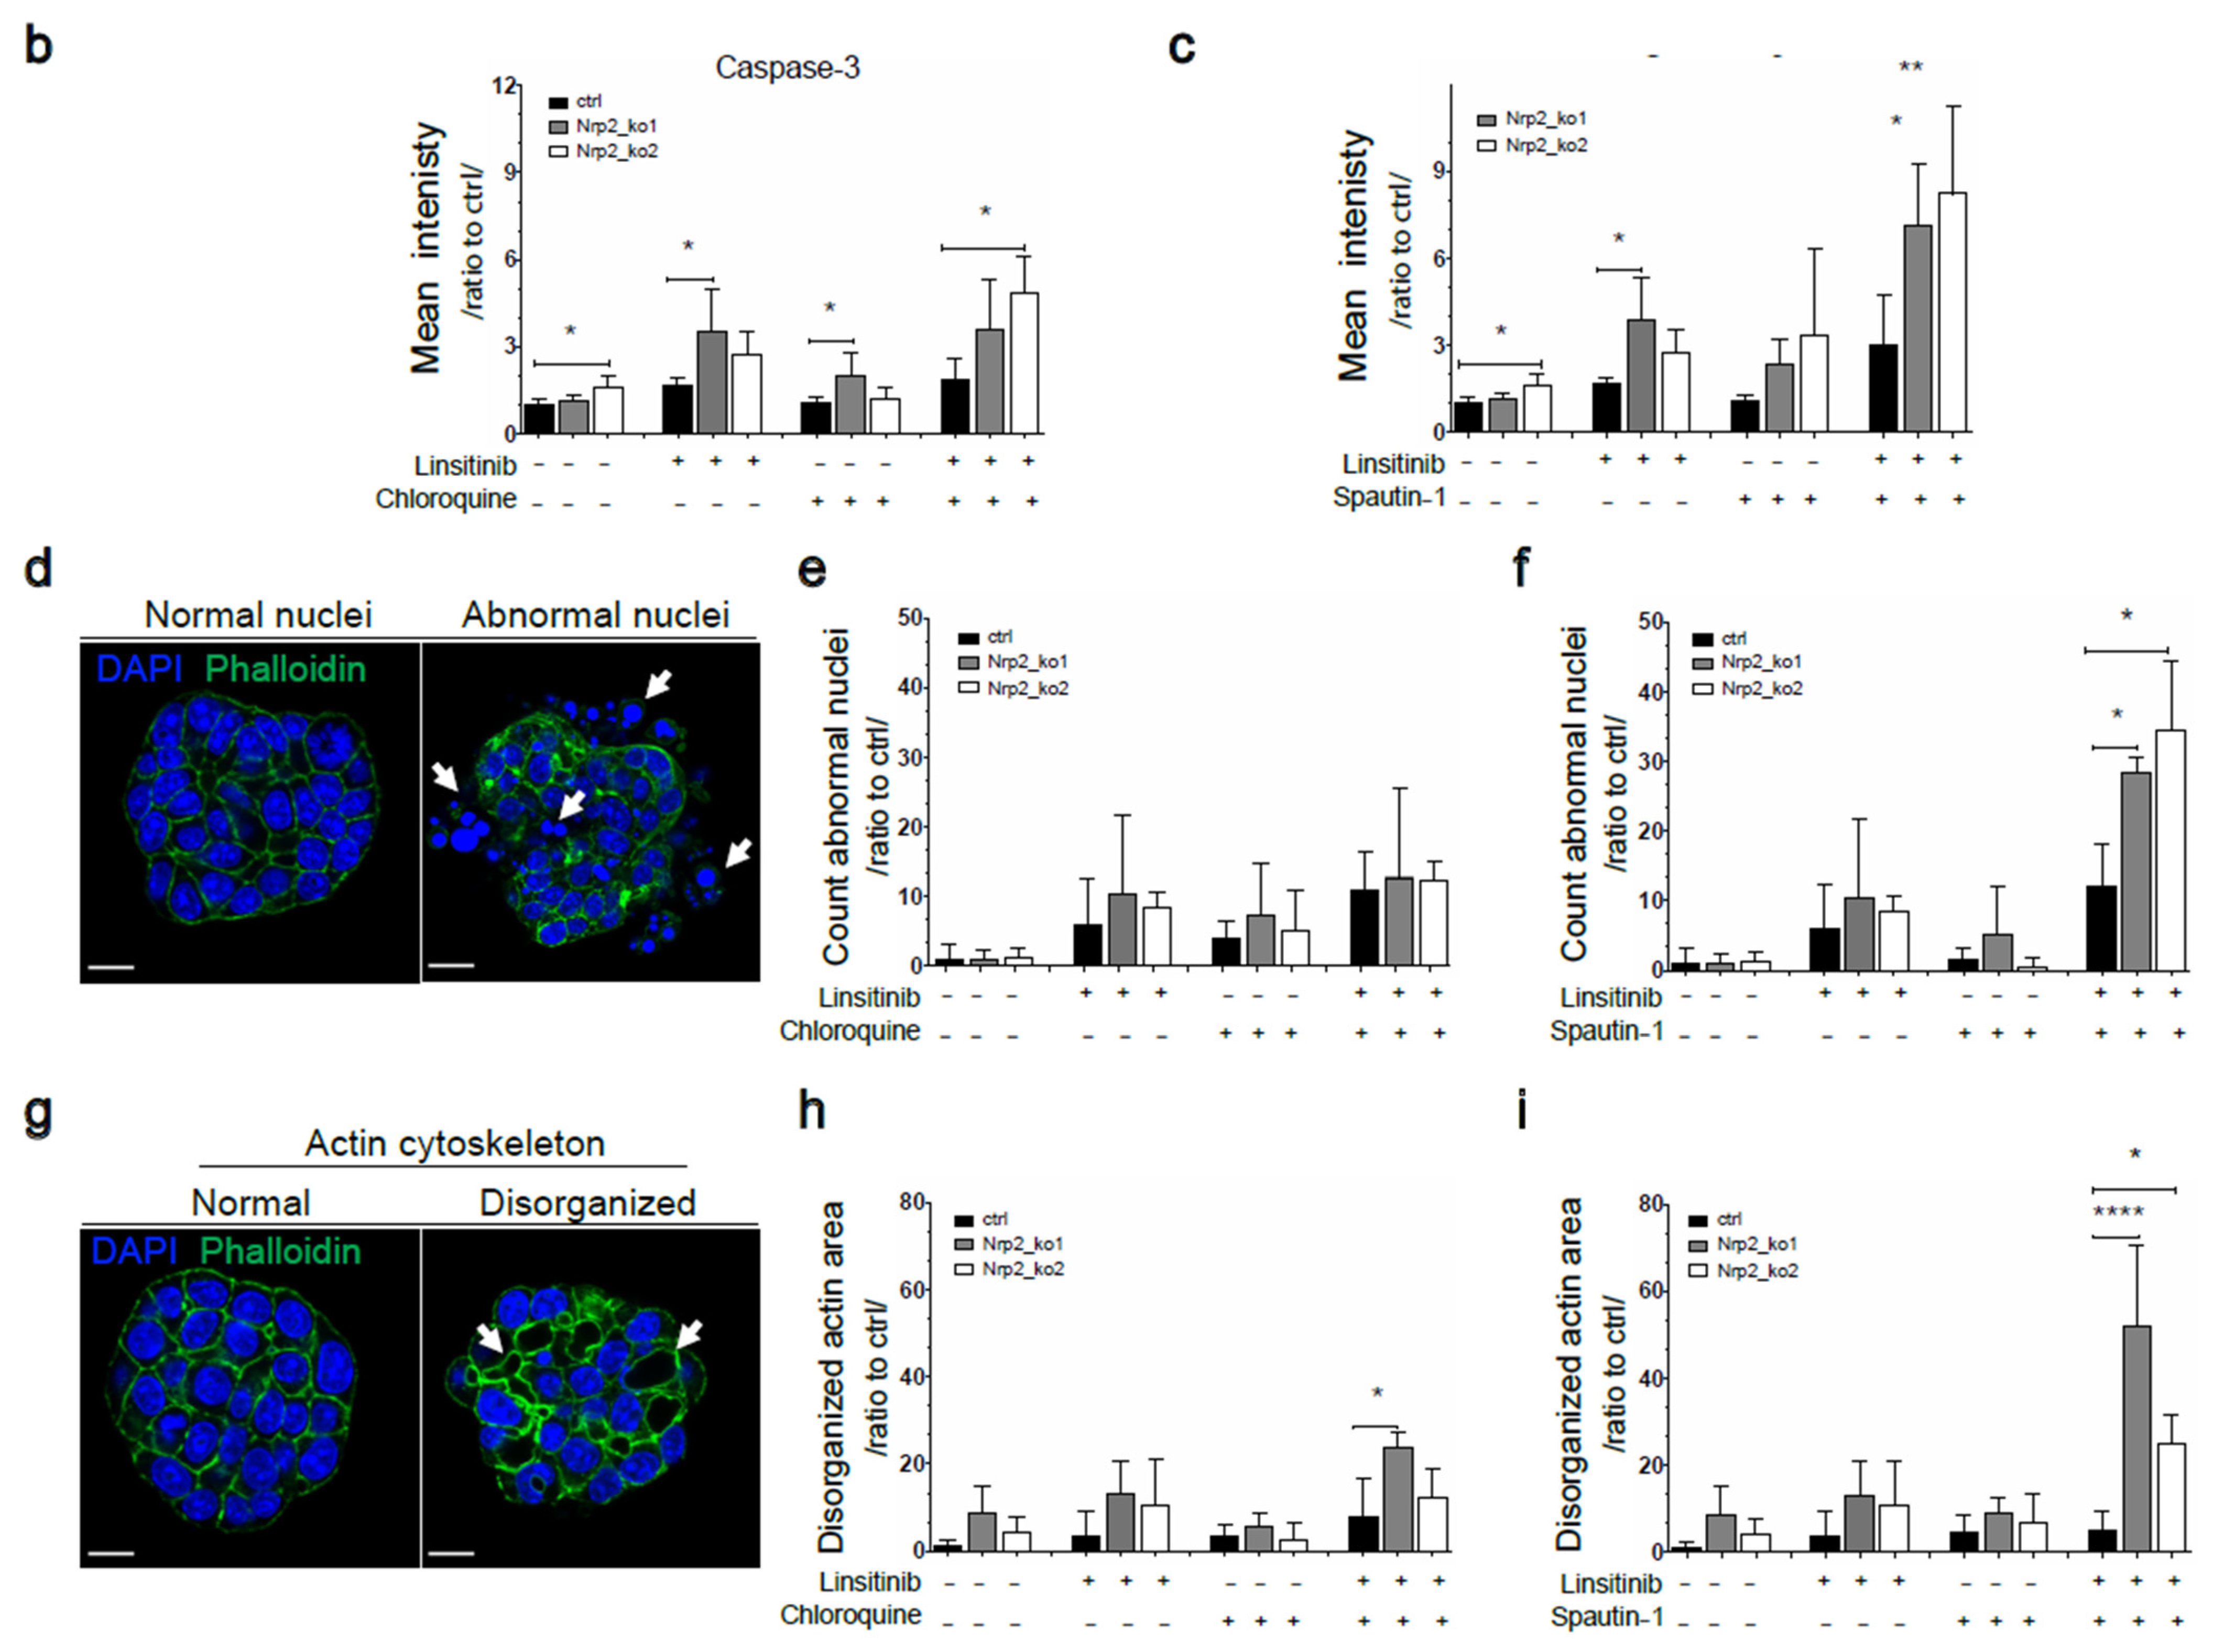
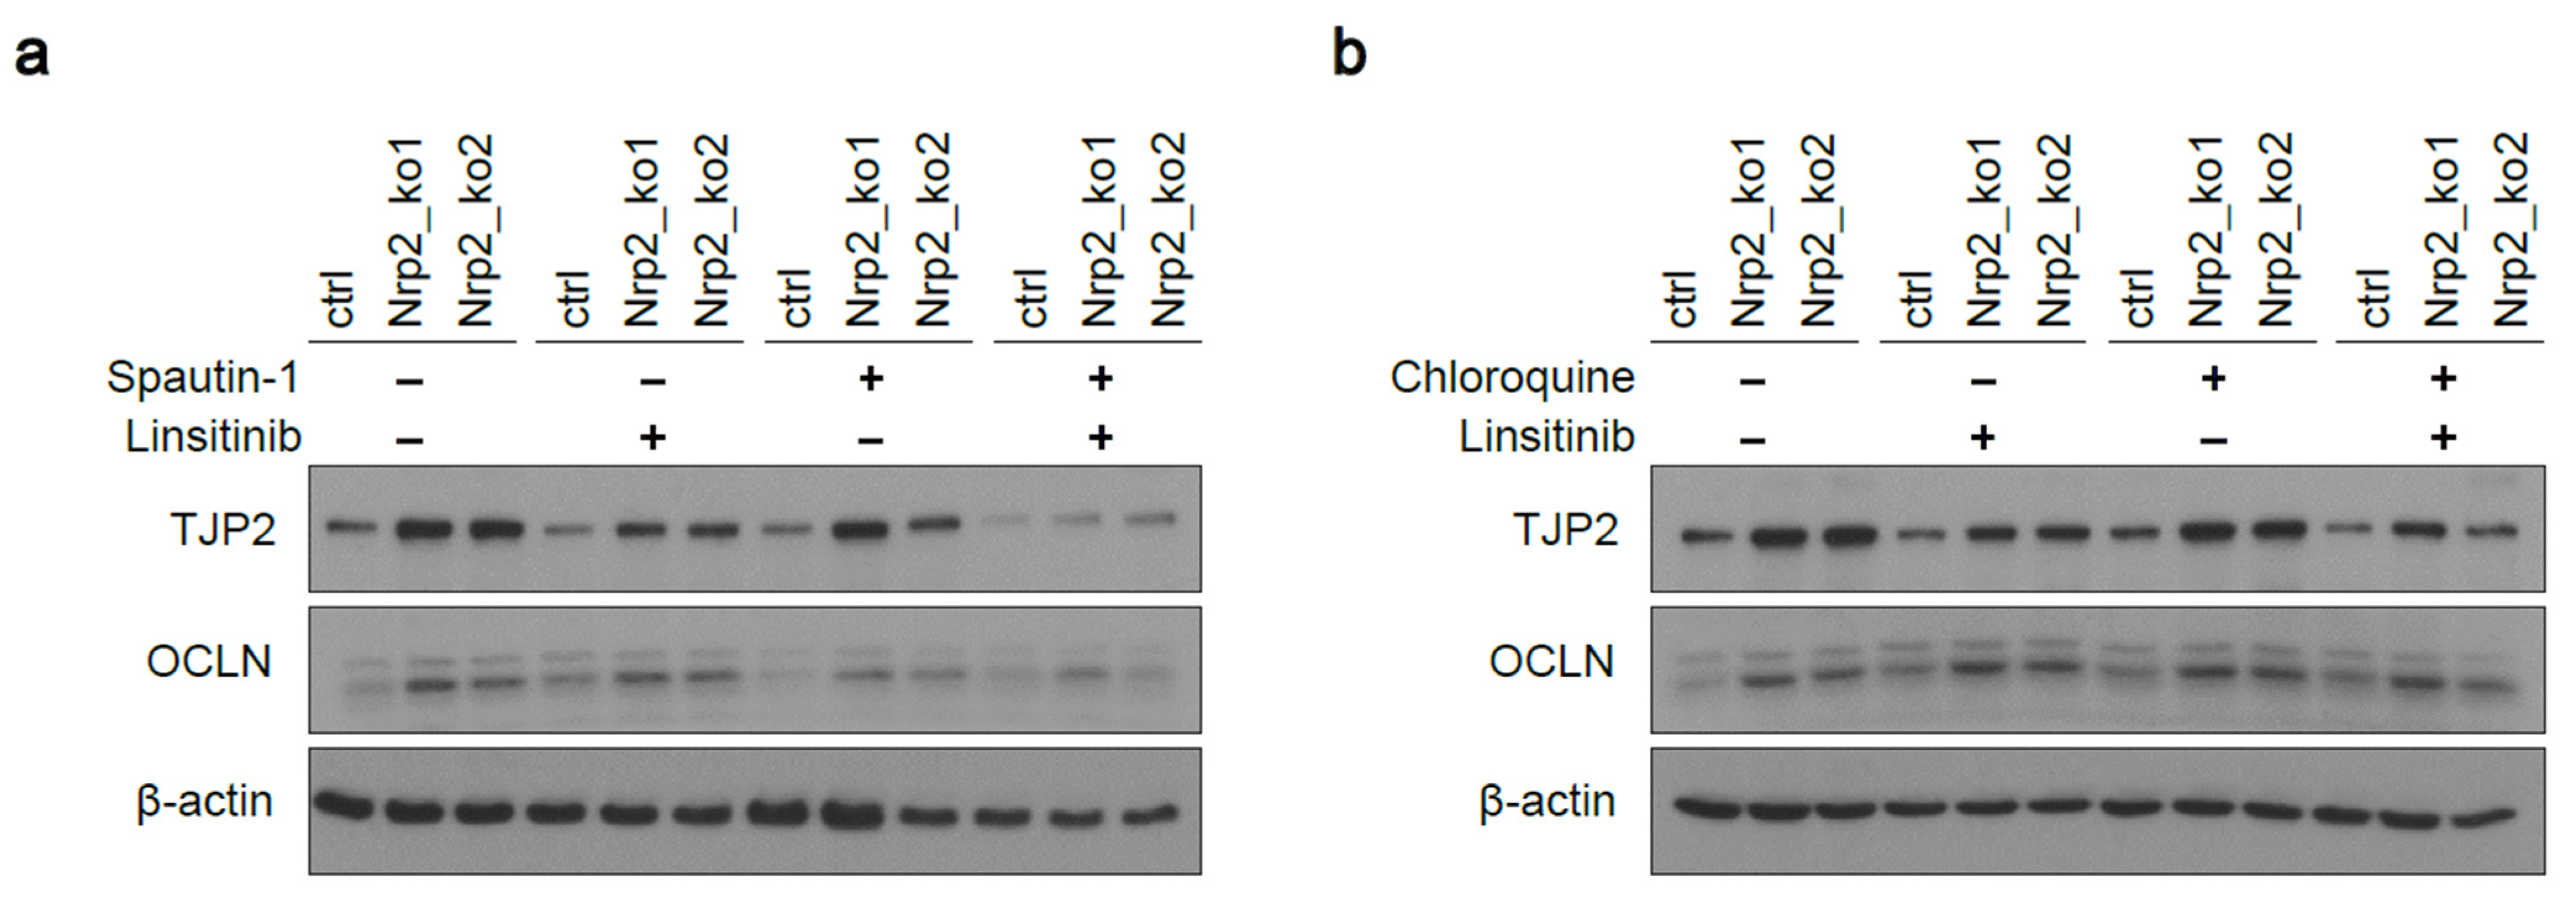
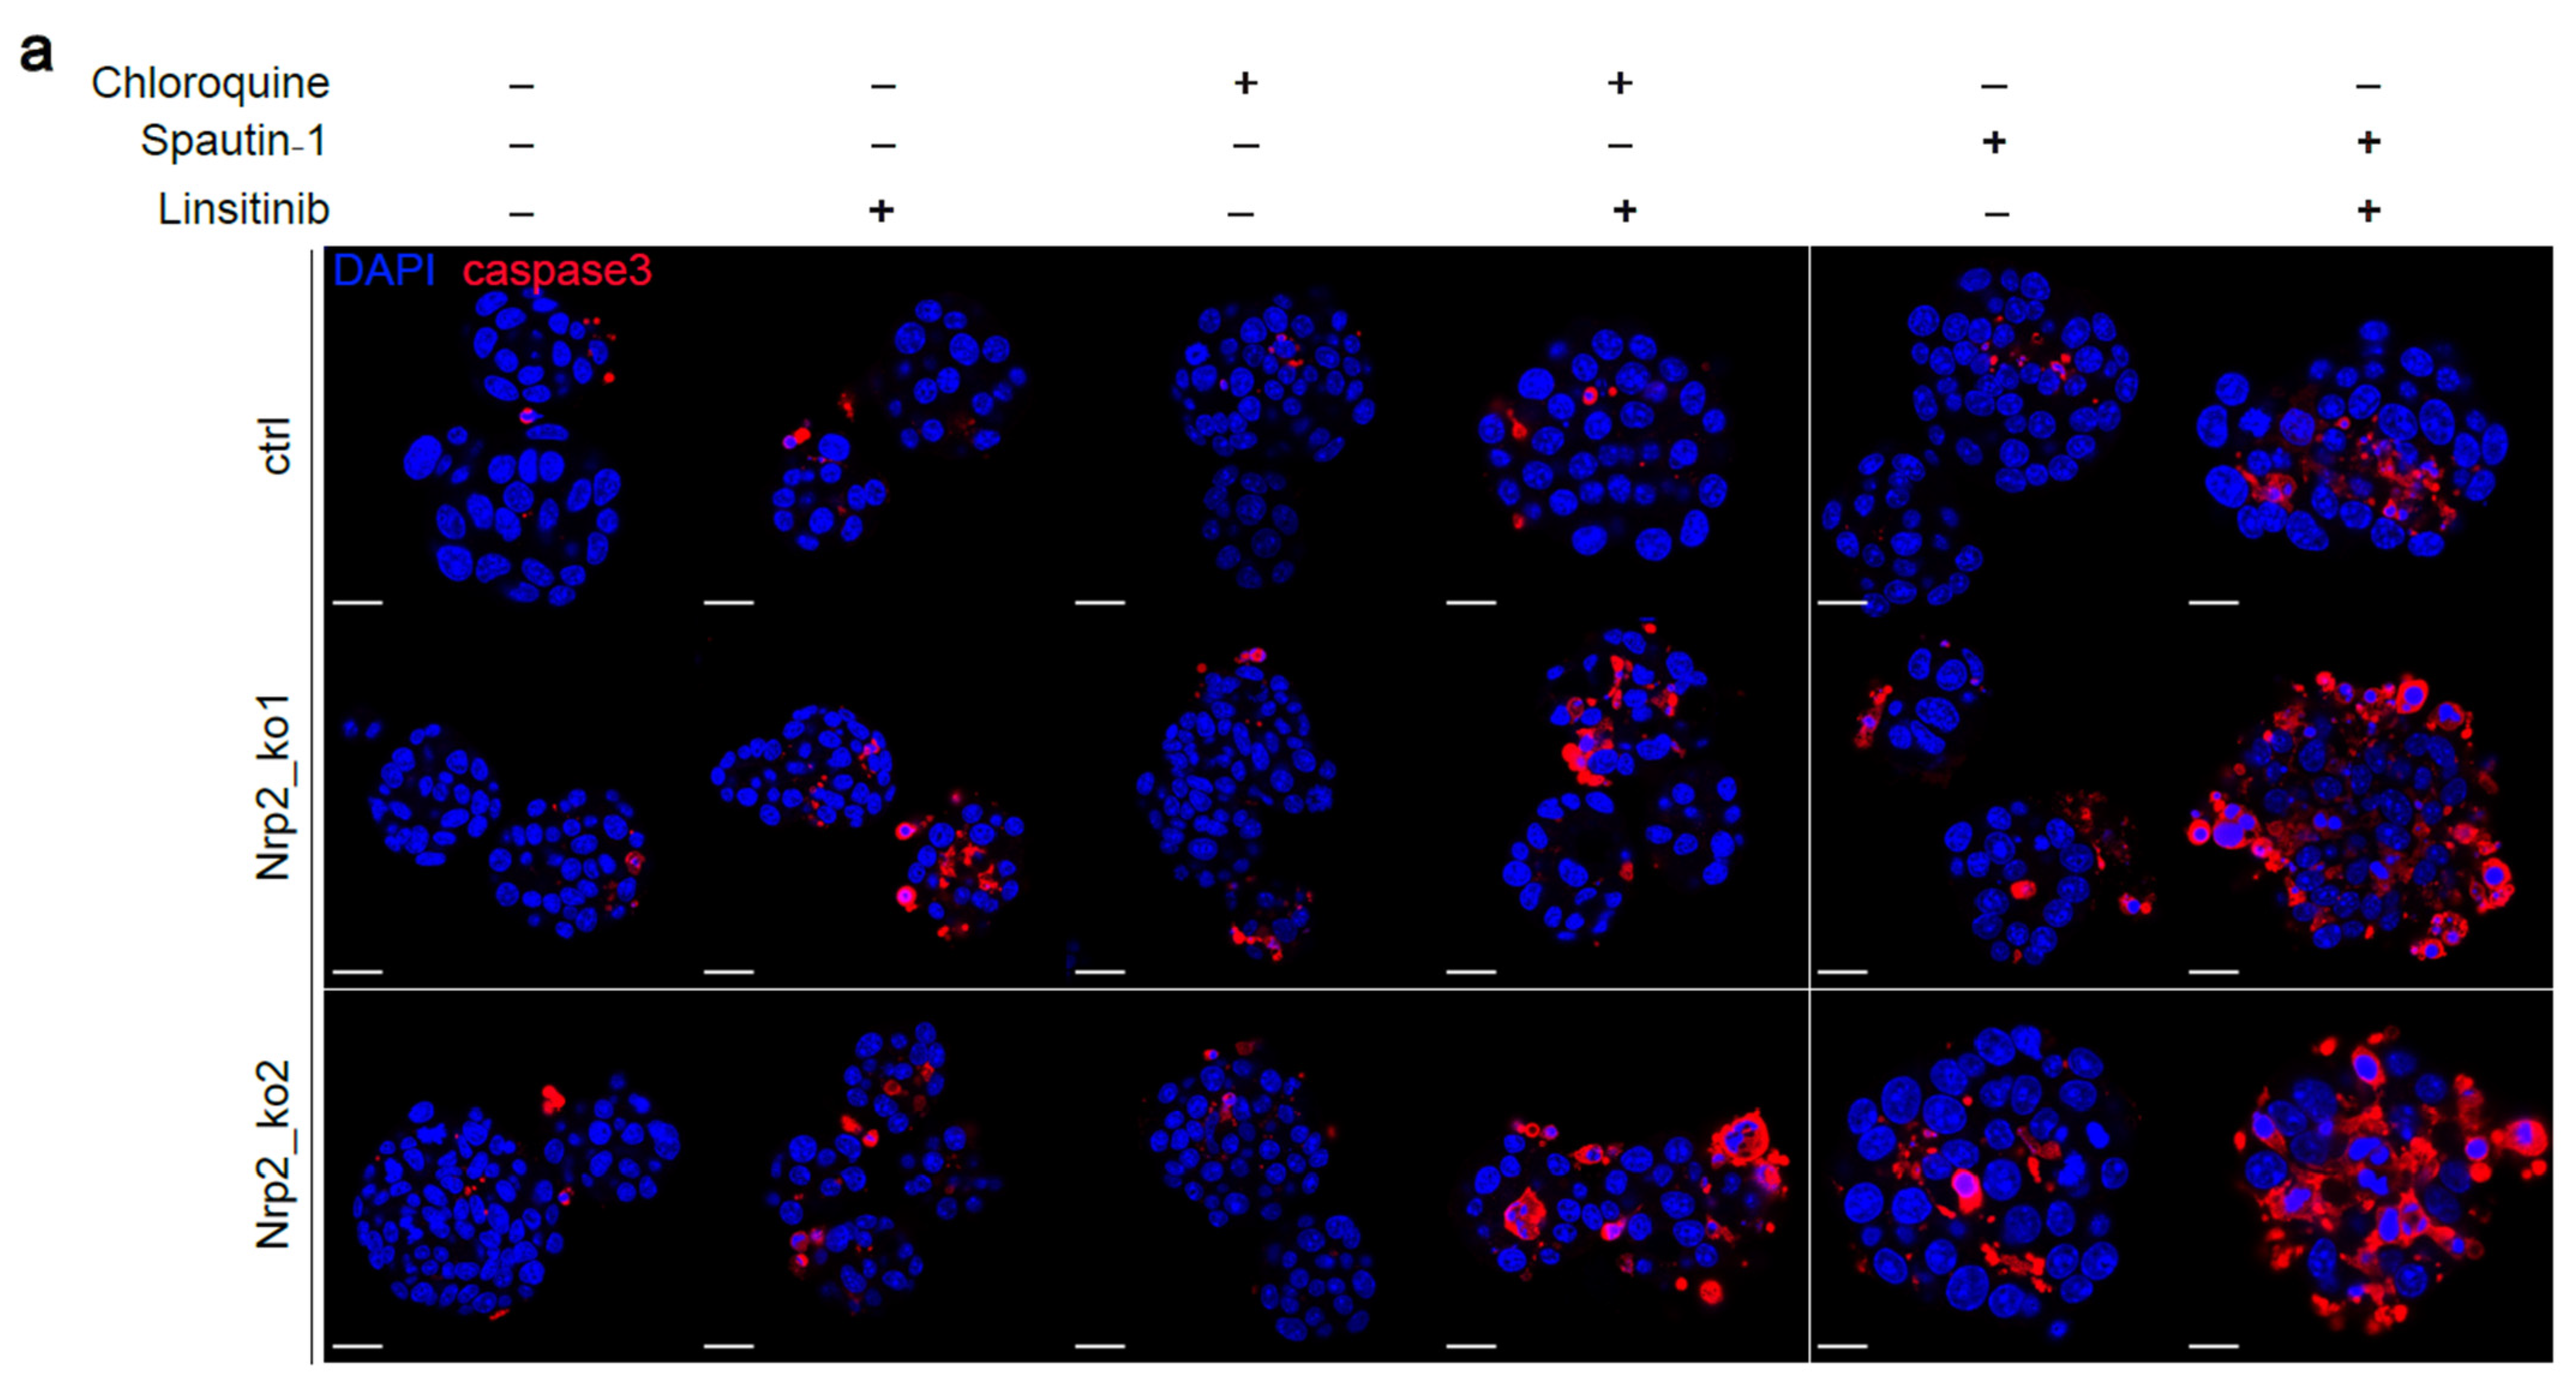
3.5. Combined Inhibition of IR Signaling and Early Autophagy Reduces Nrp2−/− CRC Organoid Viability
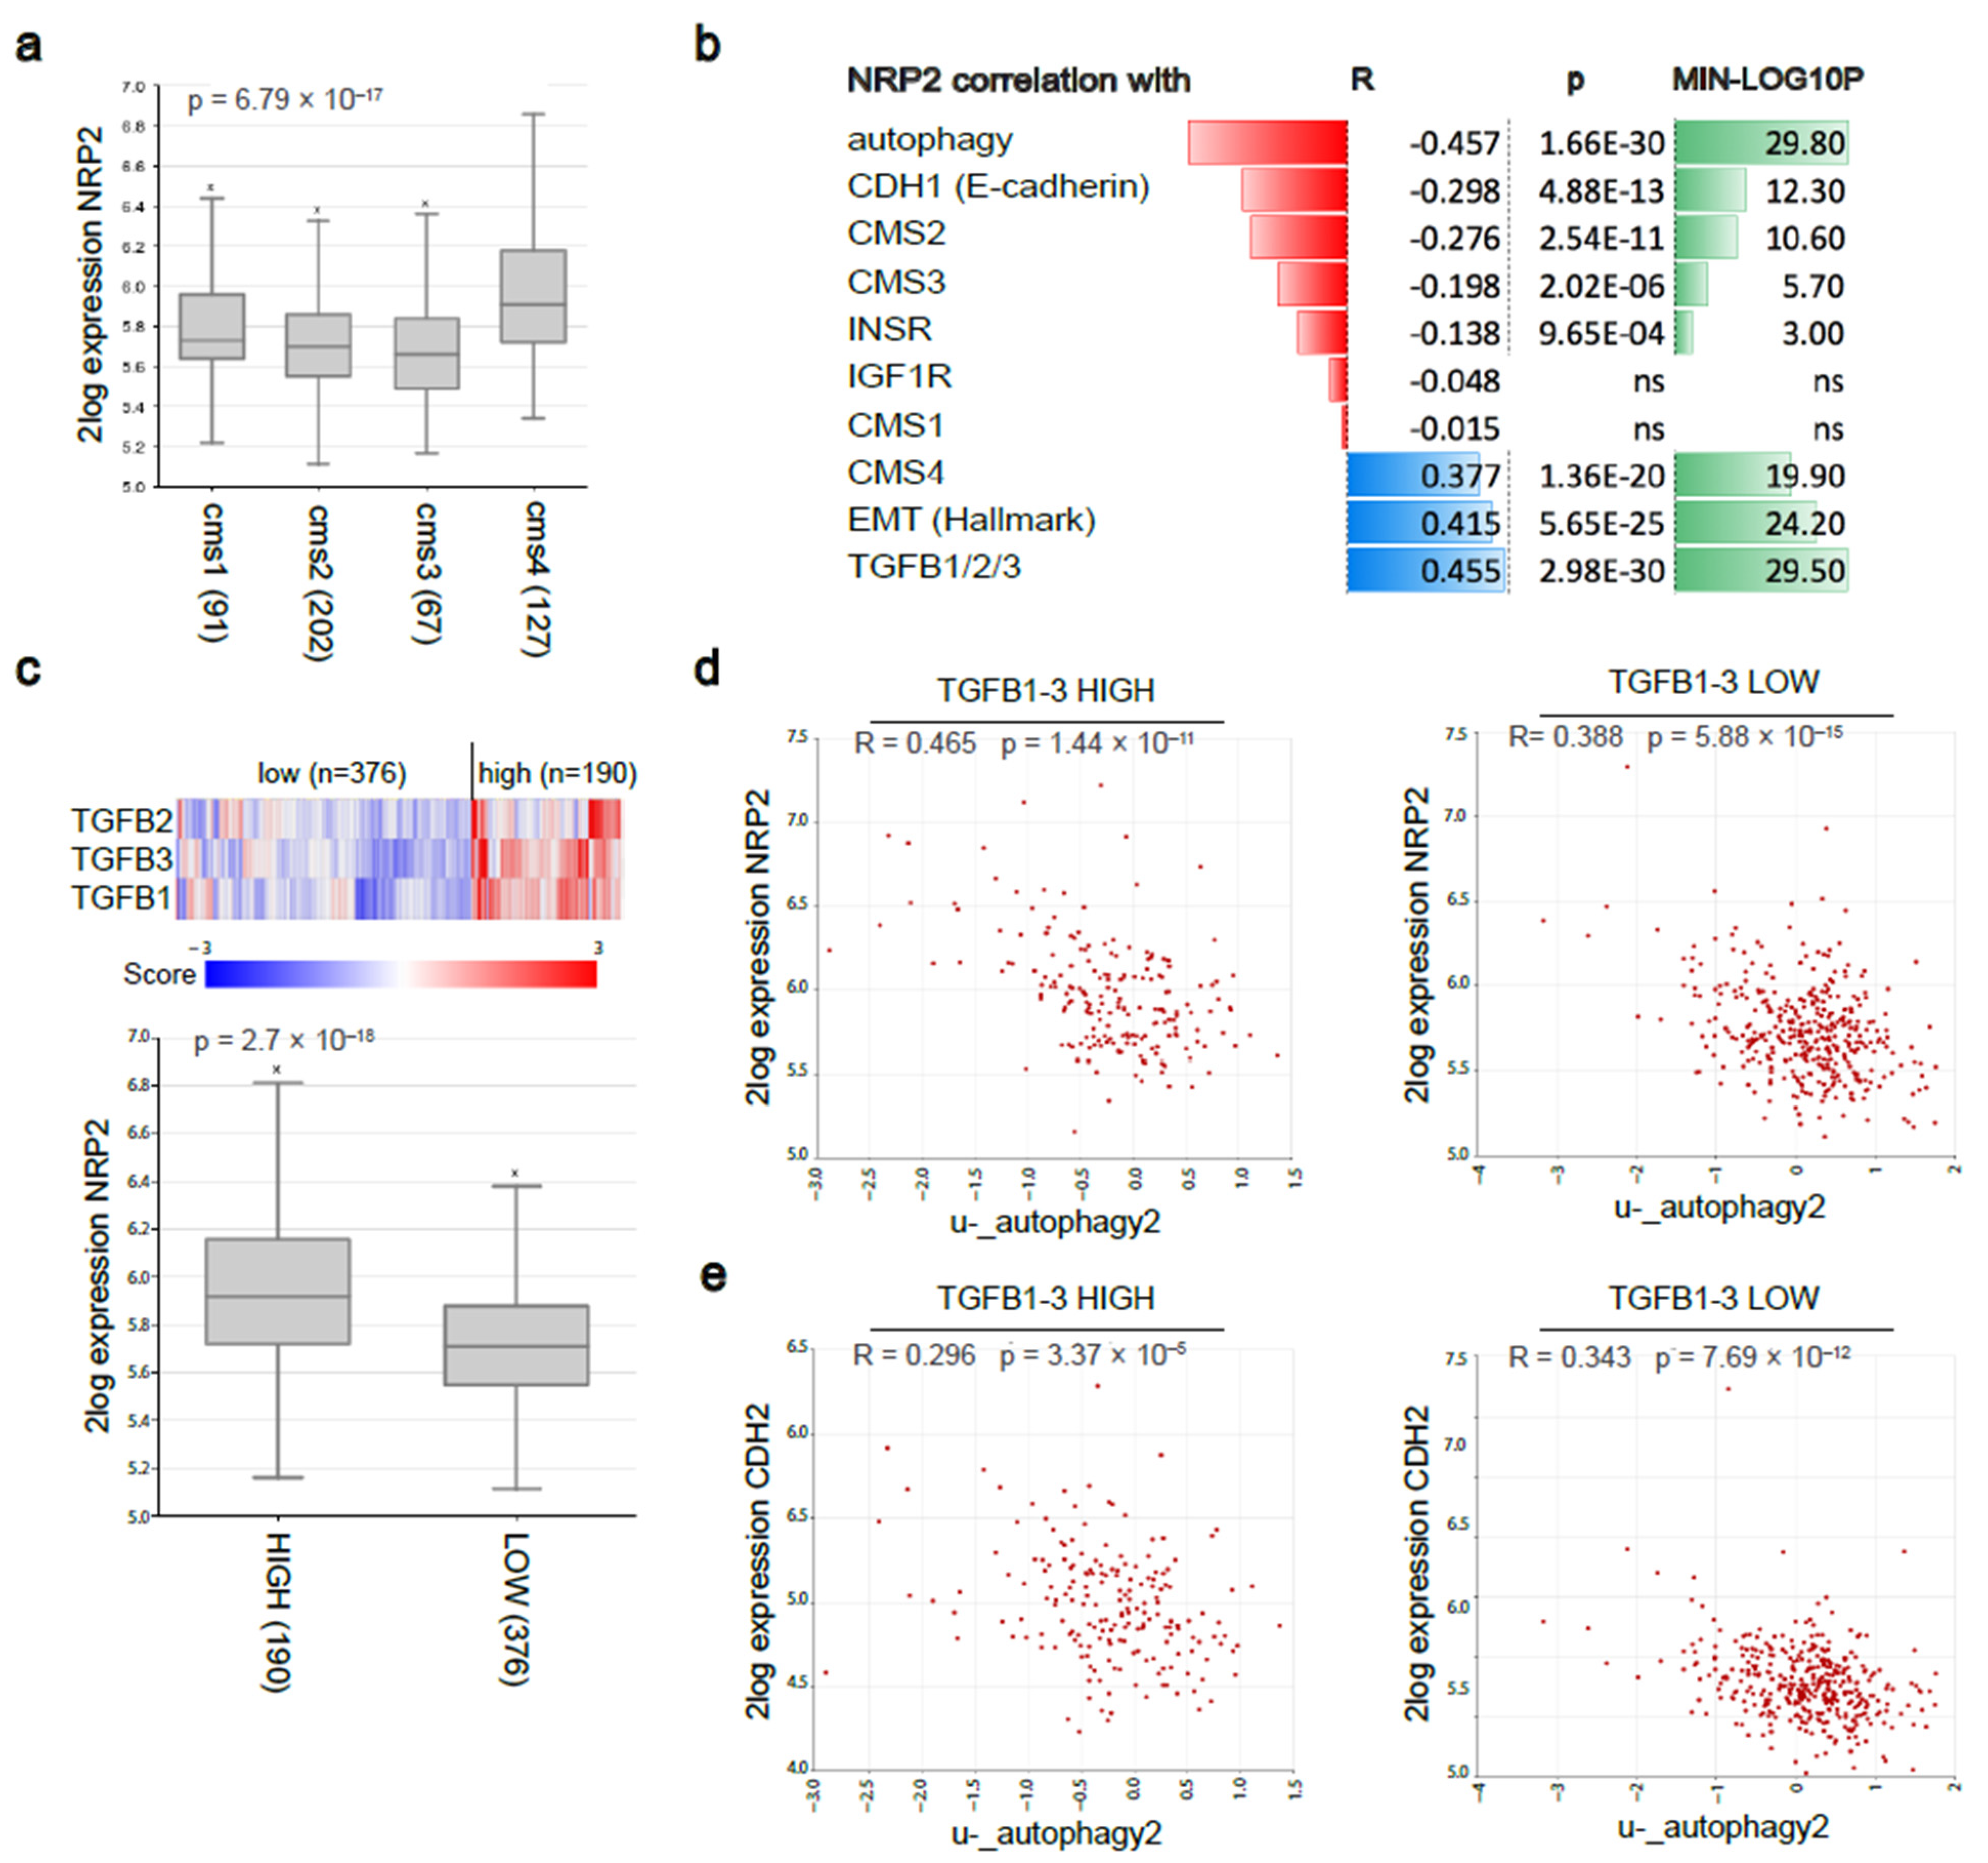
3.6. Nrp2 Expression Is Associated with a Mesenchymal Molecular Subtype of Human CRC and Inversely Correlated with Autophagy Marker Expression
4. Discussion
5. Conclusions
Supplementary Materials
Author Contributions
Funding
Institutional Review Board Statement
Informed Consent Statement
Data Availability Statement
Acknowledgments
Conflicts of Interest
References
- Engstrand, J.; Nilsson, H.; Strömberg, C.; Jonas, E.; Freedman, J. Colorectal cancer liver metastases—A population-based study on incidence, management and survival. BMC Cancer 2018, 18, 78. [Google Scholar] [CrossRef] [PubMed]
- Ruers, T.J.; Hagendoorn, J. Treatment dilemmas in patients with synchronous colorectal liver metastases. Early Gastrointest. Cancers 2012, 196, 37–49. [Google Scholar] [CrossRef]
- Martin, J.; Petrillo, A.; Smyth, E.C.; Shaida, N.; Khwaja, S.; Cheow, H.K.; Duckworth, A.; Heister, P.; Praseedom, R.; Jah, A.; et al. Colorectal liver metastases: Current management and future perspectives. World J. Clin. Oncol. 2020, 11, 761–808. [Google Scholar] [CrossRef] [PubMed]
- Hackl, C.; Neumann, P.; Gerken, M.; Loss, M.; Klinkhammer-Schalke, M.; Schlitt, H.J. Treatment of colorectal liver metastases in Germany: A ten-year population-based analysis of 5772 cases of primary colorectal adenocarcinoma. BMC Cancer 2014, 14, 810. [Google Scholar] [CrossRef] [Green Version]
- Guinney, J.; Dienstmann, R.; Wang, X.; de Reyniès, A.; Schlicker, A.; Soneson, C.; Marisa, L.; Roepman, P.; Nyamundanda, G.; Angelino, P.; et al. The consensus molecular subtypes of colorectal cancer. Nat. Med. 2015, 21, 1350–1356. [Google Scholar] [CrossRef]
- Vellinga, T.T.; Kranenburg, O.; Frenkel, N.; Ubink, I.; Marvin, D.; Govaert, K.; van Schelven, S.; Hagendoorn, J.; Borel Rinkes, I.H. Lymphangiogenic Gene Expression Is Associated With Lymph Node Recurrence and Poor Prognosis After Partial Hepatectomy for Colorectal Liver Metastasis. Ann. Surg. 2017, 266, 765–771. [Google Scholar] [CrossRef]
- Alitalo, A.; Detmar, M. Interaction of tumor cells and lymphatic vessels in cancer progression. Oncogene 2012, 31, 4499–4508. [Google Scholar] [CrossRef] [Green Version]
- Ou, J.-J.; Wei, X.; Peng, Y.; Zha, L.; Zhou, R.-B.; Shi, H.; Zhou, Q.; Liang, H.-J. Neuropilin-2 mediates lymphangiogenesis of colorectal carcinoma via a VEGFC/VEGFR3 independent signaling. Cancer Lett. 2015, 358, 200–209. [Google Scholar] [CrossRef]
- Stacker, S.A.; Achen, M.G.; Jussila, L.; Baldwin, M.E.; Alitalo, K. Lymphangiogenesis and cancer metastasis. Nat. Rev. Cancer 2002, 2, 573–583. [Google Scholar] [CrossRef]
- Stacker, S.A.; Baldwin, M.E.; Achen, M.G. The role of tumor lymphangiogenesis in metastatic spread. FASEB J. 2002, 16, 922–934. [Google Scholar] [CrossRef]
- Caunt, M.; Mak, J.; Liang, W.-C.; Stawicki, S.; Pan, Q.; Tong, R.K.; Kowalski, J.; Ho, C.; Reslan, H.B.; Ross, J.; et al. Blocking Neuropilin-2 Function Inhibits Tumor Cell Metastasis. Cancer Cell 2008, 13, 331–342. [Google Scholar] [CrossRef] [PubMed] [Green Version]
- Yuan, L.; Moyon, D.; Pardanaud, L.; Bréant, C.; Karkkainen, M.J.; Alitalo, K.; Eichmann, A. Abnormal lymphatic vessel development in neuropilin 2 mutant mice. Development 2002, 129, 4797–4806. [Google Scholar] [CrossRef] [PubMed]
- Staton, C.A.; Kumar, I.; Reed, M.W.R.; Brown, N.J. Neuropilins in physiological and pathological angiogenesis. J. Pathol. 2007, 212, 237–248. [Google Scholar] [CrossRef] [PubMed]
- Wang, J.; Huang, Y.; Zhang, J.; Xing, B.; Xuan, W.; Wang, H.; Huang, H.; Yang, J.; Tang, J. NRP-2 in tumor lymphangiogenesis and lymphatic metastasis. Cancer Lett. 2018, 418, 176–184. [Google Scholar] [CrossRef]
- Bagri, A.; Tessier-Lavigne, M.; Watts, R.J. Neuropilins in Tumor Biology. Clin. Cancer Res. 2009, 15, 1860–1864. [Google Scholar] [CrossRef] [Green Version]
- Yasuoka, H.; Kodama, R.; Tsujimoto, M.; Yoshidome, K.; Akamatsu, H.; Nakahara, M.; Inagaki, M.; Sanke, T.; Nakamura, Y. Neuropilin-2 expression in breast cancer: Correlation with lymph node metastasis, poor prognosis, and regulation of CXCR4 expression. BMC Cancer 2009, 9, 220. [Google Scholar] [CrossRef] [Green Version]
- Fritz, W.A.; Lin, T.M.; Cardiff, R.D.; Peterson, R.E. The aryl hydrocarbon receptor inhibits prostate carcinogenesis in TRAMP mice. Carcinogenesis 2006, 28, 497–505. [Google Scholar] [CrossRef] [Green Version]
- Goel, H.L.; Chang, C.; Pursell, B.; Leav, I.; Lyle, S.; Xi, H.S.; Hsieh, C.-C.; Adisetiyo, H.; Roy-Burman, P.; Coleman, I.M.; et al. VEGF/Neuropilin-2 Regulation of Bmi-1 and Consequent Repression of IGF-IR Define a Novel Mechanism of Aggressive Prostate Cancer. Cancer Discov. 2012, 2, 906–921. [Google Scholar] [CrossRef] [Green Version]
- Uniewicz, K.A.; Fernig, D.G. Neuropilins: A versatile partner of extracellular molecules that regulate development and disease. Front. Biosci. J. Virtual Libr. 2008, 13, 4339–4360. [Google Scholar] [CrossRef] [Green Version]
- Futamura, M.; Kamino, H.; Miyamoto, Y.; Kitamura, N.; Nakamura, Y.; Ohnishi, S.; Masuda, Y.; Arakawa, H. Possible Role of Semaphorin 3F, a Candidate Tumor Suppressor Gene at 3p21.3, in p53-Regulated Tumor Angiogenesis Suppression. Cancer Res. 2007, 67, 1451–1460. [Google Scholar] [CrossRef] [Green Version]
- Nguyen, H.T.T.; Grandclement, C.; Pallandre, J.R.; Valmary Degano, S.; Viel, E.; Bouard, A.; Balland, J.; Rémy-Martin, J.-P.; Simon, B.; Rouleau, A.; et al. Neuropilin-2 Expression Promotes TGF-β1-Mediated Epithelial to Mesenchymal Transition in Colorectal Cancer Cells. PLoS ONE 2011, 6, e20444. [Google Scholar] [CrossRef] [Green Version]
- Staton, C.A.; Koay, I.; Wu, J.M.; Hoh, L.; Reed, M.W.; Brown, N.J. Neuropilin-1 and neuropilin-2 expression in the adenoma-carcinoma sequence of colorectal cancer. Histopathology 2013, 62, 908–915. [Google Scholar] [CrossRef] [PubMed]
- Liu, A.; Liu, L.; Lu, H. LncRNA XIST facilitates proliferation and epithelial-mesenchymal transition of colorectal cancer cells through targeting miR-486-5p and promoting neuropilin-2. J. Cell. Physiol. 2019, 234, 13747–13761. [Google Scholar] [CrossRef] [PubMed]
- Dutta, S.; Roy, S.; Polavaram, N.S.; Stanton, M.J.; Zhang, H.; Bhola, T.; Honscheid, P.; Donohue, T.M., Jr.; Band, H.; Batra, S.K.; et al. Neuropilin-2 Regulates Endosome Maturation and EGFR Trafficking to Support Cancer Cell Pathobiology. Cancer Res. 2016, 76, 418–428. [Google Scholar] [CrossRef] [PubMed] [Green Version]
- Gray, M.J.; Van Buren, G.; Dallas, N.A.; Xia, L.; Wang, X.; Yang, A.D.; Somcio, R.J.; Lin, Y.G.; Lim, S.; Fan, F.; et al. Therapeutic Targeting of Neuropilin-2 on Colorectal Carcinoma Cells Implanted in the Murine Liver. JNCI J. Natl. Cancer Inst. 2008, 100, 109–120. [Google Scholar] [CrossRef] [PubMed] [Green Version]
- van de Wetering, M.; Francies, H.E.; Francis, J.M.; Bounova, G.; Iorio, F.; Pronk, A.; van Houdt, W.; van Gorp, J.; Taylor-Weiner, A.; Kester, L.; et al. Prospective Derivation of a Living Organoid Biobank of Colorectal Cancer Patients. Cell 2015, 161, 933–945. [Google Scholar] [CrossRef] [Green Version]
- Weeber, F.; van de Wetering, M.; Hoogstraat, M.; Dijkstra, K.K.; Krijgsman, O.; Kuilman, T.; Gadellaa-van Hooijdonk, C.G.M.; van der Velden, D.L.; Peeper, D.S.; Cuppen, E.P.J.G.; et al. Preserved genetic diversity in organoids cultured from biopsies of human colorectal cancer metastases. Proc. Natl. Acad. Sci. USA 2015, 112, 13308–13311. [Google Scholar] [CrossRef] [Green Version]
- Pauli, C.; Hopkins, B.D.; Prandi, D.; Shaw, R.; Fedrizzi, T.; Sboner, A.; Sailer, V.; Augello, M.; Puca, L.; Rosati, R.; et al. Personalized In Vitro and In Vivo Cancer Models to Guide Precision Medicine. Cancer Discov. 2017, 7, 462–477. [Google Scholar] [CrossRef] [Green Version]
- Chanrion, M.; Kuperstein, I.; Barrière, C.; El Marjou, F.; Cohen, D.; Vignjevic, D.; Stimmer, L.; Paul-Gilloteaux, P.; Bièche, I.; Tavares Sdos, R.; et al. Concomitant Notch activation and p53 deletion trigger epithelial-to-mesenchymal transition and metastasis in mouse gut. Nat. Commun. 2014, 5, 5005. [Google Scholar] [CrossRef] [Green Version]
- Sato, T.; Stange, D.E.; Ferrante, M.; Vries, R.G.; Van Es, J.H.; Van den Brink, S.; Van Houdt, W.J.; Pronk, A.; Van Gorp, J.; Siersema, P.D.; et al. Long-term expansion of epithelial organoids from human colon, adenoma, adenocarcinoma, and Barrett’s epithelium. Gastroenterology 2011, 141, 1762–1772. [Google Scholar] [CrossRef]
- Lowry, O.H.; Rosebrough, N.J.; Farr, A.L.; Randall, R.J. Protein measurement with the Folin phenol reagent. J. Biol. Chem. 1951, 193, 265–275. [Google Scholar] [CrossRef]
- Muñoz, J.; Stange, D.E.; Schepers, A.G.; van de Wetering, M.; Koo, B.-K.; Itzkovitz, S.; Volckmann, R.; Kung, K.S.; Koster, J.; Radulescu, S.; et al. The Lgr5 intestinal stem cell signature: Robust expression of proposed quiescent ‘+4’ cell markers. EMBO J. 2012, 31, 3079–3091. [Google Scholar] [CrossRef] [PubMed] [Green Version]
- Mustata, R.C.; Vasile, G.; Fernandez-Vallone, V.; Strollo, S.; Lefort, A.; Libert, F.; Monteyne, D.; Pérez-Morga, D.; Vassart, G.; Garcia, M.-I. Identification of Lgr5-Independent Spheroid-Generating Progenitors of the Mouse Fetal Intestinal Epithelium. Cell Rep. 2013, 5, 421–432. [Google Scholar] [CrossRef] [PubMed]
- Rizzolio, S.; Battistini, C.; Cagnoni, G.; Apicella, M.; Vella, V.; Giordano, S.; Tamagnone, L. Downregulating Neuropilin-2 Triggers a Novel Mechanism Enabling EGFR-Dependent Resistance to Oncogene-Targeted Therapies. Cancer Res. 2018, 78, 1058–1068. [Google Scholar] [CrossRef] [PubMed] [Green Version]
- Russell, R.C.; Yuan, H.-X.; Guan, K.-L. Autophagy regulation by nutrient signaling. Cell Res. 2013, 24, 42–57. [Google Scholar] [CrossRef] [PubMed] [Green Version]
- Klionsky, D.J.; Emr, S.D. Autophagy as a regulated pathway of cellular degradation. Science 2000, 290, 1717–1721. [Google Scholar] [CrossRef]
- Kuma, A.; Matsui, M.; Mizushima, N. LC3, an Autophagosome Marker, Can be Incorporated into Protein Aggregates Independent of Autophagy: Caution in the Interpretation of LC3 Localization. Autophagy 2014, 3, 323–328. [Google Scholar] [CrossRef] [Green Version]
- Bampton, E.T.W.; Goemans, C.G.; Niranjan, D.; Mizushima, N.; Tolkovsky, A.M. The Dynamics of Autophagy Visualised in Live Cells: From Autophagosome Formation to Fusion with Endo/lysosomes. Autophagy 2014, 1, 23–36. [Google Scholar] [CrossRef]
- Fass, E.; Shvets, E.; Degani, I.; Hirschberg, K.; Elazar, Z. Microtubules support production of starvation-induced autophagosomes but not their targeting and fusion with lysosomes. J. Biol. Chem. 2006, 281, 36303–36316. [Google Scholar] [CrossRef] [Green Version]
- Heymann, D.; Schott, C.R.; Ludwig, L.; Mutsaers, A.J.; Foster, R.A.; Wood, G.A. The autophagy inhibitor spautin-1, either alone or combined with doxorubicin, decreases cell survival and colony formation in canine appendicular osteosarcoma cells. PLoS ONE 2018, 13, e0206427. [Google Scholar] [CrossRef]
- Sun, X.; Momen, A.; Wu, J.; Noyan, H.; Li, R.; von Harsdorf, R.; Husain, M. p27 protein protects metabolically stressed cardiomyocytes from apoptosis by promoting autophagy. J. Biol. Chem. 2014, 289, 16924–16935. [Google Scholar] [CrossRef] [PubMed] [Green Version]
- Zhang, X.J.; Chen, S.; Huang, K.X.; Le, W.D. Why should autophagic flux be assessed? Acta Pharmacol. Sin. 2013, 34, 595–599. [Google Scholar] [CrossRef] [PubMed] [Green Version]
- Mizushima, N.; Yoshimori, T. How to Interpret LC3 Immunoblotting. Autophagy 2014, 3, 542–545. [Google Scholar] [CrossRef] [PubMed]
- Rogalińska, M. Alterations in cell nuclei during apoptosis. Cell. Mol. Biol. Lett. 2002, 7, 995–1018. [Google Scholar]
- Desouza, M.; Gunning, P.W.; Stehn, J.R. The actin cytoskeleton as a sensor and mediator of apoptosis. BioArchitecture 2014, 2, 75–87. [Google Scholar] [CrossRef] [Green Version]
- Frendo-Cumbo, S.; Tokarz, V.L.; Bilan, P.J.; Brumell, J.H.; Klip, A. Communication Between Autophagy and Insulin Action: At the Crux of Insulin Action-Insulin Resistance? Front. Cell Dev. Biol. 2021, 9, 708431. [Google Scholar] [CrossRef]
- Xu, H.; Lee, M.-S.; Tsai, P.-Y.; Adler, A.S.; Curry, N.L.; Challa, S.; Freinkman, E.; Hitchcock, D.S.; Copps, K.D.; White, M.F.; et al. Ablation of insulin receptor substrates 1 and 2 suppresses Kras-driven lung tumorigenesis. Proc. Natl. Acad. Sci. USA 2018, 115, 4228–4233. [Google Scholar] [CrossRef] [Green Version]
- Chatterjee, C.; Sparks, D.L. Extracellular nucleotides inhibit insulin receptor signaling, stimulate autophagy and control lipoprotein secretion. PLoS ONE 2012, 7, e36916. [Google Scholar] [CrossRef] [Green Version]
- Vigneri, P.G.; Tirrò, E.; Pennisi, M.S.; Massimino, M.; Stella, S.; Romano, C.; Manzella, L. The Insulin/IGF System in Colorectal Cancer Development and Resistance to Therapy. Front. Oncol. 2015, 5, 230. [Google Scholar] [CrossRef] [Green Version]
- Wang, S.; Liu, Z.; Ma, Y.-M.; Guan, X.; Jiang, Z.; Sun, P.; Liu, E.-R.; Zhang, Y.-K.; Wang, H.-Y.; Wang, X.-S. Upregulated insulin receptor tyrosine kinase substrate promotes the proliferation of colorectal cancer cells via the bFGF/AKT signaling pathway. Gastroenterol. Rep. 2020, 9, 166–175. [Google Scholar] [CrossRef]
- Domagala, A.; Stachura, J.; Gabrysiak, M.; Muchowicz, A.; Zagozdzon, R.; Golab, J.; Firczuk, M. Inhibition of autophagy sensitizes cancer cells to Photofrin-based photodynamic therapy. BMC Cancer 2018, 18, 210. [Google Scholar] [CrossRef] [PubMed]
- Mathew, R.; Karantza-Wadsworth, V.; White, E. Role of autophagy in cancer. Nat. Rev. Cancer 2007, 7, 961–967. [Google Scholar] [CrossRef] [PubMed]
- Daskalaki, I.; Gkikas, I.; Tavernarakis, N. Hypoxia and Selective Autophagy in Cancer Development and Therapy. Front. Cell Dev. Biol. 2018, 6, 104. [Google Scholar] [CrossRef] [PubMed] [Green Version]
- Ikenouchi, J.; Matsuda, M.; Furuse, M.; Tsukita, S. Regulation of tight junctions during the epithelium-mesenchyme transition:direct repression of the gene expression of claudins/occludin by Snail. J. Cell Sci. 2003, 116, 1959–1967. [Google Scholar] [CrossRef] [PubMed] [Green Version]
- Moreno-Bueno, G.; Portillo, F.; Cano, A. Transcriptional regulation of cell polarity in EMT and cancer. Oncogene 2008, 27, 6958–6969. [Google Scholar] [CrossRef] [Green Version]
- Kang, H.; Kim, H.; Lee, S.; Youn, H.; Youn, B. Role of Metabolic Reprogramming in Epithelial–Mesenchymal Transition (EMT). Int. J. Mol. Sci. 2019, 20, 2042. [Google Scholar] [CrossRef] [Green Version]
- Nighot, P.K.; Hu, C.-A.A.; Ma, T.Y. Autophagy Enhances Intestinal Epithelial Tight Junction Barrier Function by Targeting Claudin-2 Protein Degradation. J. Biol. Chem. 2015, 290, 7234–7246. [Google Scholar] [CrossRef] [Green Version]
- Ozpolat, B.; Benbrook, D.M. Targeting autophagy in cancer management—Strategies and developments. Cancer Manag. Res. 2015, 7, 291–299. [Google Scholar] [CrossRef] [Green Version]
- White, E. Deconvoluting the context-dependent role for autophagy in cancer. Nat. Rev. Cancer 2012, 12, 401–410. [Google Scholar] [CrossRef] [Green Version]
- Mortensen, M.; Soilleux, E.J.; Djordjevic, G.; Tripp, R.; Lutteropp, M.; Sadighi-Akha, E.; Stranks, A.J.; Glanville, J.; Knight, S.; Jacobsen, S.E.; et al. The autophagy protein Atg7 is essential for hematopoietic stem cell maintenance. J. Exp. Med. 2011, 208, 455–467. [Google Scholar] [CrossRef]


Publisher’s Note: MDPI stays neutral with regard to jurisdictional claims in published maps and institutional affiliations. |
© 2022 by the authors. Licensee MDPI, Basel, Switzerland. This article is an open access article distributed under the terms and conditions of the Creative Commons Attribution (CC BY) license (https://creativecommons.org/licenses/by/4.0/).
Share and Cite
Poghosyan, S.; Frenkel, N.; Lentzas, A.; Laoukili, J.; Rinkes, I.B.; Kranenburg, O.; Hagendoorn, J. Loss of Neuropilin-2 in Murine Mesenchymal-like Colon Cancer Organoids Causes Mesenchymal-to-Epithelial Transition and an Acquired Dependency on Insulin-Receptor Signaling and Autophagy. Cancers 2022, 14, 671. https://doi.org/10.3390/cancers14030671
Poghosyan S, Frenkel N, Lentzas A, Laoukili J, Rinkes IB, Kranenburg O, Hagendoorn J. Loss of Neuropilin-2 in Murine Mesenchymal-like Colon Cancer Organoids Causes Mesenchymal-to-Epithelial Transition and an Acquired Dependency on Insulin-Receptor Signaling and Autophagy. Cancers. 2022; 14(3):671. https://doi.org/10.3390/cancers14030671
Chicago/Turabian StylePoghosyan, Susanna, Nicola Frenkel, Aristeidis Lentzas, Jamila Laoukili, Inne Borel Rinkes, Onno Kranenburg, and Jeroen Hagendoorn. 2022. "Loss of Neuropilin-2 in Murine Mesenchymal-like Colon Cancer Organoids Causes Mesenchymal-to-Epithelial Transition and an Acquired Dependency on Insulin-Receptor Signaling and Autophagy" Cancers 14, no. 3: 671. https://doi.org/10.3390/cancers14030671
APA StylePoghosyan, S., Frenkel, N., Lentzas, A., Laoukili, J., Rinkes, I. B., Kranenburg, O., & Hagendoorn, J. (2022). Loss of Neuropilin-2 in Murine Mesenchymal-like Colon Cancer Organoids Causes Mesenchymal-to-Epithelial Transition and an Acquired Dependency on Insulin-Receptor Signaling and Autophagy. Cancers, 14(3), 671. https://doi.org/10.3390/cancers14030671