
Gall Bladder Disease and the Risk of Small Bowel Cancer—Results from a Nationwide Swedish Cohort Study

 ,
,
Abstract
:Simple Summary
Abstract
1. Introduction
2. Methods
2.1. Study Population
2.2. Outcome Measure
2.3. Matched Comparators
2.4. Follow-Up
2.5. Statistics
3. Results
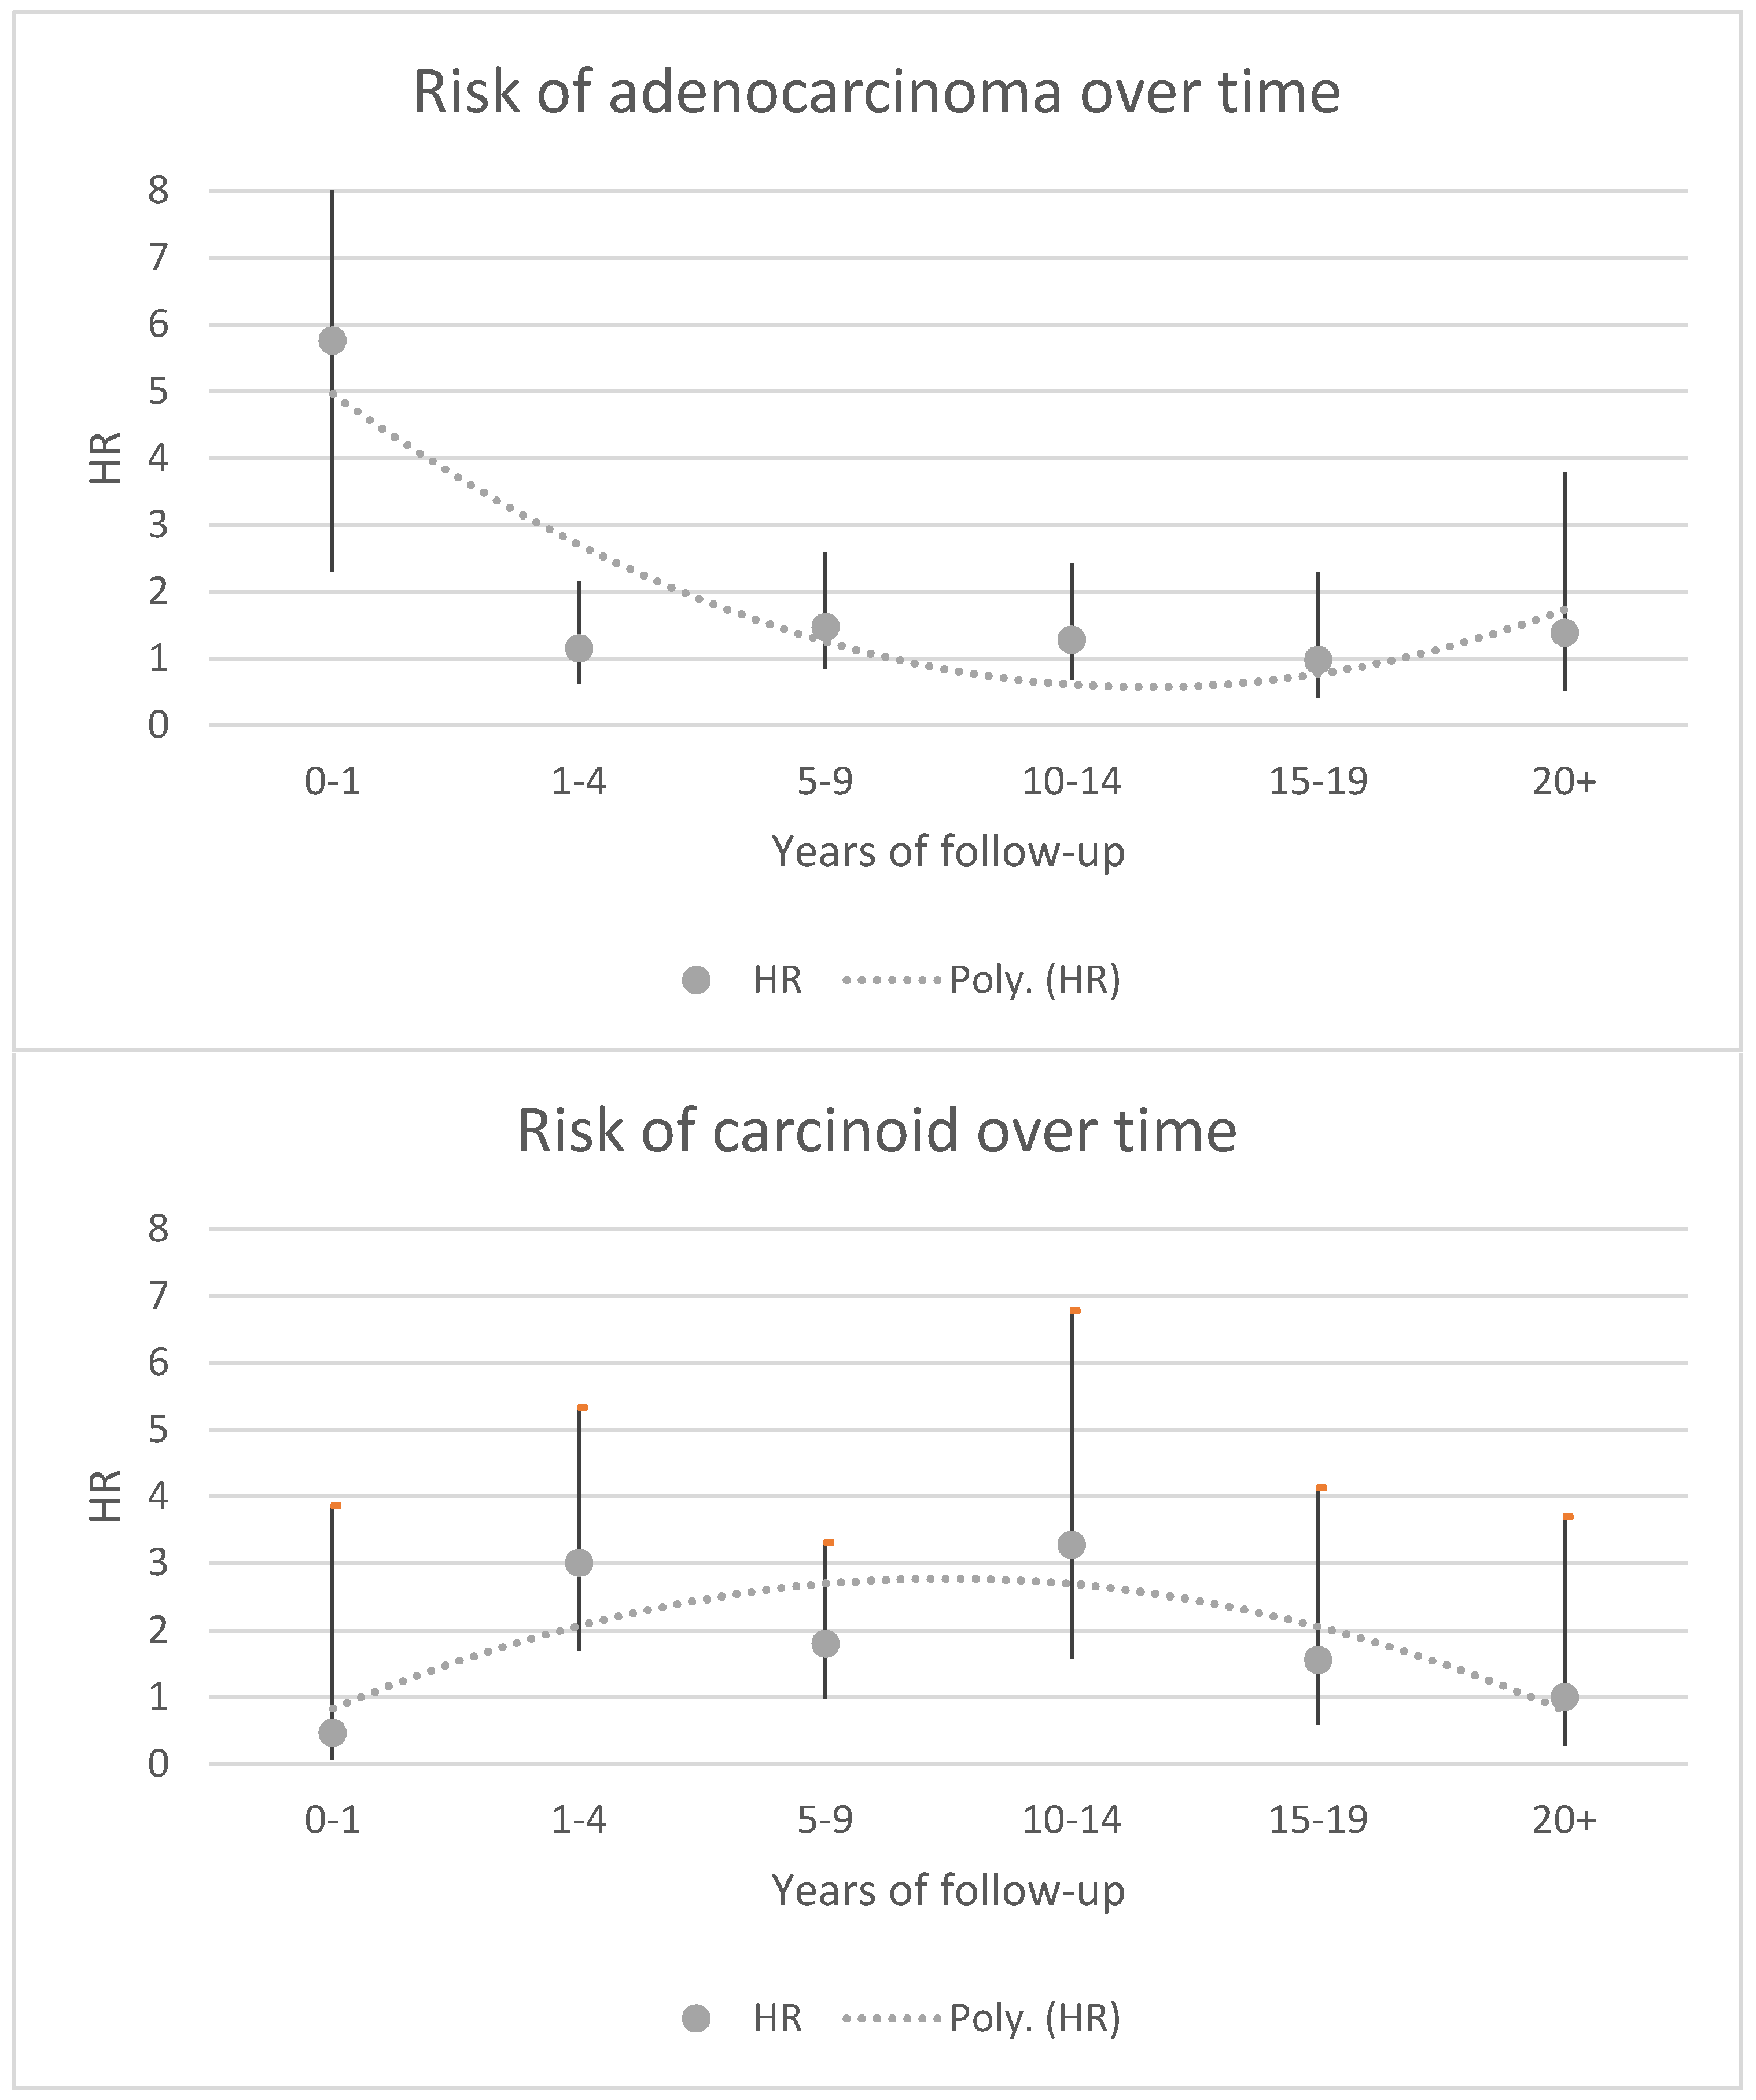
3.1. Small Bowel Adenocarcinoma
3.2. Small Bowel Adenomas
3.3. Small Bowel Carcinoids–Neuro Endocrine Tumors/Carcinomas
4. Discussion
4.1. Comparison to Previous Literature
4.2. Strengths and Limitations
5. Conclusions
Author Contributions
Funding
Institutional Review Board Statement
Informed Consent Statement
Data Availability Statement
Conflicts of Interest
Abbreviations
| BMI | body mass index |
| CI | confidence interval |
| COPD | chronic obstructive pulmonary disease |
| ESPRESSO | epidemiology strengthened by histopathology reports in Sweden |
| GBD | gallbladder disease |
| GI | gastrointestinal |
| HR | hazard ratio |
| OR | odds ratio |
| SnoMed | systematized nomenclature of medicine |
Appendix A. CD-SBA

| Characteristics | SnoMed Code | Topography |
|---|---|---|
| Gallbladder disease | M0X, M3X, M4X, M5X (all non-malignant gallbladder-related conditions–X represents any numbers) | T57 |
| Adenoma | M82632, M82112, M82611, M81400, M81400, M72040, M82612, M82630, M82100, M82102 | T64 and T65 |
| Adenocarcinoma | M81403 | T64 and T65 |
| Carcinoid | M82403, M82463, M82493 | T64 and T65 |
References
- Paski, S.C.; Semrad, C.E. Small bowel tumors. Gastrointest. Endosc. Clin. N. Am. 2009, 19, 461–479. [Google Scholar] [CrossRef]
- Bilimoria, K.Y.; Bentrem, D.J.; Wayne, J.D.; Ko, C.Y.; Bennett, C.L.; Talamonti, M.S. Small bowel cancer in the United States: Changes in epidemiology, treatment, and survival over the last 20 years. Ann. Surg. 2009, 249, 63–71. [Google Scholar] [CrossRef]
- Kaerlev, L.; Teglbjaerg, P.S.; Sabroe, S.; Kolstad, H.A.; Ahrens, W.; Eriksson, M.; Guenel, P.; Gorini, G.; Hardell, L.; Cyr, D.; et al. The importance of smoking and medical history for development of small bowel carcinoid tumor: A European population-based case-control study. Cancer Causes Control 2002, 13, 27–34. [Google Scholar] [CrossRef]
- Maguire, A.; Sheahan, K. Primary small bowel adenomas and adenocarcinomas-recent advances. Virchows Arch. 2018, 473, 265–273. [Google Scholar] [CrossRef] [PubMed]
- Axelrad, J.E.; Olen, O.; Sachs, M.C.; Erichsen, R.; Pedersen, L.; Halfvarson, J.; Askling, J.; Ekbom, A.; Sorensen, H.T.; Ludvigsson, J.F. Inflammatory bowel disease and risk of small bowel cancer: A binational population-based cohort study from Denmark and Sweden. Gut 2021, 70, 297–308. [Google Scholar] [CrossRef] [PubMed]
- Emilsson, L.; Semrad, C.; Lebwohl, B.; Green, P.H.R.; Ludvigsson, J.F. Risk of Small Bowel Adenocarcinoma, Adenomas, and Carcinoids in a Nationwide Cohort of Individuals With Celiac Disease. Gastroenterology 2020, 159, 1686–1694. [Google Scholar] [CrossRef]
- Neugut, A.I.; Marvin, M.R.; Rella, V.A.; Chabot, J.A. An overview of adenocarcinoma of the small intestine. Oncology 1997, 11, 529–536; discussion 545, 549–550. [Google Scholar]
- Singh, N.; Baby, D.; Rajguru, J.P.; Patil, P.B.; Thakkannavar, S.S.; Pujari, V.B. Inflammation and cancer. Ann. Afr. Med. 2019, 18, 121–126. [Google Scholar] [CrossRef] [PubMed]
- Wilkins, T.; Agabin, E.; Varghese, J.; Talukder, A. Gallbladder Dysfunction: Cholecystitis, Choledocholithiasis, Cholangitis, and Biliary Dyskinesia. Prim. Care 2017, 44, 575–597. [Google Scholar] [CrossRef]
- Johansen, C.; Chow, W.H.; Jorgensen, T.; Mellemkjaer, L.; Engholm, G.; Olsen, J.H. Risk of colorectal cancer and other cancers in patients with gall stones. Gut 1996, 39, 439–443. [Google Scholar] [CrossRef] [PubMed]
- Lagergren, J.; Ye, W.; Ekbom, A. Intestinal cancer after cholecystectomy: Is bile involved in carcinogenesis? Gastroenterology 2001, 121, 542–547. [Google Scholar] [CrossRef] [PubMed]
- Nogueira, L.; Freedman, N.D.; Engels, E.A.; Warren, J.L.; Castro, F.; Koshiol, J. Gallstones, cholecystectomy, and risk of digestive system cancers. Am. J. Epidemiol. 2014, 179, 731–739. [Google Scholar] [CrossRef] [Green Version]
- Tavani, A.; Rosato, V.; Di Palma, F.; Bosetti, C.; Talamini, R.; Dal Maso, L.; Zucchetto, A.; Levi, F.; Montella, M.; Negri, E.; et al. History of cholelithiasis and cancer risk in a network of case-control studies. Ann. Oncol. 2012, 23, 2173–2178. [Google Scholar] [CrossRef]
- Ludvigsson, J.F.; Otterblad-Olausson, P.; Pettersson, B.U.; Ekbom, A. The Swedish personal identity number: Possibilities and pitfalls in healthcare and medical research. Eur. J. Epidemiol. 2009, 24, 659–667. [Google Scholar] [CrossRef] [Green Version]
- Ludvigsson, J.F.; Lashkariani, M. Cohort profile: ESPRESSO (Epidemiology Strengthened by histoPathology Reports in Sweden). Clin. Epidemiol. 2019, 11, 101–114. [Google Scholar] [CrossRef] [PubMed] [Green Version]
- Ludvigsson, J.F.; Andersson, E.; Ekbom, A.; Feychting, M.; Kim, J.L.; Reuterwall, C.; Heurgren, M.; Olausson, P.O. External review and validation of the Swedish national inpatient register. BMC Public Health 2011, 11, 450. [Google Scholar] [CrossRef] [PubMed] [Green Version]
- Ludvigsson, J.F.; Almqvist, C.; Bonamy, A.E.; Ljung, R.; Michaelsson, K.; Neovius, M.; Stephansson, O.; Ye, W. Registers of the Swedish total population and their use in medical research. Eur. J. Epidemiol. 2016, 31, 125–136. [Google Scholar] [CrossRef] [Green Version]
- Ludvigsson, J.F.; Svedberg, P.; Olen, O.; Bruze, G.; Neovius, M. The longitudinal integrated database for health insurance and labour market studies (LISA) and its use in medical research. Eur. J. Epidemiol. 2019, 34, 423–437. [Google Scholar] [CrossRef] [Green Version]
- Bergman, D.; Hagstrom, H.; Capusan, A.J.; Marild, K.; Nyberg, F.; Sundquist, K.; Ludvigsson, J.F. Incidence of ICD-Based Diagnoses of Alcohol-Related Disorders and Diseases from Swedish Nationwide Registers and Suggestions for Coding. Clin. Epidemiol. 2020, 12, 1433–1442. [Google Scholar] [CrossRef]
- Ludvigsson, J.F.; Haberg, S.E.; Knudsen, G.P.; Lafolie, P.; Zoega, H.; Sarkkola, C.; von Kraemer, S.; Weiderpass, E.; Norgaard, M. Ethical aspects of registry-based research in the Nordic countries. Clin. Epidemiol. 2015, 7, 491–508. [Google Scholar] [CrossRef] [Green Version]
- Raghav, K.; Overman, M.J. Small bowel adenocarcinomas--existing evidence and evolving paradigms. Nat. Rev. Clin. Oncol. 2013, 10, 534–544. [Google Scholar] [CrossRef] [PubMed]
- Gagniere, J.; Raisch, J.; Veziant, J.; Barnich, N.; Bonnet, R.; Buc, E.; Bringer, M.A.; Pezet, D.; Bonnet, M. Gut microbiota imbalance and colorectal cancer. World J. Gastroenterol. 2016, 22, 501–518. [Google Scholar] [CrossRef] [PubMed]
- Mattsson, B.; Wallgren, A. Completeness of the Swedish Cancer Register. Non-notified cancer cases recorded on death certificates in 1978. Acta Radiol. Oncol. 1984, 23, 305–313. [Google Scholar] [CrossRef] [PubMed]
| Characteristic | Gallbladder Disease (n = 156,390) | Matched Comparators (n = 647,844) | Gallbladder Disease (n = 156,307) | Matched Comparators (n = 647,829) | Gallbladder Disease (n = 156,306) | Matched Comparators (n = 647,835) |
|---|---|---|---|---|---|---|
| Outcome | Adenocarcinoma | Adenoma | Carcinoid | |||
| Women, no. (%) | 97,859 (62.6%) | 428,597 (63.5%) | 97,826 (62.6%) | 428,599 (63.5%) | 97,821 (62.6%) | 428,600 (63.5%) |
| Men, no. (%) | 58,531 (37.4%) | 246,236 (36.5%) | 58,481 (37.4%) | 246,230 (36.5%) | 58,485 (37.4%) | 246,235 (36.5%) |
| Age | ||||||
| Mean (SD) | 53.7 (14.9) | 52.9 (15.1) | 53.7 (14.9) | 52.9 (15.1) | 53.7 (14.9) | 52.9 (15.1) |
| Median (IQR) | 55.0 (42.0–66.0) | 54.0 (41.0–65.0) | 55.0 (42.0–66.0) | 54.0 (41.0–65.0) | 55.0 (42.0–66.0) | 54.0 (41.0–65.0) |
| Range, min-max | 20.0–79.0 | 20.0–79.0 | 20.0–79.0 | 20.0–79.0 | 20.0–79.0 | 20.0–79.0 |
| Age (years), no. (%) | ||||||
| 20–39 | 31,963 (20.4%) | 149,152 (22.1%) | 31,958 (20.4%) | 149,152 (22.1%) | 31,961 (20.4%) | 149,151 (22.1%) |
| 40–49 | 28,076 (18.0%) | 124,854 (18.5%) | 28,069 (18.0%) | 124,854 (18.5%) | 28,066 (18.0%) | 124,854 (18.5%) |
| 50–59 | 34,384 (22.0%) | 145,699 (21.6%) | 34,368 (22.0%) | 145,700 (21.6%) | 34,369 (22.0%) | 145,702 (21.6%) |
| 60–69 | 35,445 (22.7%) | 146,721 (21.7%) | 35,417 (22.7%) | 146,717 (21.7%) | 35,410 (22.7%) | 146,720 (21.7%) |
| 70–79 | 26,522 (17.0%) | 108,407 (16.1%) | 26,495 (17.0%) | 108,406 (16.1%) | 26,500 (17.0%) | 108,408 (16.1%) |
| Highest attained level of education (years), n (%) | ||||||
| ≤9 | 41,378 (26.5%) | 153,416 (22.7%) | 41,348 (26.5%) | 153,412 (22.7%) | 41,348 (26.5%) | 153,418 (22.7%) |
| 10–12 | 58,471 (37.4%) | 241,837 (35.8%) | 58,437 (37.4%) | 241,836 (35.8%) | 58,439 (37.4%) | 241,836 (35.8%) |
| >12 | 30,320 (19.4%) | 168,683 (25.0%) | 30,308 (19.4%) | 168,685 (25.0%) | 30,305 (19.4%) | 168,685 (25.0%) |
| Missing | 26,221 (16.8%) | 110,897 (16.4%) | 26,214 (16.8%) | 110,896 (16.4%) | 26,214 (16.8%) | 110,896 (16.4%) |
| Start year of follow-up | ||||||
| 1965–1989 | 20,309 (13.0%) | 84,877 (12.6%) | 20,306 (13.0%) | 84,876 (12.6%) | 20,305 (13.0%) | 84,877 (12.6%) |
| 1990–1999 | 46,787 (29.9%) | 197,611 (29.3%) | 46,769 (29.9%) | 197,614 (29.3%) | 46,762 (29.9%) | 197,611 (29.3%) |
| 2000–2009 | 56,001 (35.8%) | 243,146 (36.0%) | 55,966 (35.8%) | 243,140 (36.0%) | 55,955 (35.8%) | 243,146 (36.0%) |
| 2010–2017 | 33,293 (21.3%) | 149,199 (22.1%) | 33,266 (21.3%) | 149,199 (22.1%) | 33,284 (21.3%) | 149,201 (22.1%) |
| Follow-up, years | ||||||
| Mean (SD) | 12.3 (8.1) | 11.9 (8.1) | 12.3 (8.1) | 11.9 (8.1) | 12.3 (8.1) | 11.9 (8.1) |
| Median (IQR) | 11.5 (5.6–17.8) | 10.9 (5.2–17.4) | 11.5 (5.6–17.8) | 10.9 (5.2–17.4) | 11.5 (5.6–17.8) | 10.9 (5.2–17.4) |
| Range, min-max | 0.0–46.0 | 0.0–46.0 | 0.0–46.0 | 0.0–46.0 | 0.0–46.0 | 0.0–46.0 |
| Comorbidities (ever recorded in registries) | ||||||
| Alcohol | 5914 (3.8%) | 1771 (0.3%) | 5910 (3.8%) | 1771 (0.3%) | 5912 (3.8%) | 1771 (0.3%) |
| COPD | 13,367 (8.5%) | 3558 (0.5%) | 13,352 (8.5%) | 3558 (0.5%) | 13,359 (8.5%) | 3558 (0.5%) |
| Ischemic heart disease | 5255 (3.4%) | 15,742 (2.3%) | 5252 (3.4%) | 15,741 (2.3%) | 5252 (3.4%) | 15,742 (2.3%) |
| Type 2 diabetes | 7626 (4.9%) | 17,145 (2.5%) | 7612 (4.9%) | 17,145 (2.5%) | 7623 (4.9%) | 17,146 (2.5%) |
| Obesity | 4693 (3.0%) | 4580 (0.7%) | 4688 (3.0%) | 4580 (0.7%) | 4690 (3.0%) | 4580 (0.7%) |
| Group | N (%) | N Events (%) | Incidence Rate (95% CI) Per 100,000 PY | HR * (95% CI) | |||
|---|---|---|---|---|---|---|---|
| Gallbladder Disease | Comparators | Gallbladder Disease | Comparators | Gallbladder Disease | Comparators | ||
| Overall | 156,390 (100.0%) | 674,833 (100.0%) | 92 (0.1%) | 260 (0.0%) | 4.8 (3.8–5.8) | 3.2 (2.8–3.6) | 1.42 (1.08–1.87) |
| Follow-up (0- < 1 represents year 1- < 2 after GBD, as follow up starts at 1 year after GBD) | |||||||
| 0- < 1 y | 156,381 (100.0%) | 674,811 (100.0%) | 15 (0.0%) | 13 (0.0%) | 9.8 (4.8–14.8) | 2.0 (0.9–3.0) | 5.76 (2.31–14.40) |
| 1- < 5 y | 149,668 (95.7%) | 642,450 (95.2%) | 18 (0.0%) | 63 (0.0%) | 3.3 (1.8–4.9) | 2.7 (2.1–3.4) | 1.16 (0.62–2.16) |
| 5- < 10 y | 121,425 (77.6%) | 510,981 (75.7%) | 23 (0.0%) | 66 (0.0%) | 4.4 (2.6–6.2) | 3.0 (2.3–3.8) | 1.48 (0.85–2.59) |
| 10- < 15 y | 88,010 (56.3%) | 364,100 (54.0%) | 19 (0.0%) | 54 (0.0%) | 5.3 (2.9–7.7) | 3.7 (2.7–4.6) | 1.28 (0.68–2.43) |
| 15- < 20 y | 54,823 (35.1%) | 224,869 (33.3%) | 9 (0.0%) | 37 (0.0%) | 4.4 (1.5–7.3) | 4.4 (3.0–5.8) | 0.98 (0.42–2.30) |
| ≥20 y | 28,662 (18.3%) | 117,131 (17.4%) | 8 (0.0%) | 27 (0.0%) | 5.4 (1.7–9.2) | 4.5 (2.8–6.2) | 1.39 (0.51–3.79) |
| Sex | |||||||
| Women | 97,859 (62.6%) | 428,597 (63.5%) | 47 (0.0%) | 156 (0.0%) | 3.7 (2.6–4.7) | 2.9 (2.4–3.3) | 1.20 (0.83–1.73) |
| Men | 58,531 (37.4%) | 246,236 (36.5%) | 45 (0.1%) | 104 (0.0%) | 7.0 (4.9–9.0) | 4.0 (3.2–4.7) | 1.80 (1.16–2.79) |
| Age at gallbladder diagnosis | |||||||
| 20–39 | 31,963 (20.4%) | 149,152 (22.1%) | 7 (0.0%) | 7 (0.0%) | 1.5 (0.4–2.6) | 0.3 (0.1–0.6) | 5.26 (1.57–17.63) |
| 40–49 | 28,076 (18.0%) | 124,854 (18.5%) | 6 (0.0%) | 21 (0.0%) | 1.6 (0.3–2.8) | 1.3 (0.7–1.8) | 0.99 (0.28–3.57) |
| 50–59 | 34,384 (22.0%) | 145,699 (21.6%) | 24 (0.1%) | 64 (0.0%) | 5.3 (3.2–7.4) | 3.5 (2.6–4.3) | 1.51 (0.88–2.59) |
| 60–69 | 35,445 (22.7%) | 146,721 (21.7%) | 34 (0.1%) | 99 (0.1%) | 8.5 (5.7–11.4) | 6.2 (5.0–7.5) | 1.38 (0.87–2.20) |
| 70–79 | 26,522 (17.0%) | 108,407 (16.1%) | 21 (0.1%) | 69 (0.1%) | 9.0 (5.1–12.8) | 7.6 (5.8–9.4) | 1.19 (0.68–2.10) |
| Year of gallbladder diagnosis | |||||||
| 1965–1989 | 20,309 (13.0%) | 84,877 (12.6%) | 7 (0.0%) | 17 (0.0%) | 5.5 (3.3–7.7) | 4.3 (3.3–5.3) | 1.71 (0.58–5.06) |
| 1990–1999 | 46,787 (29.9%) | 197,611 (29.3%) | 11 (0.0%) | 24 (0.0%) | 5.5 (3.9–7.1) | 3.3 (2.7–4.0) | 2.15 (0.95–4.87) |
| 2000–2009 | 56,001 (35.8%) | 243,146 (36.0%) | 13 (0.0%) | 28 (0.0%) | 3.8 (2.2–5.3) | 2.6 (2.0–3.2) | 2.36 (1.03–5.38) |
| 2010–2017 | 10,874 (7.0%) | 48,476 (7.2%) | 1 (0.0%) | 5 (0.0%) | 2.0 (0.0–4.9) | 1.6 (0.4–2.8) | 0.72 (0.05–11.20) |
| Year–follow-up restricted to first 5 years of follow-up | |||||||
| 1965–1989 | 4255 (8.8%) | 21,396 (8.9%) | 1 (0.0%) | 1 (0.0%) | 7.2 (1.9–12.5) | 4.2 (2.2–6.2) | 3.87 (0.24–63.34) |
| 1990–1999 | 13,291 (27.6%) | 66,455 (27.8%) | 6 (0.0%) | 4 (0.0%) | 4.8 (2.0–7.7) | 2.5 (1.5–3.5) | NE |
| 2000–2009 | 19,601 (40.7%) | 96,967 (40.5%) | 4 (0.0%) | 9 (0.0%) | 4.7 (2.2–7.3) | 2.4 (1.5–3.2) | 2.31 (0.65–8.24) |
| 2010 | 4083 (8.5%) | 20,318 (8.5%) | 1 (0.0%) | 1 (0.0%) | 2.0 (0.0–5.8) | 2.2 (0.3–4.2) | 2.45 (0.15–39.72) |
| Level of education | |||||||
| ≤9 years | 41,378 (26.5%) | 153,416 (22.7%) | 32 (0.1%) | 80 (0.1%) | 6.9 (4.5–9.3) | 4.8 (3.7–5.8) | 1.62 (0.88–2.97) |
| 10–12 years | 58,471 (37.4%) | 241,837 (35.8%) | 20 (0.0%) | 59 (0.0%) | 3.2 (1.8–4.6) | 2.3 (1.7–2.9) | 0.92 (0.40–2.10) |
| >12 years | 30,320 (19.4%) | 168,683 (25.0%) | 14 (0.0%) | 34 (0.0%) | 4.6 (2.2–7.0) | 2.0 (1.3–2.7) | 1.47 (0.47–4.54) |
| Education missing | 26,221 (16.8%) | 110,897 (16.4%) | 26 (0.1%) | 87 (0.1%) | 4.9 (3.0–6.7) | 4.0 (3.2–4.9) | 1.25 (0.75–2.07) |
| Group | N (%) | N Events (%) | Incidence Rate (95% CI) Per 100,000 PY | HR * (95% CI) | |||
|---|---|---|---|---|---|---|---|
| Gallbladder Disease | Comparators | Gallbladder Disease | Comparators | Gallbladder Disease | Comparators | ||
| Overall | 156,307 (100.0%) | 674,829 (100.0%) | 132 (0.1%) | 260 (0.0%) | 6.9 (5.7–8.0) | 3.2 (2.8–3.6) | 1.79 (1.41–2.27) |
| Follow-up | |||||||
| 0- < 1 y | 156,298 (100.0%) | 674,807 (100.0%) | 9 (0.0%) | 15 (0.0%) | 5.9 (2.0–9.7) | 2.3 (1.1–3.4) | 2.49 (0.99–6.27) |
| 1- < 5 y | 149,590 (95.7%) | 642,434 (95.2%) | 37 (0.0%) | 51 (0.0%) | 6.8 (4.6–9.0) | 2.2 (1.6–2.8) | 2.69 (1.68–4.31) |
| 5- < 10 y | 121,351 (77.6%) | 510,951 (75.7%) | 34 (0.0%) | 71 (0.0%) | 6.5 (4.3–8.7) | 3.3 (2.5–4.0) | 1.60 (0.99–2.60) |
| 10- < 15 y | 87,964 (56.3%) | 364,055 (53.9%) | 25 (0.0%) | 63 (0.0%) | 7.0 (4.3–9.7) | 4.3 (3.2–5.3) | 1.51 (0.88–2.62) |
| 15- < 20 y | 54,800 (35.1%) | 224,826 (33.3%) | 12 (0.0%) | 36 (0.0%) | 5.9 (2.5–9.2) | 4.3 (2.9–5.7) | 0.99 (0.43–2.32) |
| ≥20 y | 28,650 (18.3%) | 117,111 (17.4%) | 15 (0.1%) | 24 (0.0%) | 10.2 (5.0–15.3) | 4.0 (2.4–5.6) | 1.70 (0.77–3.74) |
| Sex | |||||||
| Women | 97,826 (62.6%) | 428,599 (63.5%) | 69 (0.1%) | 148 (0.0%) | 5.4 (4.1–6.7) | 2.7 (2.3–3.2) | 1.66 (1.19–2.30) |
| Men | 58,481 (37.4%) | 246,230 (36.5%) | 63 (0.1%) | 112 (0.0%) | 9.8 (7.3–12.2) | 4.3 (3.5–5.0) | 1.91 (1.34–2.71) |
| Age at gallbladder diagnosis | |||||||
| 20–39 | 31,958 (20.4%) | 149,152 (22.1%) | 6 (0.0%) | 15 (0.0%) | 1.3 (0.3–2.3) | 0.7 (0.4–1.1) | 1.68 (0.56–4.98) |
| 40–49 | 28,069 (18.0%) | 124,854 (18.5%) | 23 (0.1%) | 37 (0.0%) | 6.0 (3.6–8.5) | 2.3 (1.5–3.0) | 2.04 (1.13–3.69) |
| 50–59 | 34,368 (22.0%) | 145,700 (21.6%) | 36 (0.1%) | 66 (0.0%) | 8.0 (5.4–10.6) | 3.6 (2.7–4.5) | 1.64 (1.01–2.66) |
| 60–69 | 35,417 (22.7%) | 146,717 (21.7%) | 38 (0.1%) | 87 (0.1%) | 9.5 (6.5–12.6) | 5.5 (4.3–6.6) | 1.58 (1.01–2.49) |
| 70–79 | 26,495 (17.0%) | 108,406 (16.1%) | 29 (0.1%) | 55 (0.1%) | 12.4 (7.9–17.0) | 6.0 (4.4–7.6) | 2.08 (1.23–3.49) |
| Year of gallbladder diagnosis | |||||||
| 1965–1989 | 20,306 (13.0%) | 84,876 (12.6%) | 22 (0.1%) | 57 (0.1%) | 5.0 (2.9–7.1) | 3.2 (2.4–4.1) | 1.07 (0.59–1.96) |
| 1990–1999 | 46,769 (29.9%) | 197,614 (29.3%) | 47 (0.1%) | 112 (0.1%) | 5.8 (4.2–7.5) | 3.3 (2.7–4.0) | 1.53 (1.03–2.27) |
| 2000–2009 | 55,966 (35.8%) | 243,140 (36.0%) | 58 (0.1%) | 83 (0.0%) | 9.9 (7.4–12.4) | 3.3 (2.6–4.0) | 2.73 (1.86–3.99) |
| 2010–2017 | 33,266 (21.3%) | 149,199 (22.1%) | 5 (0.0%) | 8 (0.0%) | 5.1 (0.6–9.6) | 1.8 (0.6–3.1) | 2.47 (0.62–9.80) |
| Year–follow-up restricted to first 5 years of follow-up | |||||||
| 1965–1989 | 20,306 (13.0%) | 84,876 (12.6%) | 3 (0.0%) | 4 (0.0%) | 3.1 (0.0–6.5) | 1.0 (0.0–2.0) | 2.27 (0.37–13.90) |
| 1990–1999 | 46,769 (29.9%) | 197,614 (29.3%) | 14 (0.0%) | 23 (0.0%) | 6.2 (2.9–9.4) | 2.4 (1.4–3.4) | 2.00 (0.95–4.21) |
| 2000–2009 | 55,966 (35.8%) | 243,140 (36.0%) | 24 (0.0%) | 31 (0.0%) | 8.8 (5.3–12.3) | 2.6 (1.7–3.5) | 3.32 (1.85–5.96) |
| 2010 | 10,865 (7.0%) | 48,479 (7.2%) | 3 (0.0%) | 2 (0.0%) | 5.9 (0.0–12.6) | 0.9 (0.0–2.1) | 2.41 (0.16–35.48) |
| Level of education | |||||||
| ≤9 years | 41,348 (26.5%) | 153,412 (22.7%) | 54 (0.1%) | 68 (0.0%) | 11.6 (8.5–14.7) | 4.1 (3.1–5.0) | 3.82 (2.03–7.19) |
| 10–12 years | 58,437 (37.4%) | 241,836 (35.8%) | 37 (0.1%) | 63 (0.0%) | 5.9 (4.0–7.8) | 2.5 (1.9–3.1) | 2.23 (1.13–4.40) |
| >12 years | 30,308 (19.4%) | 168,685 (25.0%) | 16 (0.1%) | 58 (0.0%) | 5.3 (2.7–7.9) | 3.5 (2.6–4.3) | 2.25 (0.83–6.10) |
| Education missing | 26,214 (16.8%) | 110,896 (16.4%) | 25 (0.1%) | 71 (0.1%) | 4.7 (2.8–6.5) | 3.3 (2.5–4.1) | 0.93 (0.53–1.65) |
| Group | N (%) | N Events (%) | Incidence Rate (95% CI) Per 100,000 PY | HR * (95% CI) | |||
|---|---|---|---|---|---|---|---|
| Gallbladder Disease | Comparators | Gallbladder Disease | Comparators | Gallbladder Disease | Comparators | ||
| Overall | 156,306 (100.0%) | 674,835 (100.0%) | 81 (0.1%) | 148 (0.0%) | 4.2 (3.3–5.1) | 1.8 (1.5–2.1) | 2.07 (1.52–2.81) |
| Follow-up | |||||||
| 0- < 1 y | 156,296 (100.0%) | 674,813 (100.0%) | 2 (0.0%) | 12 (0.0%) | 1.3 (0.0–3.1) | 1.8 (0.8–2.9) | 0.48 (0.06–3.86) |
| 1- < 5 y | 149,593 (95.7%) | 642,443 (95.2%) | 24 (0.0%) | 35 (0.0%) | 4.4 (2.7–6.2) | 1.5 (1.0–2.0) | 3.01 (1.70–5.34) |
| 5- < 10 y | 121,360 (77.6%) | 510,970 (75.7%) | 24 (0.0%) | 38 (0.0%) | 4.6 (2.8–6.4) | 1.7 (1.2–2.3) | 1.81 (0.98–3.31) |
| 10- < 15 y | 87,970 (56.3%) | 364,079 (54.0%) | 18 (0.0%) | 26 (0.0%) | 5.0 (2.7–7.4) | 1.8 (1.1–2.4) | 3.28 (1.58–6.78) |
| 15- < 20 y | 54,801 (35.1%) | 224,857 (33.3%) | 8 (0.0%) | 18 (0.0%) | 3.9 (1.2–6.6) | 2.1 (1.2–3.1) | 1.56 (0.59–4.13) |
| ≥20 y | 28,650 (18.3%) | 117,133 (17.4%) | 4 (0.0%) | 19 (0.0%) | 2.7 (0.1–5.4) | 3.2 (1.7–4.6) | 1.01 (0.27–3.69) |
| Sex | |||||||
| Women | 97,821 (62.6%) | 428,600 (63.5%) | 46 (0.0%) | 82 (0.0%) | 3.6 (2.6–4.6) | 1.5 (1.2–1.8) | 1.95 (1.29–2.94) |
| Men | 58,485 (37.4%) | 246,235 (36.5%) | 35 (0.1%) | 66 (0.0%) | 5.4 (3.6–7.2) | 2.5 (1.9–3.1) | 2.07 (1.29–3.33) |
| Age at gallbladder diagnosis | |||||||
| 20–39 | 31,961 (20.4%) | 149,151 (22.1%) | 6 (0.0%) | 5 (0.0%) | 1.3 (0.3–2.3) | 0.2 (0.0–0.4) | 3.45 (0.80–14.95) |
| 40–49 | 28,066 (18.0%) | 124,854 (18.5%) | 12 (0.0%) | 19 (0.0%) | 3.1 (1.4–4.9) | 1.2 (0.6–1.7) | 2.98 (1.32–6.74) |
| 50–59 | 34,369 (22.0%) | 145,702 (21.6%) | 24 (0.1%) | 43 (0.0%) | 5.3 (3.2–7.4) | 2.3 (1.6–3.0) | 1.93 (1.09–3.42) |
| 60–69 | 35,410 (22.7%) | 146,720 (21.7%) | 27 (0.1%) | 56 (0.0%) | 6.8 (4.2–9.3) | 3.5 (2.6–4.4) | 2.08 (1.26–3.44) |
| 70–79 | 26,500 (17.0%) | 108,408 (16.1%) | 12 (0.0%) | 25 (0.0%) | 5.1 (2.2–8.1) | 2.7 (1.7–3.8) | 1.14 (0.45–2.90) |
| Year of gallbladder diagnosis | |||||||
| 1965–1989 | 20,305 (13.0%) | 84,877 (12.6%) | 14 (0.1%) | 36 (0.0%) | 3.2 (1.5–4.9) | 2.0 (1.4–2.7) | 1.62 (0.80–3.30) |
| 1990–1999 | 46,762 (29.9%) | 197,611 (29.3%) | 38 (0.1%) | 66 (0.0%) | 4.7 (3.2–6.2) | 2.0 (1.5–2.4) | 1.97 (1.25–3.11) |
| 2000–2009 | 55,955 (35.8%) | 243,146 (36.0%) | 25 (0.0%) | 41 (0.0%) | 4.3 (2.6–5.9) | 1.6 (1.1–2.1) | 2.17 (1.23–3.83) |
| 2010–2017 | 33,284 (21.3%) | 149,201 (22.1%) | 4 (0.0%) | 5 (0.0%) | 4.1 (0.1–8.1) | 1.1 (0.1–2.2) | 4.72 (1.06–21.04) |
| Year–follow-up restricted to first 5 years of follow-up | |||||||
| 1965–1989 | 20,305 (13.0%) | 84,877 (12.6%) | 1 (0.0%) | 7 (0.0%) | 1.0 (0.0–3.0) | 1.7 (0.5–3.0) | 1.07 (0.12–9.62) |
| 1990–1999 | 46,762 (29.9%) | 197,611 (29.3%) | 10 (0.0%) | 17 (0.0%) | 4.4 (1.7–7.1) | 1.8 (0.9–2.6) | 2.58 (1.06–6.26) |
| 2000–2009 | 55,955 (35.8%) | 243,146 (36.0%) | 12 (0.0%) | 18 (0.0%) | 4.4 (1.9–6.9) | 1.5 (0.8–2.2) | 2.47 (1.06–5.72) |
| 2010 | 10,873 (7.0%) | 48,479 (7.2%) | 1 (0.0%) | 2 (0.0%) | 2.0 (0.0–5.8) | 0.9 (0.0–2.1) | 3.32 (0.15–74.41) |
| Level of education | |||||||
| ≤9 years | 41,348 (26.5%) | 153,418 (22.7%) | 20 (0.0%) | 48 (0.0%) | 4.3 (2.4–6.2) | 2.9 (2.1–3.7) | 1.88 (0.85–4.15) |
| 10–12 years | 58,439 (37.4%) | 241,836 (35.8%) | 31 (0.1%) | 37 (0.0%) | 5.0 (3.2–6.7) | 1.5 (1.0–1.9) | 4.89 (2.14–11.16) |
| >12 years | 30,305 (19.4%) | 168,685 (25.0%) | 13 (0.0%) | 20 (0.0%) | 4.3 (2.0–6.6) | 1.2 (0.7–1.7) | 0.70 (0.13–3.70) |
| Education missing | 26,214 (16.8%) | 110,896 (16.4%) | 17 (0.1%) | 43 (0.0%) | 3.2 (1.7–4.7) | 2.0 (1.4–2.6) | 1.62 (0.84–3.12) |
Publisher’s Note: MDPI stays neutral with regard to jurisdictional claims in published maps and institutional affiliations. |
© 2022 by the authors. Licensee MDPI, Basel, Switzerland. This article is an open access article distributed under the terms and conditions of the Creative Commons Attribution (CC BY) license (https://creativecommons.org/licenses/by/4.0/).
Share and Cite
Emilsson, L.; Radkiewicz, C.; Semrad, C.E.; Joshi, A.D.; Ludvigsson, J.F. Gall Bladder Disease and the Risk of Small Bowel Cancer—Results from a Nationwide Swedish Cohort Study. Cancers 2022, 14, 469. https://doi.org/10.3390/cancers14030469
Emilsson L, Radkiewicz C, Semrad CE, Joshi AD, Ludvigsson JF. Gall Bladder Disease and the Risk of Small Bowel Cancer—Results from a Nationwide Swedish Cohort Study. Cancers. 2022; 14(3):469. https://doi.org/10.3390/cancers14030469
Chicago/Turabian StyleEmilsson, Louise, Cecilia Radkiewicz, Carol E. Semrad, Amit D. Joshi, and Jonas F. Ludvigsson. 2022. "Gall Bladder Disease and the Risk of Small Bowel Cancer—Results from a Nationwide Swedish Cohort Study" Cancers 14, no. 3: 469. https://doi.org/10.3390/cancers14030469
APA StyleEmilsson, L., Radkiewicz, C., Semrad, C. E., Joshi, A. D., & Ludvigsson, J. F. (2022). Gall Bladder Disease and the Risk of Small Bowel Cancer—Results from a Nationwide Swedish Cohort Study. Cancers, 14(3), 469. https://doi.org/10.3390/cancers14030469