
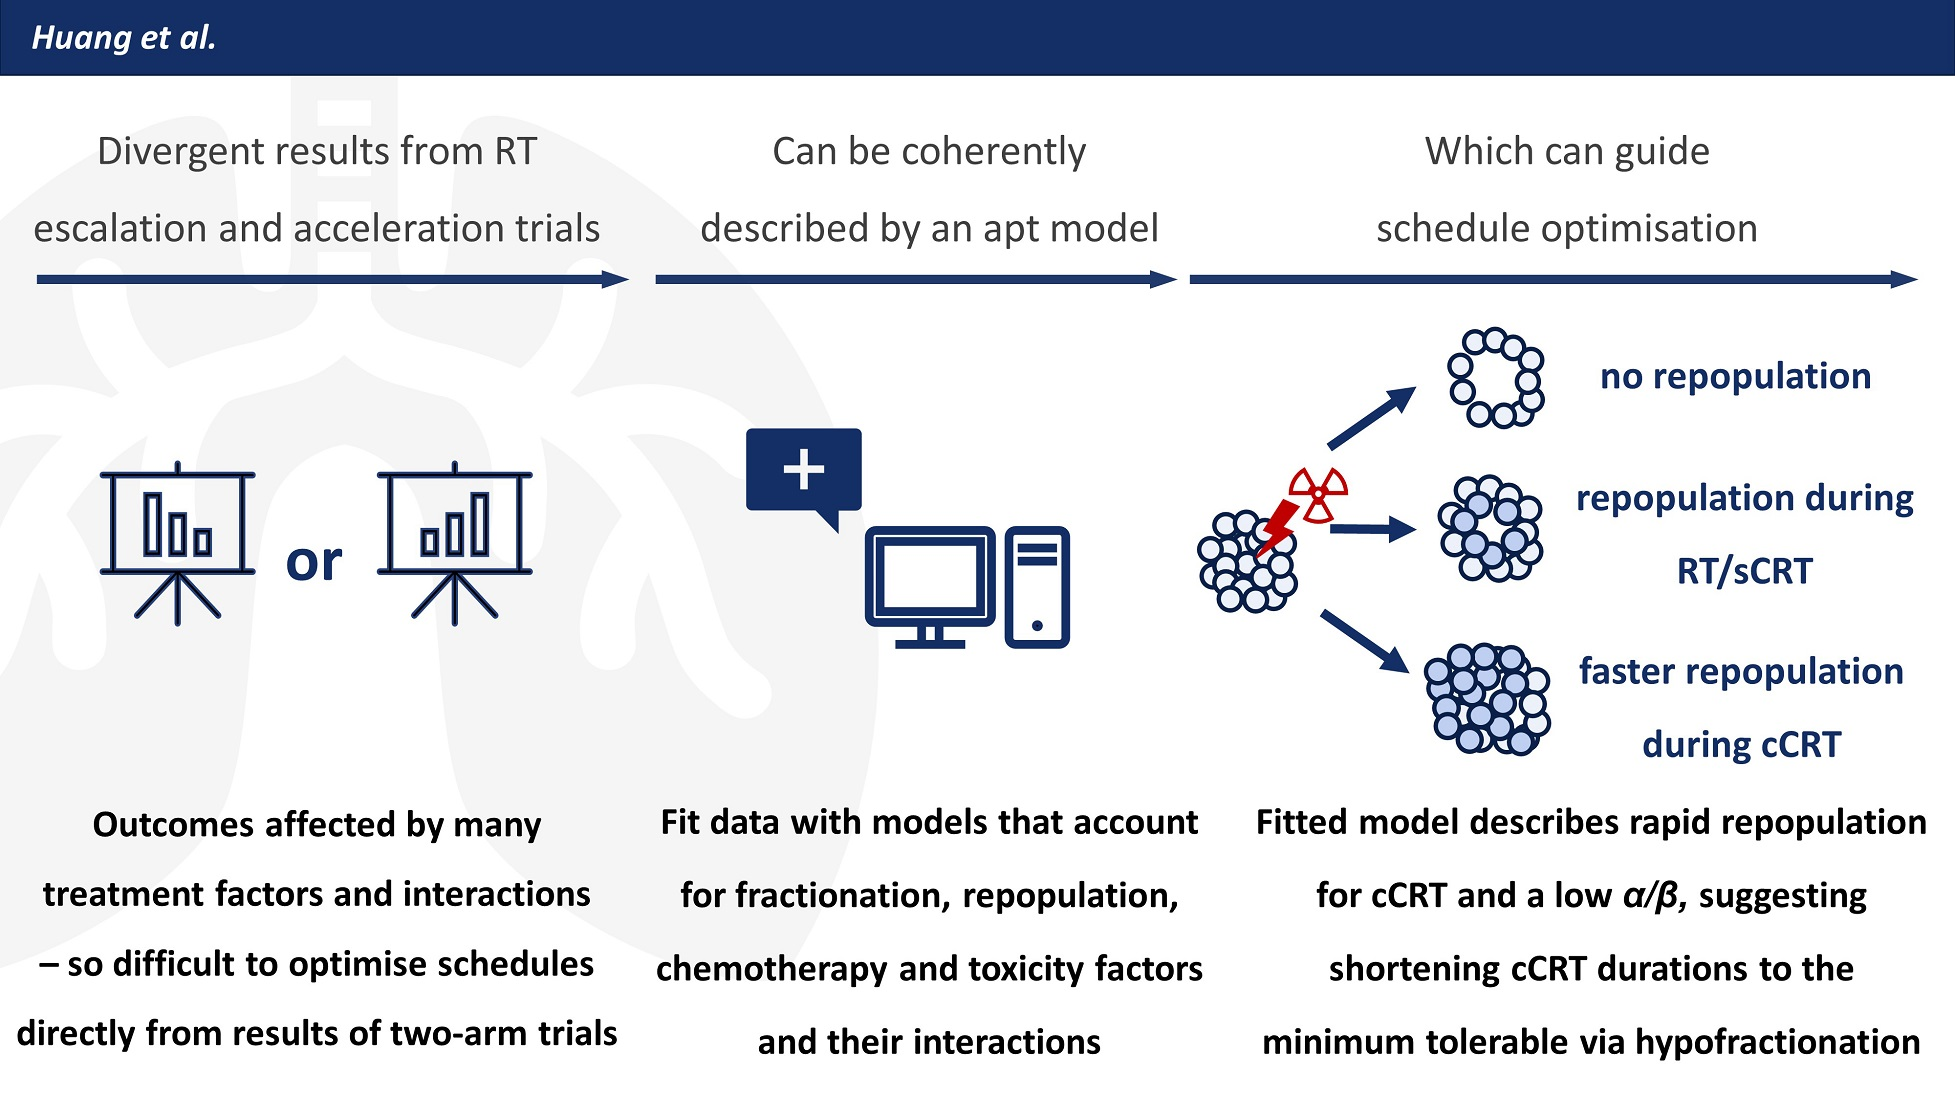
Dose-Response Analysis Describes Particularly Rapid Repopulation of Non-Small Cell Lung Cancer during Concurrent Chemoradiotherapy
 , ,
, ,
Abstract
Simple Summary
Abstract

1. Introduction
2. Materials and Methods
2.1. Data
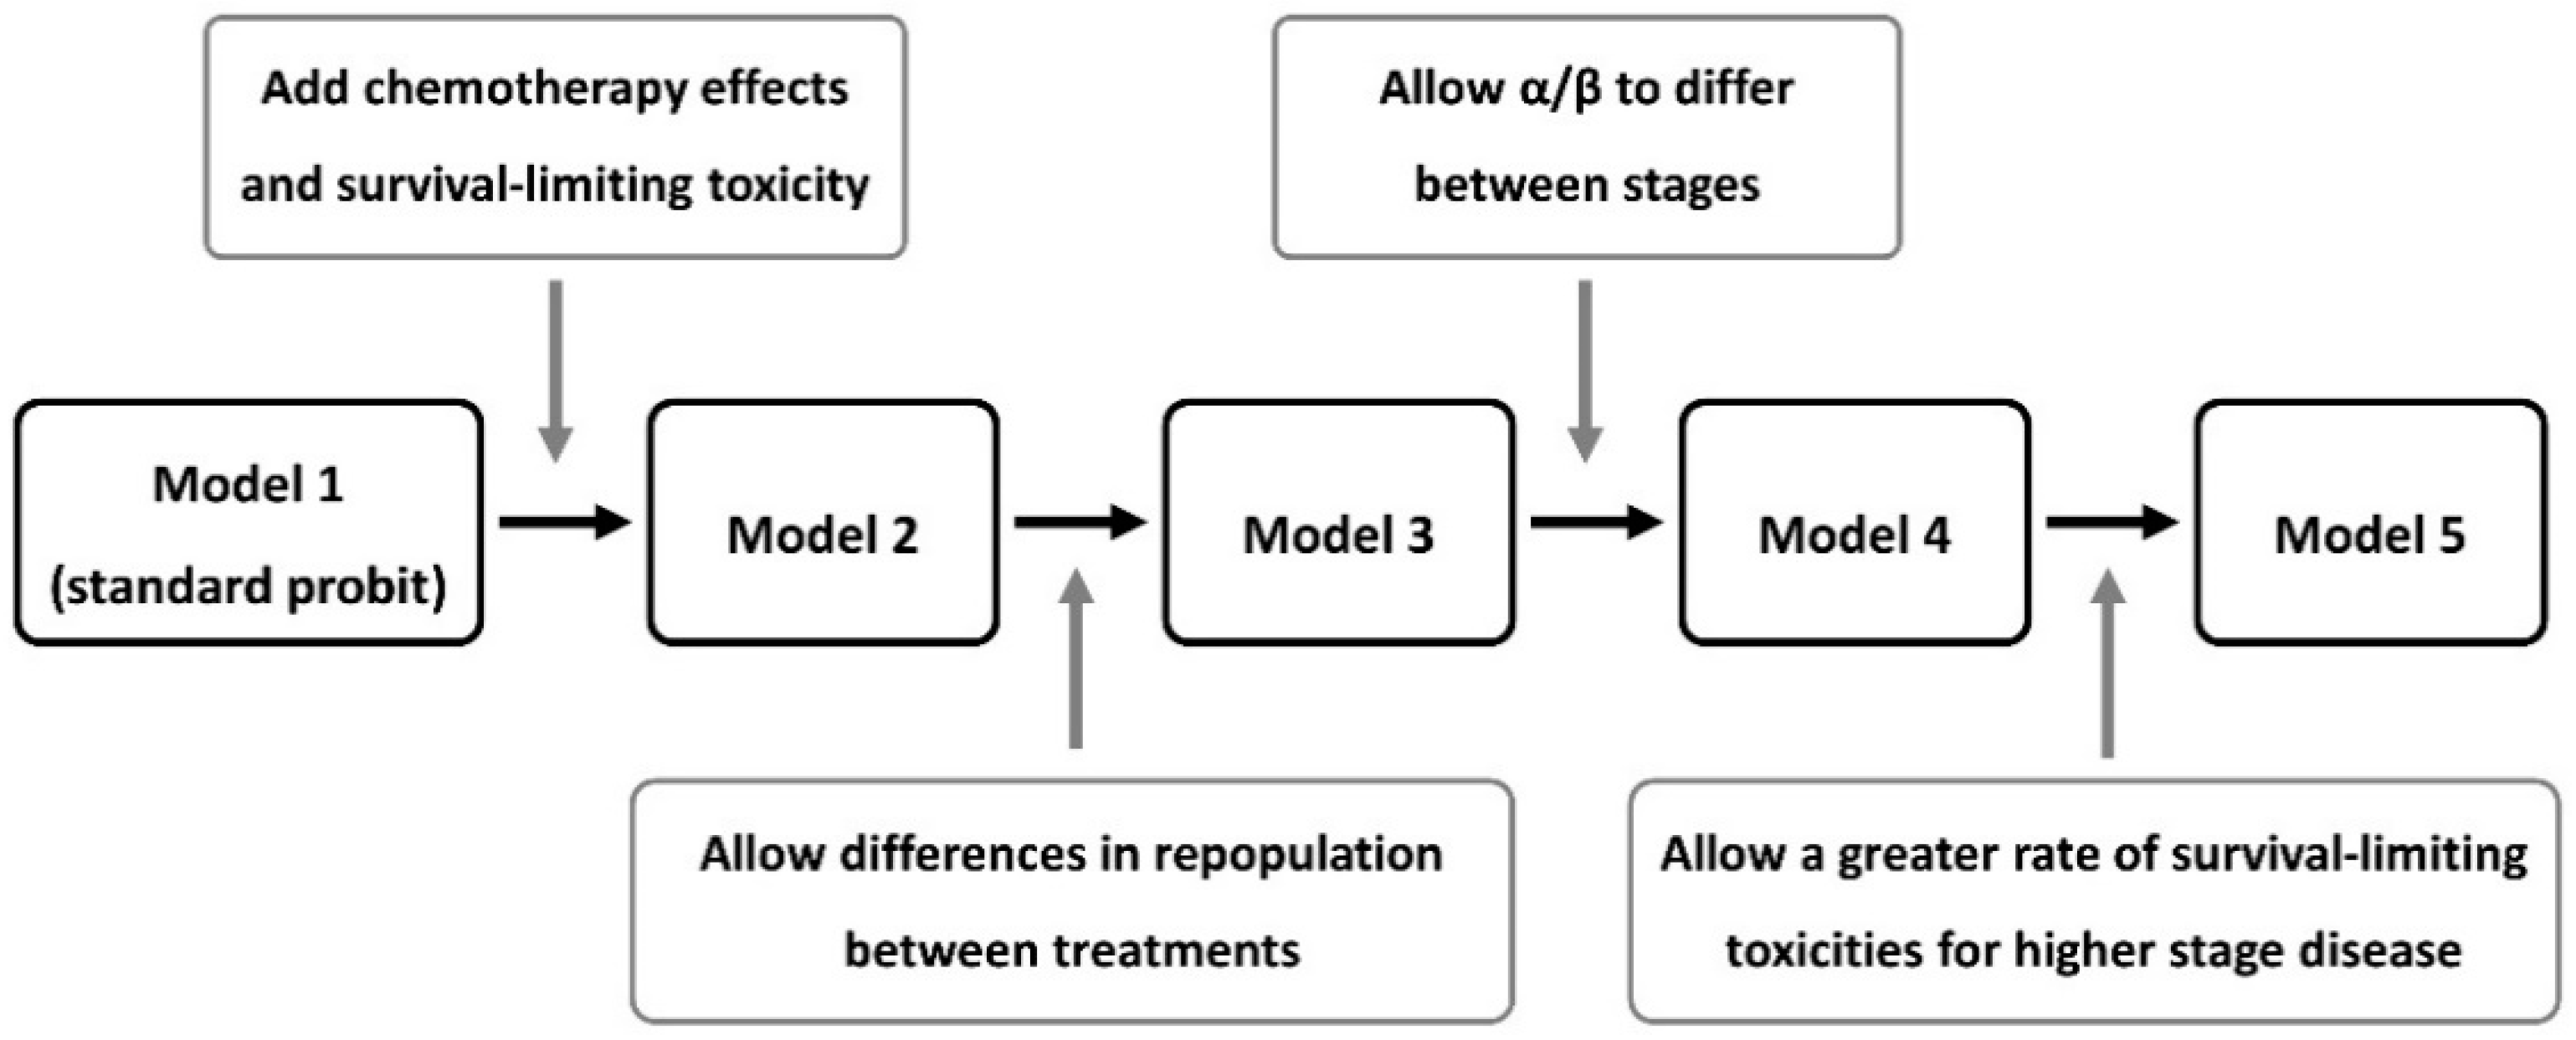
2.2. Dose-Response Models
2.2.1. Model 1: Standard Probit Dose-Response
2.2.2. Model 2: Nix Model including Chemotherapy, Survival-Limiting Toxicity and Date Effects
2.2.3. Model 3: Adding Treatment-Dependent Repopulation
2.2.4. Model 4: Adding Stage-Dependent Fractionation Dependence
2.2.5. Model 5: Adding Stage-Dependent Toxicity
2.3. Statistics
3. Results
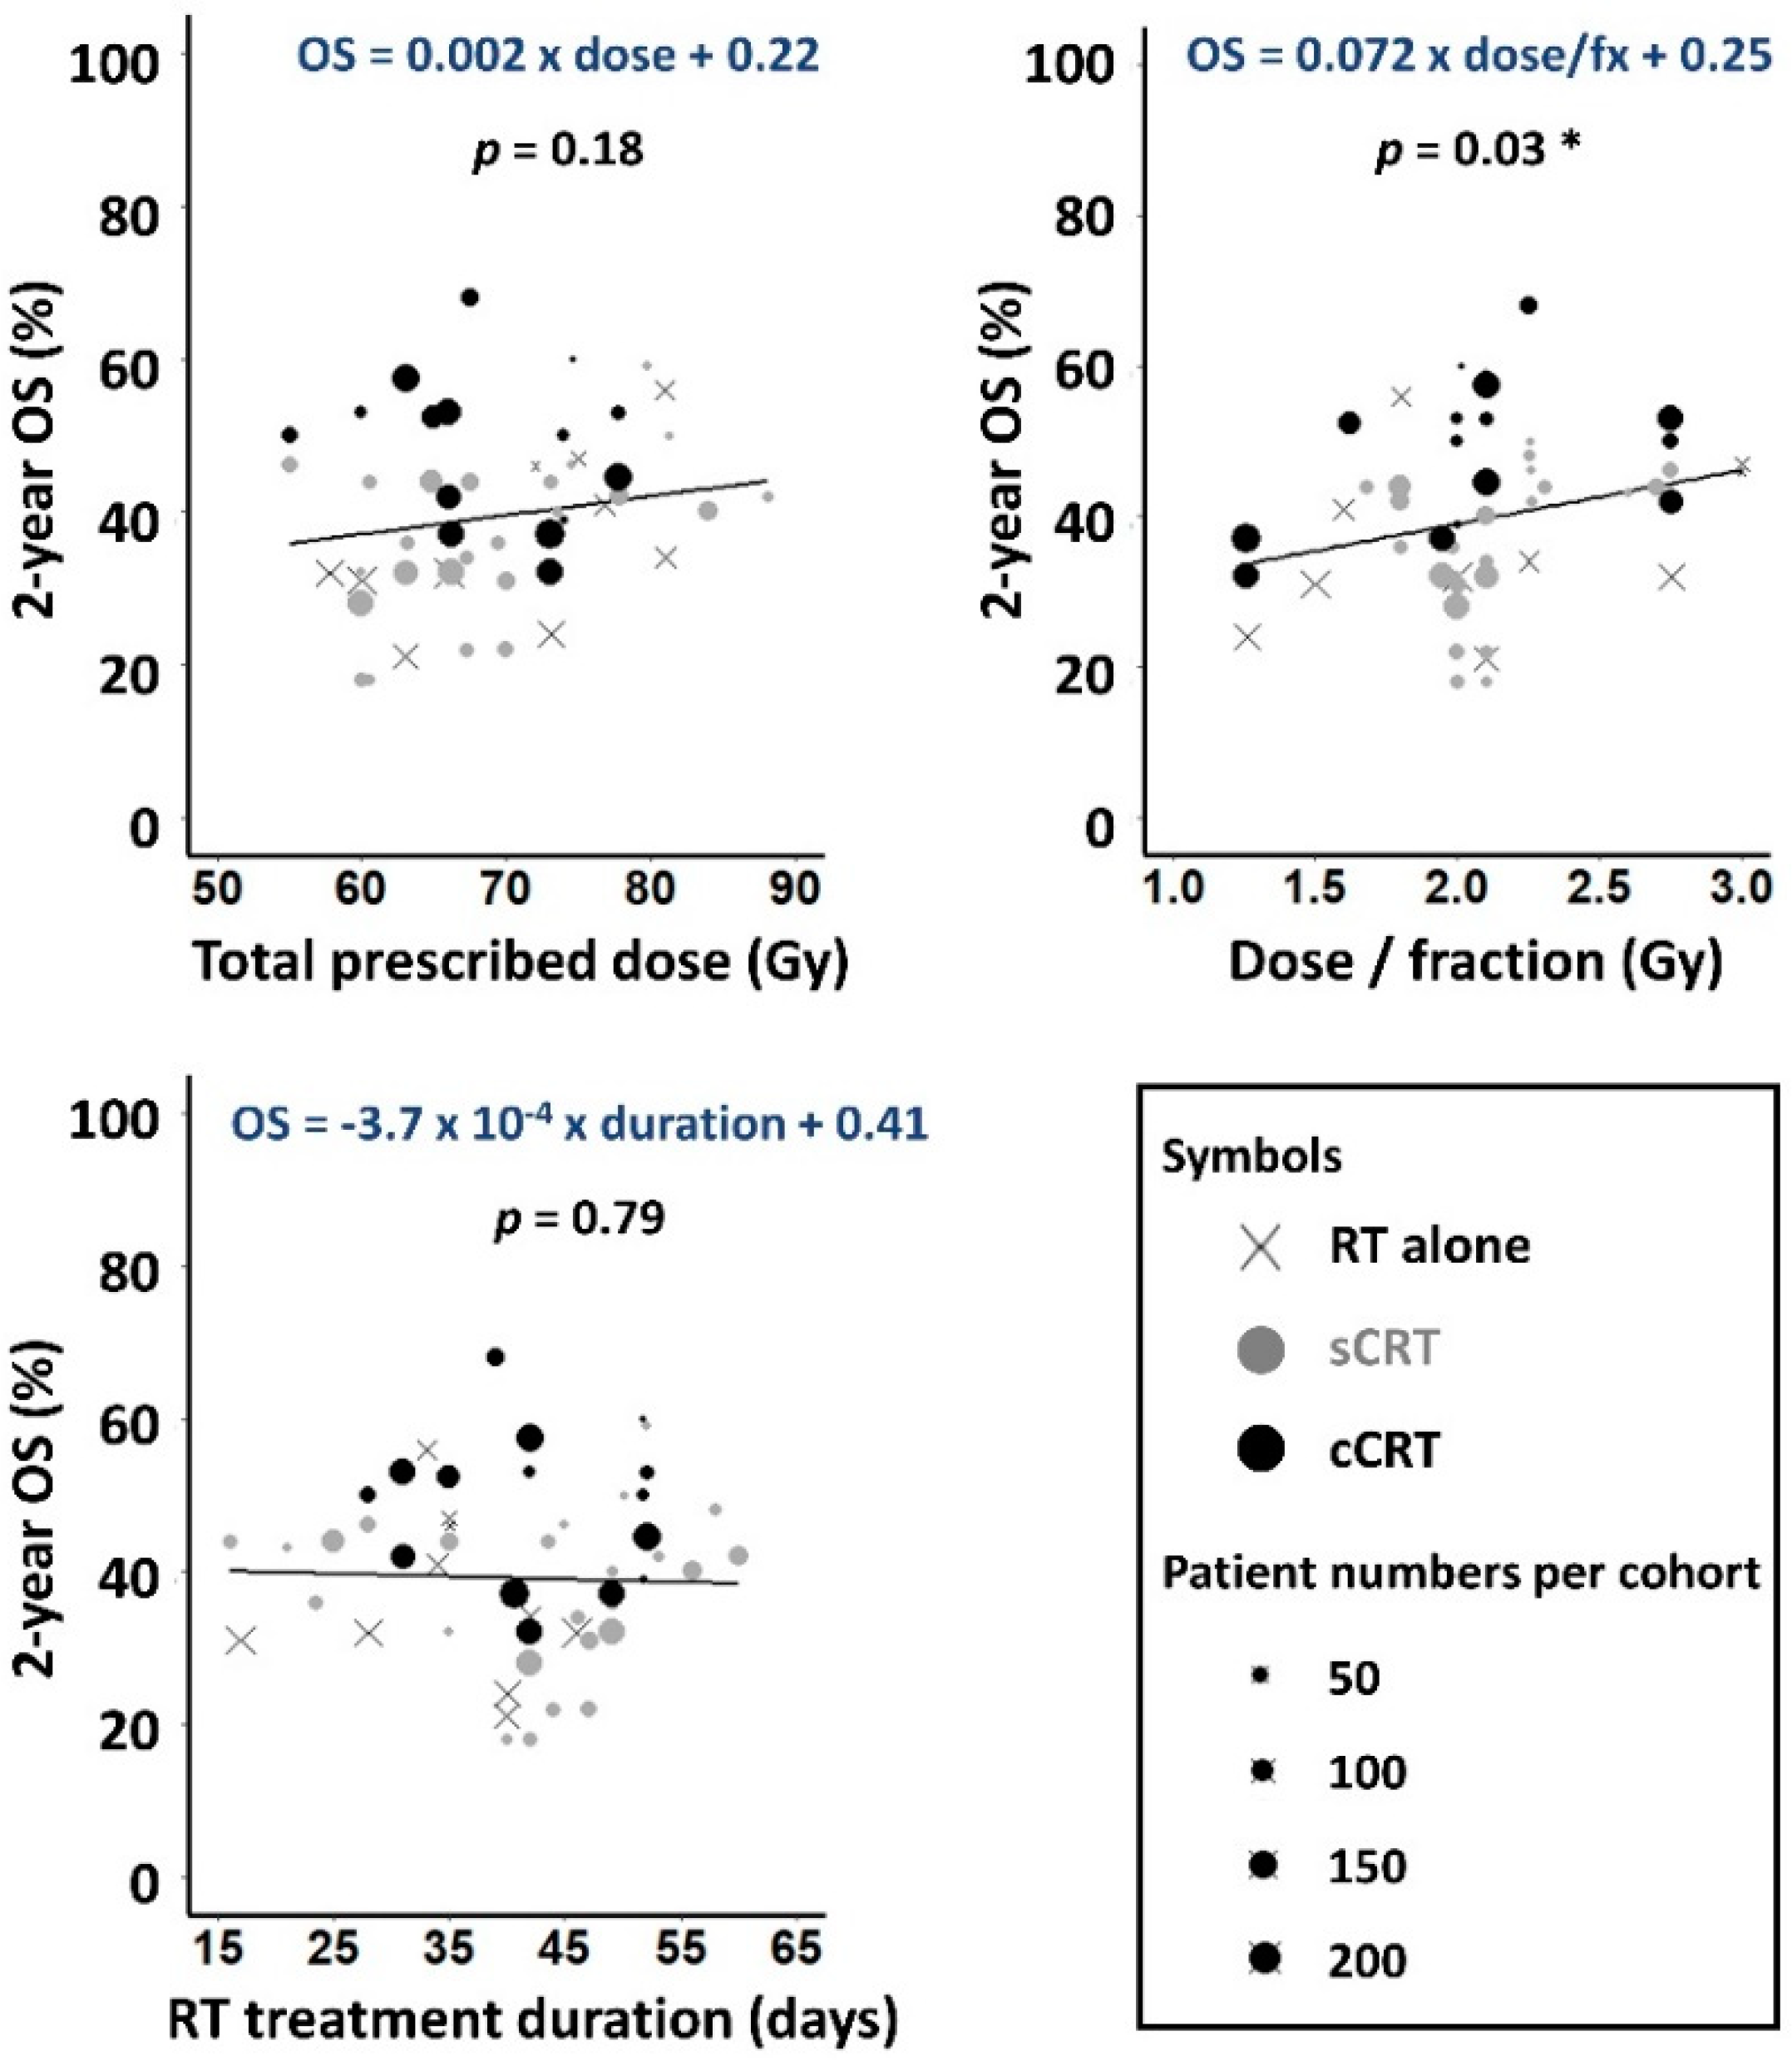
3.1. Data
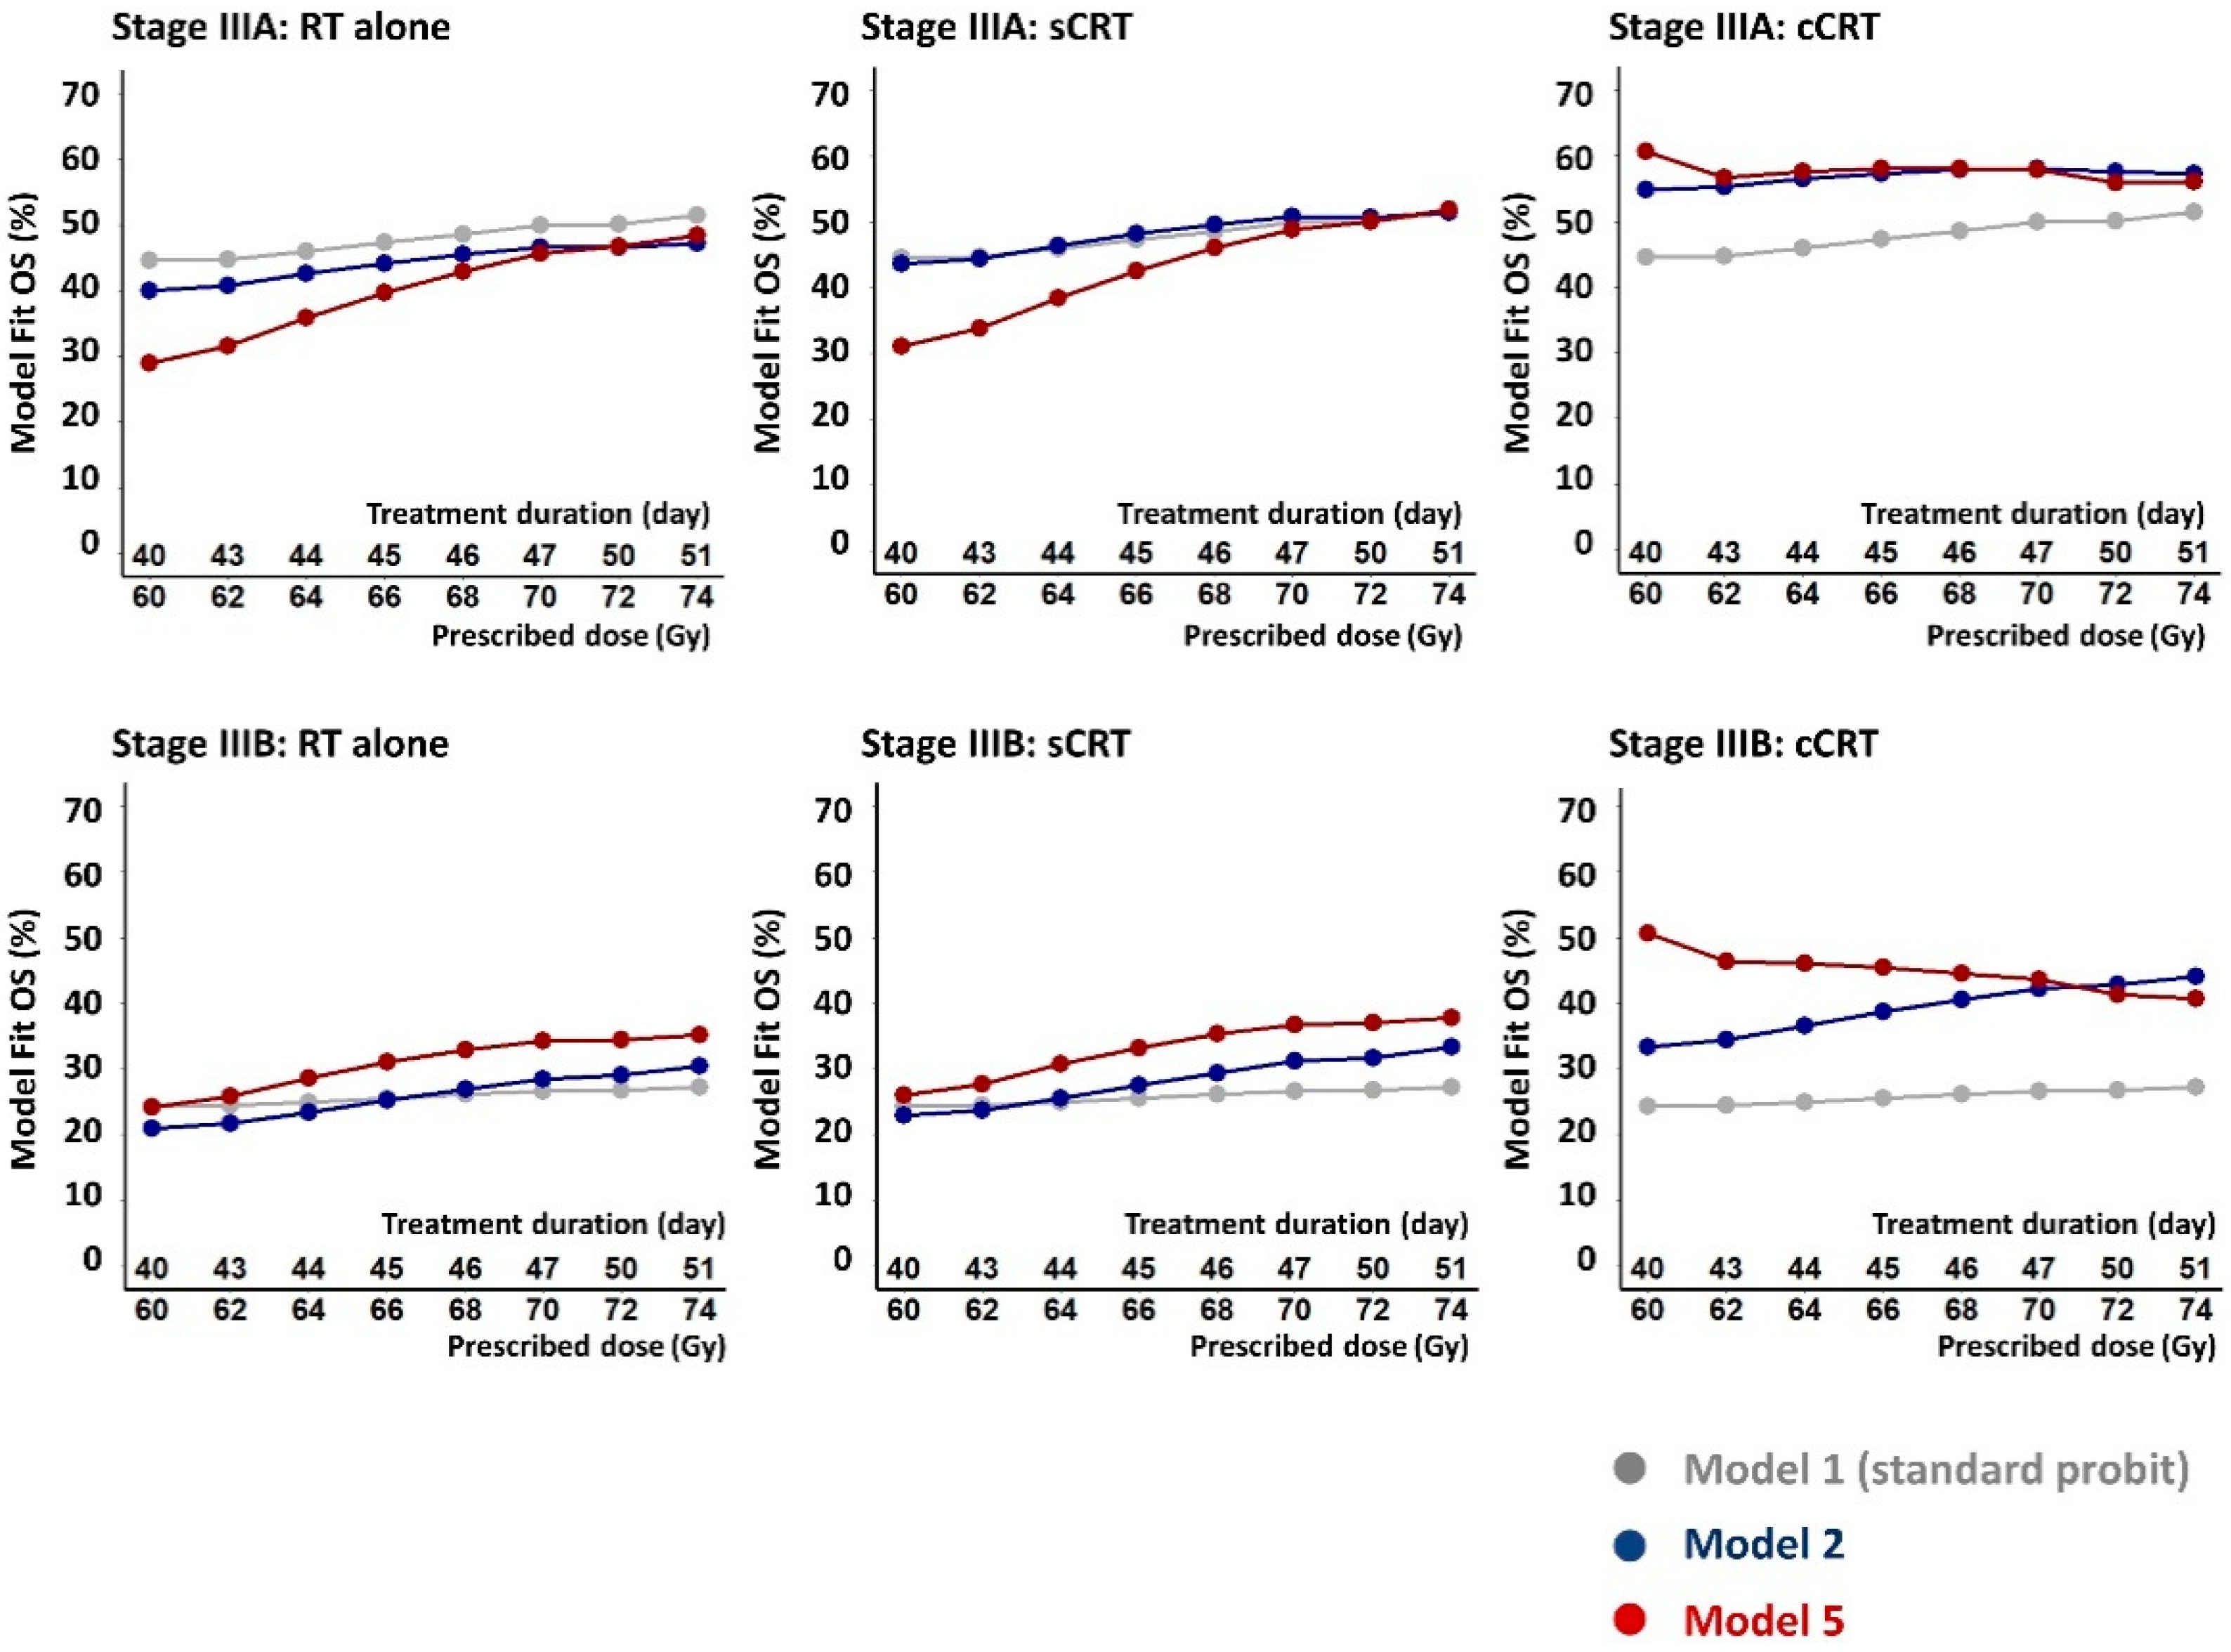
3.2. Model Fits
4. Discussion
4.1. Causes and Implications of the Rapid Repopulation Rate Fitted for cCRT
4.2. The Apparent Stage-Split in α/β
4.3. Fitted Survival-Limiting Toxicity Was Greater for Higher Stage Patients
4.4. Statistical Uncertainties
4.5. Study Limitations
4.6. Future Directions
5. Conclusions
Supplementary Materials
Author Contributions
Funding
Institutional Review Board Statement
Informed Consent Statement
Data Availability Statement
Acknowledgments
Conflicts of Interest
References
- Van Schil, P.E.; Hellmann, M.D.; Peters, S.; Guidelines, E. Metastatic Non-Small Cell Lung Cancer: ESMO Clinical Practice Guidelines for Diagnosis, Treatment and Follow-Up. Ann. Oncol. 2018, 29, iv192–iv237. [Google Scholar] [CrossRef]
- Cheng, M.; Jolly, S.; Quarshie, W.O.; Kapadia, N.; Vigneau, F.D.; Kong, F.M. Modern Radiation Further Improves Survival in Non-Small Cell Lung Cancer: An Analysis of 288,670 Patients. J. Cancer 2019, 10, 168–177. [Google Scholar] [CrossRef]
- Postmus, P.E.; Kerr, K.M.; Oudkerk, M.; Senan, S.; Waller, D.A.; Vansteenkiste, J.; Escriu, C.; Peters, S. Early and Locally Advanced Non-Small-Cell Lung Cancer (NSCLC): ESMO Clinical Practice Guidelines for Diagnosis, Treatment and Follow-Up. Ann. Oncol. 2017, 28, iv1–iv21. [Google Scholar] [CrossRef]
- Pless, M.; Stupp, R.; Ris, H.B.; Stahel, R.A.; Weder, W.; Thierstein, S.; Gerard, M.A.; Xyrafas, A.; Früh, M.; Cathomas, R.; et al. Induction Chemoradiation in Stage IIIA/N2 Non-Small-Cell Lung Cancer: A Phase 3 Randomised Trial. Lancet 2015, 386, 1049–1056. [Google Scholar] [CrossRef]
- Albain, K.S.; Swann, R.S.; Rusch, V.W.; Turrisi, A.T.; Shepherd, F.A.; Smith, C.; Chen, Y.; Livingston, R.B.; Feins, R.H.; Gandara, D.R.; et al. Radiotherapy plus Chemotherapy with or without Surgical Resection for Stage III Non-Small-Cell Lung Cancer: A Phase III Randomised Controlled Trial. Lancet 2009, 374, 379–386. [Google Scholar] [CrossRef]
- Din, O.S.; Lester, J.; Cameron, A.; Ironside, J.; Gee, A.; Falk, S.; Morgan, S.A.; Worvill, J.; Hatton, M.Q.F. Routine Use of Continuous, Hyperfractionated, Accelerated Radiotherapy for Non-Small-Cell Lung Cancer: A Five-Center Experience. Int. J. Radiat. Oncol. Biol. Phys. 2008, 72, 716–722. [Google Scholar] [CrossRef]
- Aupérin, A.; LePéchoux, C.; Rolland, E.; Curran, W.J.; Furuse, K.; Fournel, P.; Belderbos, J.; Clamon, G.; Ulutin, H.C.; Paulus, R.; et al. Meta-Analysis of Concomitant versus Sequential Radiochemotherapy in Locally Advanced Non-Small-Cell Lung Cancer. J. Clin. Oncol. 2010, 28, 2181–2190. [Google Scholar] [CrossRef]
- Stewart, L.A.; Pignon, J.P. Chemotherapy in Non-Small Cell Lung Cancer: A Meta-Analysis Using Updated Data on Individual Patients from 52 Randomised Clinical Trials. Br. Med. J. 1995, 311, 899–909. [Google Scholar] [CrossRef]
- Machtay, M.; Bae, K.; Movsas, B.; Paulus, R.; Gore, E.M.; Komaki, R.; Albain, K.; Sause, W.T.; Curran, W.J. Higher Biologically Effective Dose of Radiotherapy Is Associated with Improved Outcomes for Locally Advanced Non-Small Cell Lung Carcinoma Treated with Chemoradiation: An Analysis of the Radiation Therapy Oncology Group. Int. J. Radiat. Oncol. Biol. Phys. 2012, 82, 425–434. [Google Scholar] [CrossRef]
- Bradley, J.D.; Moughan, J.; Graham, M.V.; Byhardt, R.; Govindan, R.; Fowler, J.; Purdy, J.A.; Michalski, J.M.; Gore, E.; Choy, H. A Phase I/II Radiation Dose Escalation Study With Concurrent Chemotherapy for Patients With Inoperable Stages I to III Non-Small-Cell Lung Cancer: Phase I Results of RTOG 0117. Int. J. Radiat. Oncol. Biol. Phys. 2010, 77, 367–372. [Google Scholar] [CrossRef] [PubMed]
- Ramroth, J.; Cutter, D.J.; Darby, S.C.; Higgins, G.S.; McGale, P.; Partridge, M.; Taylor, C.W. Dose and Fractionation in Radiation Therapy of Curative Intent for Non-Small Cell Lung Cancer: Meta-Analysis of Randomized Trials. Int. J. Radiat. Oncol. Biol. Phys. 2016, 96, 736–747. [Google Scholar] [CrossRef]
- Bradley, J.D.; Paulus, R.; Komaki, R.; Masters, G.; Blumenschein, G.; Schild, S.; Bogart, J.; Hu, C.; Forster, K.; Magliocco, A.; et al. Standard-Dose versus High-Dose Conformal Radiotherapy with Concurrent and Consolidation Carboplatin plus Paclitaxel with or without Cetuximab for Patients with Stage IIIA or IIIB Non-Small-Cell Lung Cancer (RTOG 0617): A Randomised, Two-by-Two Factorial P. Lancet Oncol. 2015, 16, 187–199. [Google Scholar] [CrossRef]
- Partridge, M.; Ramos, M.; Sardaro, A.; Brada, M. Dose Escalation for Non-Small Cell Lung Cancer: Analysis and Modelling of Published Literature. Radiother. Oncol. 2011, 99, 6–11. [Google Scholar] [CrossRef]
- Nix, M.G.; Rowbottom, C.G.; Vivekanandan, S.; Hawkins, M.A.; Fenwick, J.D. Chemoradiotherapy of Locally-Advanced Non-Small Cell Lung Cancer: Analysis of Radiation Dose–Response, Chemotherapy and Survival-Limiting Toxicity Effects Indicates a Low α/β Ratio. Radiother. Oncol. 2020, 143, 58–65. [Google Scholar] [CrossRef] [PubMed]
- De Ruysscher, D.; van Baardwijk, A.; Wanders, R.; Hendriks, L.E.; Reymen, B.; van Empt, W.; Öllers, M.C.; Bootsma, G.; Pitz, C.; van Eijsden, L.; et al. Individualized Accelerated Isotoxic Concurrent Chemo-Radiotherapy for Stage III Non-Small Cell Lung Cancer: 5-Year Results of a Prospective Study. Radiother. Oncol. 2019, 135, 141–146. [Google Scholar] [CrossRef] [PubMed]
- Papanikolaou, N.; Battista, J.J.; Boyer, A.L.; Kappas, C.; Klein, E.; Mackie, T.R. AAPM Report 85:Tissue Inhomogeneity Corrections for Megavoltage Photon Beams. Report of the AAPM Radiation Therapy Committee Task Group 85; AAPM: Alexandria, VA, USA, 2004; ISBN 1888340479. [Google Scholar]
- Boyd, J.A.; Hubbs, J.L.; Kim, D.W.; Hollis, D.; Marks, L.B.; Kelsey, C.R. Timing of Local and Distant Failure in Resected Lung Cancer: Implications for Reported Rates of Local Failure. J. Thorac. Oncol. 2010, 5, 211–214. [Google Scholar] [CrossRef] [PubMed]
- Bolker, B. Maximum Likelihood Estimation and Analysis with the Bbmle Package. 2014. Available online: https://cran.r-project.org/package=bbmle (accessed on 22 February 2022).
- Ginestet, C. Ggplot2: Elegant Graphics for Data Analysis. J. R. Stat. Soc. Ser. A Stat. Soc. 2011, 174, 245–246. [Google Scholar] [CrossRef]
- Venzon, A.D.J.; Moolgavkar, S.H. A Method for Computing Profile-Likelihood-. J. R. Stat. Soc. Ser. C Appl. Stat. 1988, 37, 87–94. [Google Scholar]
- Pawitan, Y. In All Likelihood: Statistical Modelling and Inference Using Likelihood; Oxford University Press: Oxford, UK, 2001; ISBN 978-0199671229. [Google Scholar]
- Wei, T.; Simko, V. R Package ‘Corrplot’: Visualization of a Correlation Matrix (Version 0.84). Available online: https://cran.r-project.org/package=corrplot2017 (accessed on 22 February 2022).
- Okunieff, P.; Morgan, D.; Niemierko, A.; Suit, H.D. Radiation Dose-Response of Human Tumors. Int. J. Radiat. Oncol. Biol. Phys. 1995, 32, 1227–1237. [Google Scholar] [CrossRef]
- D’Alterio, C.; Scala, S.; Sozzi, G.; Roz, L.; Bertolini, G. Paradoxical Effects of Chemotherapy on Tumor Relapse and Metastasis Promotion. Semin. Cancer Biol. 2020, 60, 351–361. [Google Scholar] [CrossRef]
- Topkan, E.; Ozdemir, Y.; Kucuk, A.; Besen, A.A.; Mertsoylu, H.; Sezer, A.; Selek, U. Significance of Overall Concurrent Chemoradiotherapy Duration on Survival Outcomes of Stage IIIB/C Non-Small-Cell Lung Carcinoma Patients: Analysis of 956 Patients. PLoS ONE 2019, 14, 1–15. [Google Scholar] [CrossRef] [PubMed]
- Santiago, A.; Barczyk, S.; Jelen, U.; Engenhart-Cabillic, R.; Wittig, A. Challenges in Radiobiological Modeling: Can We Decide between LQ and LQ-L Models Based on Reviewed Clinical NSCLC Treatment Outcome Data? Radiat. Oncol. 2016, 11, 67. [Google Scholar] [CrossRef] [PubMed]
- Jeong, J.; Oh, J.H.; Sonke, J.J.; Belderbos, J.; Bradley, J.D.; Fontanella, A.N.; Rao, S.S.; Deasy, J.O. Modeling the Cellular Response of Lung Cancer to Radiation Therapy for a Broad Range of Fractionation Schedules. Clin. Cancer Res. 2017, 23, 5469–5479. [Google Scholar] [CrossRef] [PubMed]
- Klement, R.J.; Sonke, J.J.; Allgäuer, M.; Andratschke, N.; Appold, S.; Belderbos, J.; Belka, C.; Dieckmann, K.; Eich, H.T.; Flentje, M.; et al. Estimation of the α/β Ratio of Non-Small Cell Lung Cancer Treated with Stereotactic Body Radiotherapy. Radiother. Oncol. 2020, 142, 210–216. [Google Scholar] [CrossRef] [PubMed]
- Chen, D.; Patel, R.R.; Verma, V.; Ramapriyan, R.; Barsoumian, H.B.; Cortez, M.A.; Welsh, J.W. Interaction between Lymphopenia, Radiotherapy Technique, Dosimetry, and Survival Outcomes in Lung Cancer Patients Receiving Combined Immunotherapy and Radiotherapy. Radiother. Oncol. 2020, 150, 114–120. [Google Scholar] [CrossRef] [PubMed]
- Robinson, A.G.; Young, K.; Balchin, K.; Ashworth, A.; Owen, T. Causes of Death and Subsequent Treatment after Initial Radical or Palliative Therapy of Stage III Non-Small-Cell Lung Cancer. Curr. Oncol. 2015, 22, 333–340. [Google Scholar] [CrossRef]
- DeRuysscher, D.; Faivre-Finn, C.; Moeller, D.; Nestle, U.; Hurkmans, C.W.; LePéchoux, C.; Belderbos, J.; Guckenberger, M.; Senan, S. European Organization for Research and Treatment of Cancer (EORTC) Recommendations for Planning and Delivery of High-Dose, High Precision Radiotherapy for Lung Cancer. Radiother. Oncol. 2017, 124, 1–10. [Google Scholar] [CrossRef]
- Jin, J.; Hu, C.; Xiao, Y.; Zhang, H.; Paulus, R.; Ellsworth, S.G.; Schild, S.E.; Bogart, J.A.; Dobelbower, M.C.; Kavadi, V.S.; et al. Higher Radiation Dose to the Immune Cells Correlates with Worse Tumor Control and Overall Survival in Patients with Stage III NSCLC: A Secondary Analysis of RTOG0617. Cancers 2021, 13, 6193. [Google Scholar] [CrossRef]
- Anderson, D.R.; Burnham, K.P.; White, G.C. AIC model selection in overdispersed cature-recapture data. Ecology 1994, 75, 1780–1793. [Google Scholar] [CrossRef]
- Roberts, S.A.; Hendry, J.H.; Potten, C.S. Intestinal crypt clonogens: A new interpretation of radiation survival curve shapes and clonogenic cell number. Cell Prolif. 2003, 36, 215–231. [Google Scholar] [CrossRef]
- Richards, S.A. Dealing with overdispersed count data in applied ecology. J. Appl. Ecol. 2008, 45, 218–227. [Google Scholar] [CrossRef]
- Boffa, D.J. The Revised Stage Classification System for Primary Lung Cancer. Clin. Chest Med. 2011, 32, 741–748. [Google Scholar] [CrossRef] [PubMed]
- Antonia, S.J.; Villegas, A.; Daniel, D.; Vicente, D.; Murakami, S.; Hui, R.; Kurata, T.; Chiappori, A.; Lee, K.H.; DeWit, M.; et al. Overall Survival with Durvalumab after Chemoradiotherapy in Stage III NSCLC. N. Engl. J. Med. 2018, 379, 2342–2350. [Google Scholar] [CrossRef]


| RT Alone | sCRT | cCRT | Total | |
|---|---|---|---|---|
| Cohorts | 10 | 26 | 15 | 51 |
| Patient numbers | ||||
| Stage I | 116 | 127 | 3 | 246 (5.1%) |
| Stage II | 72 | 85 | 59 | 216 (4.4%) |
| Stage IIIA | 514 | 732 | 1020 | 2266 (46.6%) |
| Stage IIIB | 490 | 848 | 800 | 2138 (43.9%) |
| Total | 1192 (24.5%) | 1792 (36.8%) | 1882 (38.7%) | 4866 (100%) |
| Histology * (% of patients): squamous cell carcinoma/adenocarcinoma/other NSCLC | ||||
| 49.4/24.2/26.4 | 42.5/32.8/24.7 | 38.2/31.0/30.8 | 42.6/29.6/27.8 | |
| RT technique (# of cohorts): rectangular field RT/conformal RT/intensity-modulated RT † | ||||
| 2/7/1 | 3/22/1 | 0/11/4 | 5/40/6 | |
| IIIB/IIIA patient ratio in each cohort: mean (range) | ||||
| 0.92 (0–1.92) | 1.22 (0–2.89) | 0.83 (0.16–1.72) | 1.05 (0–2.89) | |
| Prescribed dose †† (Gy): mean (range) | ||||
| 71 (58–81) | 70 (55–95) | 69 (55–78) | 70 (55–95) | |
| RT fractions (#): mean (range) | ||||
| 36 (20–58) | 33 (20–43) | 36 (20–58) | 35 (20–58) | |
| Dose-per-fraction †† (Gy): mean (range) | ||||
| 2.0 (1.3–3.0) | 2.0 (1.7–2.8) | 2.0 (1.3–2.8) | 2.0 (1.3–3.0) | |
| RT duration (days): mean (range) | ||||
| 35 (17–46) | 42 (16–60) | 43 (28–52) | 41 (16–60) | |
| OS2-year (%): mean (range) | ||||
| 36 (21–56) | 37 (18–59) | 49 (32–68) | 41 (18–68) | |
| Parameters | Model 1 | Model 2 | Model 5 |
|---|---|---|---|
| (df = 43) | (df = 38) | (df = 30) | |
| λ * (Gy/day) | 0.64 (0.30–0.99) | 0.40 (0.23–0.72) | RT & sCRT: 0.30 (0.18–0.47) |
| cCRT: 1.47 (0.36–2.57) | |||
| Tk * (days) | 33 (18–39) | 25 (16 †–36) | RT & sCRT: 17 (16 †–32) |
| cCRT: 24 (16 †–47) | |||
| α/β * (Gy) | 4.0 (2.1–9.2) | 3.0 (1.6–5.6) | SI & SII: 10.0 (0.6–infinite) |
| SIIIA: 32.1 (9.0–infinite) | |||
| SIIIB: 0.6 (−0.2–1.0) | |||
| EQD2,tum50 (Gy) †† | SI: 74 (66–81) | 48 (13–53) | 54 (49–58) |
| SII: 74 (66–84) | 48 (19–52) | 54 (49–58) | |
| SIIIA: 74 (66–84) | 49 (42–54) | 54 (49–58) | |
| SIIIB: 88 (75–103) | 61 (52–69) | 54 (49–58) | |
| m | 0.72 (0.64–1.00 †) | 0.28 (0.19–0.47) | 0.15 (0.12–0.24) |
| OSmax(CRT) (%) | - | 93 (85 †–100 †) | 91 (85 †–100 †) |
| RS(cCRT) | - | 1.11 (1.05–1.22) | 1.40 (0.99–1.40 †) |
| EQD2,NT50 (Gy) | - | 96 (83–116) | 54 (26–104) |
| mNT | - | 0.60 (0.45–1.00†) | 0.31 (0.11–1 †) |
| R (per year) | - | 0.016 (0.006–0.022) | 0.016 (0.012–0.026) |
| FSLT†† | - | - | SI: 0.33 (0 †–0.78) |
| SII: 0.33 (0 †–0.86) | |||
| SIIIA: 0.41 (0.20–1 †) | |||
| SIIIB: 0.58 (0.35–1 †) | |||
| −2 log-likelihood | 6468.6 | 6364.8 | 6329.4 |
| (p < 10−20 cf Model 1) | (p < 10−22 and 10−4 | ||
| cf Models 1 and 2) | |||
| AIC score | 6485 | 6391 | 6371 |
| Cross-validation | 65.2 | 26.7 | 12.7 |
| score |
Publisher’s Note: MDPI stays neutral with regard to jurisdictional claims in published maps and institutional affiliations. |
© 2022 by the authors. Licensee MDPI, Basel, Switzerland. This article is an open access article distributed under the terms and conditions of the Creative Commons Attribution (CC BY) license (https://creativecommons.org/licenses/by/4.0/).
Share and Cite
Huang, H.-T.; Nix, M.G.; Brand, D.H.; Cobben, D.; Hiley, C.T.; Fenwick, J.D.; Hawkins, M.A. Dose-Response Analysis Describes Particularly Rapid Repopulation of Non-Small Cell Lung Cancer during Concurrent Chemoradiotherapy. Cancers 2022, 14, 4869. https://doi.org/10.3390/cancers14194869
Huang H-T, Nix MG, Brand DH, Cobben D, Hiley CT, Fenwick JD, Hawkins MA. Dose-Response Analysis Describes Particularly Rapid Repopulation of Non-Small Cell Lung Cancer during Concurrent Chemoradiotherapy. Cancers. 2022; 14(19):4869. https://doi.org/10.3390/cancers14194869
Chicago/Turabian StyleHuang, Huei-Tyng, Michael G. Nix, Douglas H. Brand, David Cobben, Crispin T. Hiley, John D. Fenwick, and Maria A. Hawkins. 2022. "Dose-Response Analysis Describes Particularly Rapid Repopulation of Non-Small Cell Lung Cancer during Concurrent Chemoradiotherapy" Cancers 14, no. 19: 4869. https://doi.org/10.3390/cancers14194869
APA StyleHuang, H.-T., Nix, M. G., Brand, D. H., Cobben, D., Hiley, C. T., Fenwick, J. D., & Hawkins, M. A. (2022). Dose-Response Analysis Describes Particularly Rapid Repopulation of Non-Small Cell Lung Cancer during Concurrent Chemoradiotherapy. Cancers, 14(19), 4869. https://doi.org/10.3390/cancers14194869