Article

FAP-Specific Signalling Is an Independent Diagnostic Approach in ACC and Not a Surrogate Marker of MRI Sequences

1
Department of Nuclear Medicine, University Hospital Heidelberg, 69120 Heidelberg, Germany
2
Division of Radiology, German Cancer Research Center (DKFZ), 69120 Heidelberg, Germany
3
Department of Radiation Oncology, University Hospital Heidelberg, 69120 Heidelberg, Germany
4
Department of Pathology, University Hospital Heidelberg, 69120 Heidelberg, Germany
5
Department of Nuclear Medicine, University Hospital Düsseldorf, 40225 Düsseldorf, Germany
6
Department of Neuroradiology, University Hospital Heidelberg, 69120 Heidelberg, Germany
7
Translational Lung Research Center Heidelberg (TLRC), Part of the German Center for Lung Research DZL, 69120 Heidelberg, Germany
8
Clinical Cooperation Unit Nuclear Medicine, German Cancer Research Center (DKFZ), 69120 Heidelberg, Germany
9
Clinic for Neuroradiology, University Hospital Bonn, 53175 Bonn, Germany
*
Author to whom correspondence should be addressed.
These authors contributed equally to this work.
Cancers 2022, 14(17), 4253; https://doi.org/10.3390/cancers14174253
Submission received: 21 June 2022 / Revised: 29 July 2022 / Accepted: 18 August 2022 / Published: 31 August 2022
(This article belongs to the Special Issue FAP-Ligands and Its Clinical Translation in Cancers)

Abstract

:

Simple Summary

Fibroblast Activation Protein (FAP) is a new target for positron emission tomography and computed tomography (PET/CT) imaging of epithelial tumours, such as adenoid cystic carcinomas (ACCs). The current gold standard for ACC imaging is contrast enhanced (ce) MRI, where intertumoural heterogeneity leads to variable appearance on T1-weighted (T1w) and T2-weighted (T2w) images. The correlation of 68Gallium (68Ga)-labelled FAP-Inhibitor (FAPI) PET signals and MRI signals (contrast-enhanced T1w and T2w) of ACCs has not been described yet. Here, we analysed the correlation of 68Ga-FAPI PET signals and MRI signals of 12 ACC patients. 68Ga-FAPI PET signals showed a very weak positive correlation with ceT1w values (pooled correlation 0.114, 0.147 and 0.162 at 10, 60 and 180 min) and a weak negative correlation with T2w values. These results underline that 68Ga-FAPI PET signalling is not only a surrogate marker of MRI sequences but an independent signal in ACC patients.

Abstract

Background: Fibroblast Activation Protein (FAP) is a new target for positron emission tomography and computed tomography (PET/CT) imaging of epithelial tumours embedded in a fibrous stroma. Adenoid cystic carcinomas (ACCs) have shown elevated tracer uptake in 68Gallium (68Ga)-labelled FAPIs in previous studies. The current gold standard for ACC imaging is contrast-enhanced (ce) MRI, where intertumoural heterogeneity leads to variable appearance on T1-weighted (T1w) and T2-weighted (T2w) images. In this retrospective analysis, we correlated 68Ga-FAPI PET signalling at three time points with ceT1w and T2w MRI signals to further characterise the significance of 68Ga-FAPI uptake in ACCs. Methods: Clinical PET/CT scans of 12 ACC patients were performed at 10, 60 and 180 min post i.v. administration of 68Ga-labelled-FAPI tracer molecules. 68Ga-PET- and corresponding MRI-scans were co-registered, and 3D volumetric segmentations were performed on ceT1w and T2w lesions of co-registered MRI slides. Signal intensity values of 68Ga-FAPI PET signalling and ceT1w/T2w MRI scans were analysed for their pixelwise correlation in each patient. Pooled estimates of the correlation coefficients were calculated using the Fisher z-transformation. Results: 68Ga-FAPI PET signals showed a very weak positive correlation with ceT1w values (pooled correlation 0.114, 0.147 and 0.162 at 10, 60 and 180 min) and a weak negative correlation with T2w values (pooled correlation −0.148, −0.121 and −0.225 at 10, 60 and 180 min). Individual r-values at 60 min ranged from −0.130 to 0.434 in ceT1w and from −0.466 to 0.637 in T2w MRI scans. Conclusion: There are only slight correlations between the intensity of 68Ga-FAPI PET signals and tumour appearance in ceT1w or T2w MRI scans, which underlines that 68Ga-FAPI PET signalling is not a surrogate marker of MRI sequences but an independent signal.

1. Introduction

Adenoid cystic carcinoma (ACC) is a rare head and neck malignancy, comprising 1% of all head and neck tumours [1]. It is notorious for its slow but invasive growth, high incidence of distant metastases and early perineural spread [2,3].
Histologically, ACCs are composed of basaloid epithelial cells embedded in a fibrous stroma, displaying three morphological subtypes: cribriform (cell nests containing cystlike spaces), tubular (bilayered tubules infiltrating a tumour stroma) and solid (cell aggregates without pseudocysts or lumina) [1,4,5]. These three histological subtypes often appear simultaneously in varying proportions [6,7].
Magnetic resonance imaging (MRI) persists as the mainstay of ACC imaging due to its high soft tissue contrast and high sensitivity of detection of perineural invasion [8]. However, all three histological subtypes of ACC have a varied appearance on MRI with heterogenous appearance in both contrast-enhanced (ce) T1-weighted (T1w) and T2-weighted (T2w) MRI [9].
Cancer-associated fibroblasts (CAFs) in the tumour stroma play a crucial role in the infiltrative nature and tumour progression of ACC [10,11]. A commonly used marker to identify CAF populations is the serine protease fibroblast activation protein (FAP), which is highly expressed in the majority of CAFs [12] and also in activated fibroblasts in sites of fibrosis, wound healing and inflammation [13].
New tracer molecules based on FAP inhibitors (FAPI) have been developed for positron emission tomography and computed tomography (PET/CT) imaging [14,15]. 68Gallium (68Ga)-FAPI PET/CT as a new and highly promising imaging modality for ACCs has been demonstrated by our group in a previous publication. We showed that the specific and high uptake of 68Ga-FAPI in ACCs led to upstaging in several cases and more accurate radiation planning [16].
The purpose of this work is to correlate the uptake of 68Ga-labelled FAPI tracers with ceT1w and T2w MRI signalling by pixelwise analysis. We hypothesised that 68Ga-FAPIPET signalling is not only a surrogate marker of MRI sequences but an independent signal. A secondary question is how MRI signal intensities correlate with 68Ga-FAPI uptake at different acquisition time points (10, 60 and 180 min post injection).

2. Materials and Methods

2.1. Patient Cohort

Twelve patients with histologically confirmed adenoid cystic carcinoma were included in this retrospective analysis. Informed consent was obtained according to the regulations of the German Pharmaceuticals Act §13 (2b). These patients were referred by their treating oncologist to assist in diagnostic decision making. A total of 7 patients were treatment-naïve, 4 patients had recurrences after surgical resection and 1 patient had a recurrence after definitive radiotherapy. Table 1 gives an overview of the clinical information which was retrieved from the patient charts.

2.2. Radiochemistry

Synthesis and labelling of 68Ga-FAPI-2 (n = 2), 68Ga-FAPI-46 (n = 7) and 68Ga-FAPI-74 (n = 3) followed the methods described by Loktev et al. [14,17]. All solvents and non-radioactive reagents were obtained in reagent grade from abcr (Karlsruhe, Germany), Sigma-Aldrich (Munich, Germany), Acros Organics (Geel, Belgium) and VWR (Bruchsal, Germany) and were used without further purification. The chelator DOTA-PNP (2,2′,2′’-(10-(2-4-nitrophenyl)oxy)-2-oxoethyl)-1,4,7,10-tetraazacyclododecane-1,4,7triyl)triacetic acid) was synthesised according to the protocols published by Mier et al. [18].
Radioactive gallium (68Ga) was eluted from a 68Ge/68Ga generator purchased from Themba Labs (Somerset West, South Africa). Labelling was performed according to previously published protocols [14].

2.3. Image Acquisition

A Biograph mCT Flow scanner (Siemens Healthineers, Erlangen, Germany) was used for PET imaging. Scans were performed according to previously published protocols [19,20]. After unenhanced low-dose CT (130 keV, 30 mAs, CARE Dose (Siemens); reconstructed with a soft-tissue kernel to a slice thickness of 5 mm), PET was acquired in three-dimensional mode (matrix, 200 × 200) using FlowMotion (Siemens). The emission data were corrected for randoms, scatter and decay. Reconstruction was performed with ordered-subset expectation maximization using 2 iterations and 21 subsets and Gauss filtration to a transaxial resolution of 5 mm in full width at half maximum. Attenuation correction was performed using the unenhanced low-dose CT data. The injected activity for the 68Ga-FAPI examinations was 177–285 MBq (details provided in Table 2), and the PET scans were taken at 10, 60 and 180 min after injection. Three patients did not complete the imaging protocol at the three timepoints due to patient status and/or imaging constraints.
The acquisition of MRI scans was performed at 3T, employing the following previously published parameters [21]: T1-weighted GdCE MRI (GdCE-T1) (echo time (TE) = 4.04 ms; repetition (RM1) time (TR) = 1710 ms; field of view (FoV) in mm2: 256 × 256; matrix: 512 × 512; slice thickness: 1 mm, transaxial resolution 0.85 mm) and T2-weighted MRI turbo spin echo (TSE) (TE = 86 ms; TR = 5550 ms; FoV: 229 × 172 mm2; matrix: 384 × 230; slice thickness: 5 mm, transaxial resolution 0.75 mm). The time interval between 68Ga-FAPI PET/CT and MRI scans of the head and neck was on average 20.8 days.

2.4. Co-Registration of 68Ga-FAPI PET/CT and MRI Scans

68Ga-FAPI PET/CT scans at all timepoints were co-registered on both T1w and T2w MRI scans, respectively, using a rigid co-registration tool in PMOD (Zurich, Switzerland) and corrected manually if necessary. Regions of interest were manually drawn on transaxial MRI images based on morphological appearance and automatically converted to a 3D volume of interest (VOI). The VOI was corroborated by a board-certified nuclear medicine physician (MR) and board-certified radiologist (DP). The pixel data of 68Ga-FAPI PET and MRI signal intensity was extracted using the Pixeldump tool of the PMOD software.

2.5. Statistics

The pixelwise analysis of co-registered PET/CT and MRI scans was performed with Fisher z-test. Pooled estimates of the Pearson correlation coefficients (r) of all patients at each respective timepoint were calculated using the Fisher z-transformation [22]. We interpreted the Pearson correlation coefficient as suggested by Cohen [23], where r ≈ 0 means no correlation, r ≈ ±0.1 a weak correlation, r ≈ ±0.3 a moderate correlation and r ≈ ±0.5 a strong correlation.
A p-value of <0.05 was defined as statistically significant. All statistical analyses were performed using Microsoft Excel 2010.

3. Results

3.1. Description of the Results

3.1.1. Very Weak Positive Correlation of 68Ga-FAPI PET and CeT1w Signalling in ACCs

68Ga-FAPI PET uptake showed a very weak positive correlation with ceT1w signal intensity (pooled correlation 0.114, 0.147 and 0.162 at 10, 60 and 180 min). Pooled r-values at 10 min (−0.312 to 0.470), 60 min (−0.130 to 0.434) and 180 min (−0.112 to 0.452) are displayed in Table 3. The correlation of 68Ga-FAPI uptake and ceT1w signal intensity had a slight tendency towards increasing positive correlation coefficients (Figure 1). Previous treatment does not appear to affect the correlation of 68Ga-FAPI uptake and ceT1w signal intensities at 60 min (treated: z corr r = −0.080–0.354; treatment-naïve: z corr r = −0.130–0.434).

3.1.2. Weak Negative Correlation of 68Ga-FAPI PET and T2w Signalling in ACCs

68Ga-FAPI PET uptake showed a weak negative correlation with T2w signal intensity (pooled correlation −0.148, −0.121 and −0.225 at 10, 60 and 180 min). Pooled r-values at 10 min (−0.559 to 0.156), 60 min (−0.466 to 0.637) and 180 min (−0.462 to −0.071) are displayed in Table 4.
Correlation of 68Ga-FAPI uptake and T2w signal intensity does not seem to have any discernible trend across time (Figure 1). Treatment does not appear to affect the correlation of 68Ga-FAPI uptake and T2w signal intensities (treated: z corr r = −0.466–0.637; treatment-naïve: z corr r = −0.453–0.125).
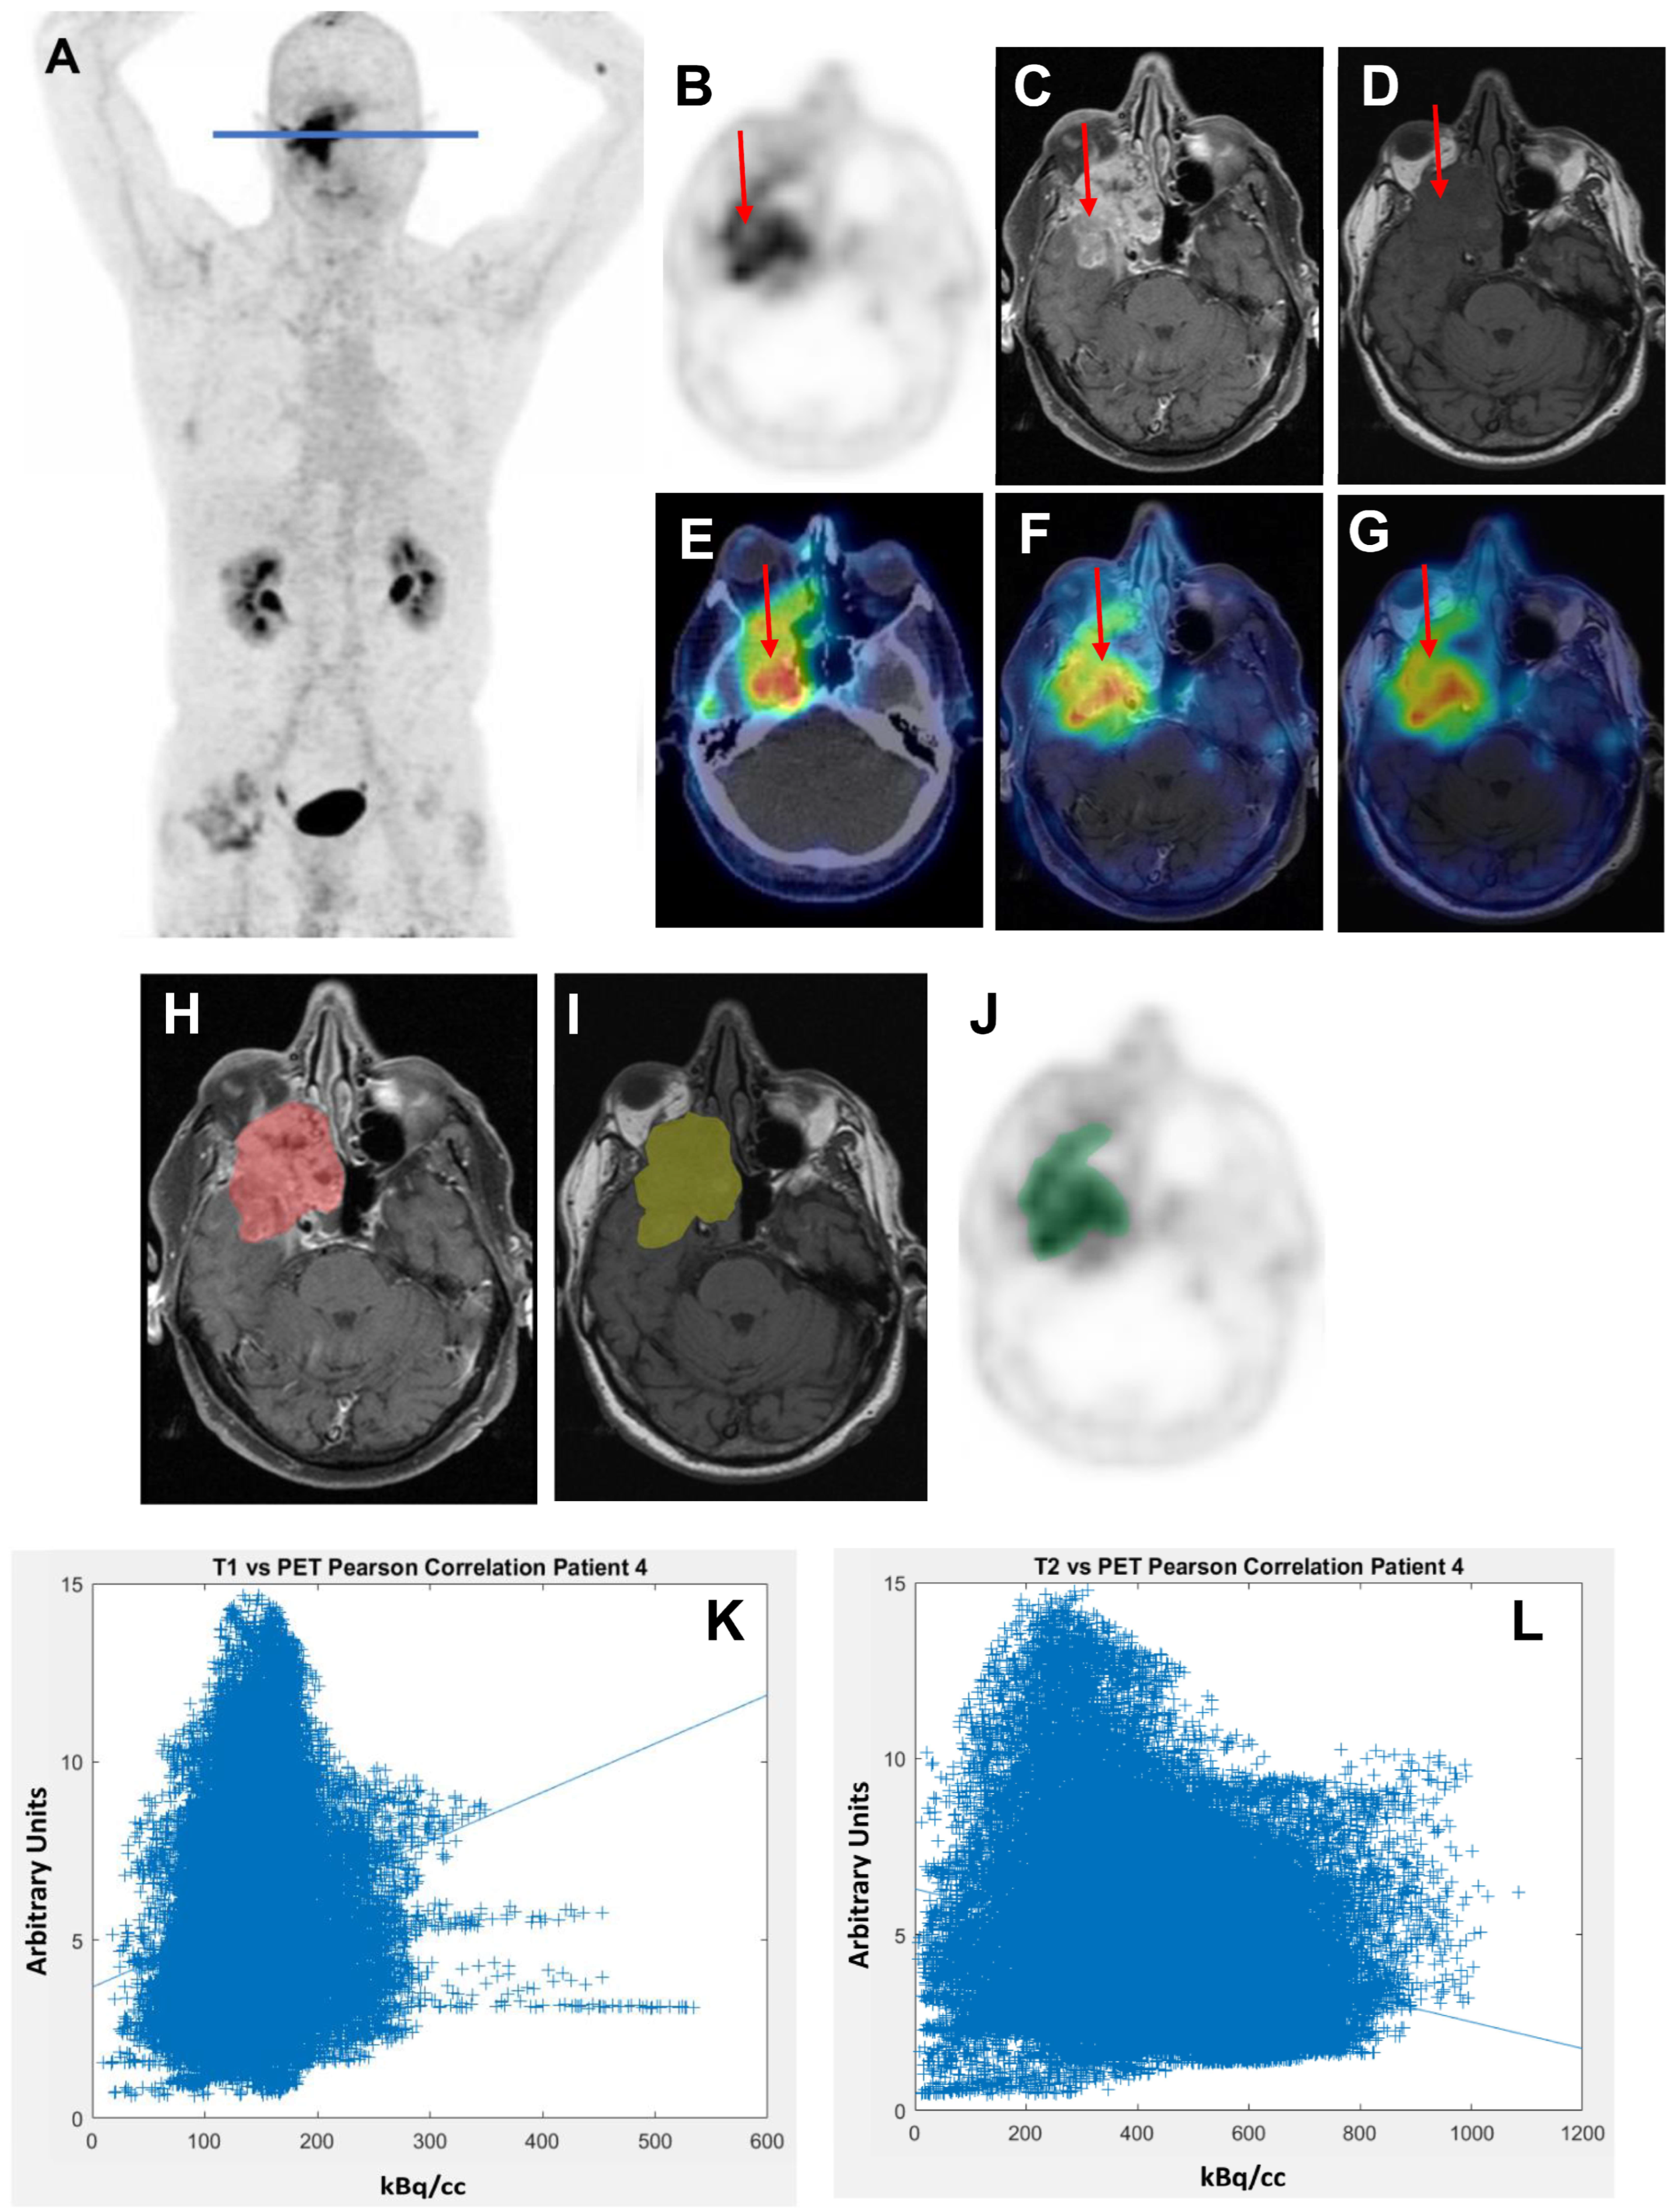
Figure 2 shows an example of a primary ACC manifestation (Patient 4) in the right nasal sinus. In ceT1w and T2w MRI sequences, the tumour appears largely homogenous. However, 68Ga-FAPI uptake is surprisingly incongruent, with hotspots in areas that have no discernible difference in appearance in MRI. This is reflected in the low correlation value (ceT1w at 60 min: 0.173; T2w at 60 min: −0.264).
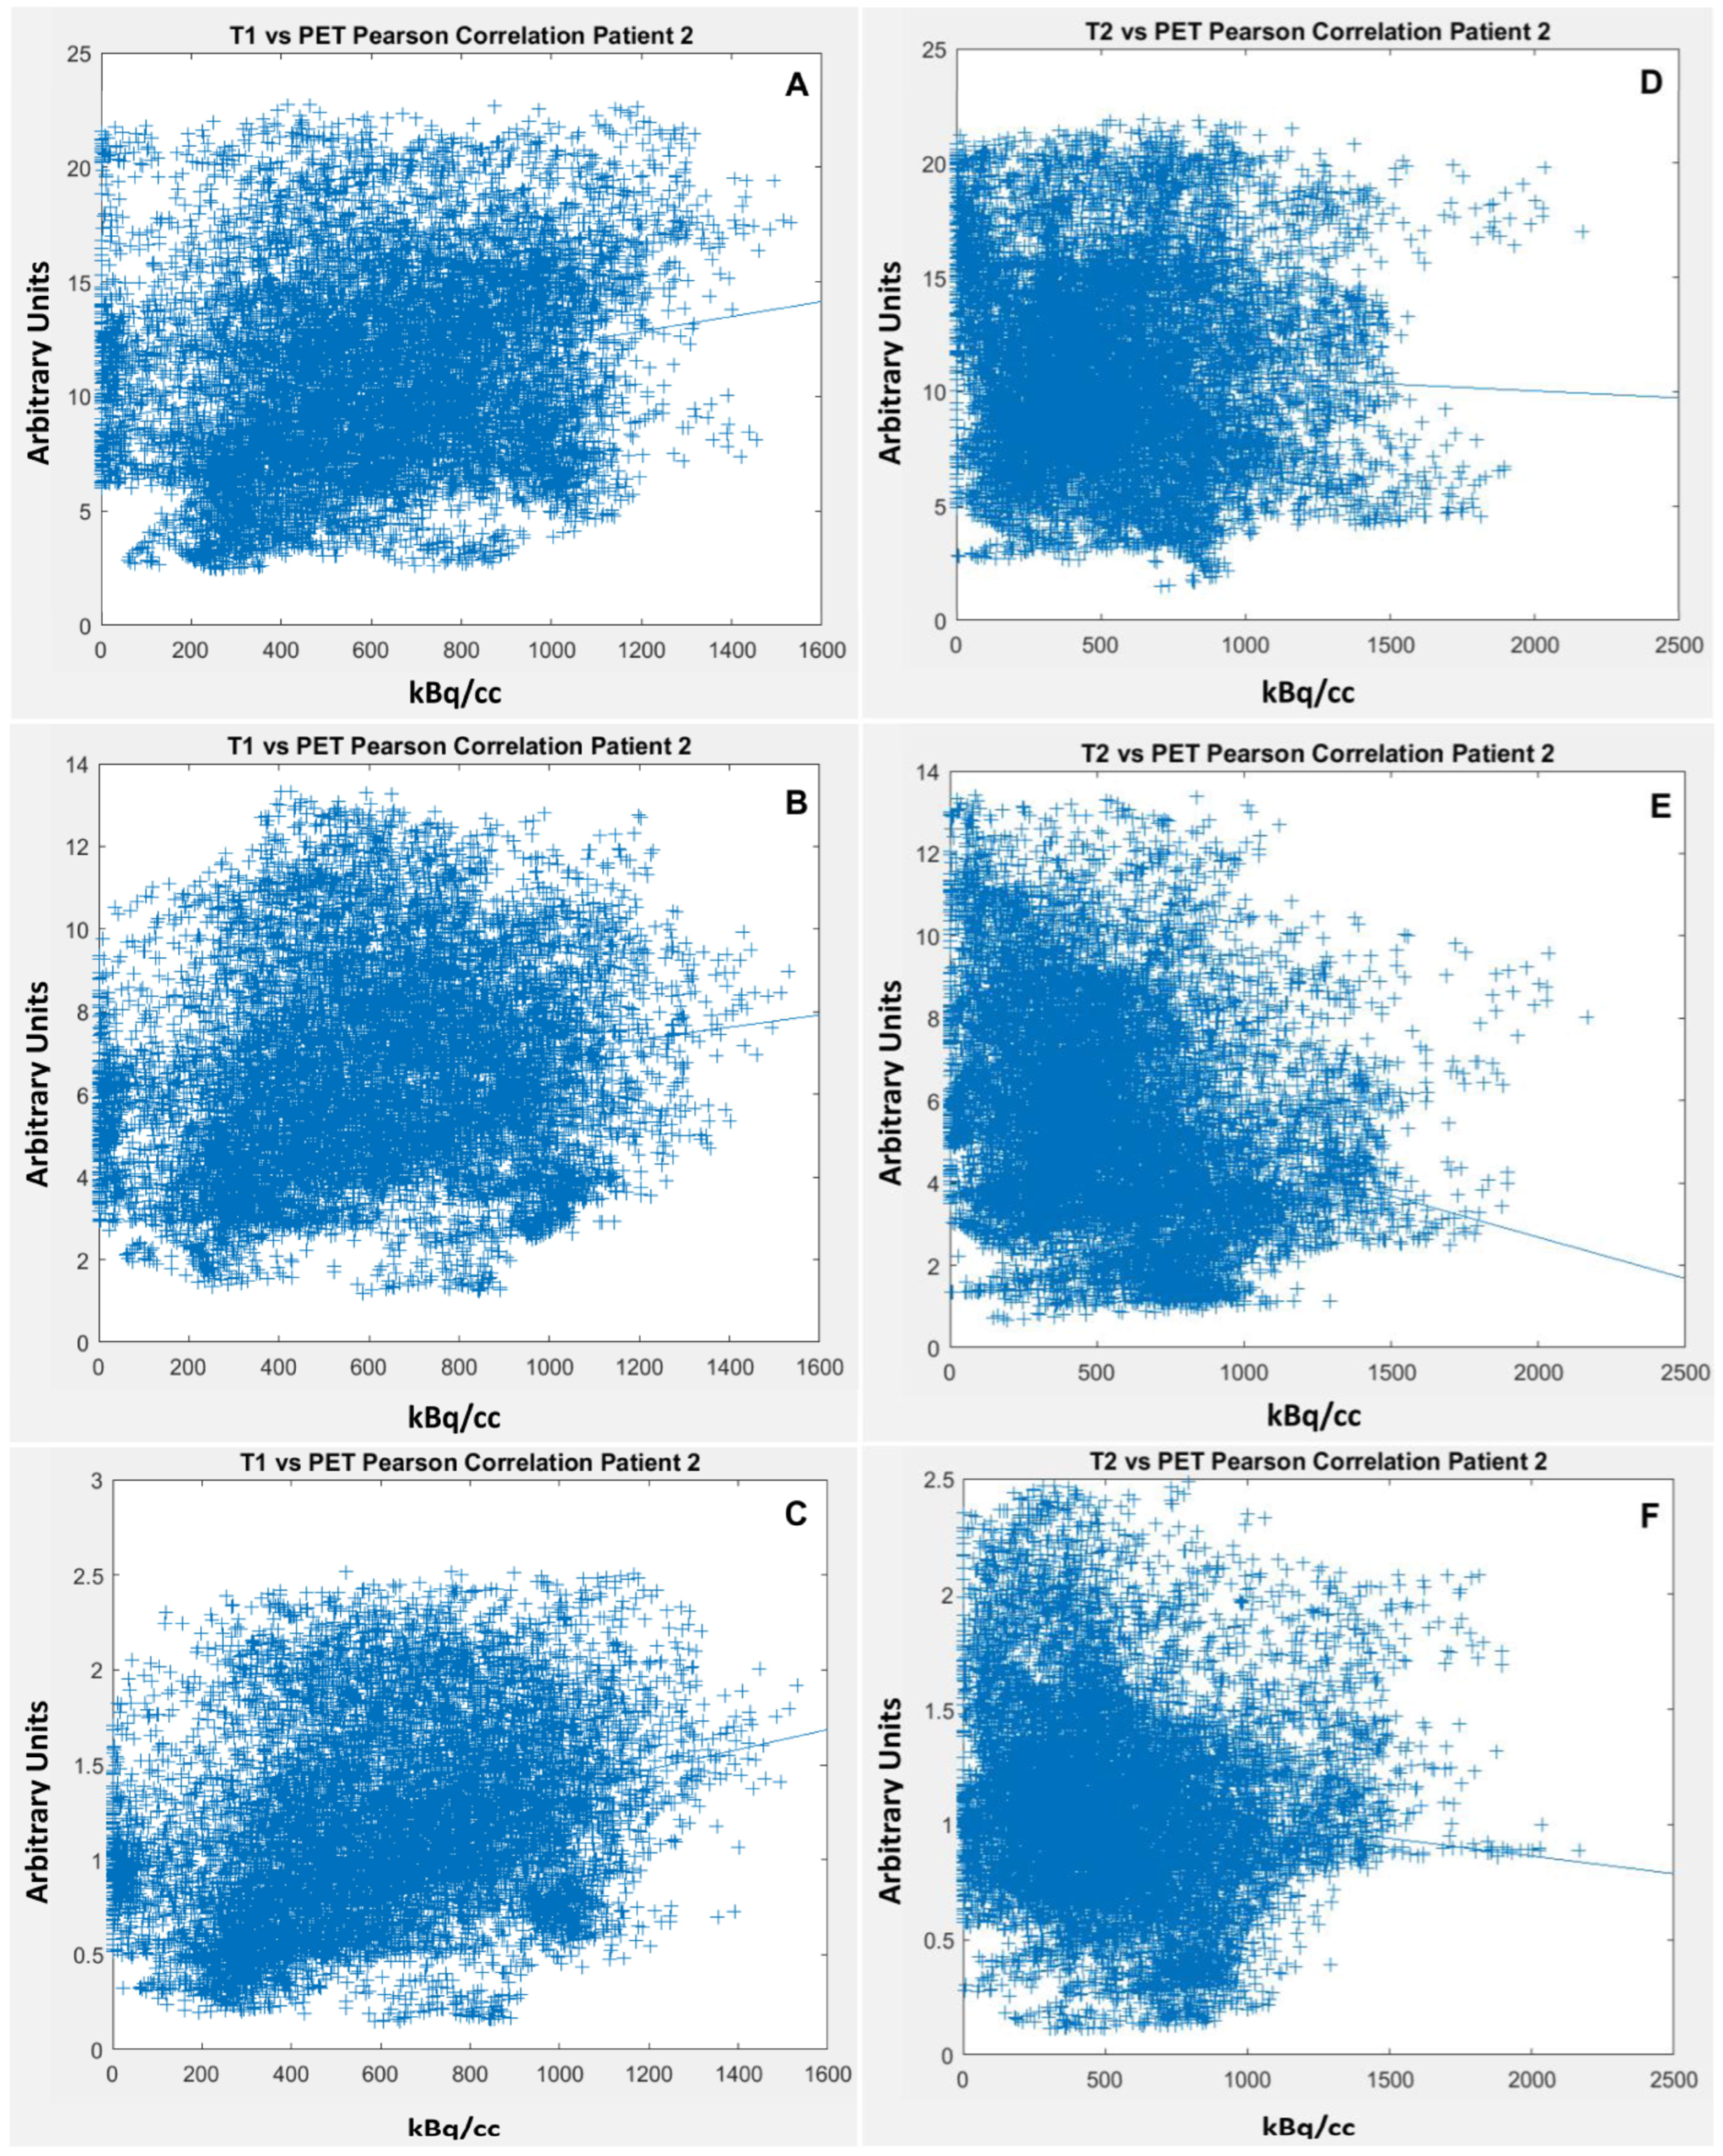
Figure 3 comprises exemplary correlation scatter plots (Patient 2) of ceT1w and T2w at all three timepoints (10, 60 and 180 min). In this case, there is a weak positive correlation between ceT1w and 68Ga-FAPI uptake and no correlation between T2w and 68Ga-FAPI uptake.

4. Discussion

In this retrospective voxelwise analysis of 68Ga-FAPI PET uptake and MRI signal intensities of 12 ACCs, we found slight correlations between 68Ga-FAPI PET signals and tumour appearance in ceT1w or T2w MRI scans. This indicates that 68Ga-FAPI PET is an independent imaging method for ACCs and not only a surrogate signal of the clinically established MRI sequences. This result is in line with our previously published analyses of 68Ga-FAPI PET and MRI signalling in glioblastomas, likewise correlating 68Ga-FAPI uptake with MRI sequences (relative cranial blood volume (rCBV) and apparent diffusion coefficient (ADC) using similar methodology, where we concluded that 68Ga-FAPI PET signalling does not only reflect intratumoural perfusion differences nor cell density [21]. Similarly, we had observed differential spatial distribution of intensely 68Ga-FAPI-positive spots and the contrast enhancing lesion of glioblastomas [24]. FAPI-positive spots in glioblastomas may reflect tumour areas with increased invasiveness or epithelial to mesenchymal transition, as it has been demonstrated previously that overexpression of FAP contributes to these processes [25].
The correlation coefficients of 68Ga-FAPI PET and MRI remained relatively stable when different acquisition time points for 68Ga-FAPI PET were compared. Several previous studies have analysed different 68Ga-FAPI PET acquisition time points ranging from 10 min to 3 h for various tumour entities, including ACC, and found decreasing signal intensities but increasing tumour-to-background ratios (TBR) over time, so that the optimal imaging time point for 68Ga-FAPI PET is still a point of discussion [16,26,27,28,29]. In our dataset, 68Ga-FAPI PET signal intensities decreased over time, too, while the correlations of 68Ga-FAPI PET images with MRI sequences were mostly stable when comparing PET acquisition at 10, 60 and 180 min p.i. This underlines that different acquisition time points of FAPI PET result in comparable imaging information.
With respect to the imaging and clinical management of ACC, 68Ga-FAPI PET has been shown to deliver high-contrast images of ACC tumours and can sensitively detect perineural invasion as well as skip lesions and metastatic lesions, leading to changes in TNM-based staging and radiation plans in a significant portion of ACC patients [16]. Similar results have been reported for other head and neck cancers [30,31]. On the other hand, MRI represents the gold standard for clinical imaging of ACCs, whereas ceT1w and T2w sequences are crucial for the detection of ACC manifestations [32,33]. However, MRI-based morphological information is not fully conclusive in all cases as other conditions such as infection, inflammation, trauma, vascular lesions and haematoma as well as constitutive contrast enhancement of cranial nerves may mimic the MRI appearance of ACCs [34]. Especially in post-operative and post-radiotherapy settings, differentiation between post-therapeutical changes and tumour relapse can be challenging [35].
Promising results have been reported for hybrid PET–MRI using 18Fluor-Fluorodeoxyglucose (18F-FDG), which improved the diagnostic accuracy of recurrent ACCs compared with MRI alone [35]. Similarly, 68Ga-FAPI PET could be used for future hybrid imaging MRI/PET approaches of ACCs, especially as 68Ga-FAPI PET has been shown to outperform 18F-FDG in many malignancies, especially in head and neck tumours due significantly to lower background signalling in the skull base and head and neck region [36,37].
Our findings underline the independent imaging information provided by 68Ga-FAPI PET compared with MRI sequences for ACCs. However, considering the heterogeneity of the examined patient population (treatment-naïve and recurrent ACCs), as well as differences in histological subtypes, we recommend investigations of 68Ga-FAPI PET and MRI with larger and stratified ACC cohorts in order to further evaluate the high potential of both imaging methods for ACCs. Future studies should investigate the diagnostic accuracy for the differentiation of ACC and other tumours of the head and neck region, the influence of therapy-associated changes in the appearance of ACCs in MRI and FAPI PET and the prognostic value of the imaging modalities. This was not possible in our investigation due to its retrospective setting and the limited number of patients. A minor limitation of our analysis is the fact that different FAPI tracer variants were used for PET imaging. We have shown for several cancer entities that these tracer variants do not significantly differ in their imaging properties [17,26,38]. Beyond that, the pharmacokinetics of FAPI-tracers may have had a certain influence on the correlations with MRI signalling which we have found. However, it has been described that FAPI-02, FAPI-46 and FAPI-74 all show relatively stable uptake over time between 10 min and 180 min in various tumours, including ACCs [16,26,39], so that we consider the potential influence of the tracer kinetics on our results as small. Another minor limitation of the study is that the used ceT1w and T2w imaging data cannot not be regarded as quantitative metrics, however, relative signal associations can still be assessed with our approach.

5. Conclusions

Standardised uptake values in 68Ga-FAPIPET correlate only slightly with ceT1w and T2w MRI signal intensities in ACCs, which indicates that 68Ga-FAPI PET is not a surrogate signal of the clinically established MRI sequences. 68Ga-FAPI PET/CT is a independent imaging modality providing complementary information to conventional MRI for ACCs.

Author Contributions

Conceptualisation: M.R. and D.P.; methodology: M.R. and D.P.; software: M.R., L.L. and D.P.; validation: D.P.L., M.R., L.L. and D.P.; formal analysis: L.L. and D.P.; investigation: M.R., S.A., M.S., E.G., H.P.S., F.L.G., M.B. and U.H.; resources: H.P.S., M.B. and U.H.; data curation: M.R. and D.P.; writing—original draft preparation: D.P.L. and M.R.; writing—review and editing: M.R., E.G., S.A., H.P.S., U.H. and D.P. visualisation: D.P.L. and L.L.; supervision: M.R. and D.P.; project administration: M.R. and D.P.; funding acquisition: U.H. All authors have read and agreed to the published version of the manuscript.

Funding

This work was funded by the Federal Ministry of Education and Research, grant number 13N 13341 (funder: UH).

Institutional Review Board Statement

All procedures performed in studies involving human participants were in accordance with the ethical standards of the institutional and/or national research committee and with the 1964 Helsinki declaration and its later amendments or comparable ethical standards. This retrospective study was approved by the local institutional review board (study number S-115/2020).

Informed Consent Statement

Informed consent was obtained from all subjects involved in the study. Written informed consent has been obtained from the patients to publish this paper.

Data Availability Statement

The data presented in this study are available in this article.

Conflicts of Interest

UH has filed a patent application (EP 18155420.5) for quinoline-based FAP-targeting agents for imaging and therapy in nuclear medicine. UH also has shares of a consultancy group for iTheranostics. SA received grants from Accuray International Sàrl outside the submitted work. SA received grants from Merck Serono GmbH outside the submitted work. SA received grants from Novocure GmbH, MSD and Astra Zeneca outside the submitted work. SA received grants from Novocure GmbH, Actinium Pharmaceuticals and Telix Pharmaceuticals shareholding. DP is funded by the German Research Foundation (DFG). MS is a former employee of the Department of Radiation Oncology, University Hospital Heidelberg, Germany and is currently employed by Exelixis, Inc. No other potential conflicts of interest relevant to this article exist.

References

  1. Coca-Pelaz, A.; Rodrigo, J.P.; Bradley, P.J.; Vander Poorten, V.; Triantafyllou, A.; Hunt, J.L.; Strojan, P.; Rinaldo, A.; Haigentz, M.; Takes, R.P.; et al. Adenoid cystic carcinoma of the head and neck—An update. Oral Oncol. 2015, 51, 652–661. [Google Scholar] [CrossRef]
  2. Jang, S.; Patel, P.N.; Kimple, R.J.; McCulloch, T.M. Clinical Outcomes and Prognostic Factors of Adenoid Cystic Carcinoma of the Head and Neck. Anticancer Res. 2017, 37, 3045–3052. [Google Scholar] [PubMed]
  3. Castelnuovo, P.; Turri-Zanoni, M. Adenoid Cystic Carcinoma. Adv. Otorhinolaryngol. 2020, 84, 197–209. [Google Scholar] [PubMed]
  4. Moskaluk, C.A. Adenoid cystic carcinoma: Clinical and molecular features. Head Neck Pathol. 2013, 7, 17–22. [Google Scholar] [CrossRef] [PubMed]
  5. Dillon, P.M.; Chakraborty, S.; Moskaluk, C.A.; Joshi, P.J.; Thomas, C.Y. Adenoid cystic carcinoma: A review of recent advances, molecular targets, and clinical trials. Head Neck 2016, 38, 620–627. [Google Scholar] [CrossRef]
  6. Spiro, R.H.; Huvos, A.G.; Strong, E.W. Adenoid cystic carcinoma of salivary origin. A clinicopathologic study of 242 cases. Am. J. Surg. 1974, 128, 512–520. [Google Scholar] [CrossRef]
  7. Szanto, P.A.; Luna, M.A.; Tortoledo, M.E.; White, R.A. Histologic grading of adenoid cystic carcinoma of the salivary glands. Cancer 1984, 54, 1062–1069. [Google Scholar] [CrossRef]
  8. Hanna, E.; Vural, E.; Prokopakis, E.; Carrau, R.; Snyderman, C.; Weissman, J. The Sensitivity and Specificity of High-Resolution Imaging in Evaluating Perineural Spread of Adenoid Cystic Carcinoma to the Skull Base. Arch. Otolaryngol. Head Neck Surg. 2007, 133, 541–545. [Google Scholar] [CrossRef]
  9. Li, Y.; Hao, D.; Song, X.; Zhang, C. Computed tomography and magnetic resonance imaging of adenoid cystic carcinoma in the maxillary sinus: A retrospective study with radiologic-histopathologic correlations. Oral Surg. Oral Med. Oral Pathol. Oral Radiol. 2021, 131, 111–121. [Google Scholar] [CrossRef]
  10. Li, J.; Jia, Z.; Kong, J.; Zhang, F.; Fang, S.; Li, X.; Li, W.; Yang, X.; Luo, Y.; Lin, B.; et al. Carcinoma-Associated Fibroblasts Lead the Invasion of Salivary Gland Adenoid Cystic Carcinoma Cells by Creating an Invasive Track. PLoS ONE 2016, 11, e0150247. [Google Scholar]
  11. Bremnes, R.M.; Dønnem, T.; Al-Saad, S.; Al-Shibli, K.; Andersen, S.; Sirera, R.; Camps, C.; Marinez, I.; Busund, L.T. The role of tumor stroma in cancer progression and prognosis: Emphasis on carcinoma-associated fibroblasts and non-small cell lung cancer. J. Thorac. Oncol. 2011, 6, 209–217. [Google Scholar] [CrossRef] [Green Version]
  12. Nurmik, M.; Ullmann, P.; Rodriguez, F.; Haan, S.; Letellier, E. In search of definitions: Cancer-associated fibroblasts and their markers. Int. J. Cancer 2020, 146, 895–905. [Google Scholar] [CrossRef] [PubMed]
  13. Hamson, E.J.; Keane, F.M.; Tholen, S.; Schilling, O.; Gorrell, M.D. Understanding fibroblast activation protein (FAP): Substrates, activities, expression and targeting for cancer therapy. Proteom. Clin. Appl. 2014, 8, 454–463. [Google Scholar] [CrossRef]
  14. Loktev, A.; Lindner, T.; Mier, W.; Debus, J.; Altmann, A.; Jäger, D.; Giesel, F.; Kratochwil, C.; Barthe, P.; Roumestand, C.; et al. A Tumor-Imaging Method Targeting Cancer-Associated Fibroblasts. J. Nucl. Med. 2018, 59, 1423–1429. [Google Scholar] [CrossRef] [PubMed]
  15. Lindner, T.; Loktev, A.; Giesel, F.; Kratochwil, C.; Altmann, A.; Haberkorn, U. Targeting of activated fibroblasts for imaging and therapy. EJNMMI Radiopharm. Chem. 2019, 4, 16. [Google Scholar] [CrossRef] [PubMed]
  16. Röhrich, M.; Syed, M.; Liew, D.P.; Giesel, F.L.; Liermann, J.; Choyke, P.L.; Wefers, A.K.; Ritz, T.; Szymbara, M.; Schillings, L.; et al. 68Ga-FAPI-PET/CT improves diagnostic staging and radiotherapy planning of adenoid cystic carcinomas—Imaging analysis and histological validation. Radiother. Oncol. 2021, 160, 192–201. [Google Scholar] [CrossRef]
  17. Loktev, A.; Lindner, T.; Burger, E.-M.; Altmann, A.; Giesel, F.; Kratochwil, C.; Debus, J.; Marmé, F.; Jäger, D.; Mier, W.; et al. Development of Fibroblast Activation Protein-Targeted Radiotracers with Improved Tumor Retention. J. Nucl. Med. 2019, 60, 1421–1429. [Google Scholar] [CrossRef]
  18. Mier, W.; Hoffend, J.; Krämer, S.; Schuhmacher, J.; Hull, W.E.; Eisenhut, M.; Haberkorn, U. Conjugation of DOTA using isolated phenolic active esters: The labeling and biodistribution of albumin as blood pool marker. Bioconj. Chem. 2005, 16, 237–240. [Google Scholar] [CrossRef]
  19. Giesel, F.L.; Kratochwil, C.; Lindner, T.; Marschalek, M.M.; Loktev, A.; Lehnert, W.; Debus, J.; Jäger, D.; Flechsig, P.; Altmann, A.; et al. 68Ga-FAPI PET/CT: Biodistribution and Preliminary Dosimetry Estimate of 2 DOTA-Containing FAP-Targeting Agents in Patients with Various Cancers. J. Nucl. Med. 2019, 60, 386–392. [Google Scholar] [CrossRef]
  20. Kratochwil, C.; Flechsig, P.; Lindner, T.; Abderrahim, L.; Altmann, A.; Mier, W.; Adeberg, S.; Rathke, H.; Röhrich, M.; Winter, H.; et al. 68Ga-FAPI PET/CT: Tracer Uptake in 28 Different Kinds of Cancer. J. Nucl. Med. 2019, 60, 801–805. [Google Scholar] [CrossRef]
  21. Röhrich, M.; Floca, R.; Loi, L.; Adeberg, S.; Windisch, P.; Giesel, F.L.; Kratochwil, C.; Flechsig, P.; Rathke, H.; Lindner, T.; et al. FAP-specific PET signaling shows a moderately positive correlation with relative CBV and no correlation with ADC in 13 IDH wildtype glioblastomas. Eur. J. Radiol. 2020, 127, 109021. [Google Scholar] [CrossRef] [PubMed]
  22. Meng, X.-L.; Rosenthal, R.; Rubin, D.B. Comparing correlated correlation coefficients. Psychol. Bull. 1992, 111, 172–175. [Google Scholar] [CrossRef]
  23. Cohen, J. Statistical Power Analysis for the Behavioral Sciences; Elsevier Science: Amsterdam, The Netherlands, 2013. [Google Scholar]
  24. Rohrich, M.; Loktev, A.; Wefers, A.K.; Altmann, A.; Paech, D.; Adeberg, S.; Windisch, P.; Hielscher, T.; Flechsig, P.; Floca, R.; et al. IDH-wildtype glioblastomas and grade III/IV IDH-mutant gliomas show elevated tracer uptake in fibroblast activation protein-specific PET/CT. Eur. J. Nucl. Med. Mol. Imaging 2019, 46, 2569–2580. [Google Scholar] [CrossRef] [PubMed]
  25. Mentlein, R.; Hattermann, K.; Hemion, C.; Jungbluth, A.A.; Held-Feindt, J. Expression and role of the cell surface protease seprase/fibroblast activation protein-alpha (FAP-alpha) in astroglial tumors. Biol. Chem. 2011, 392, 199–207. [Google Scholar] [CrossRef] [PubMed]
  26. Rohrich, M.; Naumann, P.; Giesel, F.L.; Choyke, P.L.; Staudinger, F.; Wefers, A.; Liew, D.P.; Kratochwil, C.; Rathke, H.; Liermann, J.; et al. Impact of 68Ga-FAPI PET/CT Imaging on the Therapeutic Management of Primary and Recurrent Pancreatic Ductal Adenocarcinomas. J. Nucl. Med. 2021, 62, 779–786. [Google Scholar] [CrossRef] [PubMed]
  27. Rohrich, M.; Leitz, D.; Glatting, F.M.; Wefers, A.K.; Weinheimer, O.; Flechsig, P.; Kahn, N.; Mall, M.A.; Giesel, F.L.; Kratochwil, C.; et al. Fibroblast Activation Protein-Specific PET/CT Imaging in Fibrotic Interstitial Lung Diseases and Lung Cancer: A Translational Exploratory Study. J. Nucl. Med. 2022, 63, 127–133. [Google Scholar] [CrossRef]
  28. Ferdinandus, J.; Kessler, L.; Hirmas, N.; Trajkovic-Arsic, M.; Hamacher, R.; Umutlu, L.; Nader, M.; Zarrad, F.; Weber, M.; Fendler, W.P. Equivalent tumor detection for early and late FAPI-46 PET acquisition. Eur. J. Nucl. Med. Mol. Imaging 2021, 48, 3221–3227. [Google Scholar] [CrossRef]
  29. Hu, K.; Wang, L.; Wu, H.; Huang, S.; Tian, Y.; Wang, Q.; Xiao, C.; Han, Y.; Tang, G. [18F]FAPI-42 PET imaging in cancer patients: Optimal acquisition time, biodistribution, and comparison with [68Ga]Ga-FAPI-04. Eur. J. Nucl. Med. Mol. Imaging 2021, 49, 2833–2843. [Google Scholar] [CrossRef]
  30. Zhao, L.; Pang, Y.; Zheng, H.; Han, C.; Gu, J.; Sun, L.; Wu, H.; Wu, S.; Lin, Q.; Chen, H. Clinical utility of [68Ga]Ga-labeled fibroblast activation protein inhibitor (FAPI) positron emission tomography/computed tomography for primary staging and recurrence detection in nasopharyngeal carcinoma. Eur. J. Nucl. Med. Mol. Imaging 2021, 48, 3606–3617. [Google Scholar] [CrossRef]
  31. Syed, M.; Flechsig, P.; Liermann, J.; Windisch, P.; Staudinger, F.; Akbaba, S.; Koerber, S.A.; Freudlsperger, C.; Plinkert, P.K.; Debus, J.; et al. Fibroblast activation protein inhibitor (FAPI) PET for diagnostics and advanced targeted radiotherapy in head and neck cancers. Eur. J. Nucl. Med. Mol. Imaging 2020, 47, 2836–2845. [Google Scholar] [CrossRef]
  32. Dong, J.; Tian, L.; Li, S.; Mo, Y.; Liu, L.; Zhong, R. Differences in extension patterns between adenoid cystic carcinoma of the nasopharynx and nasopharyngeal carcinoma on MRI. Int. J. Clin. Exp. Pathol. 2015, 8, 15960–15968. [Google Scholar] [PubMed]
  33. Kato, H.; Kanematsu, M.; Makita, H.; Kato, K.; Hatakeyama, D.; Shibata, T.; Mizuta, K.; Aoki, M. CT and MR imaging findings of palatal tumors. Eur. J. Radiol. 2014, 83, e137–e146. [Google Scholar] [CrossRef] [PubMed]
  34. Singh, F.M.; Mak, S.Y.; Bonington, S.C. Patterns of spread of head and neck adenoid cystic carcinoma. Clin. Radiol. 2015, 70, 644–653. [Google Scholar] [CrossRef] [PubMed]
  35. Kirchner, J.; Schaarschmidt, B.M.; Sauerwein, W.; Deuschl, C.; Arweiler-Harbeck, D.; Holtmann, L.; Stebner, V.; Umutlu, L.; Antoch, G.; Ruhlmann, V. 18F-FDG PET/MRI vs. MRI in patients with recurrent adenoid cystic carcinoma. Head Neck 2019, 41, 170–176. [Google Scholar]
  36. Giesel, F.L.; Kratochwil, C.; Schlittenhardt, J.; Dendl, K.; Eiber, M.; Staudinger, F.; Kessler, L.; Fendler, W.P.; Lindner, T.; Koerber, S.A.; et al. Head-to-head intra-individual comparison of biodistribution and tumor uptake of 68Ga-FAPI and 18F-FDG PET/CT in cancer patients. Eur. J. Nucl. Med. Mol. Imaging 2021, 48, 4377–4385. [Google Scholar] [CrossRef]
  37. Chen, H.; Pang, Y.; Wu, J.; Zhao, L.; Hao, B.; Wu, J.; Wei, J.; Wu, S.; Zhao, L.; Luo, Z.; et al. Comparison of [68Ga]Ga-DOTA-FAPI-04 and [18F] FDG PET/CT for the diagnosis of primary and metastatic lesions in patients with various types of cancer. Eur. J. Nucl. Med. Mol. Imaging 2020, 47, 1820–1832. [Google Scholar] [CrossRef]
  38. Giesel, F.; Adeberg, S.; Syed, M.; Lindner, T.; Jimenez, L.D.; Mavriopoulou, E.; Staudinger, F.; Tonndorf-Martini, E.; Regnery, S.; Rieken, S.; et al. FAPI-74 PET/CT Using Either 18F-AlF or Cold-kit 68Ga-labeling: Biodistribution, Radiation Dosimetry and Tumor Delineation in Lung Cancer Patients. J. Nucl. Med. 2020, 62, 201–207. [Google Scholar] [CrossRef]
  39. Glatting, F.M.; Hoppner, J.; Liew, D.P.; van Genabith, A.; Spektor, A.M.; Steinbach, L.; Hubert, A.; Kratochwil, C.; Giesel, F.L.; Dendl, K.; et al. Repetitive early FAPI-PET acquisition comparing FAPI-02, FAPI-46 and FAPI-74: Methodological and diagnostic implications for malignant, inflammatory and degenerative lesions. J. Nucl. Med. 2022, 63. [Google Scholar] [CrossRef]
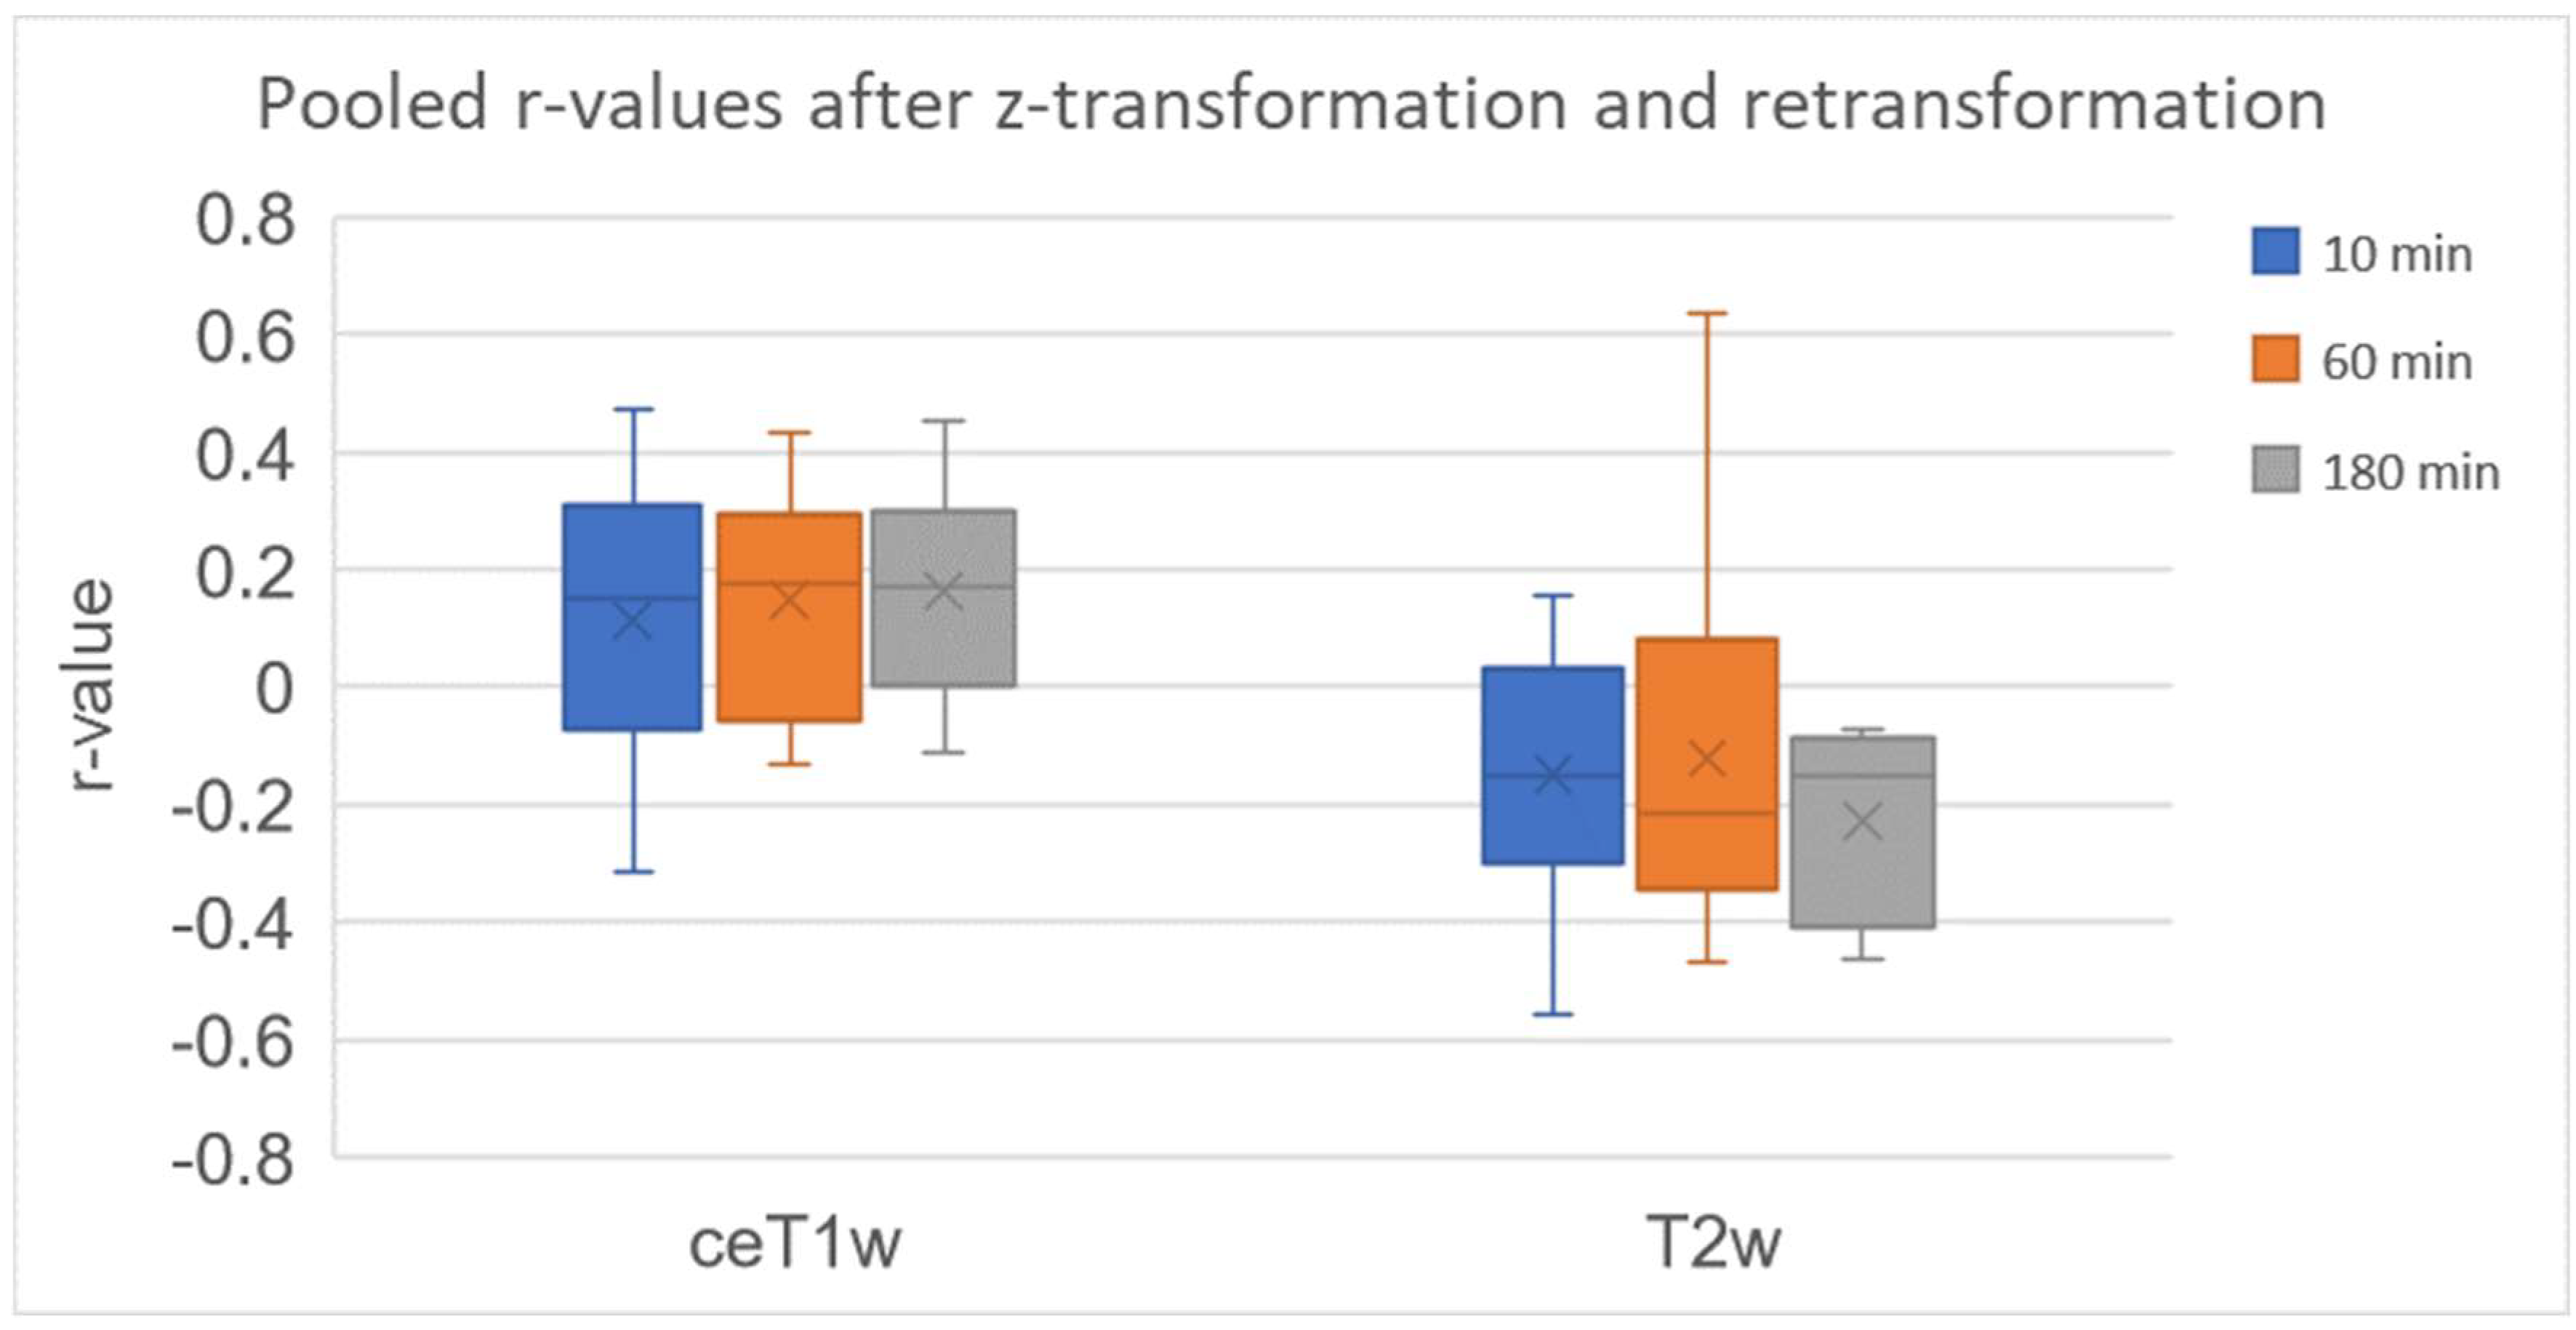
Figure 1. Pooled r-values of the correlation between 68Ga-FAPI PET and MRI sequences (contrast enhanced T1w and T2w) after z-transformation and retransformation at all three timepoints. Range of pooled r-values (ceT1w): 10 min (−0.312 to 0.470), 60 min (−0.130 to 0.434) and 180 min (−0.112 to 0.452). Range of pooled r-values (T2w): 10 min (−0.559 to 0.156), 60 min (−0.466 to 0.637) and 180 min (−0.462 to −0.071).
Cancers 14 04253 g001
Figure 2. Example (Patient number 4) of a treatment-naïve ACC (tubular type) in the right nasal sinus. (A): Maximum Intensity Projection (MIP); (BG): appearance of the tumour in different imaging modalities: (B): 68Ga-FAPI PET, (C): MRI (ceT1w); (D): MRI (T2w); (E): 68Ga-FAPI PET fused with CT; (F): 68Ga-FAPI PET fused with ceT1w MRI, (G): 68Ga-FAPI PET fused with T2w MRI. Red arrows in B–G point at the tumour. (HJ): Manual tumour delineation based on (H): ceT1w MRI (tumour delineation in red), (I): T2w MRI (tumour delineation in yellow) and (J): 68Ga-FAPI PET (tumour delineation in green). (K): ceT1w correlation scatter plot at 60 min; (L): T2w correlation scatter plot at 60 min.
Cancers 14 04253 g002
Figure 3. Patient number 2: Left column (AC): correlation of ceT1w vs. 68Ga-FAPI PET at 10, 60 and 180 min. Right column (DF): correlation of T2w vs. PET/CT at 10, 60 and 180 min.
Cancers 14 04253 g003
Table 1. Clinical and histological characteristics of 12 patients with ACC.
Patient NumberAge (Years)Sex (M/F)Location of Primary TumourClinical Setting (and Duration of Disease)Previous TherapyHistological Subtype
129FRight parapharyngeal spacePrimaryNoneMixed (tubular and cribriform)
271FLeft maxillary sinusRecurrence (5 months)ResectionCribriform
356MLeft oropharynxRecurrence (6 years)Resection, neck dissection, re-resectionNot available
471MRight maxillary sinusPrimaryNoneTubular
534FRight nasopharynxPrimaryNoneNot available
666FLeft maxillary sinusRecurrence (4 years)ResectionCribriform
753FRight hard palateRecurrence (5 years)Definitive radiotherapyMixed (tubular and cribriform)
869FLeft parotid glandRecurrence (28 years)Resection, re-resections, resections of pulmonary metastases, Nivolumab Cribriform
963MFloor of the mouthPrimaryNoneCribriform
1066FEpi- and oropharynx, medianPrimaryNoneTubular
1148MRight parapharyngeal space PrimaryNoneCribriform
1268FEpipharynx, left base of the skullPrimaryNoneCribriform
Table 2. 68Ga-FAPI PET/CT imaging protocols of 12 patients with ACC.
Patient NumberFAPI TracerInjected Activity (MBq)SUVmaxSUVmean
10 Min60 Min180 Min10 Min60 Min180 Min
1FAPI-2258-16.8--7.73-
2FAPI-742696.156.243.843.812.582.32
3FAPI-7422110.28.154.274.633.372.75
4FAPI-7417712.011.26.717.314.073.97
5FAPI-4628214.012.87.956.994.654.36
6FAPI-46285-17.6--8.05-
7FAPI-462209.177.947.854.634.553.93
8FAPI-2268-4.26--2.92-
9FAPI-462119.6410.713.34.595.534.92
10FAPI-4626912.213.112.28.086.525.53
11FAPI-4626810.810.713.46.635.354.08
12FAPI-4624412.114.4-4.995.83-
Table 3. Correlation results of 68Ga-FAPI uptake and ceT1w MRI signal.
Patient NumberNumber of PixelsCorrelation at 10 Minp-ValueCorrelation at 60 Minp-ValueCorrelation at 180 Minp-Value
17892--0.172<0.001--
212,1180.226<0.0010.181<0.0010.319<0.001
377,9870.47000.31200.093<0.001
4124,1870.15000.17300.1750
537,8700.038<0.0010.24600.2430
6177,586--−0.080<0.001--
7151,081−0.1560−0.1300−0.1120
82531--0.354<0.001--
919,175−0.3120−0.076<0.001−0.029<0.001
1030,0900.210<0.0010.195<0.0010.165<0.001
1118,6690.39400.43400.4520
1296540.0100.351−0.0060.533--
Table 4. Correlation results of 68Ga-FAPI uptake and T2w MRI signal.
Patient NumberNumber of PixelsCorrelation at 10 Minp-ValueCorrelation at 60 Minp-ValueCorrelation at 180 Minp-Value
111,903--0.124<0.001--
214,005−0.048<0.001−0.263<0.001−0.122<0.001
3111,9940.15500.090<0.001−0.071<0.001
481,879−0.1750−0.2640−0.4320
58098−0.401<0.001−0.4240−0.3920
647,534--−0.3510--
7160,768−0.072<0.001−0.1100−0.1330
8458--0.563<0.001--
918,432−0.5080−0.4350−0.3640
1013,5200.112<0.0010.051<0.001−0.074<0.001
1112,597−0.150<0.001−0.230<0.001−0.166<0.001
1212,586−0.172<0.001−0.193<0.001-0
Publisher’s Note: MDPI stays neutral with regard to jurisdictional claims in published maps and institutional affiliations.