1. Introduction
The treatment of cancer heavily relies on standard-of-care therapies that fail to address the diverse nature of the disease. Being caused by a combination of genetic mutations, the sensitivity to drug compounds varies greatly across cancer cell lines, which results in a vast range of therapeutic outcomes for seemingly similar clinical presentations. Genomic alterations and the transcriptomes of cancer cells, in combination with the biochemical mechanisms underlying the administered drugs, are among the factors that determine the diverse outcomes of cancer therapies [
1]. Driven by advances in genomic testing, precision oncology aims at providing the best therapy for individual patients, given all available information, including their genomic and transcriptomic tumor profiles.
Increasingly, data-driven machine-learning approaches are used to facilitate precision oncology [
2]. Machine-learning approaches rely on large-scale drug-sensitivity screening data, such as the Genomics of Drug Sensitivity in Cancer Database (GDSC) [
3,
4] and the Cancer Cell Line Encyclopedia (CCLE) [
5]. These data are generated by exposing cultivated tumor cell lines to a variety of anti-cancer compounds and measuring the survival rates of the cancer cells as a function of the drug concentration. A number of well-known drug-sensitivity models have been developed with these in vitro databases [
6,
7], including the PaccMann model [
7], which predicts the inhibitory concentration of a pair of drug and cell lines based on a tokenized SMILES-string representation of the drug molecule and transcriptomic features.
Cultivated cancer cell lines are easy to handle and therefore useful for the creation of large-scale drug-sensitivity databases. However, since these cell lines have devolved from human cancer cells over years, and in some cases, decades of selective pressure in culture conditions, they may no longer faithfully represent the molecular characteristics of primary patients’ tumors [
8,
9]. To address this issue, several patient-derived model systems for cancer have been developed, with different levels of complexity. Patient-derived ex vivo cell cultures [
10] (PDCs) provide screenable cell model systems more similar to the primary patients’ tumors. While being closer approximations to clinical presentations of cancer than the cell lines that have been cultivated over many generations, ex vivo cell cultures still lack cell–cell interactions in a three-dimensional environment. Next, for patient-derived xenografts [
11] (PDXs), the tumor is implanted into living animals, and thus PDXs allow drug-sensitivity screening in vivo, albeit in a non-human tissue environment. Finally, patient-derived organoids [
12] (PDOs) are self-organizing 3D cultures containing different cell types, resembling essential aspects of the organs that host the primary patient tumors. PDOs facilitate in vitro efficacy screening of multiple drugs in a multicellular tissue-like environment.
While better representing clinical tumor cases, the downside of patient-derived cell cultures, xenografts, and organoids lies in the higher complexity of the processes. In consequence, ex vivo, xenograft, and organoid drug-sensitivity data are available at a much smaller scale that is not sufficient to train high-capacity neural networks that represent the state of the art in machine learning [
7,
13].
In this study, we explored a transfer-learning approach that exploits the abundance of in vitro drug-sensitivity data to pre-train models which are then fine-tuned on drug-sensitivity data of patient-derived cell lines. In order to obtain results that are not just specific for a particular machine-learning model, we compared the performance of this transfer-learning approach to the state-of-the-art PaccMann model [
7], the best model of Zhu et al. [
6], and a relatively simple convolutional neural network architecture as a baseline model. We evaluated the models in terms of their performance in two different use cases. In the use case of
precision oncology, the sensitivity of a known panel of drugs has to be predicted for a new, previously unseen cell line at hand; this setting is also referred to as
cell cold start. In the use case of
drug development, by contrast, the sensitivity of a known panel of cell lines to a new, previously unseen drug molecule is predicted; this setting is also referred to as
drug cold start.
Prior work on transfer learning in this domain by Zhu et al. [
6] has demonstrated that it is possible to pre-train deep-learning drug-sensitivity prediction models on a large data set, but their work purely focused on cultivated cell lines. By contrast, we also consider patient-derived cell lines as the target domain. Ma et al. [
14] studied transfer learning from in vitro data to PDO and xenograft target domains. They followed an approach of training a separate neural-network model for each drug compound that only receives cell-line information as input. This approach does not allow the possibility of generalization to unseen drugs, which is crucial for the use case of drug development.
2. System and Methods
In this section, we introduce the data sets, the formal problem setting, the experimental setting, and the neural-network models.
2.1. Data
All data sets that we used in this study report gene expression profiles for a number of cancer samples, and drug-sensitivity measurements for a set of drugs. They differ in size, type of cancer model, and methods to measure gene expression and drug sensitivity.
We pre-trained all models on the cancer-specific data from the
Genomics of Drug Sensitivity in Cancer project (GDSC) [
3,
4], because with 958 cell lines and 282 drugs, this is the largest publicly available in vitro drug-sensitivity database.
Four other data sets were used for model tuning and evaluation. They served as the target domain, representing pre-clinical cancer models with deviating properties and different approximations of the primary patient tumors. The first target data set is the
Cancer Cell Line Encyclopedia (CCLE) [
5] with 24 drugs, of which 7 overlap with GDSC (see
Table 1). Even though CCLE, like GDSC, is based on cultivated cell lines, differences in the techniques that are used to measure RNA expression levels impede the direct application of the GDSC-trained model. Next, the
Beat Acute Myeloid Leukaemia (Beat AML) data set [
15] reports drug-sensitivity data for 213 AML patient-derived cell cultures (PDCs) and 109 drugs.
Furthermore, we fine-tuned the neural networks with a
lung cancer xenografts data set (PDXs) [
16]. For this study, tumor samples from 19 lung cancer patients were implanted into mice and treated with 3 different cancer drugs. In contrast to in vitro data sets, drugs were administered the same way as in clinics, and sensitivity was measured by the relative size of the tumor in treated xenografts compared to untreated (control) xenografts. Finally, the
Pancreatic Cancer Patient-derived Organoid (PDO) data set [
17] quantified the drug sensitivities of 25 drugs via the area under the dose–response curve (AUC) in 44 PDOs that form epithelial structures and have been shown to closely resemble the transcriptomic profiles and treatment responses of the hosts.
Table 1 shows the number of cell lines, the number of drugs, and the overlap of drugs with the GDSC data in each data set.
2.2. Problem Setting and Performance Metrics
We studied two variants of problem settings that represent the use cases of precision oncology and drug development, respectively.
The goal of precision medicine is to predict the effect of a range of available drugs for a given, previously unseen, tumor case. Drug sensitivity is measured in terms of the inhibitory concentration IC50 for the CCLE data set, in terms of the AUC for the Beat AML and the PDO data sets, and in terms of tumor growth for the Xenografts data set. For precision medicine, we evaluated predictive performance as the mean value, across cell lines, of the Pearson correlation between predicted and measured drug sensitivity for all drugs. This metric was derived for tumor cases not used in training, corresponding to the cell cold-start problem. The average correlation between observed and predicted inhibitory concentration over all cell lines measures a model’s ability to rank drugs according to their inhibitory capacities for a new tumor case—i.e., cell line—at hand.
Note that the Pearson correlation is translation and scale invariant. A predictive model that scales the inhibitory concentrations incorrectly while sorting compounds perfectly according to their true inhibitory concentrations can achieve a perfect Pearson correlation. This corresponds exactly to the goal of identifying the best candidate drugs for a given cell line. We also report the mean squared error (MSE) to highlight the mean deviations of the predictions from the ground truth.
For drug development, we evaluated the mean value, across drugs, of the Pearson correlation between predicted and measured drug sensitivity for all cell lines. This calculation was performed for drug compounds that were present in the training data, corresponding to the drug cold-start problem. The average correlation over all drugs quantifies a model’s ability to identify cell lines for which a novel candidate compound may be an effective inhibitor.
Again, the Pearson correlation, as an evaluation metric, quantifies the model’s ability to identify the most promising cell lines for a give drug compound while abstracting from the scale and translation of the output values. Additionally, we report the mean squared error (MSE) between predicted and ground-truth inhibitory concentrations.
We judged the statistical significance of differences in the performances of models with two-sided paired Student’s t-tests with a p value threshold of .
2.3. Experimental Setting
We used the GDSC database for pre-training and each of the remaining data sets of
Table 1 as the target domain. We employed 10-fold cross-validation to evaluate all models. For precision oncology (cell cold-start), we split the target data along cell lines such that no cell line occurred in the training and test portions at the same time. For the CCLE data set in which cell lines partly overlap with GDSC, we removed target cell lines from the GDSC database prior to training to avoid data leakage from the training to the testing data. For the drug-development use case (drug cold-start), we split the target data by drug and removed drugs that occur in the target data from GDSC training data.
In each cross-validation step, all models were first pre-trained with GDSC data and then fine-tuned by training on the training portion of the target data set. To investigate the impact of the size of the target data set, we repeated fine-tuning on fractions of the training data. The performances of these pre-trained models were compared to those of models trained on the target data set alone. We trained the models with early stopping (patience of 5): we used 90% of the training data for training and 10% of the training data for early-stopping validation.
Models were trained on two different data sets (one for pre-training and the other for fine-tuning), which is not straightforward because the transcriptomic features exhibit a covariate shift due to different RNA measuring methods. We used the data harmonization technique COMBAT, which is based on a linear mixed model to transform the RNA measurements [
18]. By applying the COMBAT method, we ensured that the distributions of RNA measurements for the GDSC and the target data set are similar. To avoid data leakage, the COMBAT method was only fitted on the pre-training and training data and then applied to the testing data.
We trained all models using the Keras [
19] and Tensorflow [
20] libraries and the NVidia CUDA platform on a NVIDIA A100-SXM4-40GB GPU. We implemented the evaluation framework using the scikit-learn [
21] machine-learning package. The code can be found online at
https://github.com/prassepaul/mlmed_transfer_learning (accessed on 14 July 2022).
2.4. Drug-Sensitivity Models
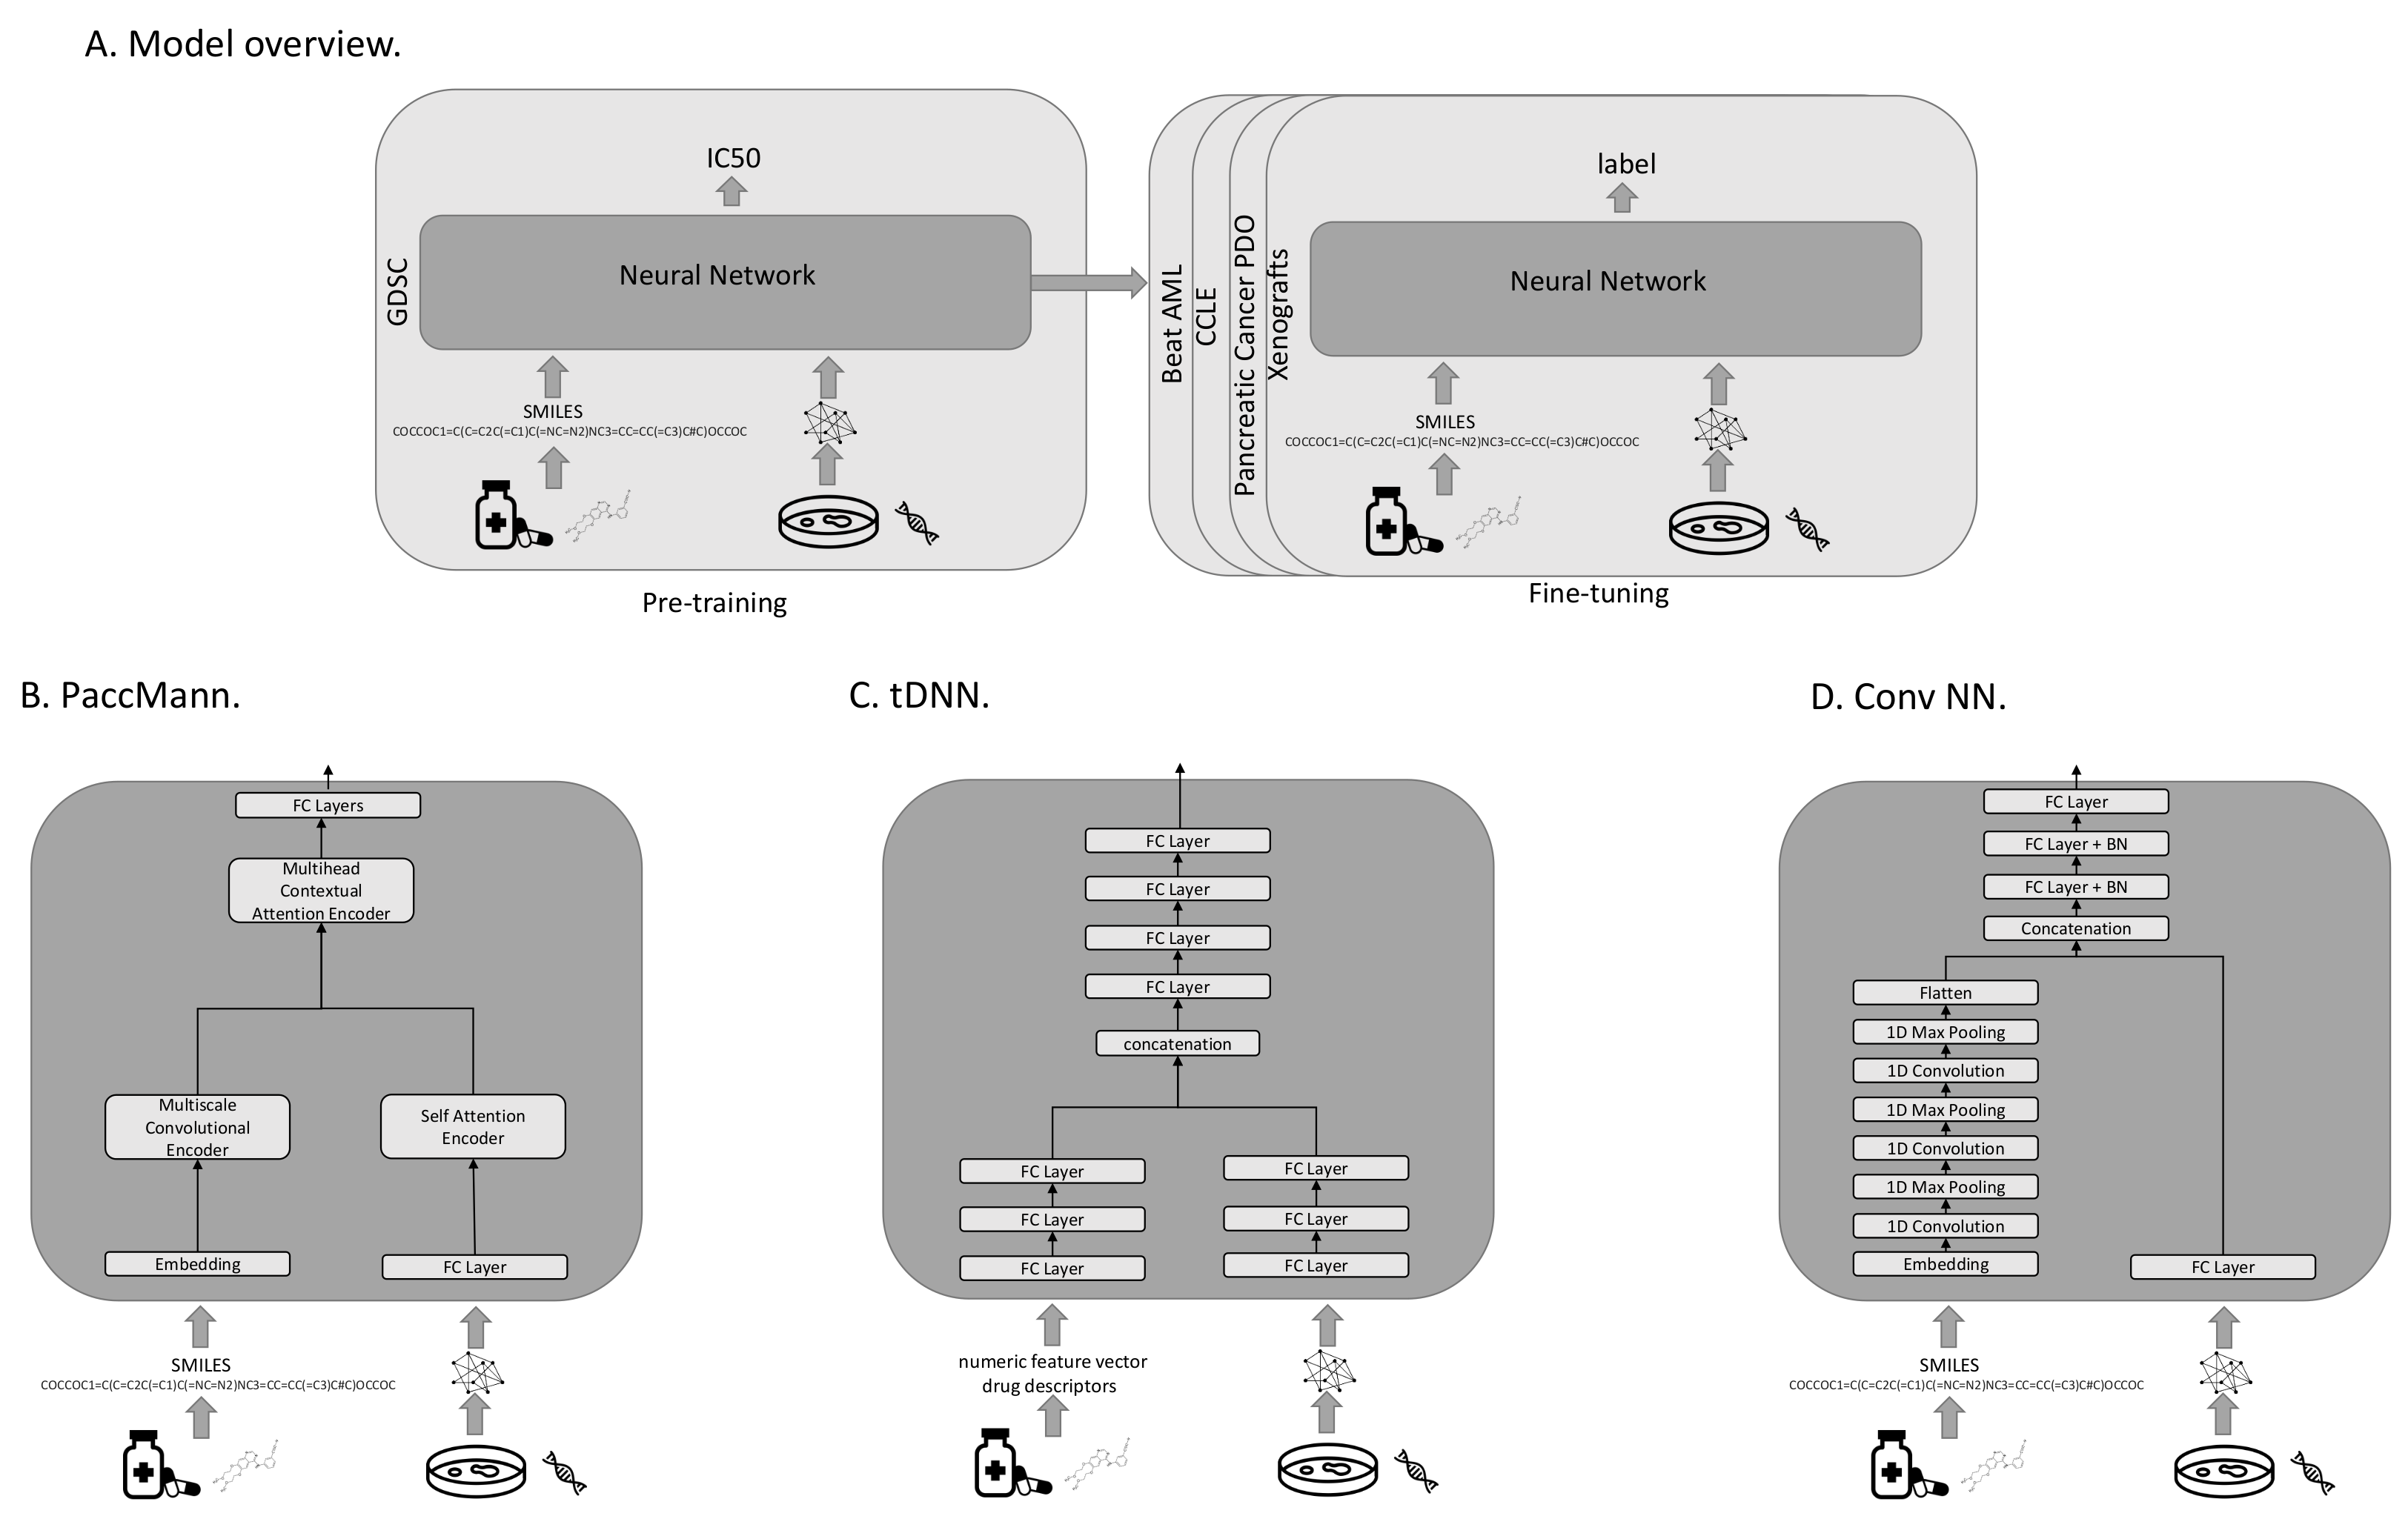
All investigated models were pre-trained to predict the IC50s on the GDSC data. For fine-tuning on one of the target domains, the output layer was replaced with a layer that produces the appropriate target output metric (see
Figure 1A). All models use transcriptomic features to characterize the cancer cases, and either sets of molecular features or SMILES strings representing the drugs. A SMILES string is a one-dimensional representation of a molecule, based on a walk in the atom-bond network structure. In our evaluation protocol, we compared three different models with each other: PaccMann [
7], tDNN [
6], and a convolutional neural-network architecture (Conv NN).
2.4.1. PaccMann
PaccMann [
7] is a state-of-the-art model that predicts the effectiveness of drugs on cancer cell lines (see
Figure 1B). PaccMann incorporates prior knowledge about drug-target information and protein–protein interactions to restrict the number of gene expression features used by the neural network to relevant genes. Using network propagation on a protein–protein interaction network [
22], the 20 highest-scoring genes for each compound are identified, which results in a total set of 2089 relevant target genes, for which expression levels are used in the model. PaccMann uses attention-based network modules to encode both the tokenized SMILES string and the gene expression data. The network parameters are trained to minimize the mean squared error.
2.4.2. tDNN
The tDNN model uses two sub-networks [
6] of three hidden dense layers each. The first sub-network processes the gene expression, the second one receives the drug descriptors as input (see
Figure 1C). The outputs of the two sub-networks are concatenated and then passed to four hidden dense layers before output. In each hidden layer, the number of nodes is reduced by 50%, starting with 1000 nodes after the input. Parameters are trained to minimize the mean-squared error.
This model uses expression levels for a set of around 1900 genes, including genes that represent cellular transcriptomic changes identified by the LINCS project [
23], cancer-related genes collected from OncoKB [
24], and cancer-related genes from GDSC [
4]. The model uses approximately 1600 descriptive features for the drugs that are computed using the commercial Dragon software package. Features include numeric features based on the molecular structure, such as the simplest atom types, functional groups and fragment counts, topological and geometrical descriptors, estimations of molecular properties, and drug-like and lead-like indices. We reconstructed these features using the open-source Python libraries RDKit (
https://github.com/rdkit/rdkit, accessed on 14 July 2022) and Mordred (
https://github.com/mordred-descriptor/mordred, accessed on 14 July 2022).
2.4.3. Conv NN
The third neural-network architecture under investigation (Conv NN) consists of two sub-networks. The first processes the tokenized SMILES string using an embedding layer, followed by three layers of one-dimensional convolutions and max-pooling to extract important features from the molecule structure. The result of the first sub-network is then converted to a flat vector and concatenated with the output of the second sub-network. The second sub-network consists of a fully connected layer that processes the gene expression input. The concatenation of the two sub-networks is then fed into three fully connected layers with batch normalization before the output layer (see
Figure 1D). The network parameters are trained to minimize the mean-squared error.
2.5. Plausibility Evaluation of Model Predictions
In order to assess the reliability of the different models, we investigated the biological plausibility of the high-ranked features (genes) identified by the models. We used the
integrated gradients method to highlight the most important features for a given input sequence [
25] using an all-zeros baseline. Integrated gradients can compute the contributions of genes when classifying a drug–PDO pair. Subsequently, we performed over-representation analysis for the top-ranked genes on pre-annotated pathway gene sets as provided by the ConsensusPathDB [
26] using Fisher’s exact test. Pathway
p-values were corrected according to the Benjamini–Hochberg method.
3. Results
This section reports the results and findings of our evaluation.
Table 2 shows the raw experimental results.
3.1. Transfer Learning Facilitates Precision Oncology
In the context of precision oncology (cell cold-start),
Table 2 shows a common pattern for all investigated models: When up to 1000 training examples from the target domain are available, pre-training significantly improves the predictions for precision oncology compared to training from scratch. Results marked with an asterisk (“*”) indicate significant improvements (
, based on a two-sided Student’s
t-test). When using 100 training examples, the pre-trained models always performed better for the CCLE, BeatAML, and Organoid data when evaluating the models based on the mean squared error (MSE). For the CCLE data, MSEs between 0.172 and 0.532 were achieved using models trained from scratch, versus MSEs between 0.11 and 0.136 for pre-trained models. For the Beat AML data, MSEs between 0.088 and 0.561 were achieved using models trained from scratch, versus MSEs between 0.056 and 0.07 for pre-trained models. For the Organoid data, MSEs between 0.028 and 0.524 were achieved, versus MSEs between 0.02 and 0.032 for pre-trained models.
When more than 1000 tuning examples from the target domain were available, the difference between pre-trained and trained-from-scratch models became insignificant in most cases. There was no case in which a pre-trained model was significantly worse than the corresponding model trained from scratch.
In most cases, even the pre-trained model without any fine-tuning was already a reasonable baseline; the model trained from scratch took roughly between 100 and 500 training examples from the target domain to outperform the corresponding model that had only been trained on GDSC. When less than 100 training examples from the target domain were available, fine-tuning was often detrimental for the GDSC-trained model. This is plausible because the subsequent gradient-update steps can over-fit the initially reasonable models to extremely small tuning samples. For the Xenograft data with only 19 patients and 3 drugs, the GDSC-trained models are more accurate than all fine-tuned models.
3.2. Transfer Learning Facilitates Drug Development
In the drug-development use case (drug cold-start),
Table 2 reports generally lower Pearson correlation values than for precision oncology. This is plausible for two reasons: Firstly, the training data contain roughly three times as many cell lines as drugs; generalization across drugs is therefore based on fewer data than generalization across cell lines. Secondly, we believe that the transcriptomic features facilitate generalization across cell lines because cell lines with similar transcriptomes are likely to share similar drug sensitivities. By contrast, compounds with similar SMILES strings, or in the case of the tDNN model, similar features calculated by the Dragon software package, do not necessarily share similar pharmaceutic effects to the same extent.
In contrast to precision oncology, we also found the performance benefit of pre-trained models in drug development settings to be generally less dependent on the number of drug–cell-line pairs. Instead, we observed an increase in predictive performance by pre-training over the complete range of sample sizes, similarly for all considered prediction models and all target data sets. In many cases, the improvements by pre-training are significant. The results for the extremely small in vivo xenograft data set are not conclusive.
When using 100 training examples, the pre-trained models always performed better on the CCLE, BeatAML, and Organoid data when evaluated using the MSE. For the CCLE data, MSEs between 0.231 and 0.588 were achieved using models trained from scratch, versus MSEs between 0.197 and 0.222 for pre-trained models. For the Beat AML data, MSEs between 0.079 and 0.478 were achieved using models trained from scratch, versus MSEs between 0.061 and 0.068 for pre-trained models. For the Organoid data, MSEs between 0.044 and 0.498 were achieved, versus MSEs between 0.043 and 0.053 for pre-trained models.
3.3. Transfer Learning Improves the Plausibility of Features
We compare the feature importance values attributed to the genes between pre-trained and scratch models (cf. Methods) and exemplify this with the pancreatic cancer PDO data set [
17] for the PaccMann method [
7]; cf.
Table 2.
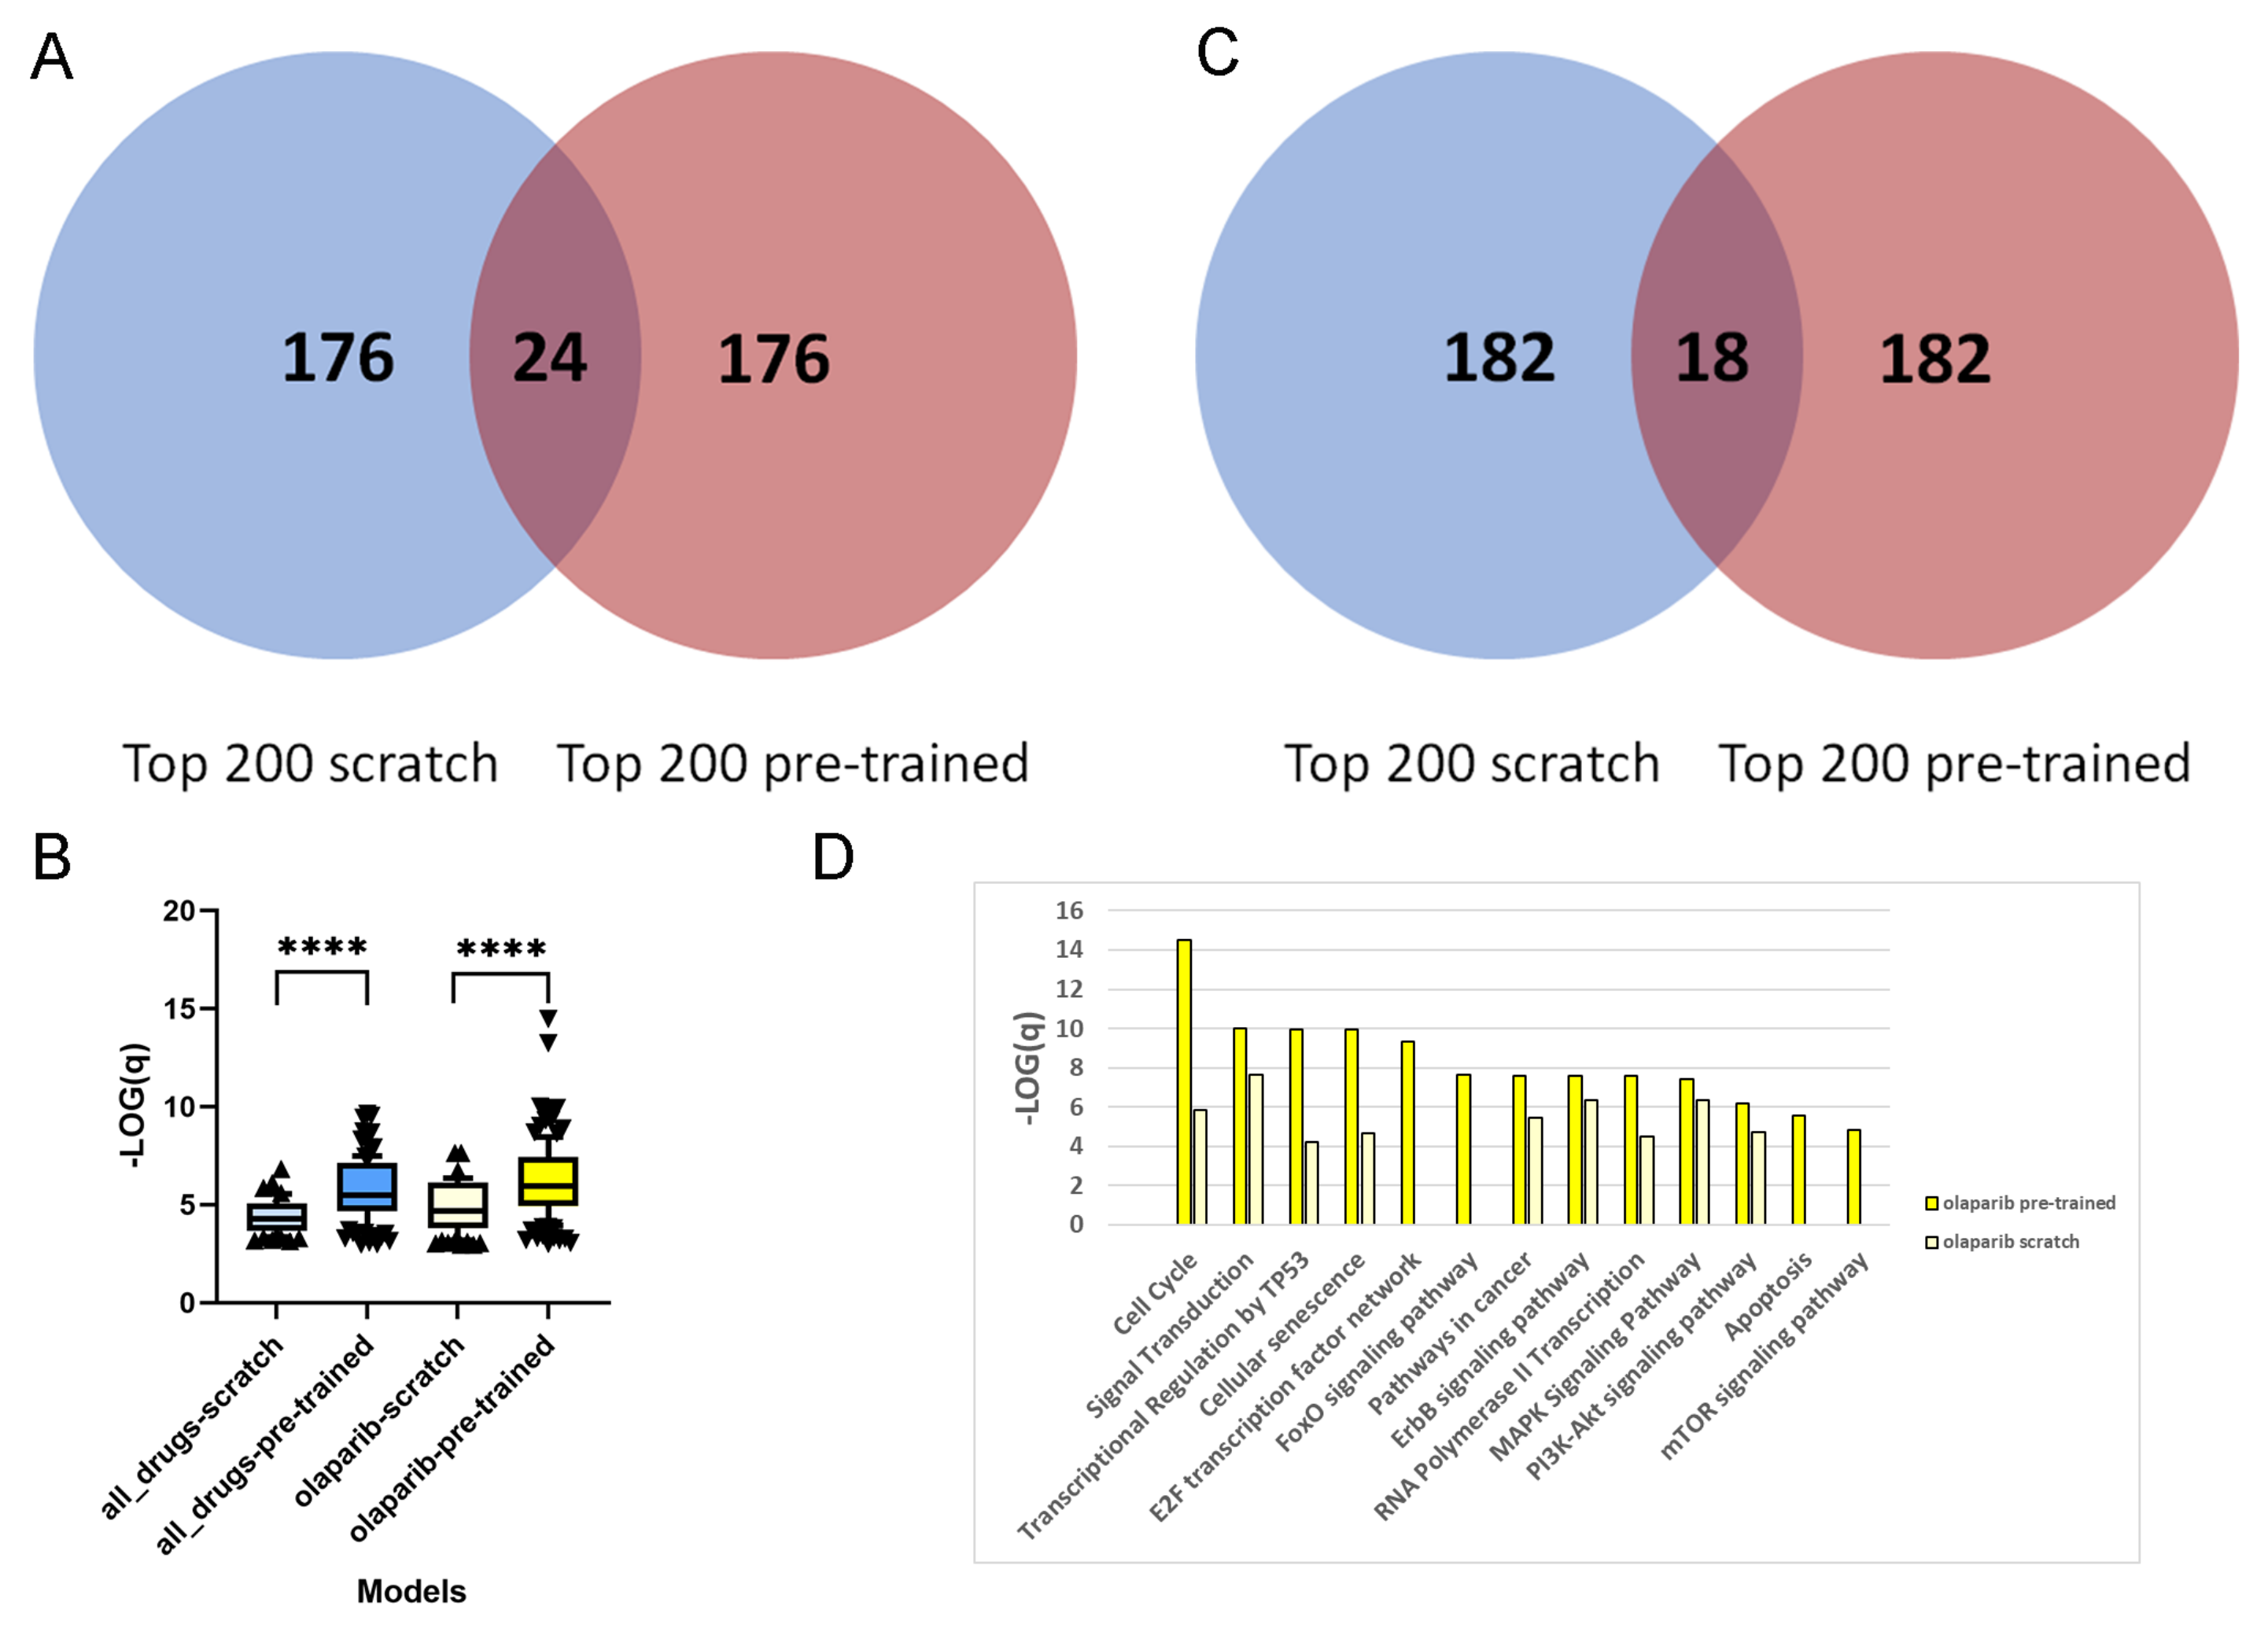
For each of the 1093 drug–PDO pairs, the pre-trained and scratch models assigned a feature importance value to all of the genes. In a first step, we extracted for each gene the overall sum of feature importance values across all drug–PDO pairs. From the total of 2029 attended genes, we were interested in the top-ranked genes from pre-trained and scratch models, and we observed that these genes are fairly different, there being only 24 overlapping genes (12%;
Figure 2A). This suggests that pre-training leads to a different set of genes being selected by the model compared to scratch predictions. This observation holds as well with other thresholds. Over-representation analysis with pre-annotated pathways resulted in 62 enriched pathways for the 200 top-ranked genes of the scratch model, in contrast to 120 enriched pathways for the 200 top-ranked genes of the pre-trained model (overlap of 48 pathways), which indicates much higher biological information content of the pre-trained model genes. Moreover,
Figure 2B shows that the levels of enrichment and over-representation of pre-trained model genes are far more significant than those of scratch model genes (
), indicating a more plausible feature selection.
Next, we repeated the analysis by extracting the top 200 ranked genes of the scratch and pre-trained models for a specific drug. We chose the PARP inhibitor olaparib, since this is an approved targeted therapy for pancreatic cancer [
27], and summarize the feature importance values of the 44 olaparib–PDO pairs. As in the overall analysis, the selected genes are very distinct and overlap in 18 genes only (9%;
Figure 2C). Furthermore, over-representation analysis with the 200 top-ranked genes from the scratch model resulted in 84 enriched pathways, in contrast to 126 enriched pathways for the 200 top-ranked genes from the pre-trained model (overlap 54 pathways). As previously, the level of enrichment with the pre-trained model genes was far more significant (
;
Figure 2B). Olaparib inhibits the poly(ADP-ribose) polymerase 1 and 2 genes (PARP1 and PARP2), which play an important role in DNA damage repair [
28], and thus targets genome integrity. We found that the top-ranked genes from the pre-trained model enrich a couple of relevant pathways related to DNA repair and replication, for example, "cell cycle" (
q-value
), "cellular senescence" (
), "Apoptosis" (
), "transcriptional regulation by TP53" (
), "E2F transcription factor network" (
), and "MAPK signaling" (
). These pathways were far less enriched by the top-ranked genes from the scratch model (
Figure 2D).
3.4. Transfer Learning Improves Predictions towards Established Therapies in Pancreatic Cancer
The PDOs used by Tiriac et al. [
17] represent a wide range of therapeutically relevant pancreatic cancer samples. We observe that the accuracies of pre-trained models are higher than those of models trained from scratch (see
Table 2). This holds particularly for established therapies. The major chemotherapies for pancreatic cancer are gemcitabine/paclitaxel and FOLFIRINOX, which is composed of several components such as 5-FU, irinotecan (SN-38), and oxaliplatin [
27,
29].
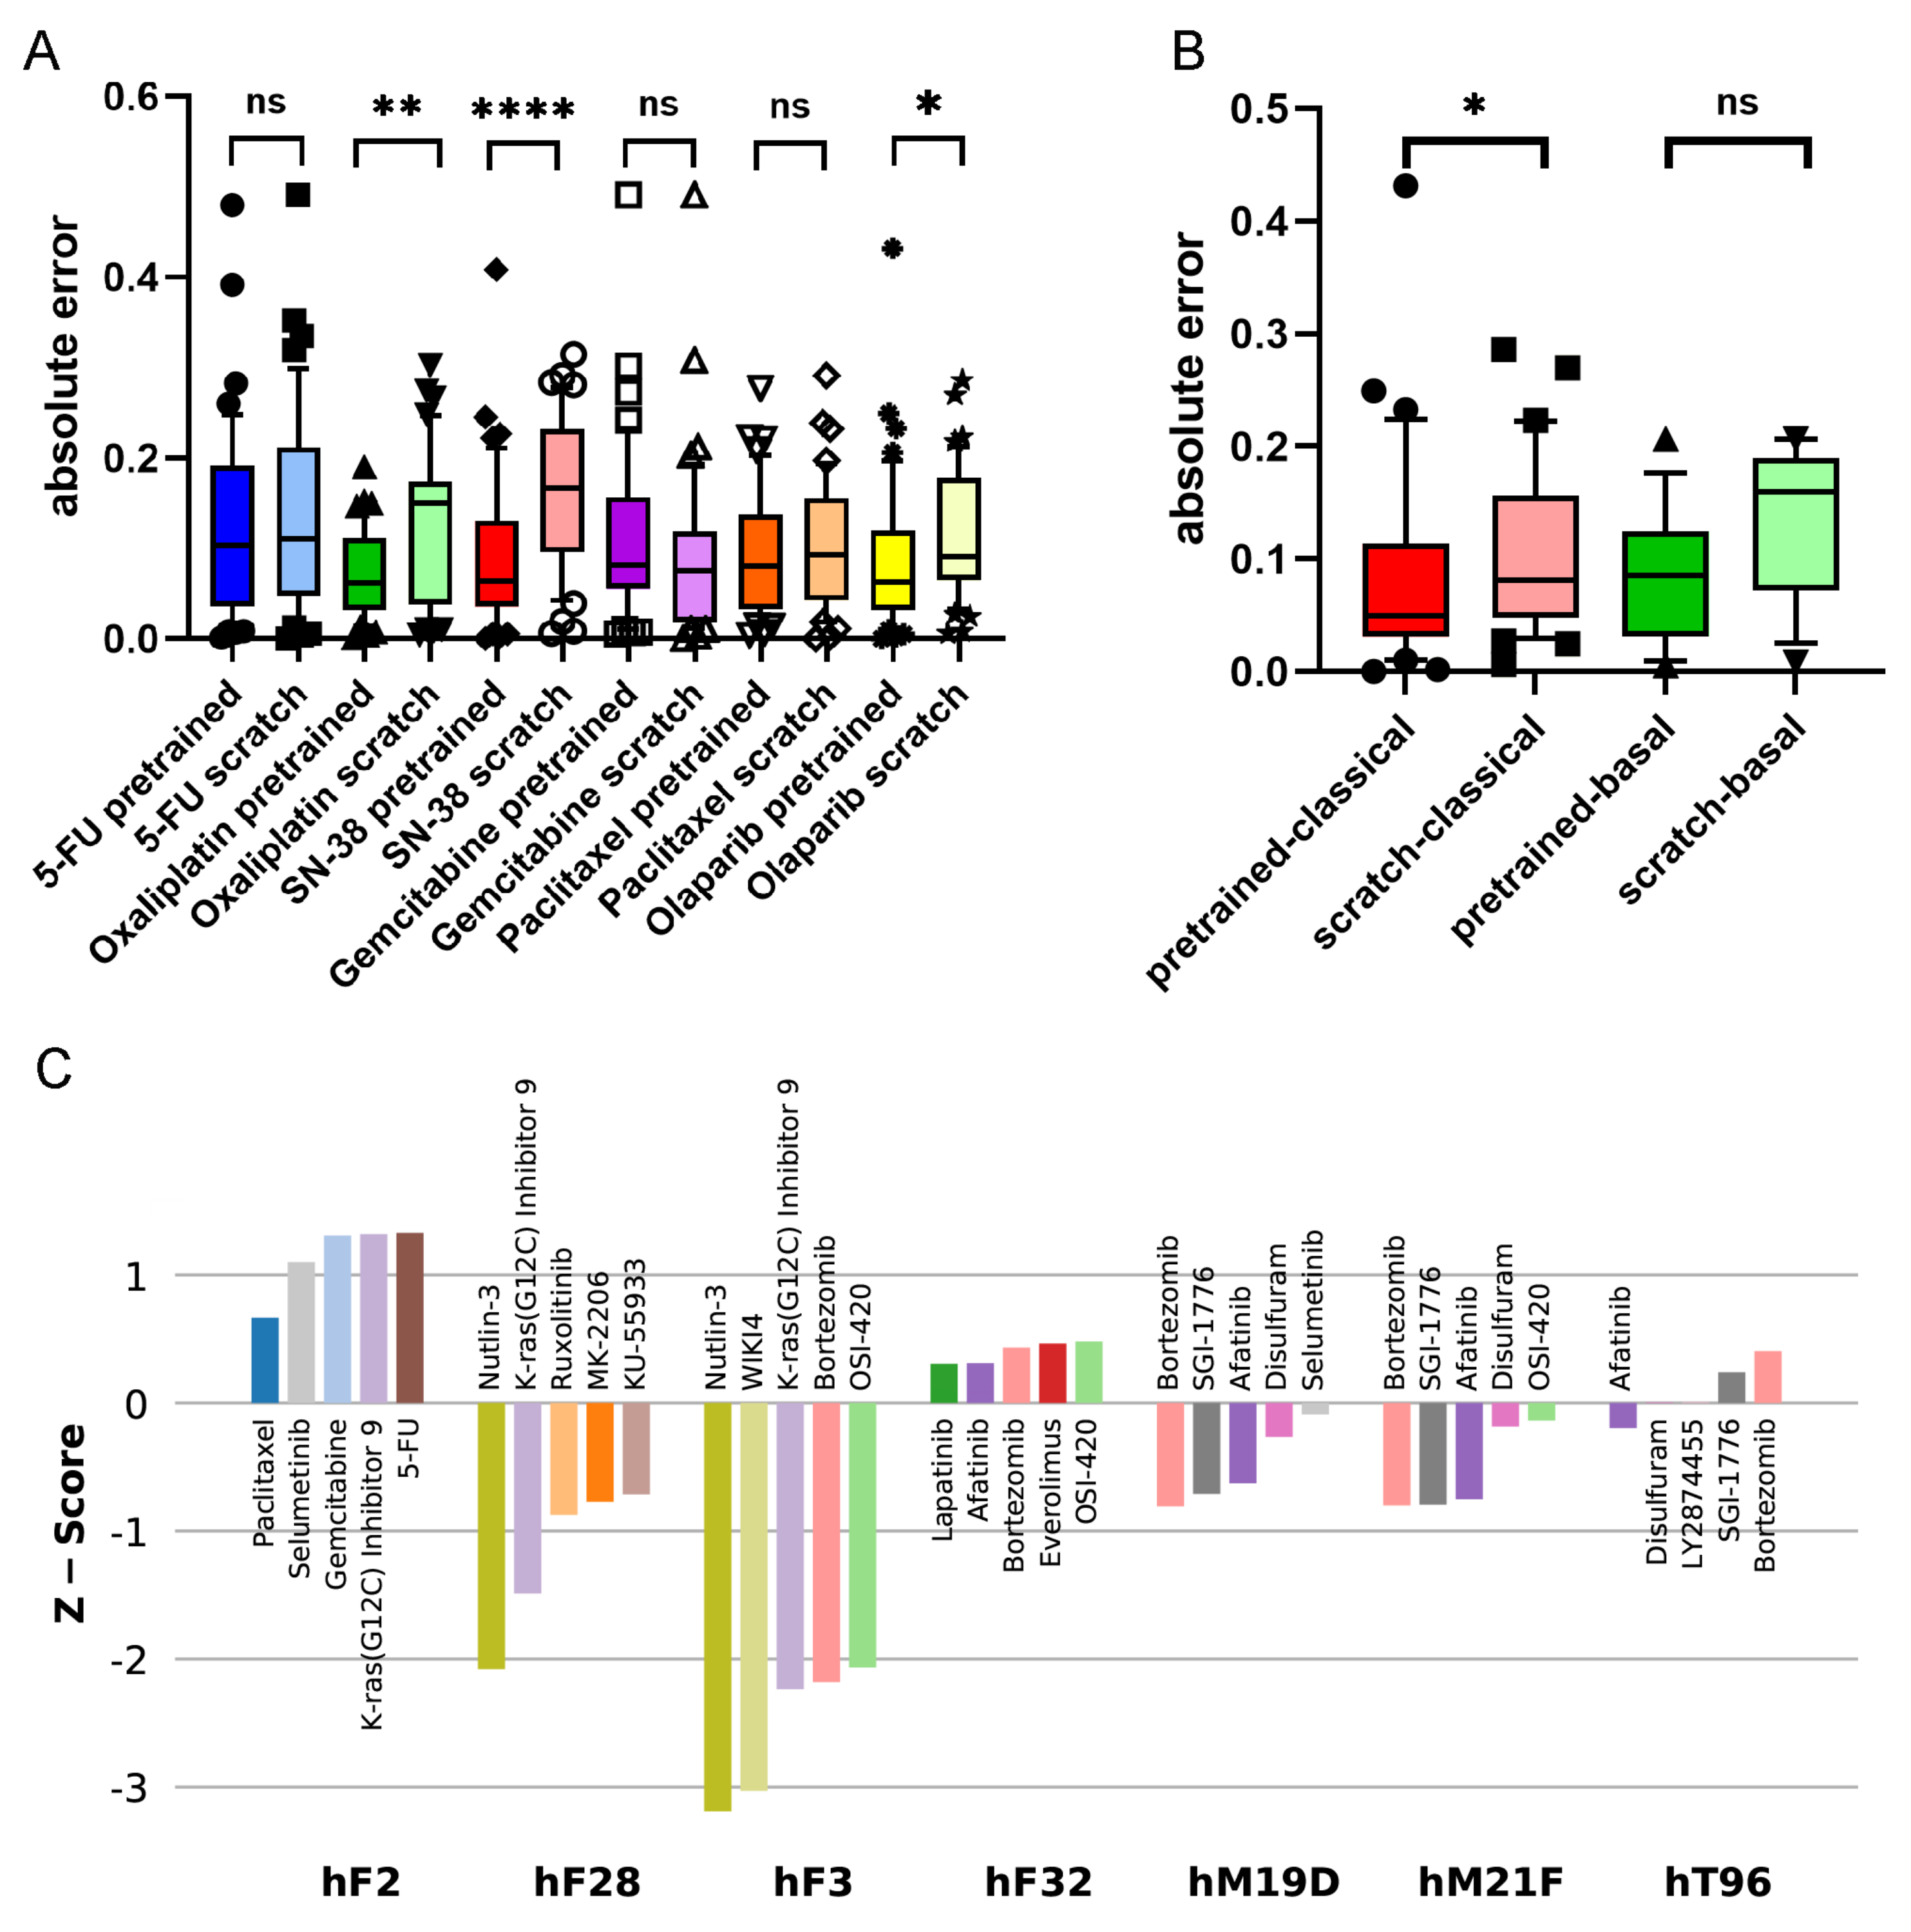
Figure 3A shows the accuracies of the pre-trained and scratch models, measured in absolute differences of the predicted and measured AUCs for all drug–PDO pairs, in the case of the PaccMann model. It is observable that for most drugs—except gemcitabine—the pre-trained model predicted the AUC more accurately than the scratch model without pre-training. This increase in prediction accuracy was significant in the cases of oxaliplatin (
); SN-38 (
), the active metabolite of irinotecan; and the targeted therapy olaparib (
) that has initially been approved for breast and ovarian cancers with BRCA mutations.
The 44 PDOs can be further subdivided into molecular subtypes, a basal subtype (13 PDOs), and a classical subtype (31) [
30]. Improvement is also observable concerning these subtypes; for example, the targeted drug olaparib has better predicted AUCs in both subgroups when comparing the pre-trained model versions with the scratch models (see
Figure 3B). For the classical subgroup, this difference in prediction accuracy is significant (
), and for the basal subgroup, the difference is weakly significant (
).
3.5. Transfer Learning Offers Novel Treatment Options
Since AUCs indicate sensitivity and resistance, respectively, of the PDO to the drug, we are interested in whether the pre-trained model can be used for predicting individual responses of the PDOs to different drugs. Since drugs have different sensitivity ranges, it is difficult to directly compare drugs based on AUCs. We, therefore, denote for each drug the
z-scores for the 44 PDOs.
Figure 3C shows the drugs with the five lowest
z-scores for selected PDOs. Consistent results could be derived for, for example, the PDO hF28: the second-lowest AUC
z-score for this PDO has been assigned to the drug KRAS-G12C, an inhibitor of the KRAS mutant protein (
z-score = −1.49). This is consistent with the mutational status of the PDO; it has been documented that hF28 is KRAS-mutated (G12D) with an allele frequency of 46%. Furthermore, Tiriac et al. [
17] presented intensive patient treatment history for one patient (PDO hF2) that was found resistant for paclitaxel and weakly responsive for oxaliplatin and 5-FU so that the patient had to be treated with second-line therapies. The results of the pre-trained model for this PDO show overall poor responses for all drugs under study. Although paclitaxel has the lowest
z-score for this PDO among all drugs in the pre-trained model (0.67), the score is not significant, and also the scores for 5-FU (1.33) and oxaliplatin (2.46) indicate resistance rather than sensitivity.
Established first-line therapies (see above) are among the top five predicted drugs for 30 of the 44 PDOs (68%) and among the top 10 predicted drugs for 39 (89%). For five PDOs, the model predicted other options (hF3, hF32, hM19D, hT96, hM21F). All these five PDOs had KRAS mutations; for one PDO (hF3), the mutated-KRAS inhibitor KRAS-G12C was among the top five predictions, and for the other four PDOs, afatinib was among the top five predictions. This result shows agreement with the literature: a recent clinical phase-I study was reported for the application of afatinib (together with selumetinib) against KRAS-mutated tumors in patients suffering from pancreatic and other cancers [
31]. We conclude that it is possible to deduce plausible treatment options from the pre-trained prediction model.
4. Discussion
We have explored a method for training pre-clinical anti-cancer drug-sensitivity models that are based on pre-training on in vitro drug-sensitivity data and fine-tuning on drug-sensitivity data based on patient-derived cell cultures, xenografts, or organoid models. We have explored pre-training of state-of-the-art model architectures [
6,
7] and reasonable baseline methods.
From our experiments, we can conclude that pre-trained models outperform models that have been trained on the target domain in the vast majority of cases. This is particularly true for target data sets with up to 1000 training instances from the target domain. When fewer than 100 tuning instances from the target domain are available, fine-tuning can even be detrimental to the pre-trained model. Moreover, there was no case in which a model that had only been trained on data from the target domain significantly outperformed the pre-trained model. Perhaps surprisingly, no dominant model architecture emerged in our experiments; the simple convolutional neural network appears largely on par with PaccMann and tDNN. This finding underscores the overwhelming importance of training data, which can easily outweigh improvements in model architectures.
For the xenograft data, fine-tuning did not achieve a significant improvement over the GDSC-trained model. This may have been due to the small sample causing the initially reasonable pre-trained model to over-fit.
By contrast, we have shown that pre-training improves the prediction model for PDOs. PDOs have recently gained popularity in drug testing, since they map tumor heterogeneity while preserving the molecular characteristics of the original cancer. Their usage in personalized medicine is currently under investigation by many research groups [
17,
32]. We have explored how the large body of cell line drug-sensitivity data can be used to aid in this development. We showed that pre-training with in vitro data improves prediction error in the vast majority of PDO–drug pairs, particularly for approved drugs (
Figure 3). In addition, we showed how the prediction models can be used to generate plausible drug recommendations for individual PDOs.
DNN predictions have been compared, on the one hand, according to their ability to predict drug-sensitivity values (
Table 2). On the other hand, it is of interest which features gain importance based on their gene expression patterns in the prediction processes of the different models. In terms of selected features, we conclude that the computational models with pre-training identify features with higher biological plausibility than without, which could be seen with pathway over-representation analysis (
Figure 2). This holds in particular with respect to specific drugs, which has been exemplified with the inhibitor olaparib. Features selected by pre-training seem to better describe the mechanism of action of the specific drug, thereby making it biologically more plausible. This not only leads to a better prediction but may also indicate the advantages of pre-training for identifying suitable therapy markers.
We found that the precision oncology use case (cell cold-start) is generally easier than drug development (drug cold-start). We believe that this discrepancy is caused by the number of drugs in the training data being smaller than the number of cell lines, and by the transcriptomic features facilitating generalization better than the SMILES representation, and in the case of the tDNN model, numeric features calculated by the Dragon software, of drug compounds. Further research on the representations of drugs to uniquely characterize their 3D structures or their biochemical interactions may improve the model’s ability to generalize across drugs, and thereby the model’s performance in the drug development use case.


 ,
, 


