
Performance of Salivary Extracellular RNA Biomarker Panels for Gastric Cancer Differs between Distinct Populations

 , ,
, ,  and
and
Abstract
:Simple Summary
Abstract
1. Introduction
2. Materials and Methods
2.1. Saliva Collection and Processing
2.2. RNA Isolation from Saliva Samples
2.3. Validation of miRNA GC Markers
2.4. Validation of mRNA GC Markers
2.5. RT-qPCR Preamplification for Validation of mRNA Candidates
2.6. qPCR for Validation of mRNA Candidates
2.7. Statistical Analysis for qPCR
3. Results
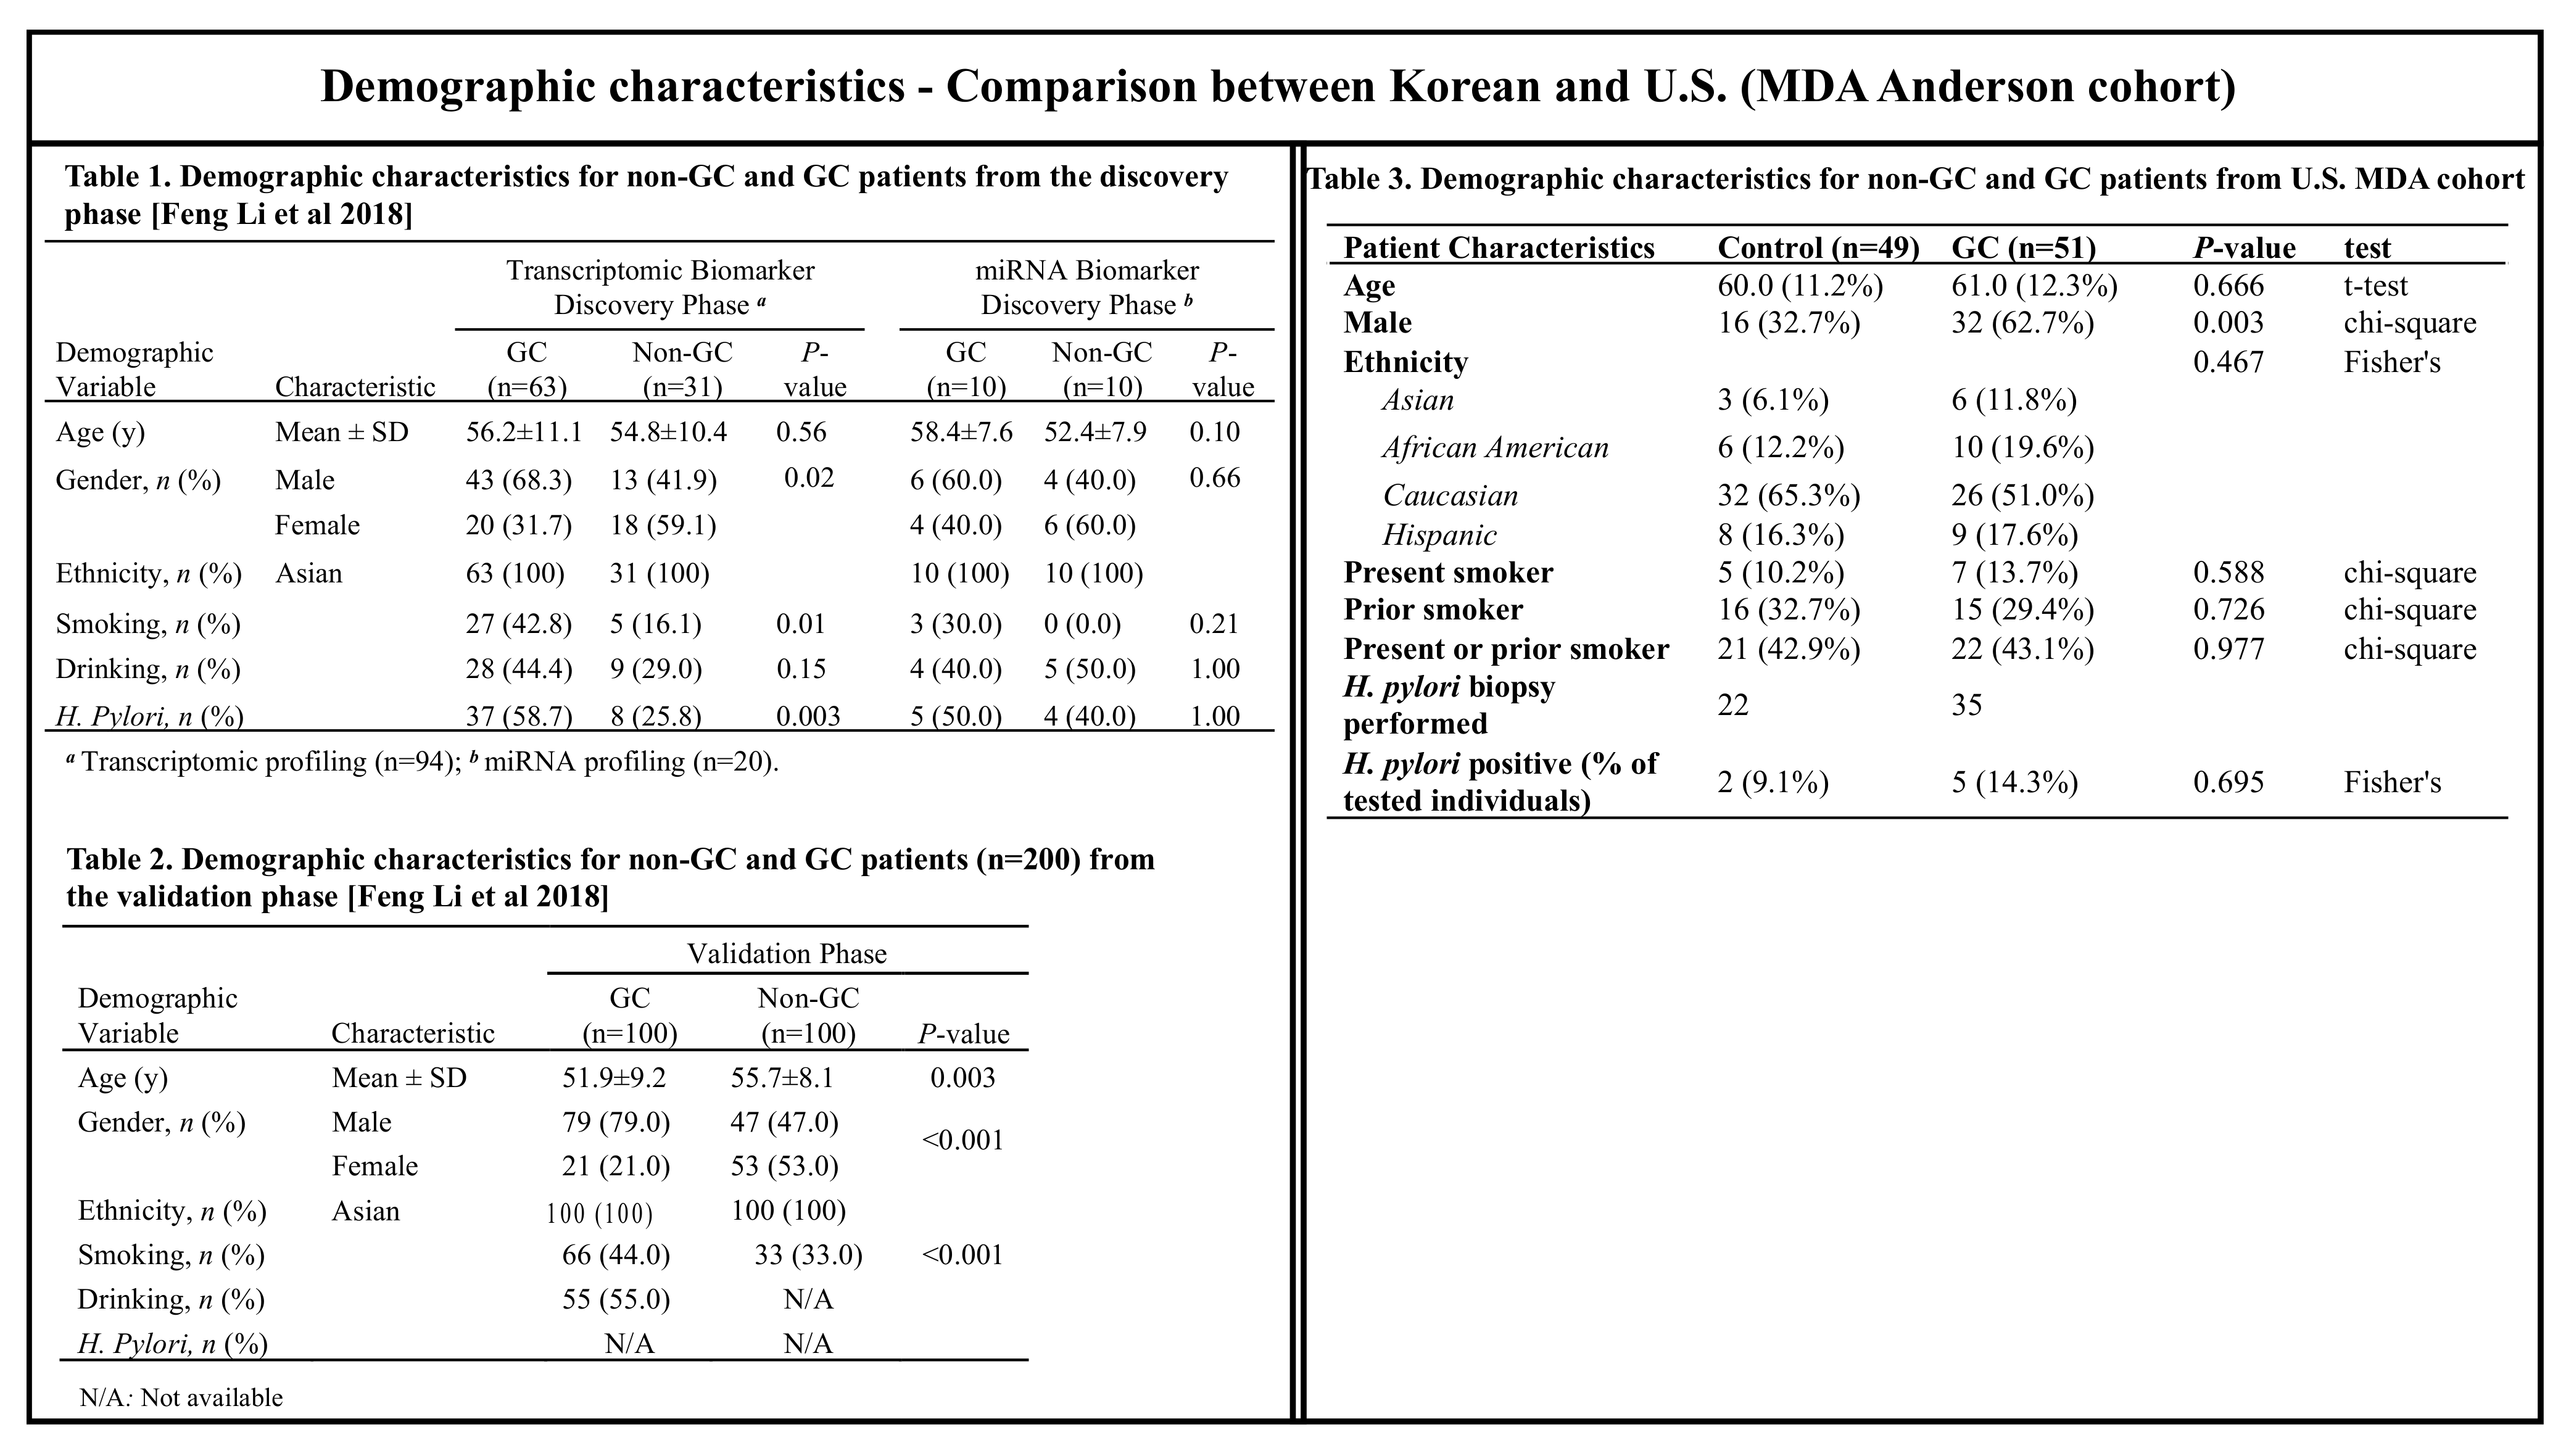
3.1. Clinicopathological Characteristics of Patients
3.2. miRNA RT-qPCR
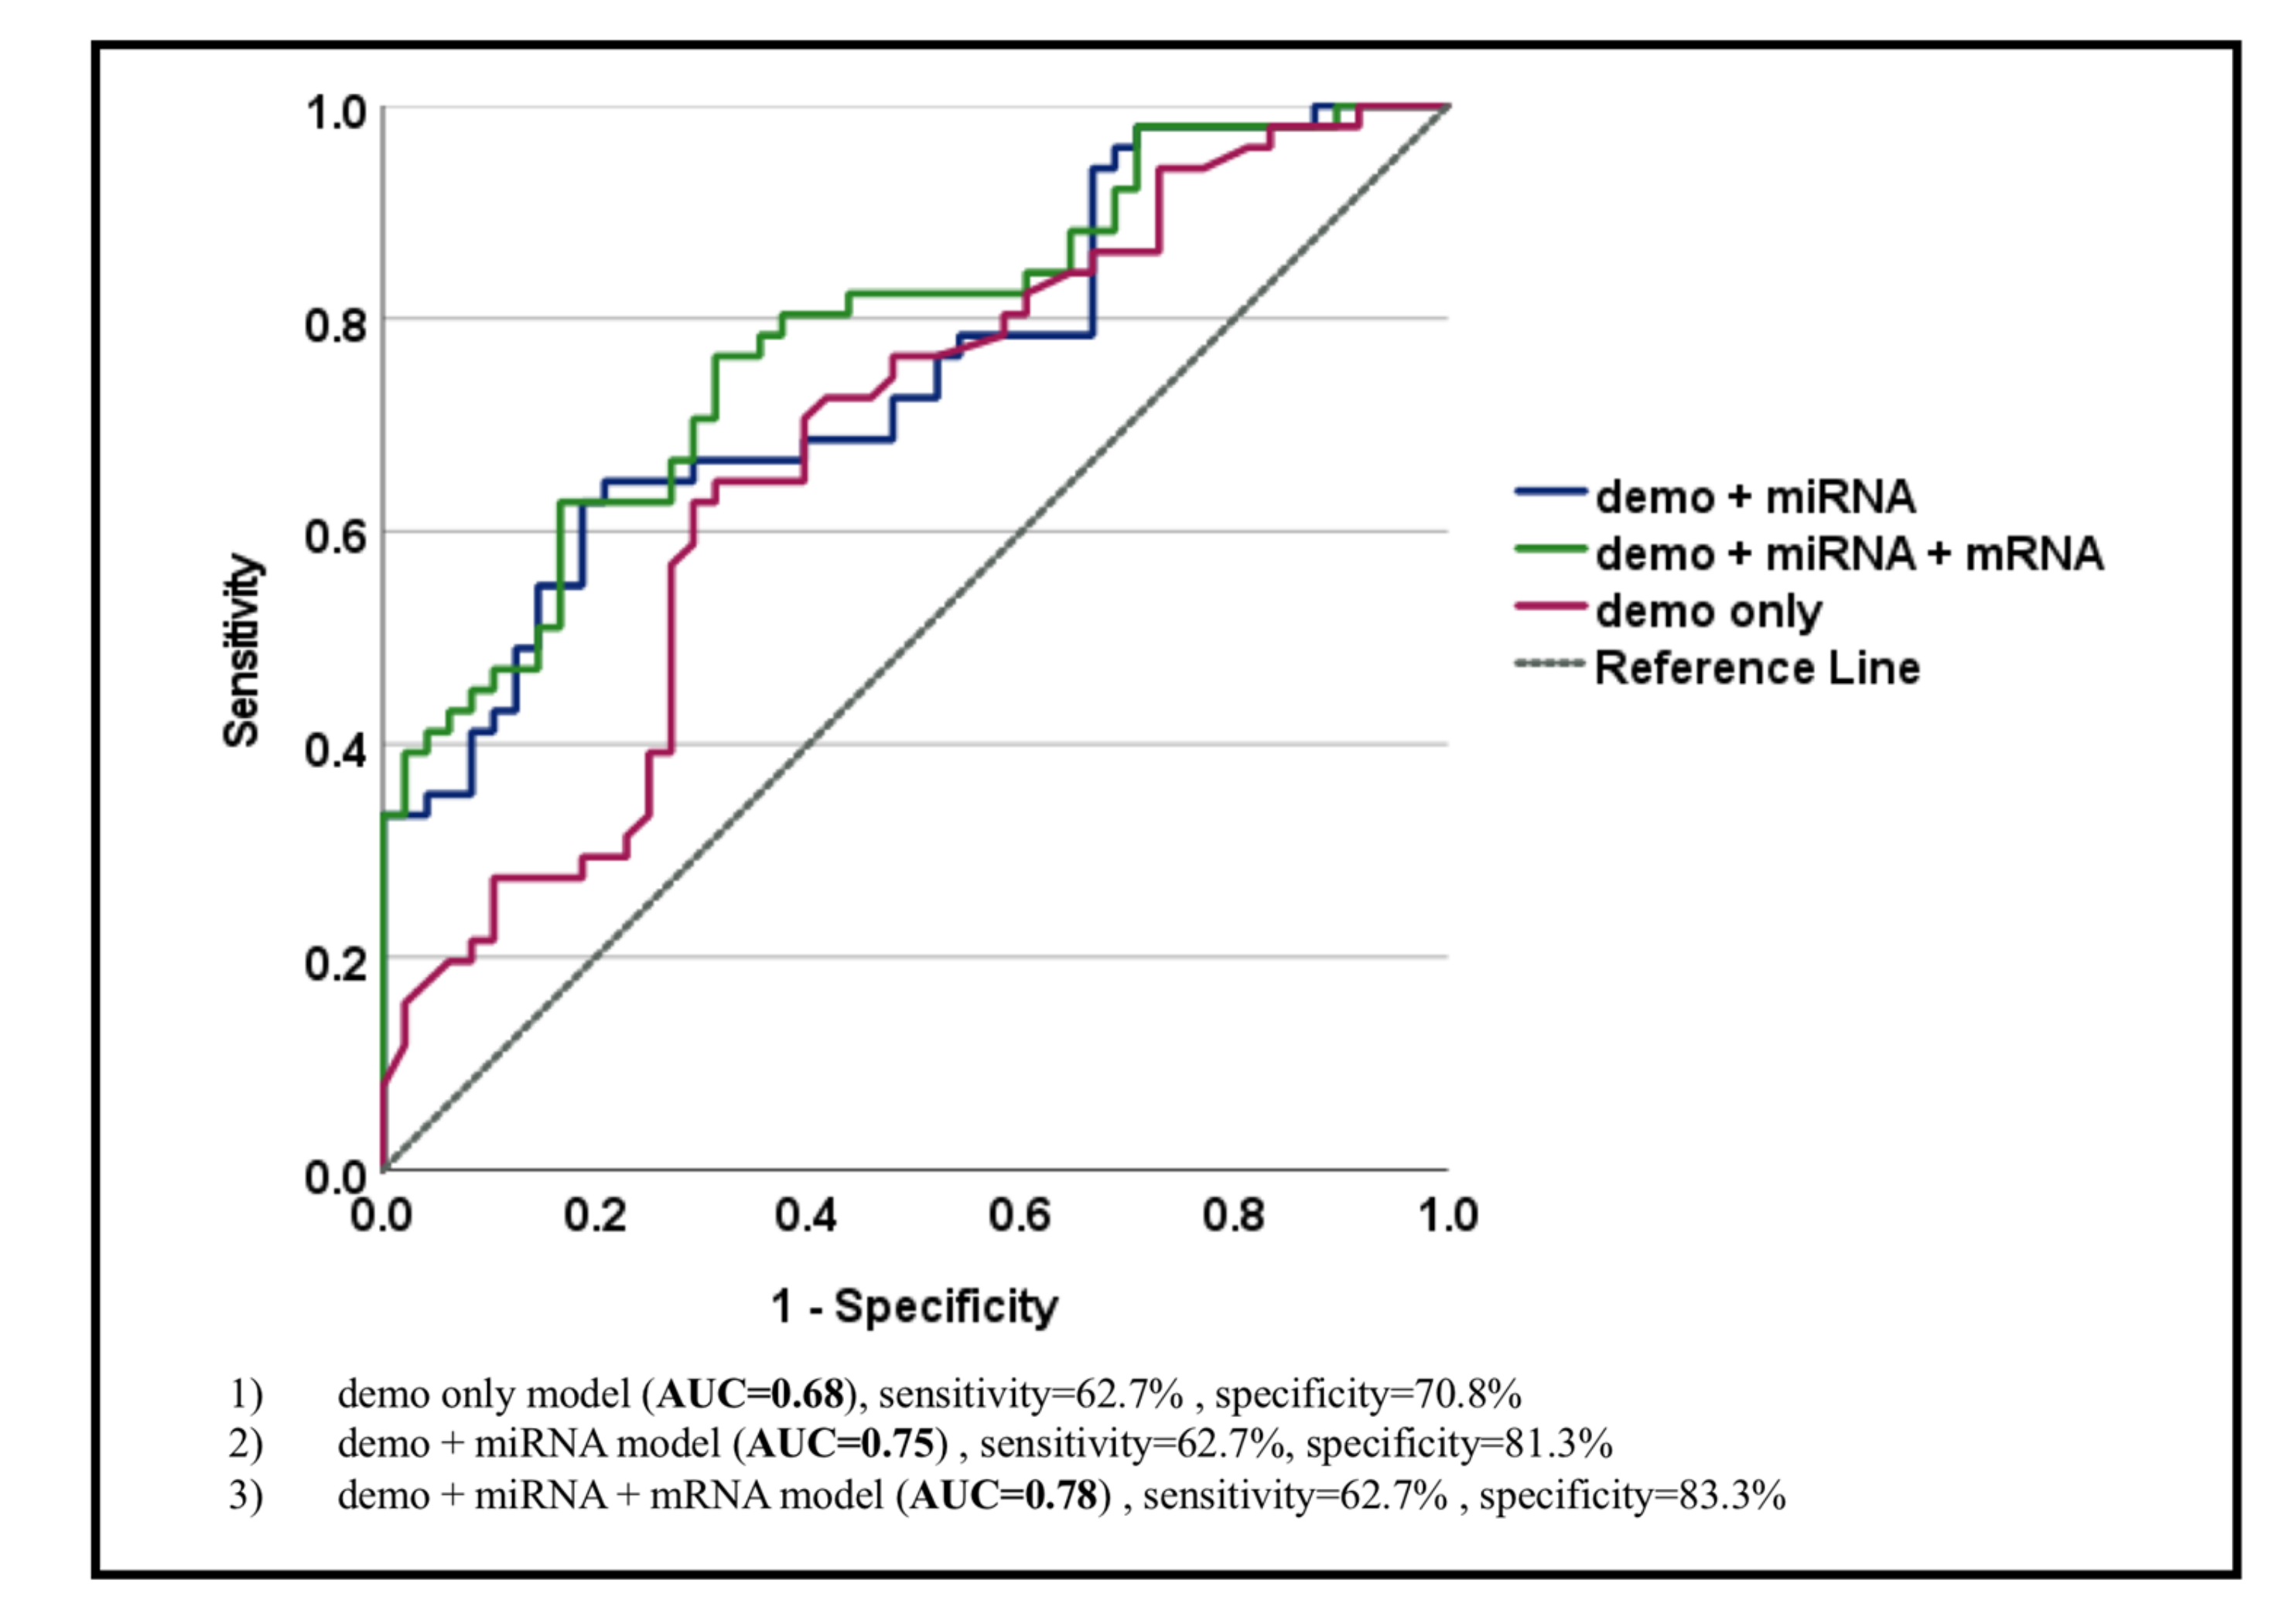
3.3. mRNA RT-qPCR
- (1)
- Model 1, a new model with only demographic characteristics (AUC = 0.68, sensitivity = 62.7%, and specificity = 70.8%);
- (2)
- Model 2, a new model with demographic characteristics and miRNA biomarkers for GC (AUC = 0.75, sensitivity = 62.7%, and specificity = 81.3%);
- (3)
- Model 3, a new model with demographic characteristics, miRNA, and mRNA biomarkers for GC (AUC = 0.78, sensitivity = 62.7%, and specificity = 83.3%).
4. Discussion
4.1. Current Biomarker Performance
4.2. Limitations, Future Studies, and Advantage of the Markers Used in This Study
5. Conclusions
Supplementary Materials
Author Contributions
Funding
Institutional Review Board Statement
Informed Consent Statement
Data Availability Statement
Conflicts of Interest
References
- Rawla, P.; Barsouk, A. Epidemiology of gastric cancer: Global trends, risk factors and prevention. Prz. Gastroenterol. 2019, 14, 26–38. [Google Scholar] [CrossRef] [PubMed]
- Bresalier, R.S. Treatment of advanced gastric cancer. In World Gastroenterology Organization Handbook on Early Diagnosis and Treatment of GI Cancer; Kuipers, E., Sung, J., Eds.; World Gastroenterology Organisation (WGO): Milwaukee, WI, USA, 2020; Available online: https://www.changing-transport.org/transfer-project-in-the-philippines/ (accessed on 23 March 2022).
- Song, Z.; Wu, Y.; Yang, J.; Yang, D.; Fang, X. Progress in the treatment of advanced gastric cancer. Tumour. Biol. 2017, 39, 1010428317714626. [Google Scholar] [CrossRef] [PubMed] [Green Version]
- Yang, L.; Ying, X.; Liu, S.; Lyu, G.; Xu, Z.; Zhang, X.; Li, H.; Li, Q.; Wang, N.; Ji, J. Gastric cancer: Epidemiology, risk factors and prevention strategies. Chin. J. Cancer Res. 2020, 32, 695–704. [Google Scholar] [CrossRef] [PubMed]
- Pectasides, D.; Mylonakis, A.; Kostopoulou, M.; Papadopoulou, M.; Triantafillis, D.; Varthalitis, J.; Dimitriades, M.; Athanassiou, A. CEA, CA 19–9, and CA-50 in monitoring gastric carcinoma. Am. J. Clin. Oncol. 1997, 20, 348–353. [Google Scholar] [CrossRef] [PubMed]
- Pasechnikov, V.; Chukov, S.; Fedorov, E.; Kikuste, I.; Leja, M. Gastric cancer: Prevention, screening and early diagnosis. World J. Gastroenterol. 2014, 20, 13842–13862. [Google Scholar] [CrossRef] [PubMed]
- Li, F.; Yoshizawa, J.M.; Kim, K.M.; Kanjanapangka, J.; Grogan, T.R.; Wang, X.; Elashoff, D.E.; Ishikawa, S.; Chia, D.; Liao, W.; et al. Discovery and Validation of Salivary Extracellular RNA Biomarkers for Noninvasive Detection of Gastric Cancer. Clin. Chem. 2018, 64, 1513–1521. [Google Scholar] [CrossRef] [PubMed] [Green Version]
- Machlowska, J.; Baj, J.; Sitarz, M.; Maciejewski, R.; Sitarz, R. Gastric Cancer: Epidemiology, Risk Factors, Classification, Genomic Characteristics and Treatment Strategies. Int. J. Mol. Sci. 2020, 21, 4012. [Google Scholar] [CrossRef]
- Patton, J.G.; Franklin, J.L.; Weaver, A.M.; Vickers, K.; Zhang, B.; Coffey, R.J.; Ansel, K.M.; Blelloch, R.; Goga, A.; Huang, B.; et al. Biogenesis, delivery, and function of extracellular RNA. J. Extracell. Vesicles 2015, 4, 27494. [Google Scholar] [CrossRef]
- Kaczor-Urbanowicz, K.E.; Trivedi, H.M.; Lima, P.O.; Camargo, P.M.; Giannobile, W.V.; Grogan, T.R.; Gleber-Netto, F.O.; Whiteman, Y.; Li, F.; Lee, H.J.; et al. Salivary exRNA biomarkers to detect gingivitis and monitor disease regression. J. Clin. Periodontol. 2018, 45, 806–817. [Google Scholar] [CrossRef]
- Henson, B.S.; Wong, D.T. Collection, storage, and processing of saliva samples for downstream molecular applications. Methods Mol. Biol. 2010, 666, 21–30. [Google Scholar] [CrossRef]
- Happel, C.; Ganguly, A.; Tagle, D.A. Extracellular RNAs as potential biomarkers for cancer. J. Cancer Metastasis Treat. 2020, 6, 32. [Google Scholar] [CrossRef] [PubMed]
- Tanaka, Y.; Kamohara, H.; Kinoshita, K.; Kurashige, J.; Ishimoto, T.; Iwatsuki, M.; Watanabe, M.; Baba, H. Clinical impact of serum exosomal microRNA-21 as a clinical biomarker in human esophageal squamous cell carcinoma. Cancer 2013, 119, 1159–1167. [Google Scholar] [CrossRef]
- Rabinowits, G.; Gercel-Taylor, C.; Day, J.M.; Taylor, D.D.; Kloecker, G.H. Exosomal microRNA: A diagnostic marker for lung cancer. Clin. Lung Cancer 2009, 10, 42–46. [Google Scholar] [CrossRef]
- Skog, J.; Wurdinger, T.; van Rijn, S.; Meijer, D.H.; Gainche, L.; Sena-Esteves, M.; Curry, W.T., Jr.; Carter, B.S.; Krichevsky, A.M.; Breakefield, X.O. Glioblastoma microvesicles transport RNA and proteins that promote tumour growth and provide diagnostic biomarkers. Nat. Cell Biol. 2008, 10, 1470–1476. [Google Scholar] [CrossRef] [PubMed]
- Balaj, L.; Lessard, R.; Dai, L.; Cho, Y.J.; Pomeroy, S.L.; Breakefield, X.O.; Skog, J. Tumour microvesicles contain retrotransposon elements and amplified oncogene sequences. Nat. Commun. 2011, 2, 180. [Google Scholar] [CrossRef]
- Noerholm, M.; Balaj, L.; Limperg, T.; Salehi, A.; Zhu, L.D.; Hochberg, F.H.; Breakefield, X.O.; Carter, B.S.; Skog, J. RNA expression patterns in serum microvesicles from patients with glioblastoma multiforme and controls. BMC Cancer 2012, 12, 22. [Google Scholar] [CrossRef] [PubMed] [Green Version]
- Chen, W.W.; Balaj, L.; Liau, L.M.; Samuels, M.L.; Kotsopoulos, S.K.; Maguire, C.A.; Loguidice, L.; Soto, H.; Garrett, M.; Zhu, L.D.; et al. BEAMing and Droplet Digital PCR Analysis of Mutant IDH1 mRNA in Glioma Patient Serum and Cerebrospinal Fluid Extracellular Vesicles. Mol. Ther. Nucleic Acids. 2013, 2, e109. [Google Scholar] [CrossRef] [PubMed]
- Khan, S.; Jutzy, J.M.; Valenzuela, M.M.; Turay, D.; Aspe, J.R.; Ashok, A.; Mirshahidi, S.; Mercola, D.; Lilly, M.B.; Wall, N.R. Plasma-derived exosomal survivin, a plausible biomarker for early detection of prostate cancer. PLoS ONE 2012, 7, e46737. [Google Scholar] [CrossRef] [Green Version]
- Lau, C.; Kim, Y.; Chia, D.; Spielmann, N.; Eibl, G.; Elashoff, D.; Wei, F.; Lin, Y.L.; Moro, A.; Grogan, T.; et al. Role of pancreatic cancer-derived exosomes in salivary biomarker development. J. Biol. Chem. 2013, 288, 26888–26897. [Google Scholar] [CrossRef] [Green Version]
- Garcia, J.M.; Garcia, V.; Pena, C.; Dominguez, G.; Silva, J.; Diaz, R.; Espinosa, P.; Citores, M.J.; Collado, M.; Bonilla, F. Extracellular plasma RNA from colon cancer patients is confined in a vesicle-like structure and is mRNA-enriched. RNA 2008, 14, 1424–1432. [Google Scholar] [CrossRef] [Green Version]
- Kim, H.K.; Song, K.S.; Park, Y.S.; Kang, Y.H.; Lee, Y.J.; Lee, K.R.; Kim, H.K.; Ryu, K.W.; Bae, J.M.; Kim, S. Elevated levels of circulating platelet microparticles, VEGF, IL-6 and RANTES in patients with gastric cancer: Possible role of a metastasis predictor. Eur. J. Cancer 2003, 39, 184–191. [Google Scholar] [CrossRef]
- Slavkin, H.C. Toward molecularly based diagnostics for the oral cavity. J. Am. Dent. Assoc. 1998, 129, 1138–1143. [Google Scholar] [CrossRef] [PubMed]
- Lee, Y.H.; Wong, D.T. Saliva: An emerging biofluid for early detection of diseases. Am. J. Dent. 2009, 22, 241–248. [Google Scholar] [PubMed]
- Pepe, M.S.; Feng, Z.; Janes, H.; Bossuyt, P.M.; Potter, J.D. Pivotal evaluation of the accuracy of a biomarker used for classification or prediction: Standards for study design. J. Natl. Cancer Inst. 2008, 100, 1432–1438. [Google Scholar] [CrossRef] [Green Version]
- So, J.B.Y.; Kapoor, R.; Zhu, F.; Koh, C.; Zhou, L.; Zou, R.; Tang, Y.C.; Goo, P.C.K.; Rha, S.Y.; Chung, H.C.; et al. Development and validation of a serum microRNA biomarker panel for detecting gastric cancer in a high-risk population. Gut 2021, 70, 829–837. [Google Scholar] [CrossRef]
- Zhu, C.; Ren, C.; Han, J.; Ding, Y.; Du, J.; Dai, N.; Dai, J.; Ma, H.; Hu, Z.; Shen, H.; et al. A five-microRNA panel in plasma was identified as potential biomarker for early detection of gastric cancer. Br. J. Cancer 2014, 110, 2291–2299. [Google Scholar] [CrossRef]
- Chen, S.; Zhu, J.; Yu, F.; Tian, Y.; Ma, S.; Liu, X. Combination of miRNA and RNA functions as potential biomarkers for gastric cancer. Tumour. Biol. 2015, 36, 9909–9918. [Google Scholar] [CrossRef]
- Jung, J.; Jeong, S.; Jeong, H.; Oh, H.E.; Choi, J.W.; Lee, E.S.; Kim, Y.S.; Kwak, Y.; Kim, W.H.; Lee, J.H. Increased HOXC6 mRNA expression is a novel biomarker of gastric cancer. PLoS ONE 2020, 15, e0236811. [Google Scholar] [CrossRef]
- Cao, W.; Zhou, D.; Tang, W.; An, H.; Zhang, Y. Discovery of plasma messenger RNA as novel biomarker for gastric cancer identified through bioinformatics analysis and clinical validation. PeerJ 2019, 7, e7025. [Google Scholar] [CrossRef]
- Jiang, F.; Hong, F.; Shah, M.W.; Shen, X. Circular RNAs as diagnostic biomarkers in gastric cancer: A meta-analysis review. Pathol. Res. Pract. 2019, 215, 152419. [Google Scholar] [CrossRef]
- Qin, S.; Yang, L.; Kong, S.; Xu, Y.; Liang, B.; Ju, S. LncRNA HCP5: A Potential Biomarker for Diagnosing Gastric Cancer. Front. Oncol. 2021, 11, 684531. [Google Scholar] [CrossRef] [PubMed]
- Liu, H.; Wu, N.; Zhang, Z.; Zhong, X.; Zhang, H.; Guo, H.; Nie, Y.; Liu, Y. Long Non-coding RNA LINC00941 as a Potential Biomarker Promotes the Proliferation and Metastasis of Gastric Cancer. Front. Genet. 2019, 10, 5. [Google Scholar] [CrossRef] [PubMed] [Green Version]


| Patient Characteristics | Control (n = 49) | GC (n = 51) | p-Value | Test |
|---|---|---|---|---|
| Age | 60.0 (11.2%) | 61.0 (12.3%) | 0.666 | t-Test |
| Male | 16 (32.7%) | 32 (62.7%) | 0.003 | Chi-square |
| Ethnicity | 0.467 | Fisher’s | ||
| Asian | 3 (6.1%) | 6 (11.8%) | ||
| Black, non-Hispanic | 6 (12.2%) | 10 (19.6%) | ||
| Caucasian | 32 (65.3%) | 26 (51.0%) | ||
| Hispanic | 8 (16.3%) | 9 (17.6%) | ||
| Present smoker | 5 (10.2%) | 7 (13.7%) | 0.588 | Chi-square |
| Prior smoker | 16 (32.7%) | 15 (29.4%) | 0.726 | Chi-square |
| Present or prior smoker | 21 (42.9%) | 22 (43.1%) | 0.977 | Chi-square |
| H. pylori biopsy performed | 22 | 35 | -- | -- |
| H. pylori positive (% of tested individuals) | 2 (9.1%) | 5 (14.3%) | 0.695 | Fisher’s |
| A. Demographic Model for Gastric Cancer | ||
| Terms | Odds Ratio (95% CI) | p-Value |
| Age | 0.99 (0.96–1.04) | 0.945 |
| Male | 3.74 (1.57–8.92) | 0.003 |
| Present or prior smoker | 0.75 (0.31–1.79) | 0.514 |
| B. Demographic Model with Two miRNA Biomarkers for Gastric Cancer | ||
| Terms | Odds Ratio (95% CI) | p-Value |
| Age | 0.99 (0.95–1.03) | 0.683 |
| Male | 5.42 (2.03–14.48) | 0.001 |
| Ever Smoker | 0.82 (0.33–2.07) | 0.680 |
| dCTmiR140_U6 | 2.56 (1.37–4.79) | 0.003 |
| dCTmiR301_U6 | 0.36 (0.19–0.68) | 0.002 |
| vs. Control | Overall | Stage I/II | Stage III/IV | Stage IV |
|---|---|---|---|---|
| Demographic features only | 0.68 (0.57–0.78) | 0.67 (0.51–0.84) | 0.67 (0.56–0.79) | 0.68 (0.55–0.80) |
| Demographic features + miRNAs | 0.75 (0.65–0.84) | 0.80 (0.63–0.96) | 0.72 (0.61–0.83) | 0.70 (0.58–0.83) |
| Demographic features + miRNAs + mRNAs | 0.78 (0.69–0.87) | 0.85 (0.72–0.99) | 0.75 (0.64–0.85) | 0.74 (0.63–0.86) |
| Demographic Features + 2 miRNA Biomarkers for GC + 3 mRNA Biomarkers for GC | ||
|---|---|---|
| Terms | OR (95% CI) | p-Value |
| Age | 0.99 (0.95–1.03) | 0.544 |
| Male | 5.42 (2.03–14.48) | 0.001 |
| Ever Smoker | 0.82 (0.33–2.07) | 0.421 |
| dCTmiR-140_U6 | 2.56 (1.37–4.79) | 0.007 |
| dCTmiR-301a_U6 | 0.36 (0.19–0.68) | 0.002 |
| dCTPPL_ACTB | 0.88 (0.66–1.18) | 0.406 |
| dCTSEMA4B_ACTB | 0.90 (0.66–1.23) | 0.497 |
| dCTSPINK7_ACTB | 1.23 (0.94–1.60) | 0.132 |
Publisher’s Note: MDPI stays neutral with regard to jurisdictional claims in published maps and institutional affiliations. |
© 2022 by the authors. Licensee MDPI, Basel, Switzerland. This article is an open access article distributed under the terms and conditions of the Creative Commons Attribution (CC BY) license (https://creativecommons.org/licenses/by/4.0/).
Share and Cite
Kaczor-Urbanowicz, K.E.; Saad, M.; Grogan, T.R.; Li, F.; Heo, Y.J.; Elashoff, D.; Bresalier, R.S.; Wong, D.T.W.; Kim, Y. Performance of Salivary Extracellular RNA Biomarker Panels for Gastric Cancer Differs between Distinct Populations. Cancers 2022, 14, 3632. https://doi.org/10.3390/cancers14153632
Kaczor-Urbanowicz KE, Saad M, Grogan TR, Li F, Heo YJ, Elashoff D, Bresalier RS, Wong DTW, Kim Y. Performance of Salivary Extracellular RNA Biomarker Panels for Gastric Cancer Differs between Distinct Populations. Cancers. 2022; 14(15):3632. https://doi.org/10.3390/cancers14153632
Chicago/Turabian StyleKaczor-Urbanowicz, Karolina Elżbieta, Mustafa Saad, Tristan R. Grogan, Feng Li, You Jeong Heo, David Elashoff, Robert S. Bresalier, David T. W. Wong, and Yong Kim. 2022. "Performance of Salivary Extracellular RNA Biomarker Panels for Gastric Cancer Differs between Distinct Populations" Cancers 14, no. 15: 3632. https://doi.org/10.3390/cancers14153632
APA StyleKaczor-Urbanowicz, K. E., Saad, M., Grogan, T. R., Li, F., Heo, Y. J., Elashoff, D., Bresalier, R. S., Wong, D. T. W., & Kim, Y. (2022). Performance of Salivary Extracellular RNA Biomarker Panels for Gastric Cancer Differs between Distinct Populations. Cancers, 14(15), 3632. https://doi.org/10.3390/cancers14153632