1. Introduction
Pancreatic adenocarcinoma (PAAD) is the most fatal of any common solid-malignancy cancer [
1,
2]. In 2020, the survival rate was poor, and the 5-year rate is 9.2%. PAAD is considered to be the third primary cause of cancer-related mortality in the Western world [
3,
4]. In the United States, an estimated 47,050 deaths are expected. By 2030, it will be the second leading cause, particularly given persistently rising incidence and a minimal change in mortality rates [
5,
6]. PAAD develops from the following three best-characterized precursor lesions: pancreatic intraepithelial neoplasia (PanIN), intraductal papillary mucinous neoplasms (IPMN), and mucinous cystic neoplasms (MCN) [
7,
8]. Despite immense gains in the molecular understanding of PAAD, early diagnosis and prognosis remain very poor. At present, there is no targeted therapy that works better than chemotherapy, and the only available treatment is surgery, which is only available to a small number of patients with resectable tumors [
9]. Therefore, a global understanding of the intricate pathogenesis of PAAD and the development of new prognostic biomarkers and drug targets are of critical importance for improving therapeutic strategies and survival rates.
High-throughput analyses of whole tumor cell transcripts suggest that RNA-based mutations play critical roles in cancer pathogenesis and the development of tumor heterogeneity [
10,
11]. Tumors are invariably associated with faulty RNA metabolism that disrupts the homeostasis of protein isoforms via oncogenic or tumor-suppressor signaling pathways. Besides somatic mutations in the target genes, dysregulation of RNA-binding proteins (RBPs) alters RNA metabolism in a variety of malignancies [
12,
13]. RBPs directly bind to numerous classes of RNAs to form dynamic ribonucleoprotein (RNP) complexes, which modulate all biochemical aspects of RNA life, including maturation, modification, splicing, transport, localization, decay, and translation [
14,
15]. Thus, dysregulation of RBPs results in transcriptomic and proteomic changes in tumor cells, which in turn affect cell growth, proliferation, invasion, and apoptosis [
16,
17]. Due to advances in screening techniques, more than 1900 human RBPs have been identified to date [
18,
19]. However, the role of RBPs in tumors is not fully understood.
Increasing pieces of evidence have proven that dysregulation of RNA metabolism by altering RBP expression is associated with PAAD onset and aggressiveness. For example, a member of the PCBP family protein, PCBP3, which increases the survival of PAAD cells, was regarded as a prognostic marker for PAAD [
20]. SRSF1 and PTBP1 facilitate pancreatic cancer initiation and progression through alternative splicing regulation [
21,
22]. HuR, a member of the ELAV RBP family, not only affects mRNAs containing AREs in its 3′-UTRs, but also directly binds to miRNAs, thereby enhancing PAAD cell survival [
16,
23,
24,
25]. The RBP ZEB1 regulates epithelial-to-mesenchymal transition in PAAD cells by changing EMT-associated transcript expression [
26]. ADAR1 regulates c-Myc stability through AKT signaling, thereby promoting PAAD growth [
27]. Of particular interest are recent studies that have identified a role for RBPs in the immunotherapy of various types of cancer [
28]. For example, eIF4E RBPs promote PD-L1 translation in mouse tumors, while eIF4E phosphorylation inhibitors disable PD-L1 translation [
29]. MEX3B has been shown to affect immune resistance by disrupting HLA-A mRNA in cancer cells [
30]. Therefore, in-depth investigation of the regulatory mechanisms of RBPs may be promising for developing innovative immunotherapy targets for pancreatic adenocarcinoma. Generally, these studies highlight the correlation of RBP dysregulation for PAAD tumorigenesis and progression. Furthermore, there is still an urgent need to systematically elucidate the overall functions of RBPs in PAAD prognosis and the immune microenvironment.
Herein, we used bioinformatic techniques in PAAD–TCGA and GTEx datasets to carry out a risk model based on five prognostic hub RBPs. Subsequently, based on hazard ratios with prognostic values and survival tests of these five hub genes, we focused on
STAU2 to evaluate the reliability of the RBP’s related signature.
STAU2 is a paralog of
STAU1, which mediates a translation-dependent mRNA decay pathway (SMD) that is involved in multiple cellular processes [
31,
32,
33]. Furthermore, several recent articles have reported that
STAU2 emerged as a critical mediator in tumor progression [
34,
35]. Nevertheless, the influence of
STAU2 on PAAD has not been investigated. Accordingly, our findings demonstrated that
STAU2 is abundantly expressed in PAAD, and downregulation of
STAU2 can significantly reduce the growth, invasion, and migration abilities of PAAD cells and induce apoptosis. Moreover, high
STAU2 expression was correlated positively with PAAD cell infiltration and immune checkpoint expression. On the flip side, high
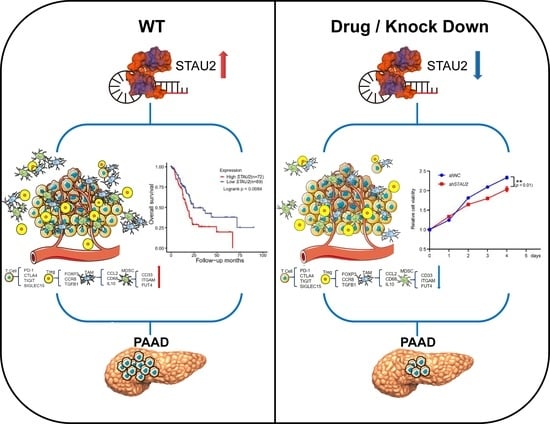
STAU2 patients were more sensitive to the chemotherapy drugs (5-Fluorouracil and Gemcitabine) but more resistant to Erlotinib, an EGFR inhibitor. Collectively, based on the data from this study, we constructed and verified an RBP-based prognostic risk model that showed potential clinical application. Moreover, we demonstrated that
STAU2 is a novel regulator of PAAD initiation and progression, which could serve as a potential diagnostic and prognostic biomarker for combinatorial therapy to improve PAAD survival.
2. Materials and Method
2.1. Data Collection and Processing
For 170 TCGA–PAAD patients, gene expression files containing the number of untreated genes and transcript fragments in kilobases (FPKM) were obtained from Genomic Data Commons (GDC) using “TCGAbiolinks R”. The gene expression matrix of normal pancreas across 360 healthy donors was obtained from Genotype-Tissue Expression (GTEx). The gene list containing 1500 RNA binding proteins (RBPs) was obtained from the previous report. Using DESeq2 to analyze differentially expressed genes (DEGs) between TCGA–PAAD patients and GTEx-normal pancreatic tissue, adjusted p-values < 0.05 and 1.5-fold changes were considered statistically significant differences.
2.2. Identification of RBP Signature with Prognostic Significance
Using RBP genes that were significantly differentially expressed in pancreatic tumors and normal tissues, we performed univariate Cox regression analysis to isolate prognostic RBP genes. In detail, log-rank
p-values were calculated to estimate the significance, and the survival plot was obtained through the “survminer” R package. These prognostically relevant RBPs were ranked based on the smallest absolute shrinkage and selection operator (LASSO). Further multiple stepwise Cox regression was performed to identify the hub RBPs with prognostic significance. Risk scores for each patient were calculated as follows:
Here, “
n” is the number of prognostic RBP genes (
n = 6), “
expk” is the expression levels of the gene
k, and “
coefk” is the estimated coefficient value of gene k in multivariate Cox regression analysis. After normalizing the gene expression levels (FPKM) using the estimated regression coefficient, we calculate the weighted risk scores of selected hub RBPs. Ultimately, we assigned 170 PAAD patients to the low-risk group (
n = 85) and high-risk group (
n = 85), regarding the median risk scores as the threshold point.
2.3. Identification of Differentially Expressed Genes between Risk Subgroups
A total of 170 patients with PAAD were divided into high and low risk subgroups according to risk scores, and differential gene expression analysis (DGE) was performed on the two subgroups using DESeq2. Adjusted FDR < 0.05 and |log2 (fold change) | > 1 were used as the threshold of significance.
2.4. Gene Set Enrichment Analysis
DEGs were tested for functional enrichment using the “clusterProfiler” R package based on the GO (Gene Ontology) and KEGG Pathway databases, respectively. Gene set enrichment analysis (GSEA) was used to detect abnormal signaling pathways assigned to hallmark gene sets in high-risk subgroups.
2.5. Combination Analysis of Gene Expression, DNA Methylation, and Genetic Alternation in PAAD Patients
DNA methylation array (Illumina Human Methylation 450, San Diego, CA, USA) and copy number alternation data were downloaded from the GDC data portal using the TCGAbiolinks R package. To explore the upstream regulation of prognostic RBPs, we calculated the correlation coefficients of RBP genes’ FPKM with DNA methylation levels in the promoter region of RBPs and log2-transformed copy numbers in RBPs, respectively.
2.6. Validation of Prognostic RBP Signature
Microarray data, somatic mutation, and genetic alternation information across 461 PAAD patients were obtained from the international cancer genome consortium (ICGC) data port (
https://dcc.icgc.org/, accessed on 3 February 2021). Cox one-way regression and Covar multiple regression analyses were used to validate the predicted value of the RBP attribute of the
STAU2 node.
2.7. STAU2 Genetic Alternation Analysis
The genetic variation signature of the
STAU2 gene was obtained from the cBioPortal website (
https://www.cbioportal.org/, accessed on 3 February 2021), which summarizes its variation frequency, mutation type and copy number (CNA) changes. The comparison of genetic alteration characteristics of
STAU2 across multiple TCGA tumors was performed using the “Cancer Type Summary” module. The “Mutation” module in the cBioPortal website was used to construct the schematic diagram of the structure of mutated
STAU2. Kaplan–Meier plots with log-rank
p-values were plotted to show the relationship between
STAU2 genetic alteration and the overall survival of TCGA tumors.
2.8. Prediction of Diagnostic Effect of ROC Curve on STAU2
The calculated ROC curves and AUC values were analyzed with the R pROC package, as shown in ggplot2. AUC values between 0.5 and 0.7 indicate model success.
2.9. Analysis of Differentially Expressed Genes with STAU2
Genes associated with
STAU2 expression in PAAD were detected using Linkedomics (
http://www.linkedomics.org/login.php, accessed on 3 February 2021). Volcano plots were used to visualize, and they filtered regulated and decreased genes separately. The significant correlation between genes was evaluated by Pearson’s test.
2.10. Protein–Protein Interaction (PPI) Network Construction
We used the STRING database to predict protein–protein interactions (PPIs) and create PPI networks. The STAU2 protein–protein interaction network was then proposed, and two major closely interacting proteomes were observed. It was found that 50 proteins were closely related to STAU2. Then, KEGG enrichment analysis was performed on them, and 20 of them were used to construct the network graph.
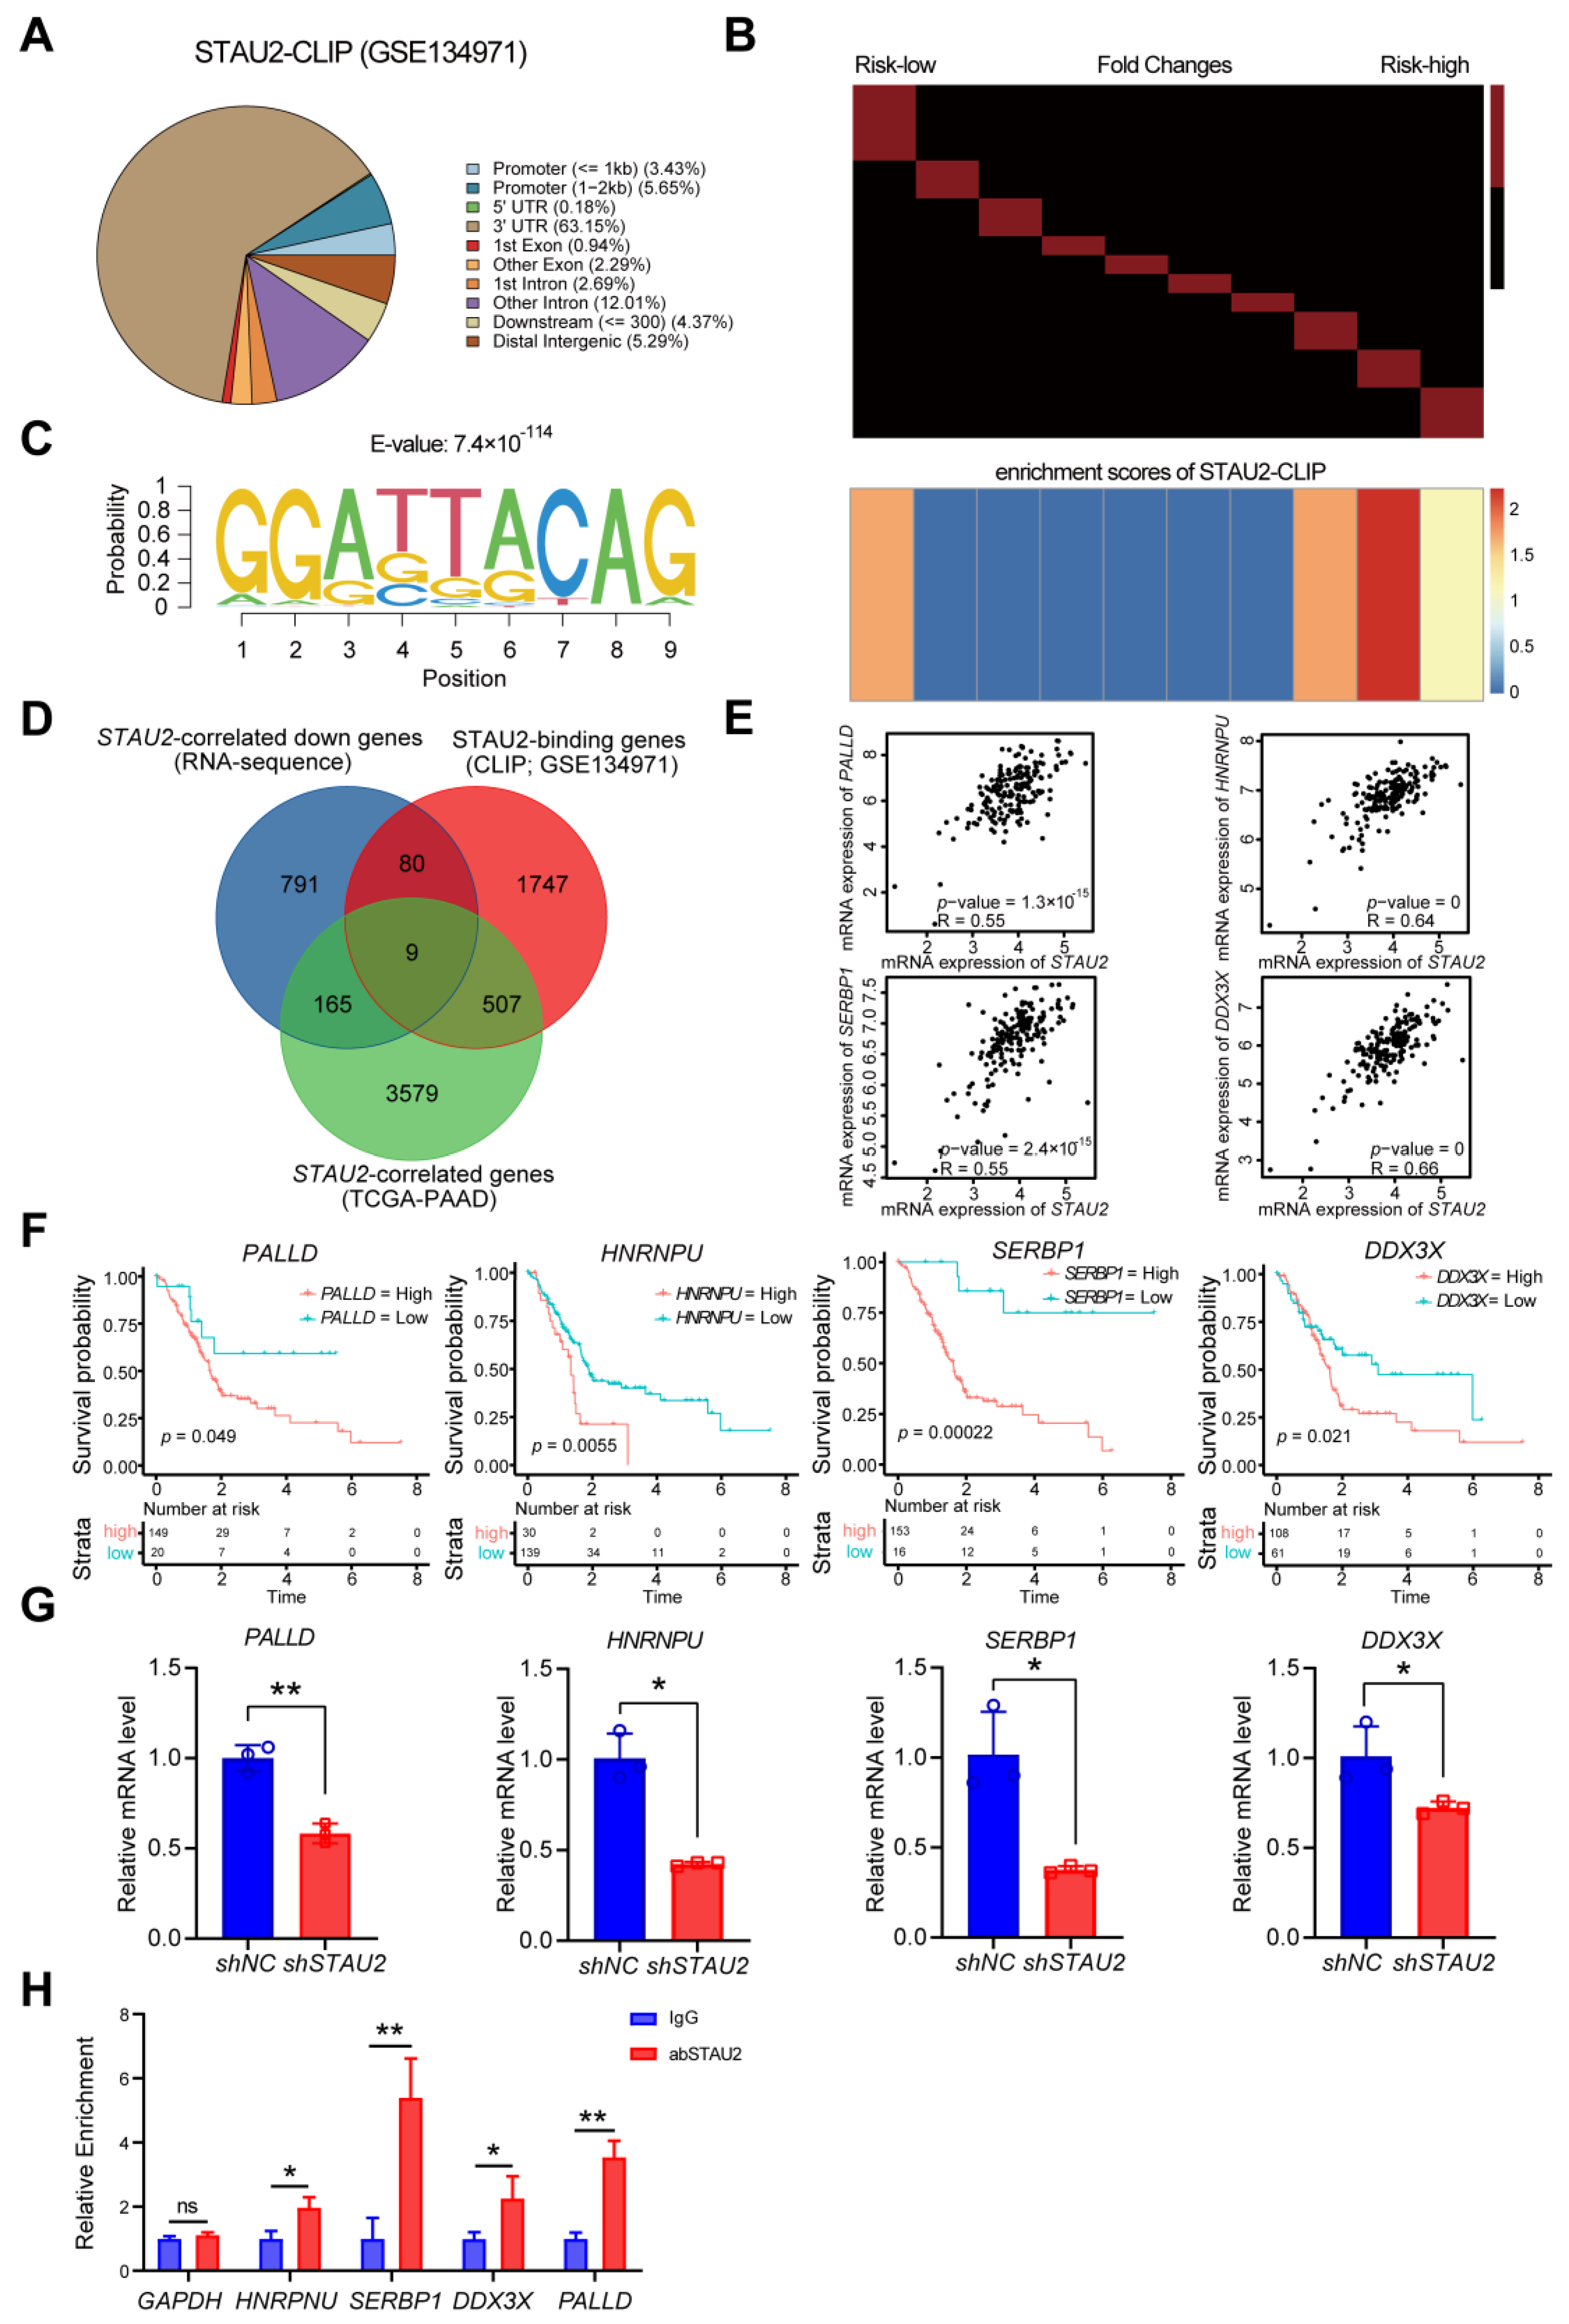
2.11. Identification of STAU2-Target Genes
STAU2-CLIP data were downloaded from GSE134971. Narrow peaks of two STAU2-CLIP samples were merged using IDR software. The RNA sequence with STAU2-CLIP peaks was summited to MEME to identify putative STAU2-binding motifs. Then, STAU2-CLIP peaks were annotated to the nearest gene using the “annotatePeak” function of the “ChIPseeker” R package. The host genes of STAU2-CLIP peaks were regarded as STAU2-binding genes.
The correlation between STAU2 and other protein-coding genes was analyzed across 170 TCGA–PAAD patients using the FPKM matrix. The STAU2-associated gene was defined as a gene with |R coefficient| > 0.3.
2.12. Analysis of Immune-Related Information of STAU2
The correlation between immune cell infiltration and STAU2 expression was obtained using the TIMER online website, and Pearson’s correlation analysis was used to obtain the correlation. Correlation of STAU2 with immune cell gene markers in pancreatic adenocarcinoma was determined using timer analysis.
To reliably assess immune scores, we used immunodeconv, an R package that uses the built-in xCell algorithm. The generated heatmaps are implemented by the R (v4.0.3) ggplot2 and pheatmap packages.
The R software package “circle” was used to plot Chord diagram. The correlation between the expression of
STAU2 gene and eight immune checkpoints was analyzed by Spearman analysis, and the correlation coefficient and significant correlation were gained. Utilizing the TIMER2 web server (
http://timer.cistrome.org/, accessed on 14 October 2021), we obtained the immune infiltration scores of cancer-related fibroblasts, mast cells, endothelial cells, cancer-associated fibroblast, CD8+ T-cells, CD8+ central memory T-cells, CD4+ memory T-cells, memory CD4+ central memory T-cells, Th1 CD4+ T-cells, NK T-cell, plasma B-cells, the common lymphoid progenitor, and the granulocyte−monocyte progenitor. Pearson correlation analysis was used to show the association between
STAU2 expression levels and improved immune system infiltration in PAAD patients.
2.13. Kaplan–Meier Plotter Database Analysis
To analyze the prognostic value of STAU2 in PAAD, we used a web-based gene expression database and survival information from the KM Plotter. Patient samples were divided into two groups based on median expression (high and low expression) and hazard ratios (HR) with 95% confidence intervals (95% CIs), and logrank p-values were used to analyze the hazard ratios (HR) of immune cell subsets.
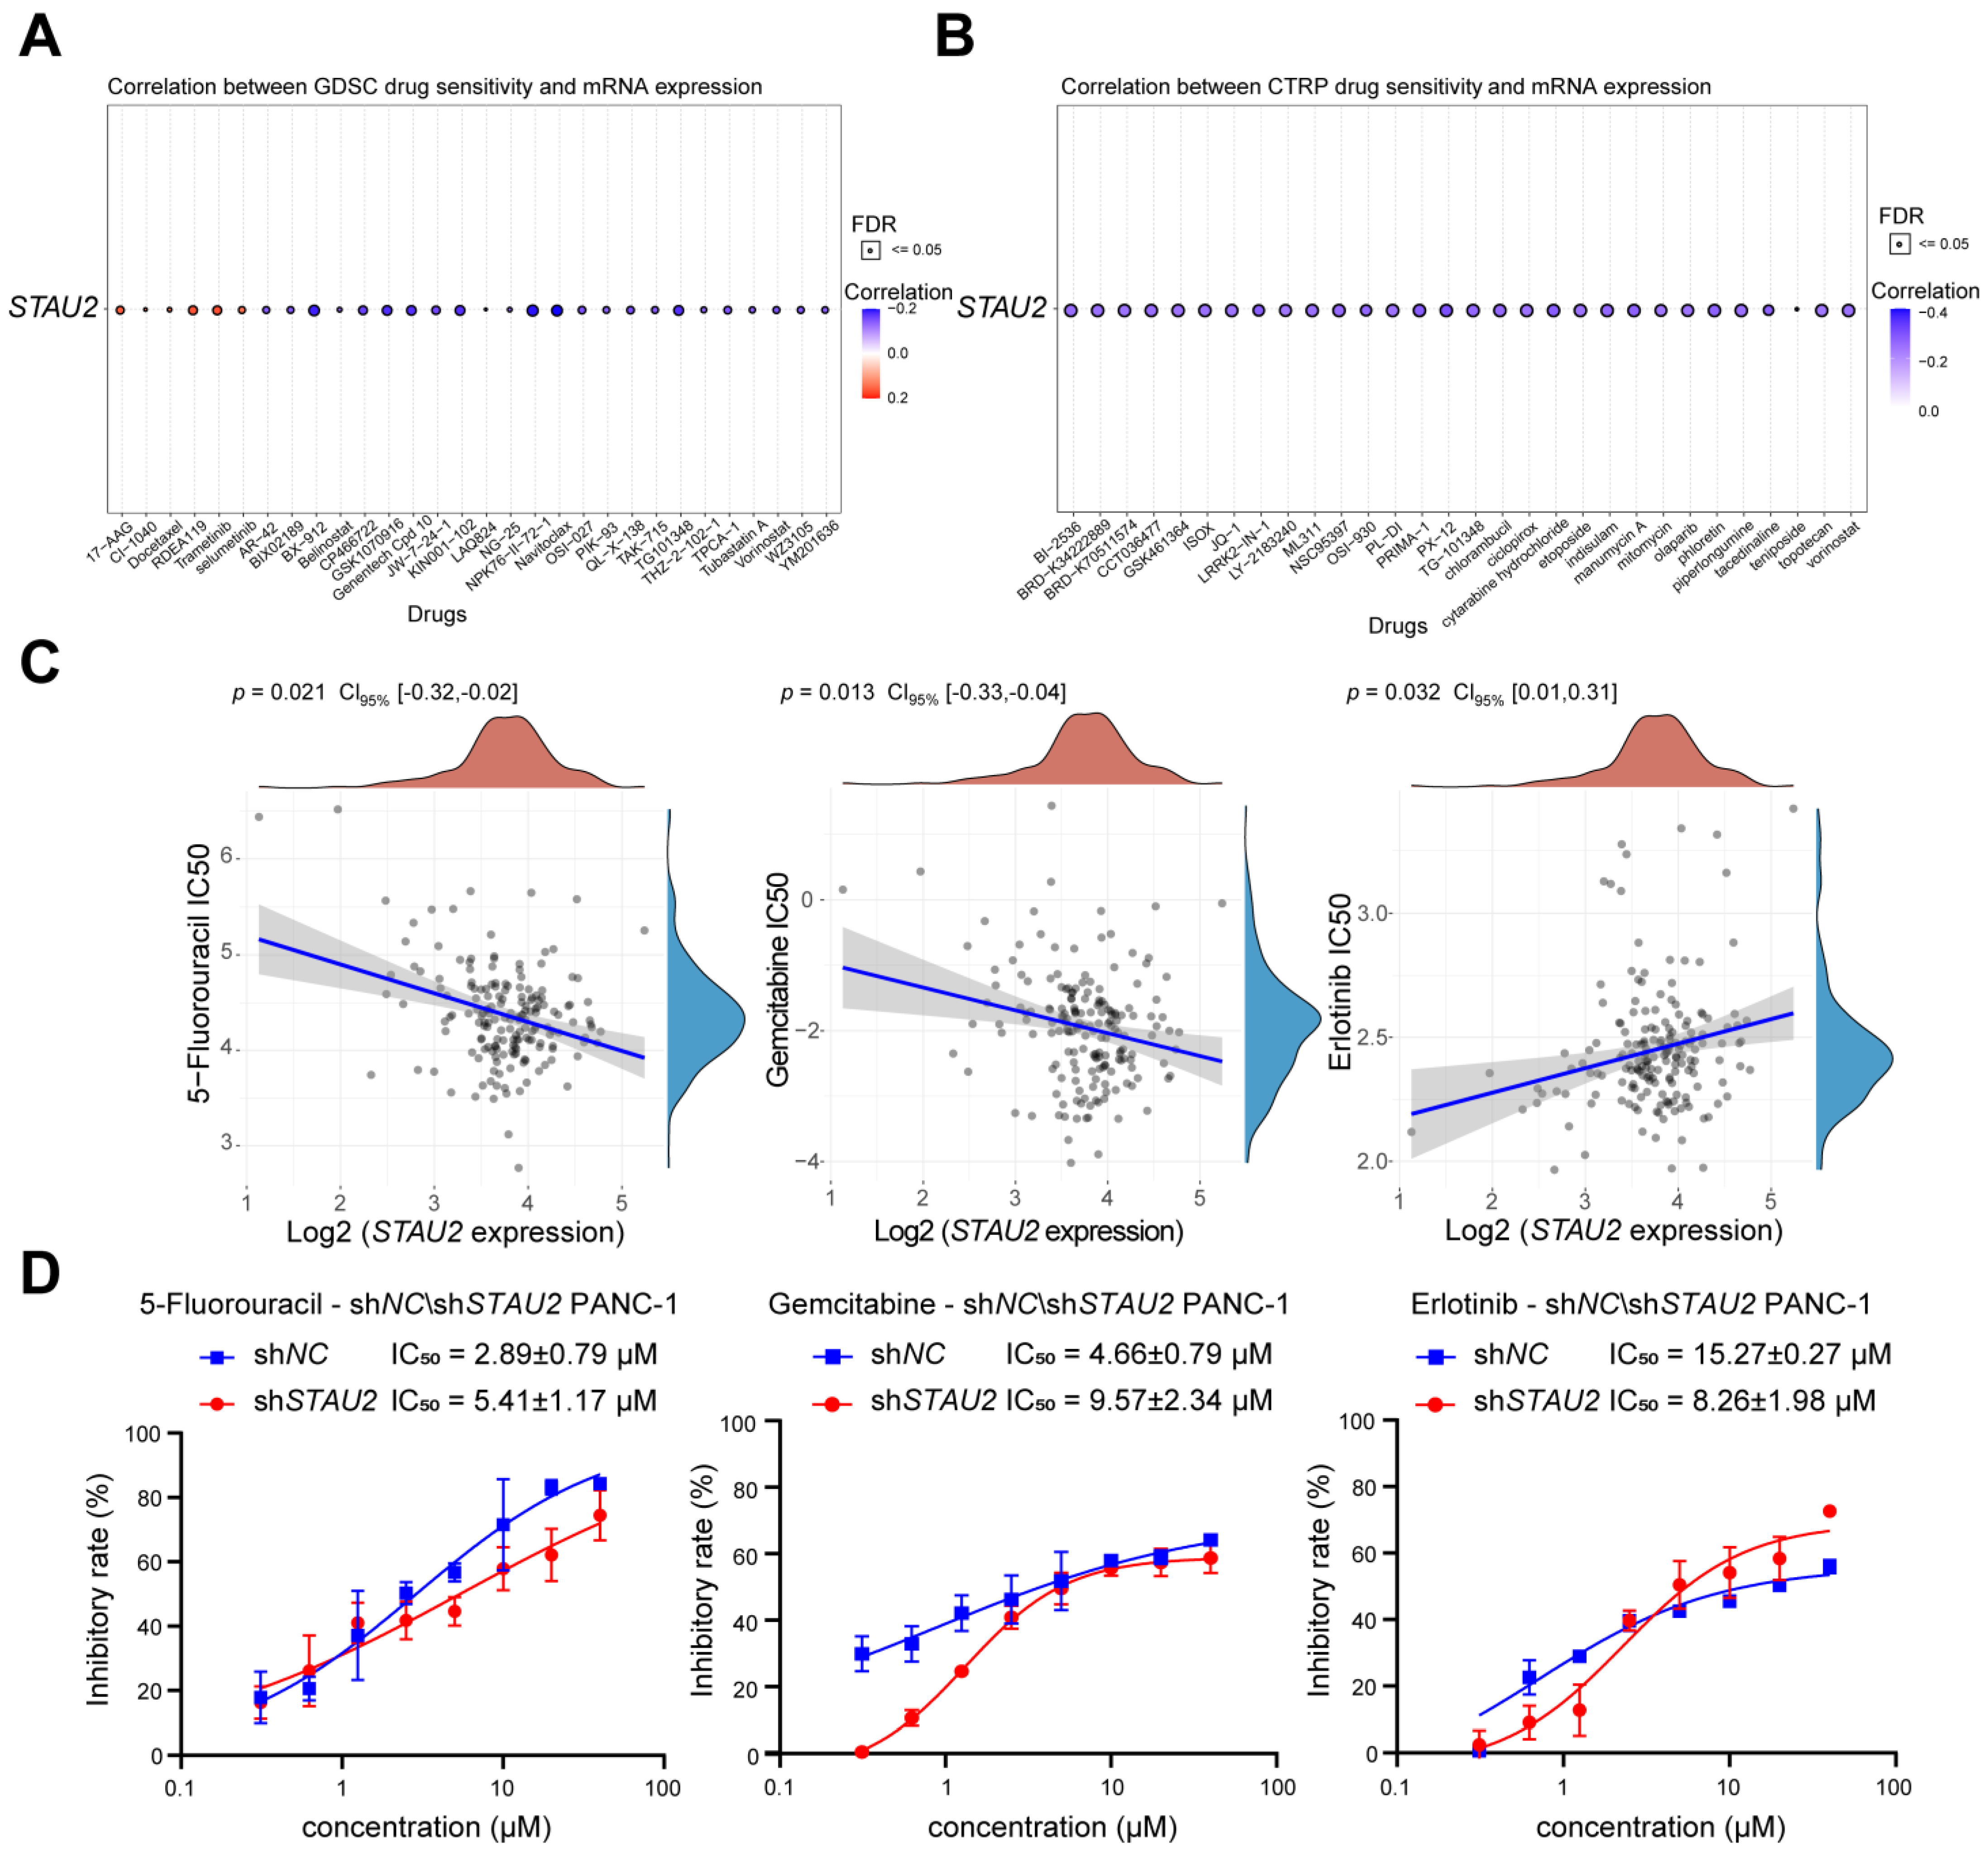
2.14. Drug Sensitivity Analysis of STAU2 in Pancreatic Adenocarcinoma
Using the Gene Set Cancer Analysis database (GSCA) online website and according to the data from Genomics of Drug Sensitivity in Cancer (GDSC,
https://www.cancerrxgene.org/, accessed on 14 October 2021) and Cancer Therapeutics Response Portal (CTRP,
https://portals.broadinstitute.org/ctrp/, accessed on 14 October 2021), the 30 drugs with the most sensitivity and predictive accuracy against
STAU2 were predicted. For IC
50 and gene expression correlation analysis of first-line drugs for pancreatic adenocarcinoma, tumor RNA-seq (FPKM) data downloaded from GDC were used, converted to TPM format, and data were normalized to log2 (TPM + 1). Half-maximal inhibitory concentration (IC
50) data for predicted samples were obtained from GDSC and CTRP, predictions were performed using a “pRRophetic” R package, and IC
50 were estimated by comb regression.
2.15. Cell Culture
The PANC-1 cell line, BXPC-3 cell line (pancreatic cancer), and HPDE6-C7 cell line (normal pancreas cell) were obtained from the American Type Culture Collection Center (ATCC) and supplemented with 10% (FBS) in endotoxin-free in DMEM cultivated; BXPC-3 pancreatic adenocarcinoma cells were maintained in RPMI-1640 in 10% FBS. Penicillin streptomycin and plasma cytokine prophylactic were added to the medium.
All human cell lines have been authenticated using STR (or SNP) profiling within the last three years. All experiments were performed with mycoplasma-free cells.
2.16. Cell Proliferation Assays
Cell proliferations were evaluated using the Cell Counting Kit-8 (Share-bio, SB-CCK8, Shanghai, China). First, 5000 shNC-PANC-1 cells and shSTAU2-PANC-1 cells were seeded in each well of a 96-well plate for 5 days. CCK8 reagent was added to the wells of each dish daily. Plates of treated cells were incubated in an incubator for 4 h. The enzyme plate analyzer was used to detect the absorbance at 450 nm using a microplate reader (Bio-Tek SynergyH1, Vineland, NJ, USA). For cell growth assays, cell viabilities were determined at 0, 24, 48, 72, and 96 h. Three independent trials were performed. For antiproliferative activity of the compound, data were fitted in nonlinear regression, and IC50 values were calculated by GraphPad Prism 8.0.
2.17. Lentivirus Production and Infection
Lentivirus particles of short-hairpin RNA against STAU2 (pGV112-shSTAU2) and its scrambled control (PGV112-shNC) were constructed and purchased from Genechem Co. Ltd. (Shanghai, China). Lentivirus-induced STAU2 is transformed into PANC-1 cells to generate PANC-1 knockdown cells for STAU2. In general, the lentiviral particles were collected and transferred directly to PANC-1 cells after 72 h of transfection. Lentivirus-containing PANC-1 cell lines were inoculated at 32 °C, 1200 rpm for 90 min. After the rotation inoculation, puromycin was added to the cultured PANC-1 cells to select positively infected cells. The shSTAU2 sequence was 5′-CCGGGCCAGGGAACTCCTTATGAATCTCGAGATTCATAAGGAGTTCCCTGGCTTTTTG-3′, and the non-targeting shRNA sequence was 5′-CCGGTTCTCCGAACGTGTCACGTTTCAAGAGAACGTGACACGTTCGGAGAATTTTTG-3′.
2.18. Real-Time Quantitative PCR (RT-qPCR)
The total RNA isolated from cells with RNA-easy reagent was reverse transcribed using Hiscript III 1st Strand cDNA Synthesis (Vazyme, R323-01, Nanjing, China). The RT-qPCR reaction was carried out using the ChamQ SYBR qPCR Master mix (Vazyme, Q331-02, Nanjing, China). See
Table S1 for primers.
2.19. Western Blot Analysis
Cells were grown at 5 × 10
6/mL in T-75 flasks. The treated cells were lysed with RIPA (Thermo Fisher Scientific, 89901, Waltham, MA, USA), a phosphatase inhibitor (Roche, 04906845001, Basel, Switzerland), and a protease inhibitor (Roche, 04693132001). Lysates were quantified and boiled in SDS sample buffer, then fractionated with SDS-Page and transferred to PVDF membranes. Blocking, antibody incubation, and washing were performed in buffer containing 0.05% (
v/
v) Tween-20 and 5% (
w/
v) non-fat dry milk. The primary antibody was diluted against the target protein in blocking solution. Membranes were incubated overnight with the primary antibodies listed in
Table S2. After four washes in blocking solution, spots were incubated with horseradish peroxidase-conjugated secondary antibody. Protein was detected by electrochemiluminescence. Finally, the Image J V1.8.0 software was used to perform protein quantification.
2.20. Colony Formation Assays
One thousand cells were plated in 24-well plates to analyze colony formation in dishes. Cells were fixed 2 weeks after pre-plating, stained with 0.1% crystal violet, and counted.
2.21. Migration Assays
In vitro cell migration assay of STAU2 knockdown transfected PANC-1 cells or PANC-1 cells was performed using transwell plates (Falcon, 353097, New York, NY, USA). To begin, 200 μL DMEM without fetal bovine serum was inoculated on the upper surface at room temperature, and 500 μL DMEM medium containing 10% FBS was injected into the wells at a ratio of 2 × 10⁴ cells at room temperature. Cells were cultured for 24 h in transwell chambers, and cells that did not migrate to the upper surface were removed. Migrated cells were fixed on the underside with 4% paraformaldehyde and stained with 0.1% crystal violet for 5 min. The number of cells on the lower surface was counted under a microscope to determine the number of migration.
2.22. Invasion Assays
In vitro cell invasion assay of STAU2 knockdown transfected PANC-1 cells or PANC-1 cells was performed using transwell plates. First, 200 μL DMEM without fetal bovine serum was inoculated on the upper surface of 20 μL Matrigel (Corning, 356234, New York, NY, USA) at room temperature, and 500 μL DMEM medium containing 10% FBS was injected into the wells at a ratio of 2 × 10⁴ at room temperature. Cells were cultured for 24 h in transwell chambers, and cells that did not migrate to the upper surface were removed. Infiltrated cells were fixed on the underside with 4% paraformaldehyde and stained with 0.1% crystal violet for 5 min. Cell penetration into the lower surface of Matrigel was counted, and the number of cells under the microscope was also counted.
2.23. Apoptosis Assays
Apoptosis was detected using YF®488-Annex V and PI Apoptosis Kit (US Everbright, Y6002, Suzhou, China). Cells were seeded at 1 × 10⁶/well, then washed twice with cold PBS and resuspended in 1× binding buffer at a concentration of 1 × 10⁶ cells/mL. Cell apoptosis under 488 nm excitation was detected by flow cytometry, and the results were analyzed using FlowJo V10 software.
2.24. RNA-Immunoprecipitation RT-qPCR (RIP RT-qPCR)
Cells were lysed in lysis buffer (100 mM KCl, 5 mM MgCl2, 10 mM Hepes pH 7.0, 1 mM DTT, 50 units/mL RNase out, 1× protease inhibitor cocktail, 1× PBS) at 4 °C for 2 h. A volume of 10% lysate was subjected to RNA isolation as input. Then, 10 mg Protein A-Agrose beads (Sigma-Aldrich, P1406-250MG, Darmstadt, Germany) were pre-treated with PBS three times and 2% BSA for 30 min and then incubated with 10 μL STAU2 or IgG (as control) antibody at 4 °C for 2 h. Subsequently, the beads–antibody complex was incubated with cell lysate on rotation at 4 °C overnight. Beads were washed with PBS and then subjected to total RNA isolation. Purified RNA was reversely transcribed followed by RT-qPCR.
2.25. RNA-Seq and Data Analysis
Cells were harvested and total RNA was extracted using Beyozol Total RNA Extraction Reagent (Beyotime, R0011, Shanghai, China), following the instructions of the manufacturer. Total mRNA was enriched by Obligo(dT) beads then fragmented into short fragments and reversely transcribed into cDNA with random primers. After the second-strand cDNA was synthesized, cDNA fragments were purified, end repaired, poly(A) was added, and they were ligated to Illumina sequencing adapters. The ligation products were size selected by agarose gel electrophoresis, amplified by PCR, and sequenced using Illumina HiSeq2500 by Genedenovo Biotechnology Co., Ltd. (Guangzhou, China). Raw reads were cleaned to remove adapters or low-quality reads and rRNA mapped reads. Clean reads were mapped to the Homo sapiens’ genome. Gene expressions were quantified by FPKM (fragment per kilobase of transcript per million mapped reads) value and differential expression analysis was performed by R (v4.0.3) DESeq2 between two different groups, with false discovery rate (FDR) below 0.05 and absolute fold change ≥2 considered differentially expressed genes. Bioinformatic analysis was performed using the Omicsmart platform (
https://www.omicsmart.com, accessed on 26 October 2021).
2.26. Statistical Analysis
Continuous variables between two groups were compared using Student’s t-test and Mann–Whitney Wilcoxon test. Kruskal Wallis One-Way ANOVA was used to examine differences in more than two groups. Analysis of variance (ANOVA) was used to test for variance between groups. The Benjamin–Hochberg method was used to adjust the false detection rate (FDR) of p-values for many comparisons. All statistical analyses were performed using R software (v 4.0.3). p-values < 0.05 were considered statistically significant.
4. Discussion
As the third-leading cause of cancer death in western countries [
36], the diagnosis and treatment of PAAD patients is challenging due to tumor heterogeneity and the immunosuppressive tumor microenvironment [
37]. Currently, surgery, chemotherapy, and radiotherapy are the main treatment strategies. However, side effects and drug resistance to chemotherapy and radiotherapy result in treatment failures [
38]. Indeed, with a persistently rising morbidity and extremely poor prognosis, PAAD will become the second-leading cause of cancer death by 2030 [
5,
6]. Therefore, identifying accurate biomarkers and therapeutic targets for PAAD is urgently needed. Studies of RNA-binding proteins (RBPs) have demonstrated that their dysregulation plays a key role in altering RNA metabolism in various malignant tumors, and that they are considered to be attractive targets for the occurrence and aggressiveness of PAAD [
39,
40].
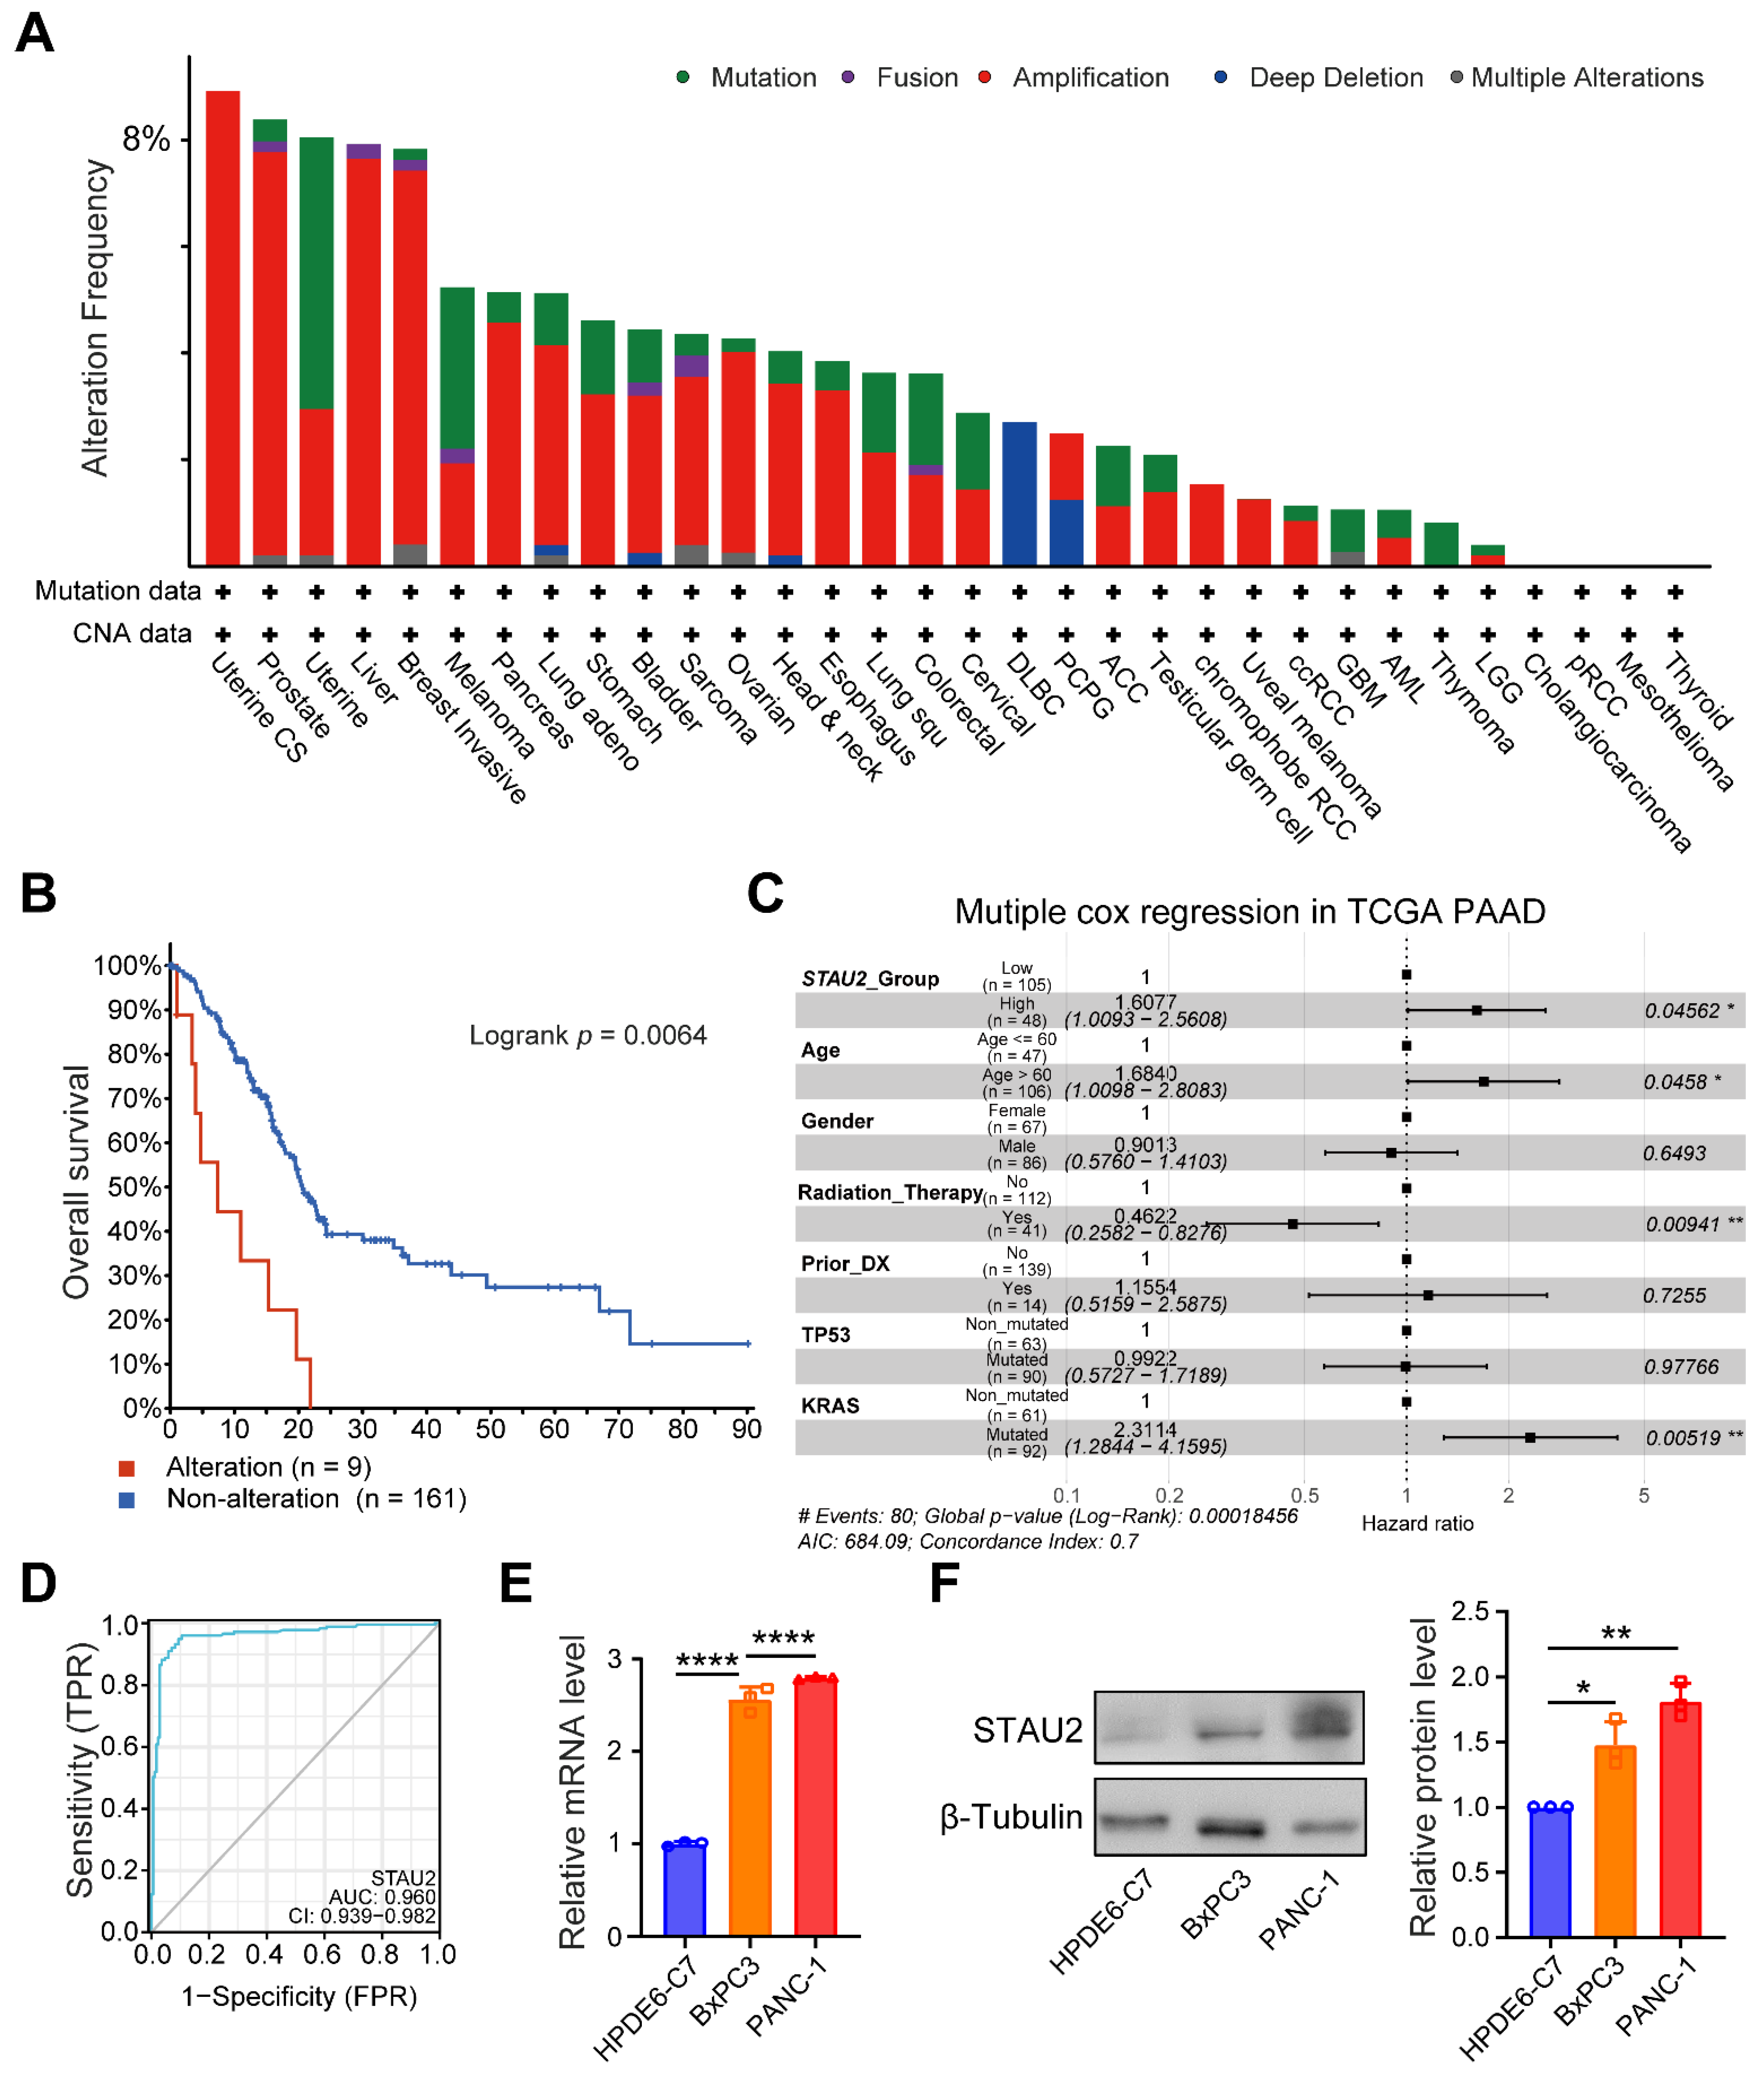
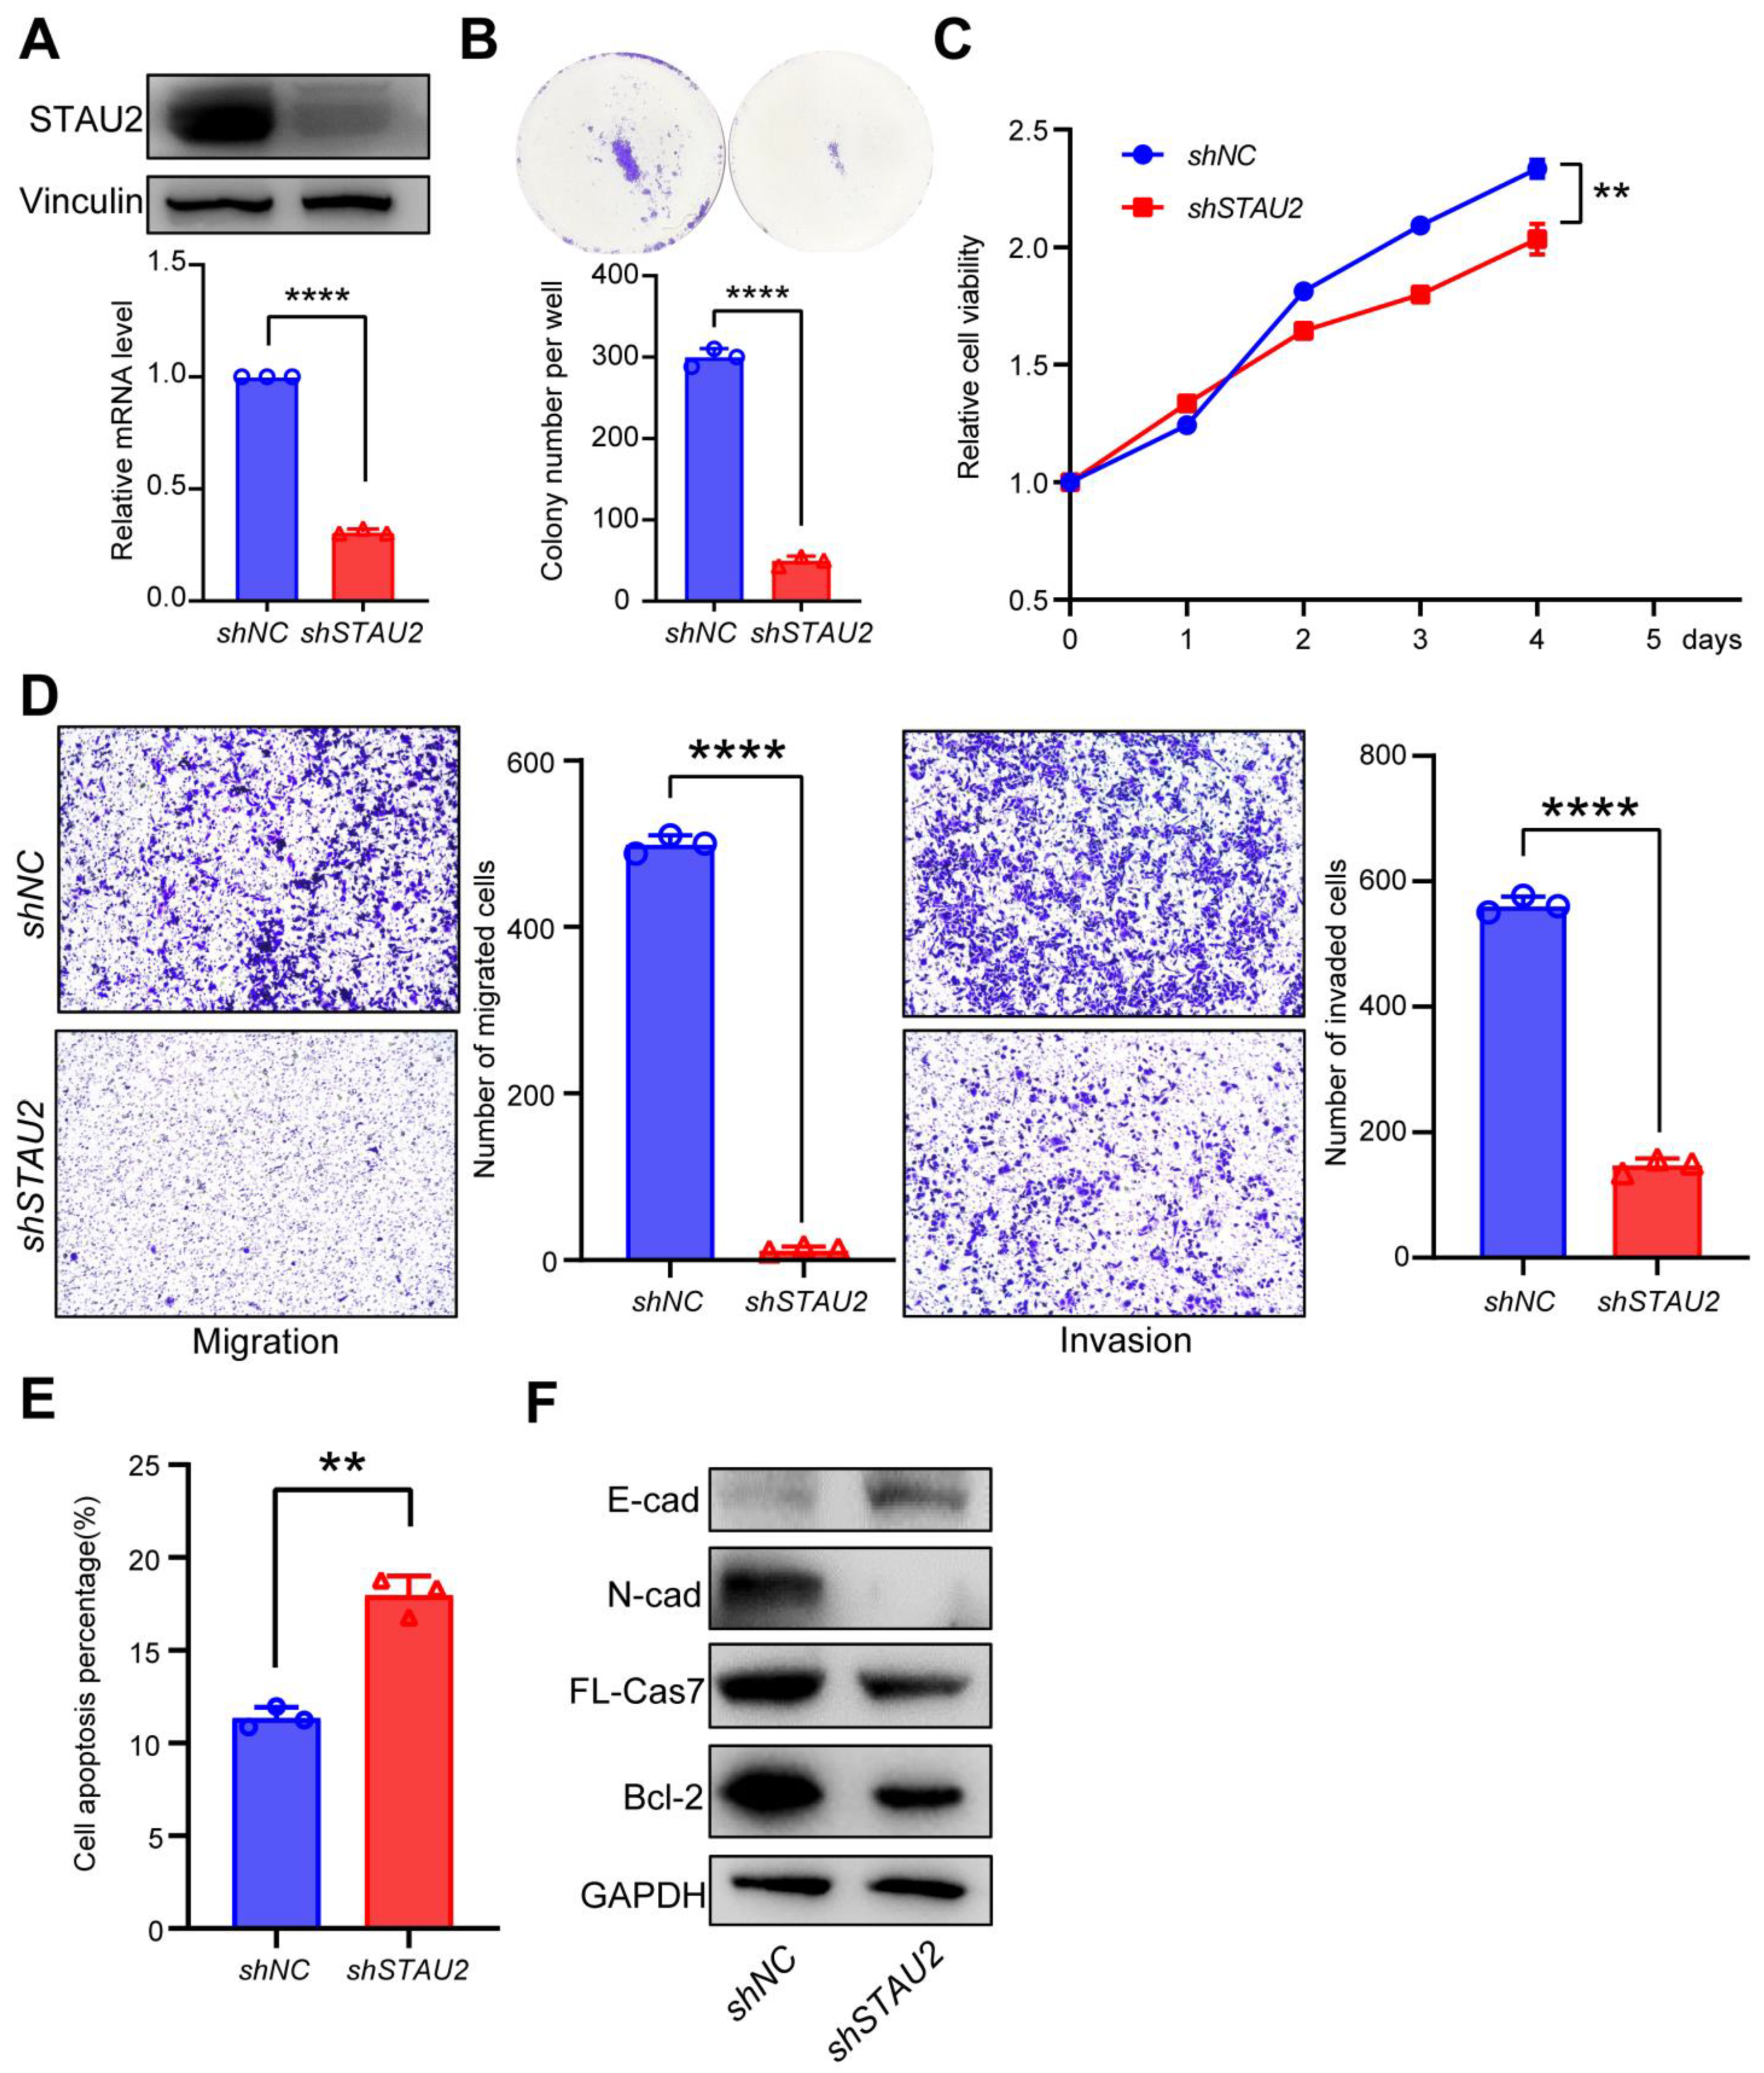
In the previous study, we explored the hub RBPs of PAAD from the TCGA and GTEx databases. Furthermore, we obtained a high-value predictive model with five RBPs. Based on the analyses from univariate Cox regressions and the Kaplan–Meier plotter database, we observed a correlation between STAU2 expression and PAAD progression. First, we observed that the highest rate of genetic alternation in STAU2 occurred in patients with “amplification” as the primary type, and patients with genetic mutation of STAU2 showed poor overall survival. Therefore, a multivariate stepwise Cox regression analysis, ROC analysis, and experimental STAU2 study showed that high expression of STAU2 was associated with poor clinical outcomes, and that downregulation of STAU2 resulted in a decrease in the growth, migration, and invasion of PAAD cells and induced apoptosis. Moreover, after analyzing the overlap of STAU2-CLIP, STAU2-correlated genes, and STAU2-correlated downregulated genes in shSTAU2 samples, we identified PALLD, HNRNPU, SERBP1, and DDX3X as STAU2 target genes. Furthermore, increased STAU2 expression correlated positively with immune cell PAAD infiltration and immune checkpoint expression. Our data also suggested that STAU2 expression induces immunosuppression through accumulation of Treg, TAM, and MDSC. Finally, the analyses of the GDSC and CTRP databases indicated that STAU2 expression was associated with drugs resistance, and that patients with high STAU2 were more sensitive to chemotherapy drugs (5-Fluorouracil and Gemcitabine) but more resistant to Erlotinib, an EGFR inhibitor.
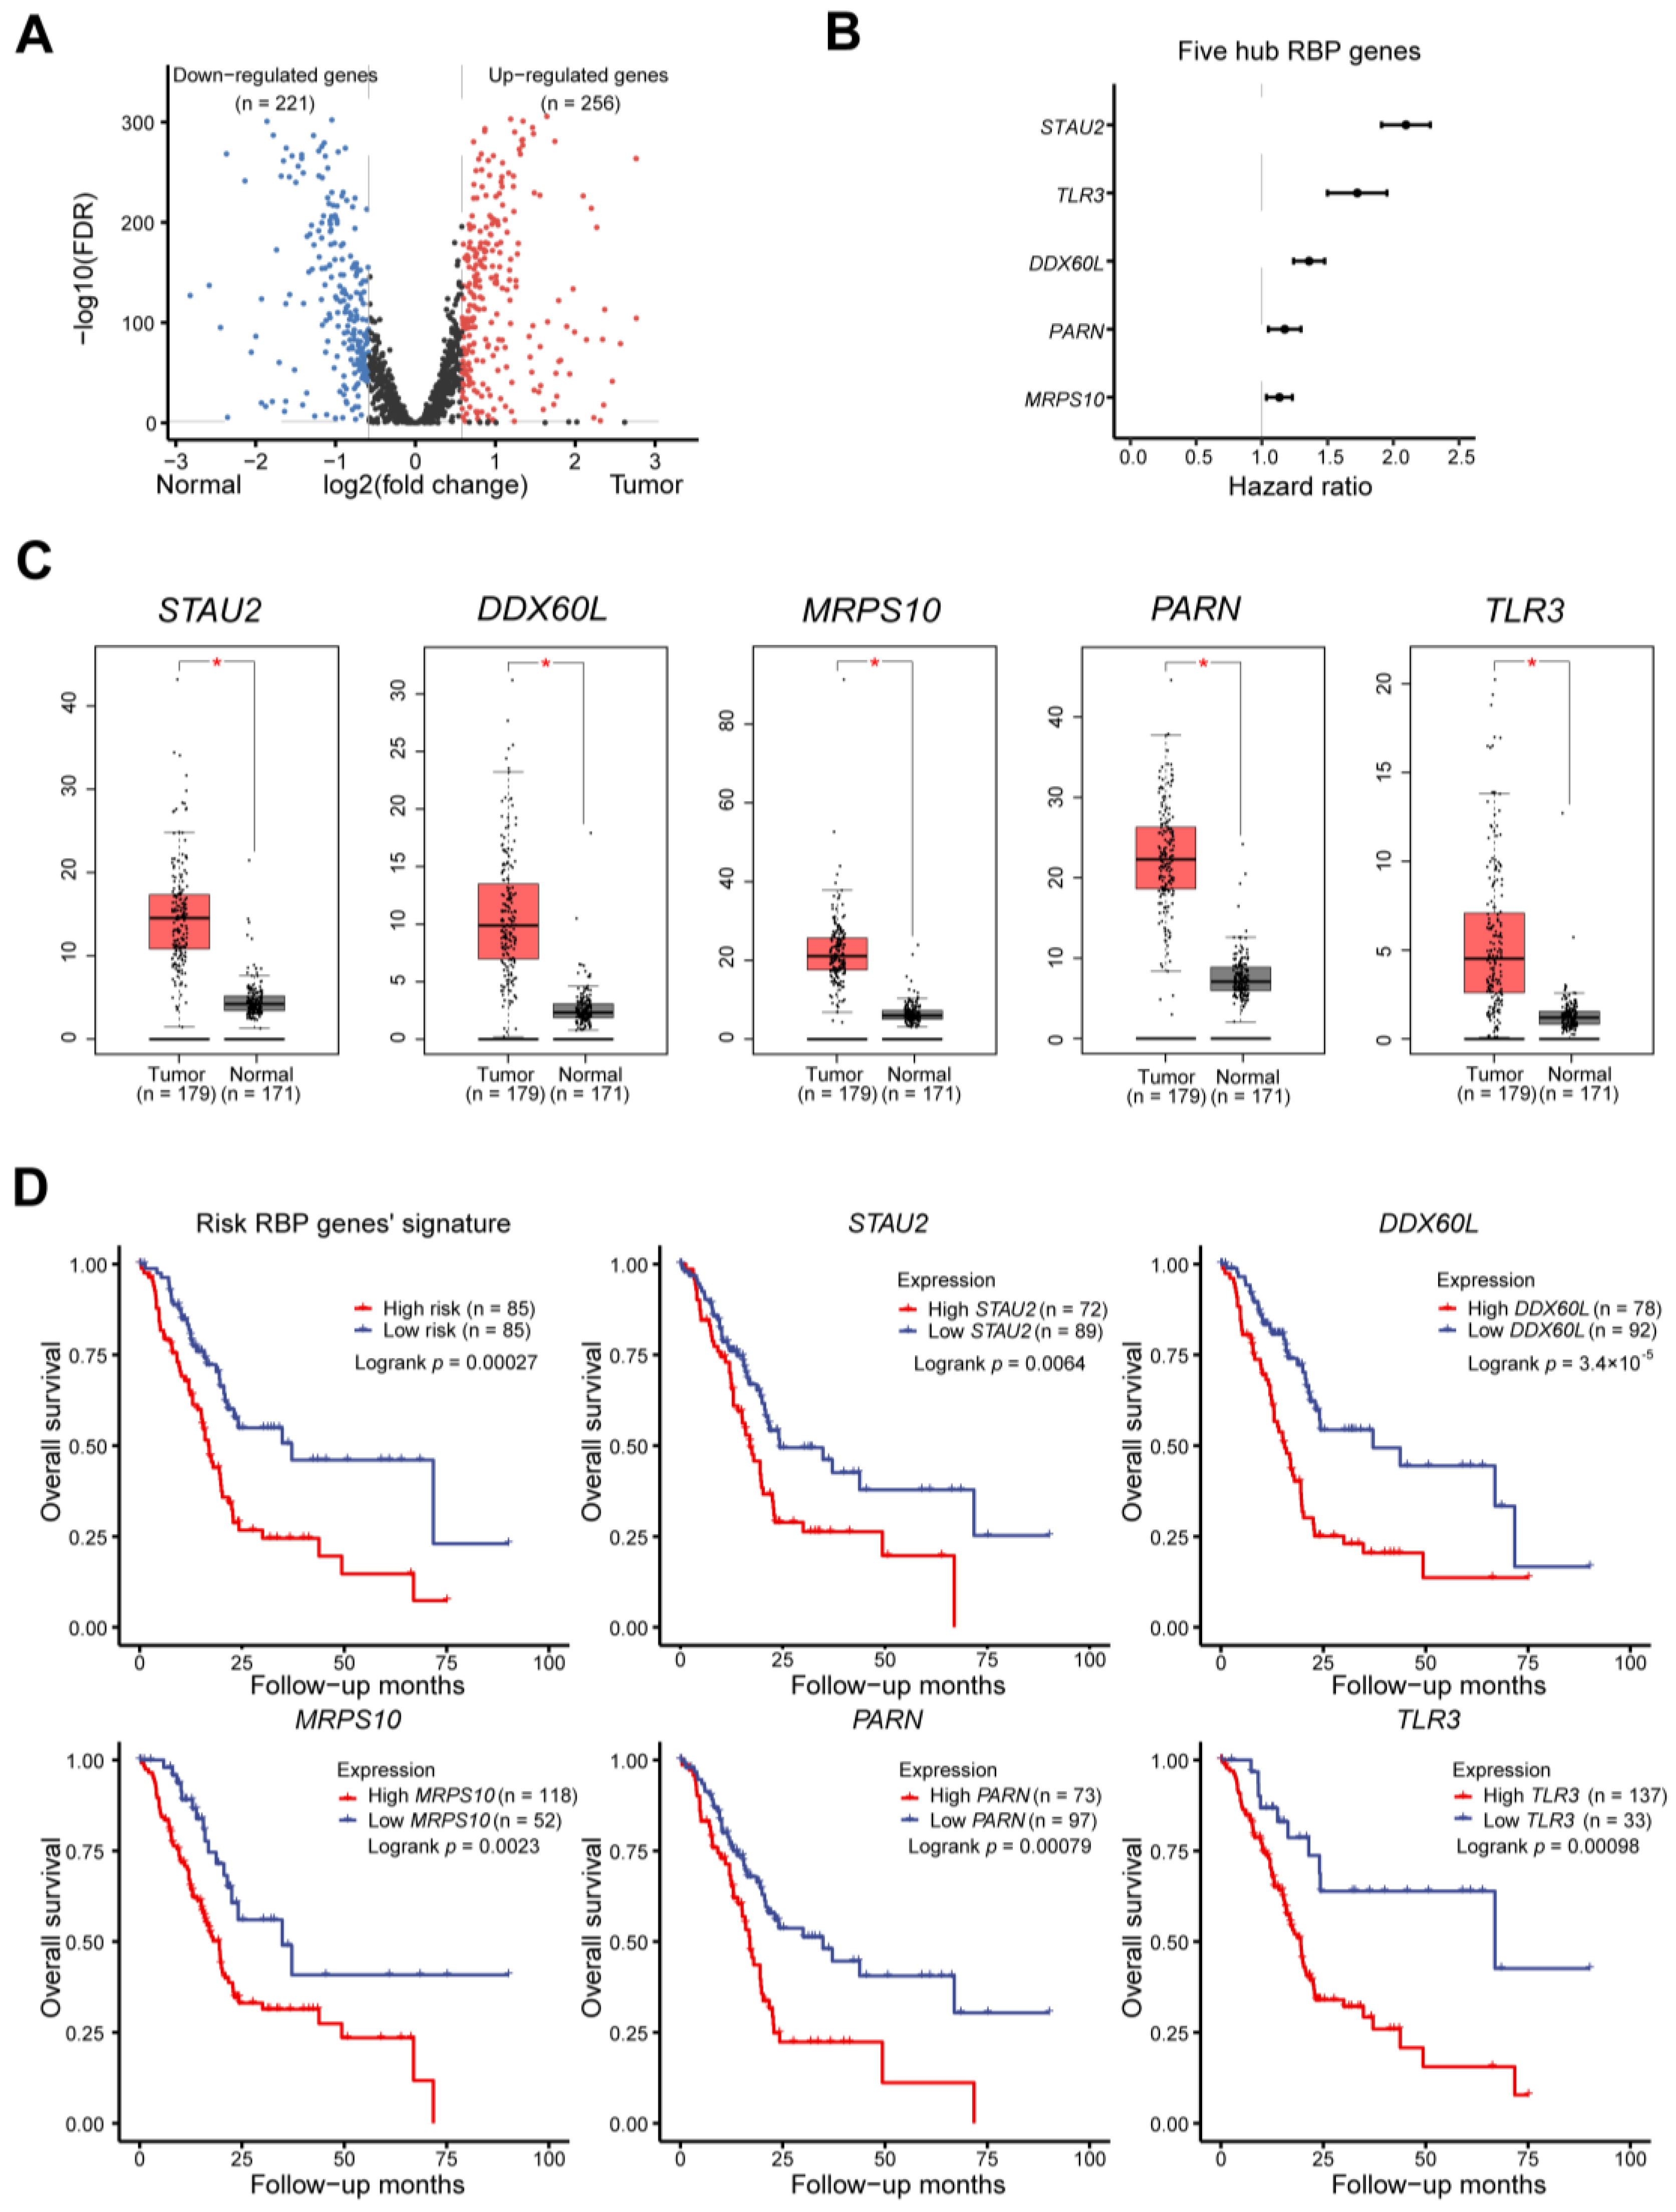
Based on the data from this study, we demonstrated that the RNA-binding protein STAU2 is a useful regulator of PAAD initiation and progression, suggesting that targeting RBPs is a promising therapeutic strategy for patients with PAAD. Dysregulation of RNA metabolism by altering RBP expression was associated with PAAD occurrence and aggressiveness. Therefore, investigating the most commonly suitable RBPs may lead to promising innovative therapy targets. In the present study, based on the TCGA and GTEx databases, we identified 477 DERBPs and screened out five hub RBPs (STAU2, DDX60L, MRPS10, PARN, TLR3) to build our prognostic signature. By adopting univariate and multiple stepwise Cox and lasso regression analyses in TCGA–PAAD, we found the profiles of these five genes to be overexpressed in PAAD samples. In addition, the TCGA cohort KM survival map showed that high expression of these five genes was associated with poorer overall survival. Furthermore, high expression of STAU2, DDX60L, MRPS10, and PARN was also evaluated by a KM survival plot through ICGC–PAAD. The results collectively demonstrated that the five hub RBP-derived risk model demonstrated a high prognostic and diagnostic ability.
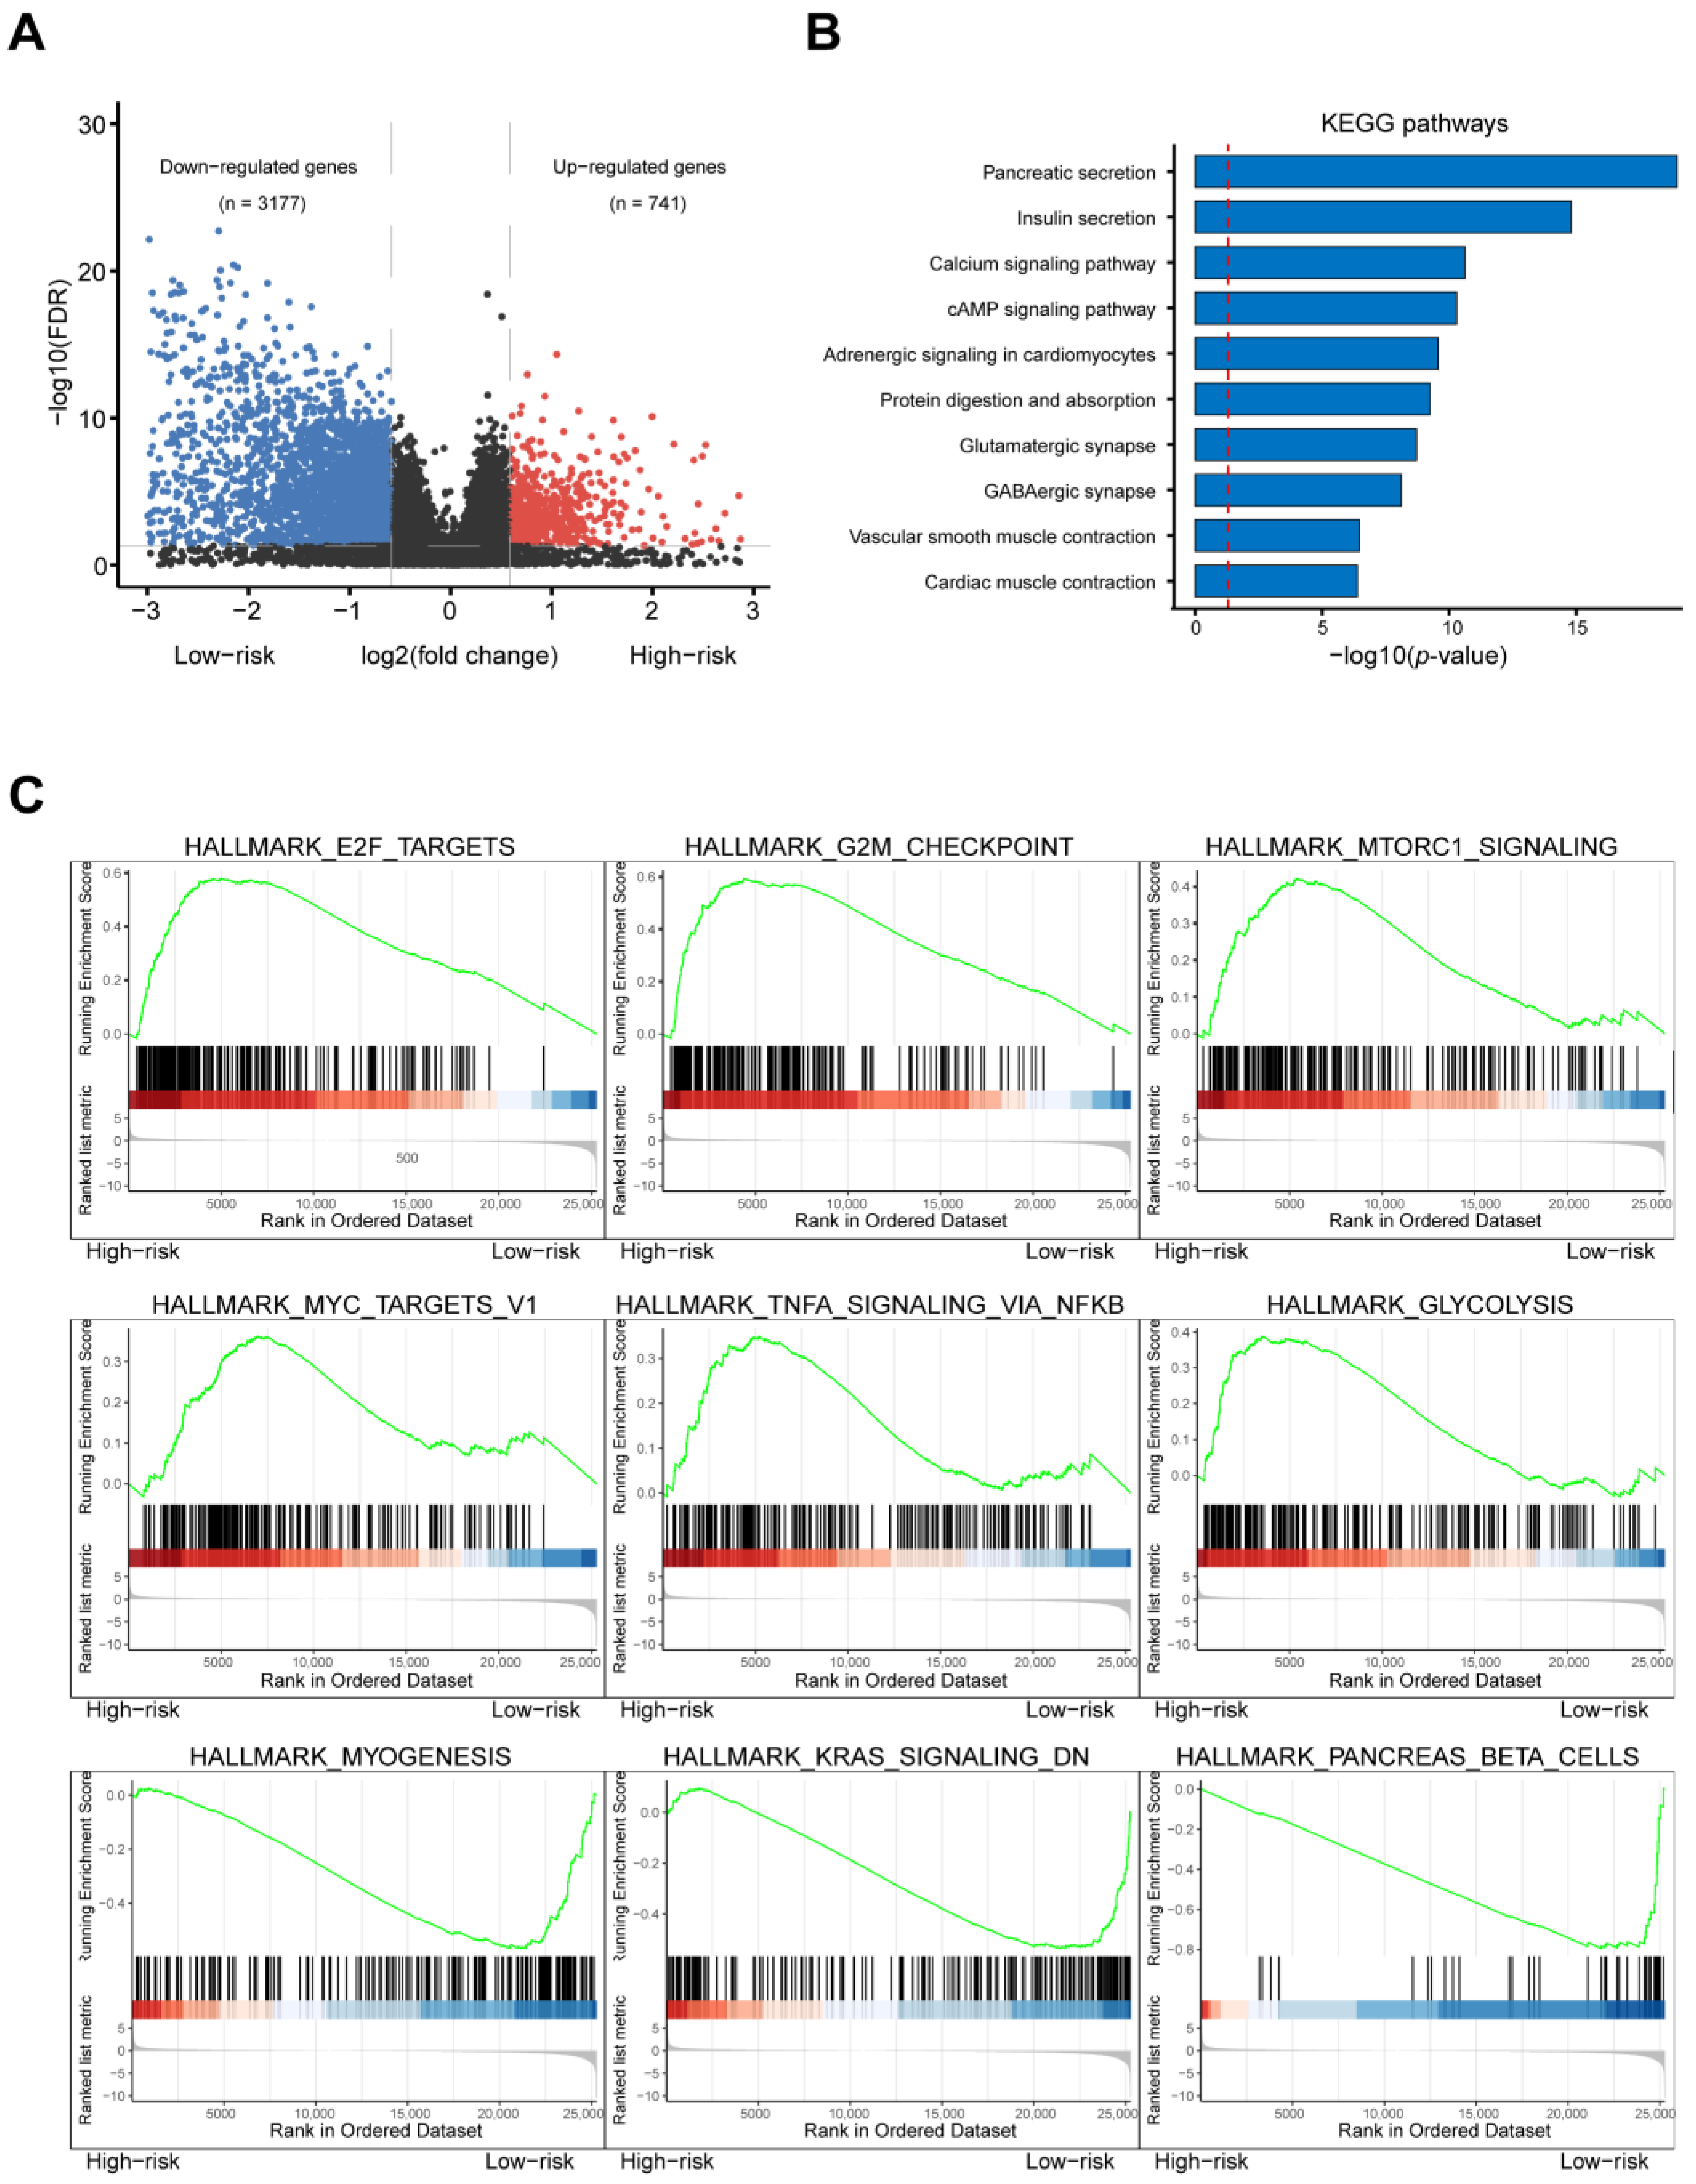
DEGs in different risk groups were used to study the molecular mechanisms of patients at high and low risk for PAAD. In total, 3177 downregulated and 741 upregulated genes were screened out, and Hallmark and KEGG functional enrichments were performed. We found that pancreatic secretion, E2F targets, G2M targets, MTORC1 signaling, and glycolysis signaling were highly activated in the high-risk group. These results indicated that these RBPs might regulate cell proliferation and PAAD metabolism pathways. Several studies have demonstrated the function of these genes in various cancers. For instance, Bajaj et al. reported that
STAU2 is a critical factor in the development of myeloid leukemia because it drives histone methylation [
34]. DExD/H-Box 60 (DDX60L), a member of the DExD/H-Box family of helicases involved in RNA metabolism, has been identified as influencing the survival and metastasis of pancreatic ductal adenocarcinoma (PDAC) cells [
41]. Mitochondrial ribosomal protein S10 (MRPS10), a 28S subunit protein belonging to the S10P ribosomal protein family, was found to be elevated in breast cancer, which might promote the fatty acid oxidation (FAO) process to support the rapid metabolism of tumor cells [
42]. Toll-like receptor 3 (TLR3) is an important member of the TLR family and is involved in double-stranded RNA binding and activation of the NF-κB signaling pathway. It has been reported as an oncogene involved in the proliferation of tumor cells that are highly expressed in head and neck, prostate, and breast cancers, as well as in hepatocellular carcinoma and multiple myeloma [
43]. Poly(A)-specific ribonuclease (PARN), which removes adenosine residues from the poly(A) tails after catalyzing mRNA deadenylation, was upregulated in gastric cancer, acute leukemia, and small cell lung carcinoma [
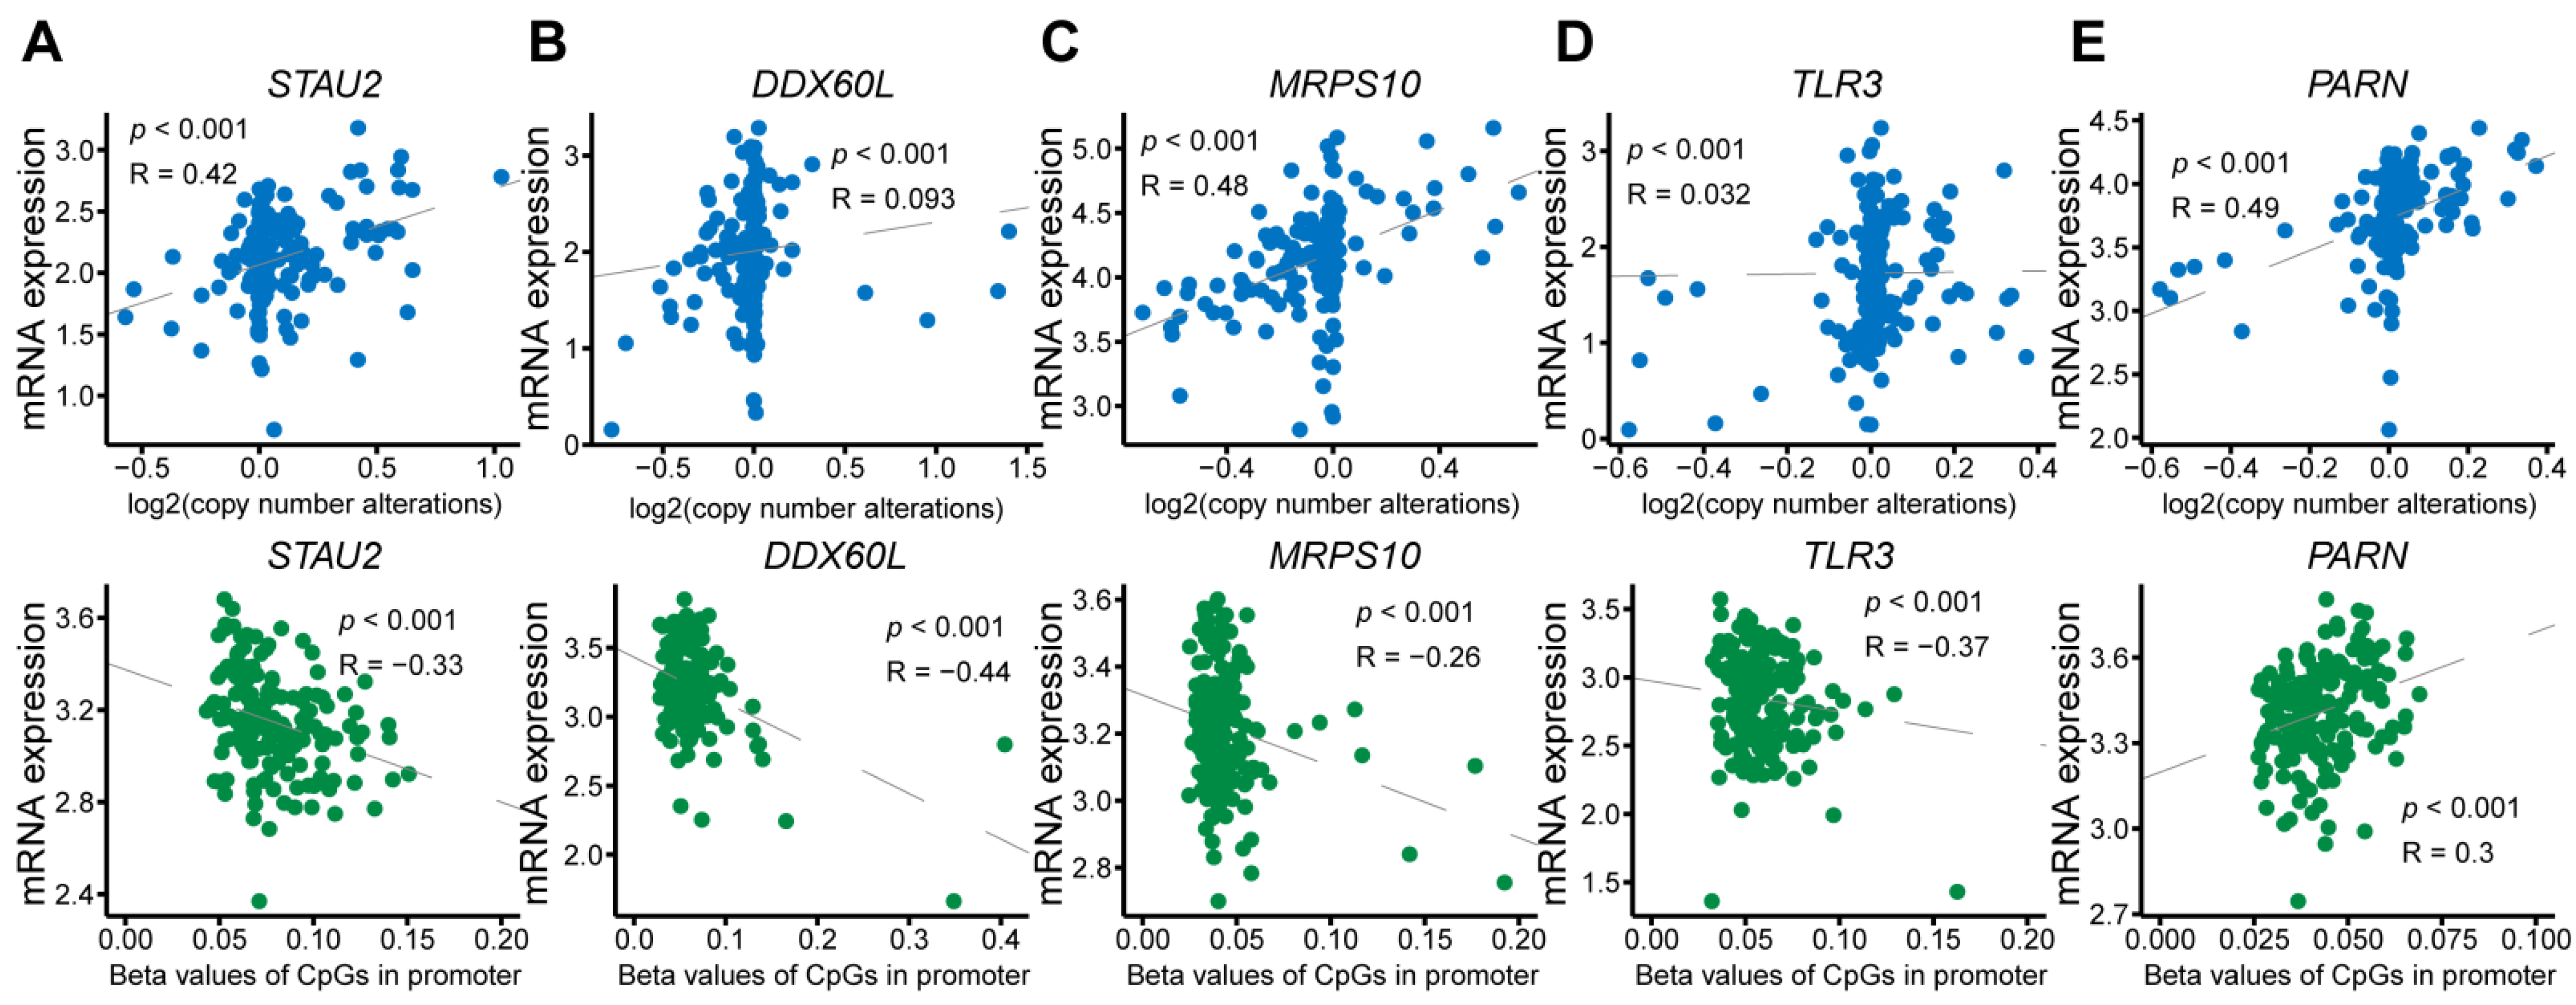
44]. Furthermore, we found that the genetic alteration of
STAU2,
MRPS10, and
PARN correlated with mRNA levels, and that the mRNA level of
STAU2 was also regulated by methylation. In addition,
DDX60L and
TLR3 might be methylation-regulating genes.
After focusing on the expression, hazard ratios with prognostic values, and survival tests of these five hub genes, we turned our attention to STAU2 to evaluate the reliability of the RBP-related signature. STAU2 contains five conserved RNA-binding domains that stabilize and transport mRNA. While it has been studied in hematological malignancies, its function in PAAD remains unknown. Herein, we showed that STAU2 displays high genetic alteration frequency among multiple tumors in TCGA cohorts, and that genetically mutated STAU2 patients showed poor prognosis in overall survival. Furthermore, multivariate Cox regression analysis showed that in the TCGA and ICGC databases, high expression of STAU2 mRNA was an independent prognostic factor for PAAD patients, and ROC analysis predicted that STAU2 expression was associated with the progression of PAAD. In addition, we confirmed that the transcript and protein levels of STAU2 are higher in PAAD cells than in normal pancreatic cells (HPDE6-C7). We observed that silencing STAU2 not only inhibited cell proliferation, colony formation, and metastasis but also induced tumor apoptosis. These results suggest that STAU2 plays a key role in PAAD regulation and is a potential target for the development of new anticancer drugs.
Notably, we explored co-expression genes with
STAU2 using the Linkedomics dataset, interactive genes using the STRING database, and relative genes using the FPKM matrix across TCGA–PAAD patients. Hallmark and KEGG functional analyses revealed that they were enriched mainly in processes such as UV-response, mitotic spindle, RNA transport, the mRNA surveillance pathway, TGF-β signaling, and the inflammatory response pathway. Furthermore, we identified seven key target genes of
STAU2 by exploring the
STAU2-correlated genes (TCGA–PAAD),
STAU2-binding genes (GSE134971), and downregulating
STAU2-correlated genes (RNA-Seq) database. Correlation analysis and RT-qPCR and RIP RT-qPCR validation showed that
STAU2 binds and stabilizes
PALLD,
HNRNPU,
SERBP1, and
DDX3X mRNA, and that upregulation of these genes leads to poor overall survival in PAAD patients. Previous studies have reported the biological function of these targets in several kinds of cancers. PALLD promotes pancreatic cancer cell invasion by promoting the invasive formation of tumor-associated fibroblasts [
45]. HNRNPU is overexpressed in hepatocellular carcinoma (HCC) and promotes HCC occurrence and progression [
46,
47]. SERBP1 is a member of the RG/RGG family of RBPs, which is markedly overexpressed in glioblastoma and in prostate, ovarian, and liver cancer and is associated with poor outcomes [
48,
49]. DDX3X is a member of the ATP-dependent RNA helicase subfamily, which is involved in mRNA splicing, transport, and translation. DDX3X functions as an oncogenic protein in regulating the tumorigenesis and metastasis of various cancers, such as glioma, prostate cancer, Ewing sarcoma, and breast cancer [
50,
51]. Moreover, Liang et al. reported that upregulation of DDX3X is associated with a poor prognosis in pancreatic ductal adenocarcinoma (PDAC) patients [
52]. The molecular regulatory mechanism between
STAU2 and these substrates needs to be explored further.
In recent years, immunotherapy has been applied in a variety of cancers, but due to the heterogeneity of tumors and complexity of the tumor microenvironment, PAAD patients display poor response to single-agent immunotherapy [
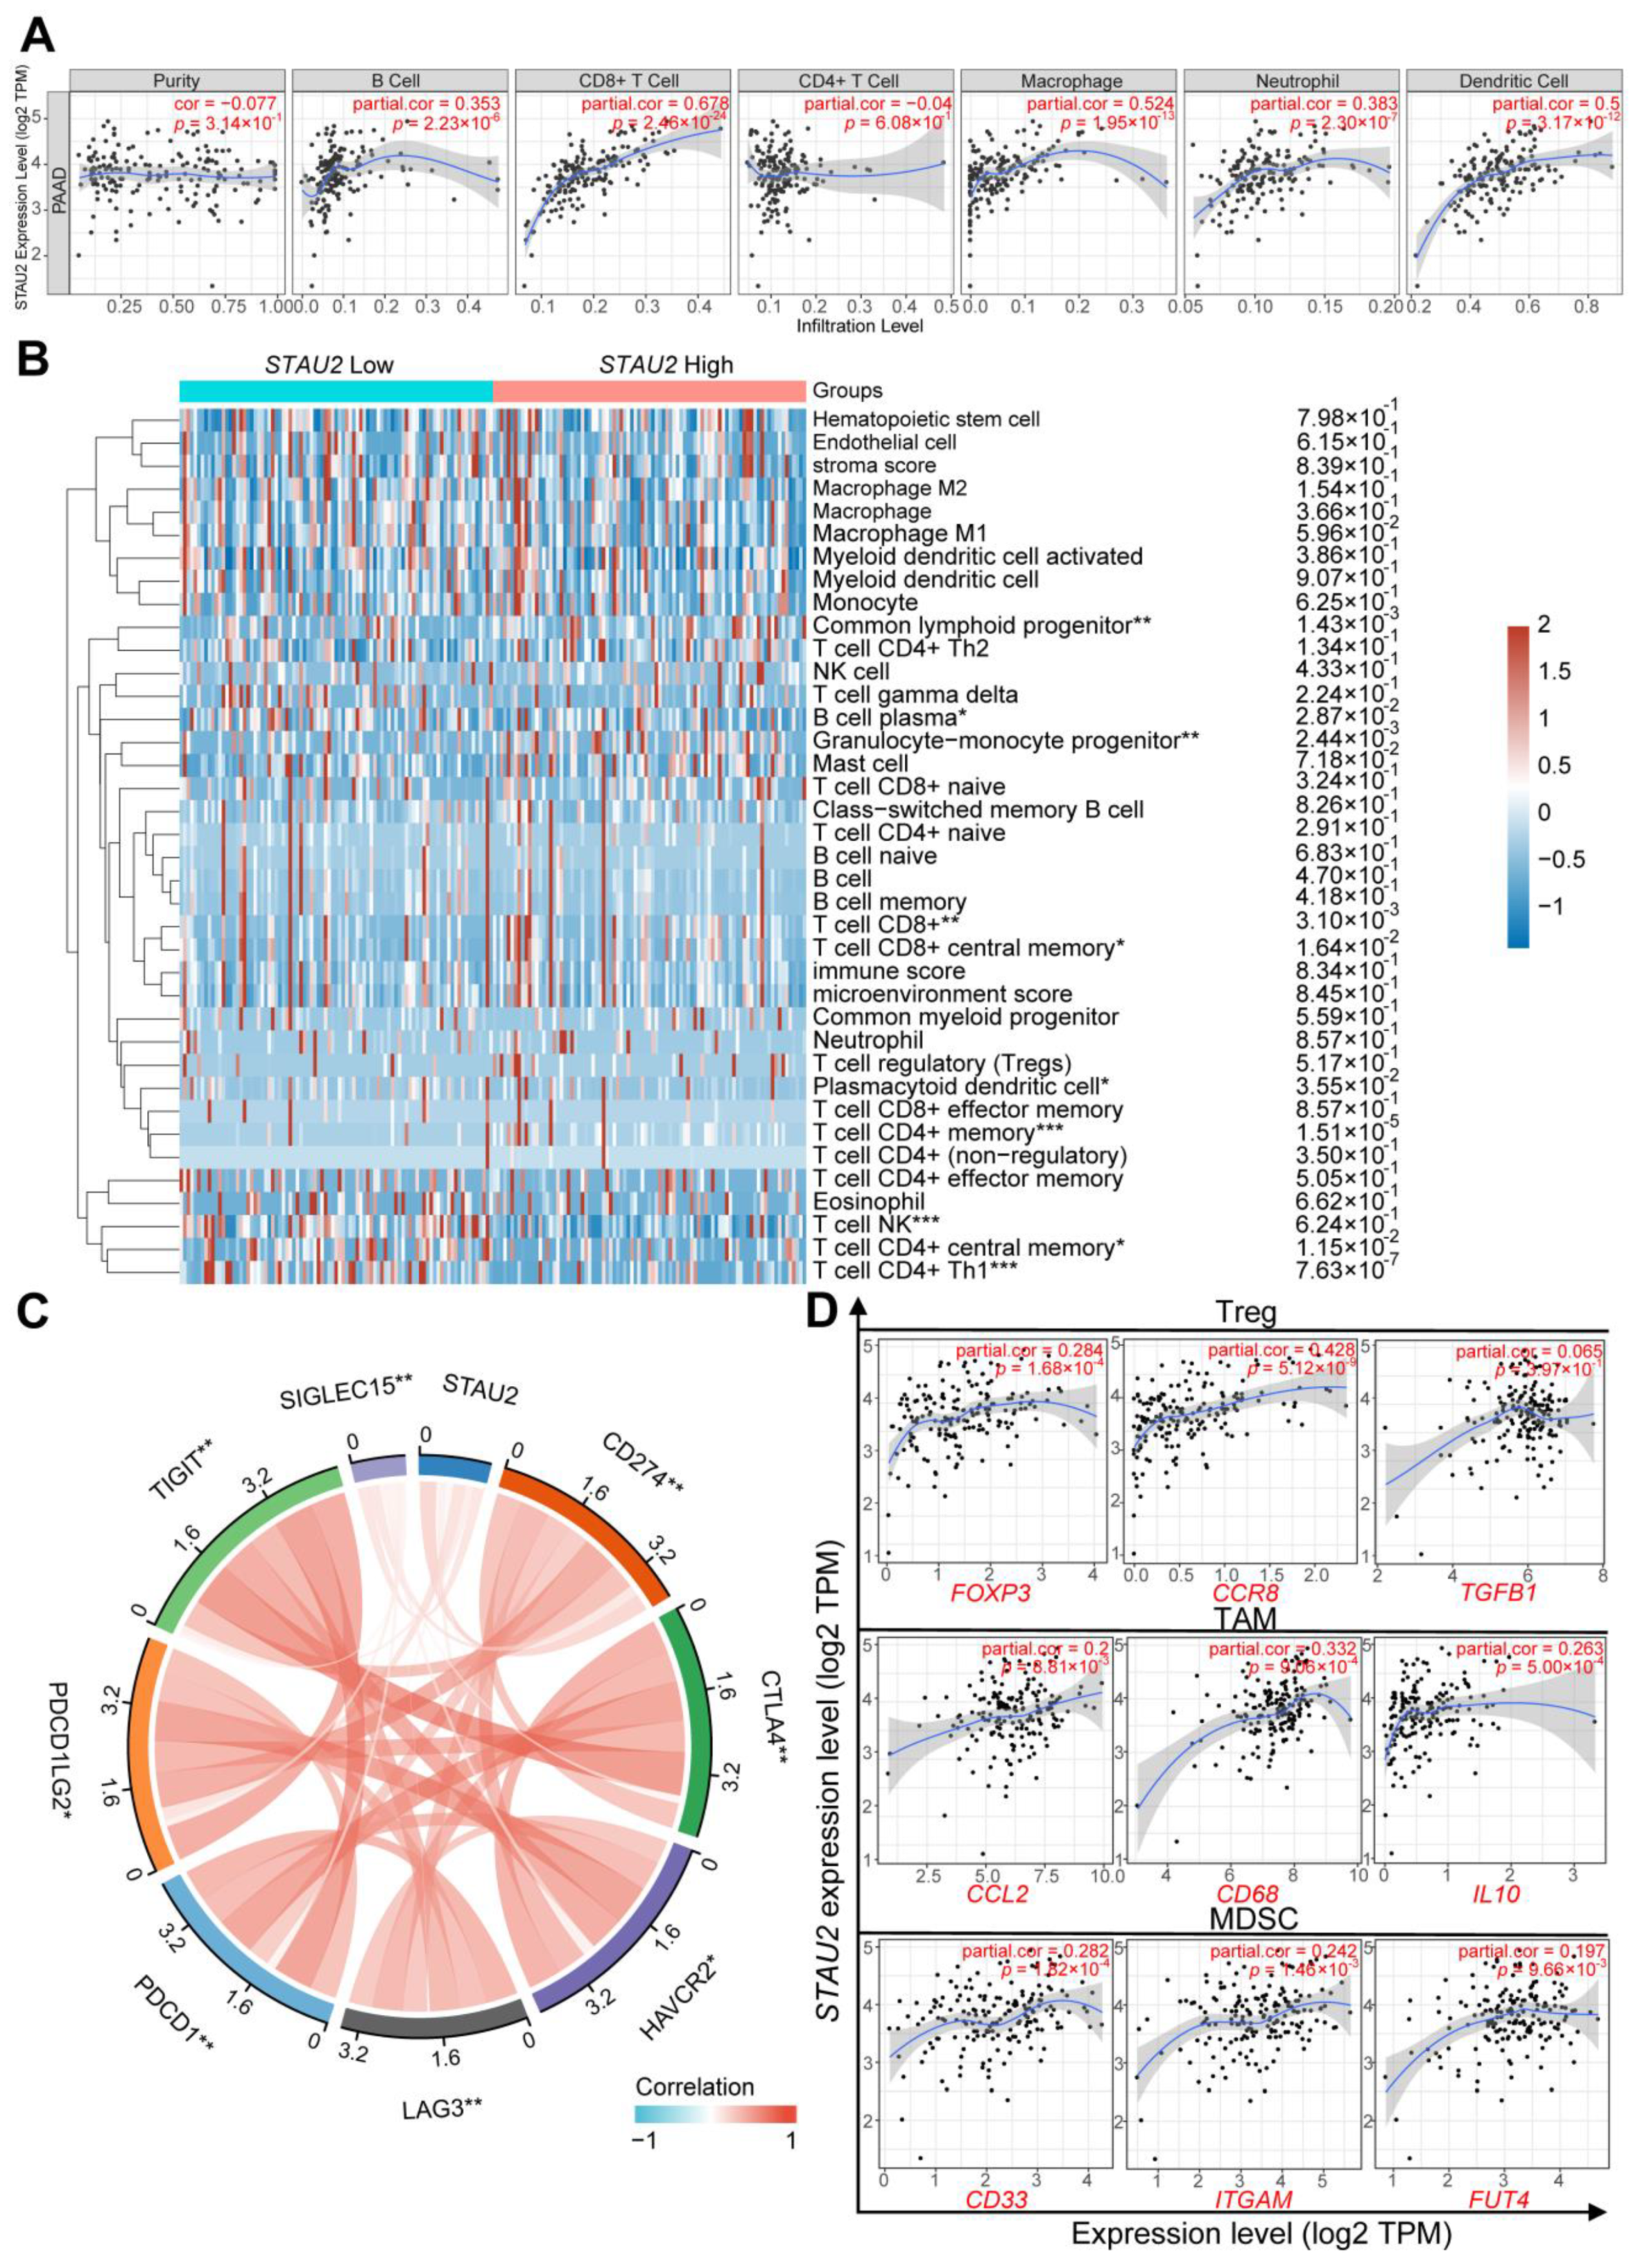
2]. Immune infiltration levels exhibit a close relation to immunotherapy responses and exert an important role in affecting the prognosis of patients. Here, we found that
STAU2 correlated positively with the common lymphoid progenitor, granulocyte–monocyte progenitors, CD8+ T cell, CD8+ central memory T cell, and CD4+ memory T cell. Meanwhile,
STAU2 negatively correlated with B plasma, CD4+ central memory, and CD4+ Th1 T cells in PAAD. Moreover,
STAU2 expression was positively associated with immune checkpoint markers, such as PD-1, PD-L1, and CTLA4. Our study also showed that
STAU2 expression was positively associated with marker sets of immunosuppressive cells (Treg, TAM, and MDSC). More importantly, PAAD patients with high
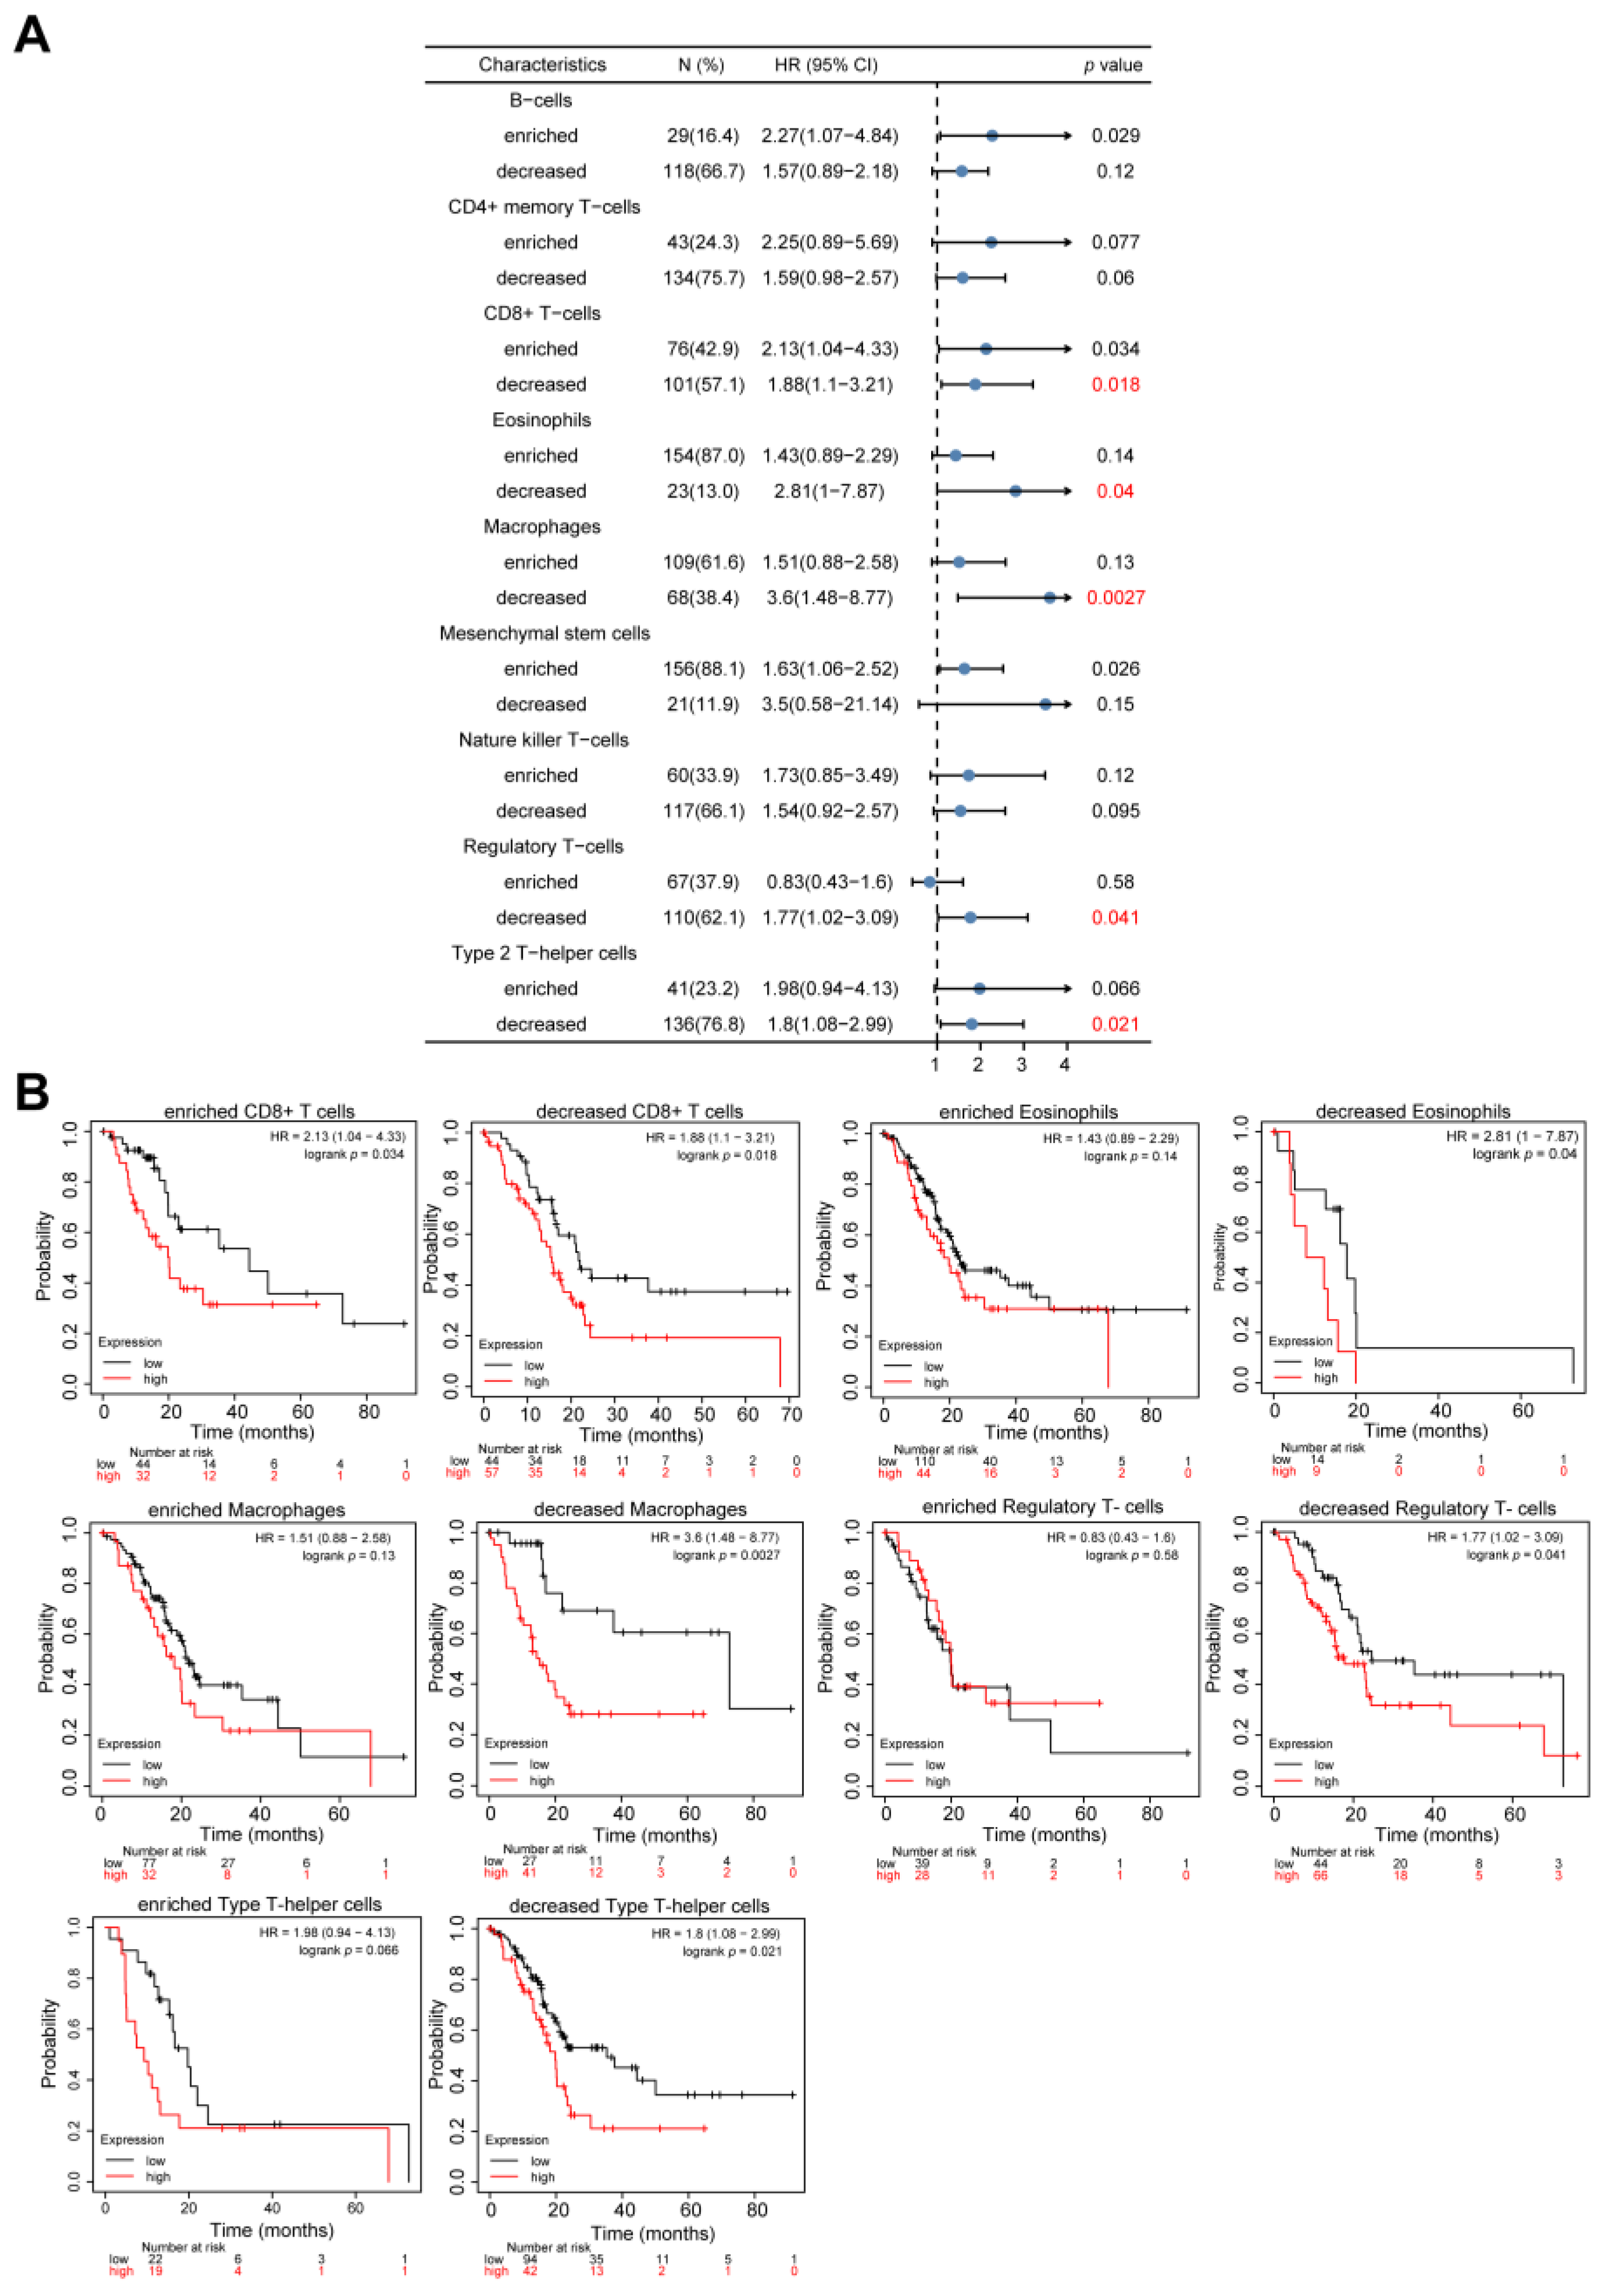
STAU2 expression and decreased CD8+ T cells, eosinophils, macrophages, regulatory T cells, and type 2 T-helper cells exhibited poor prognoses. Collectively, these results indicate that a high
STAU2 expression might contribute to PAAD immune system evasion, and this could serve as a potential immunotherapeutic target. Currently, the main treatment strategies are surgery and chemotherapy. Previous studies have shown that RBPs are closely related to drug sensitivity [
53,
54]. Our results showed that patients with high
STAU2 mRNA were more sensitive to 5-Fluorouracil and Gemcitabine, but more resistant to Erlotinib (an EGFR inhibitor), which could serve as a potential target for combinatorial therapy.


 ,
, 