
An Open-Source AI Framework for the Analysis of Single Cells in Whole-Slide Images with a Note on CD276 in Glioblastoma


 , ,
, ,
Abstract
:Simple Summary
Abstract
1. Introduction
2. Materials and Methods
2.1. Dataset
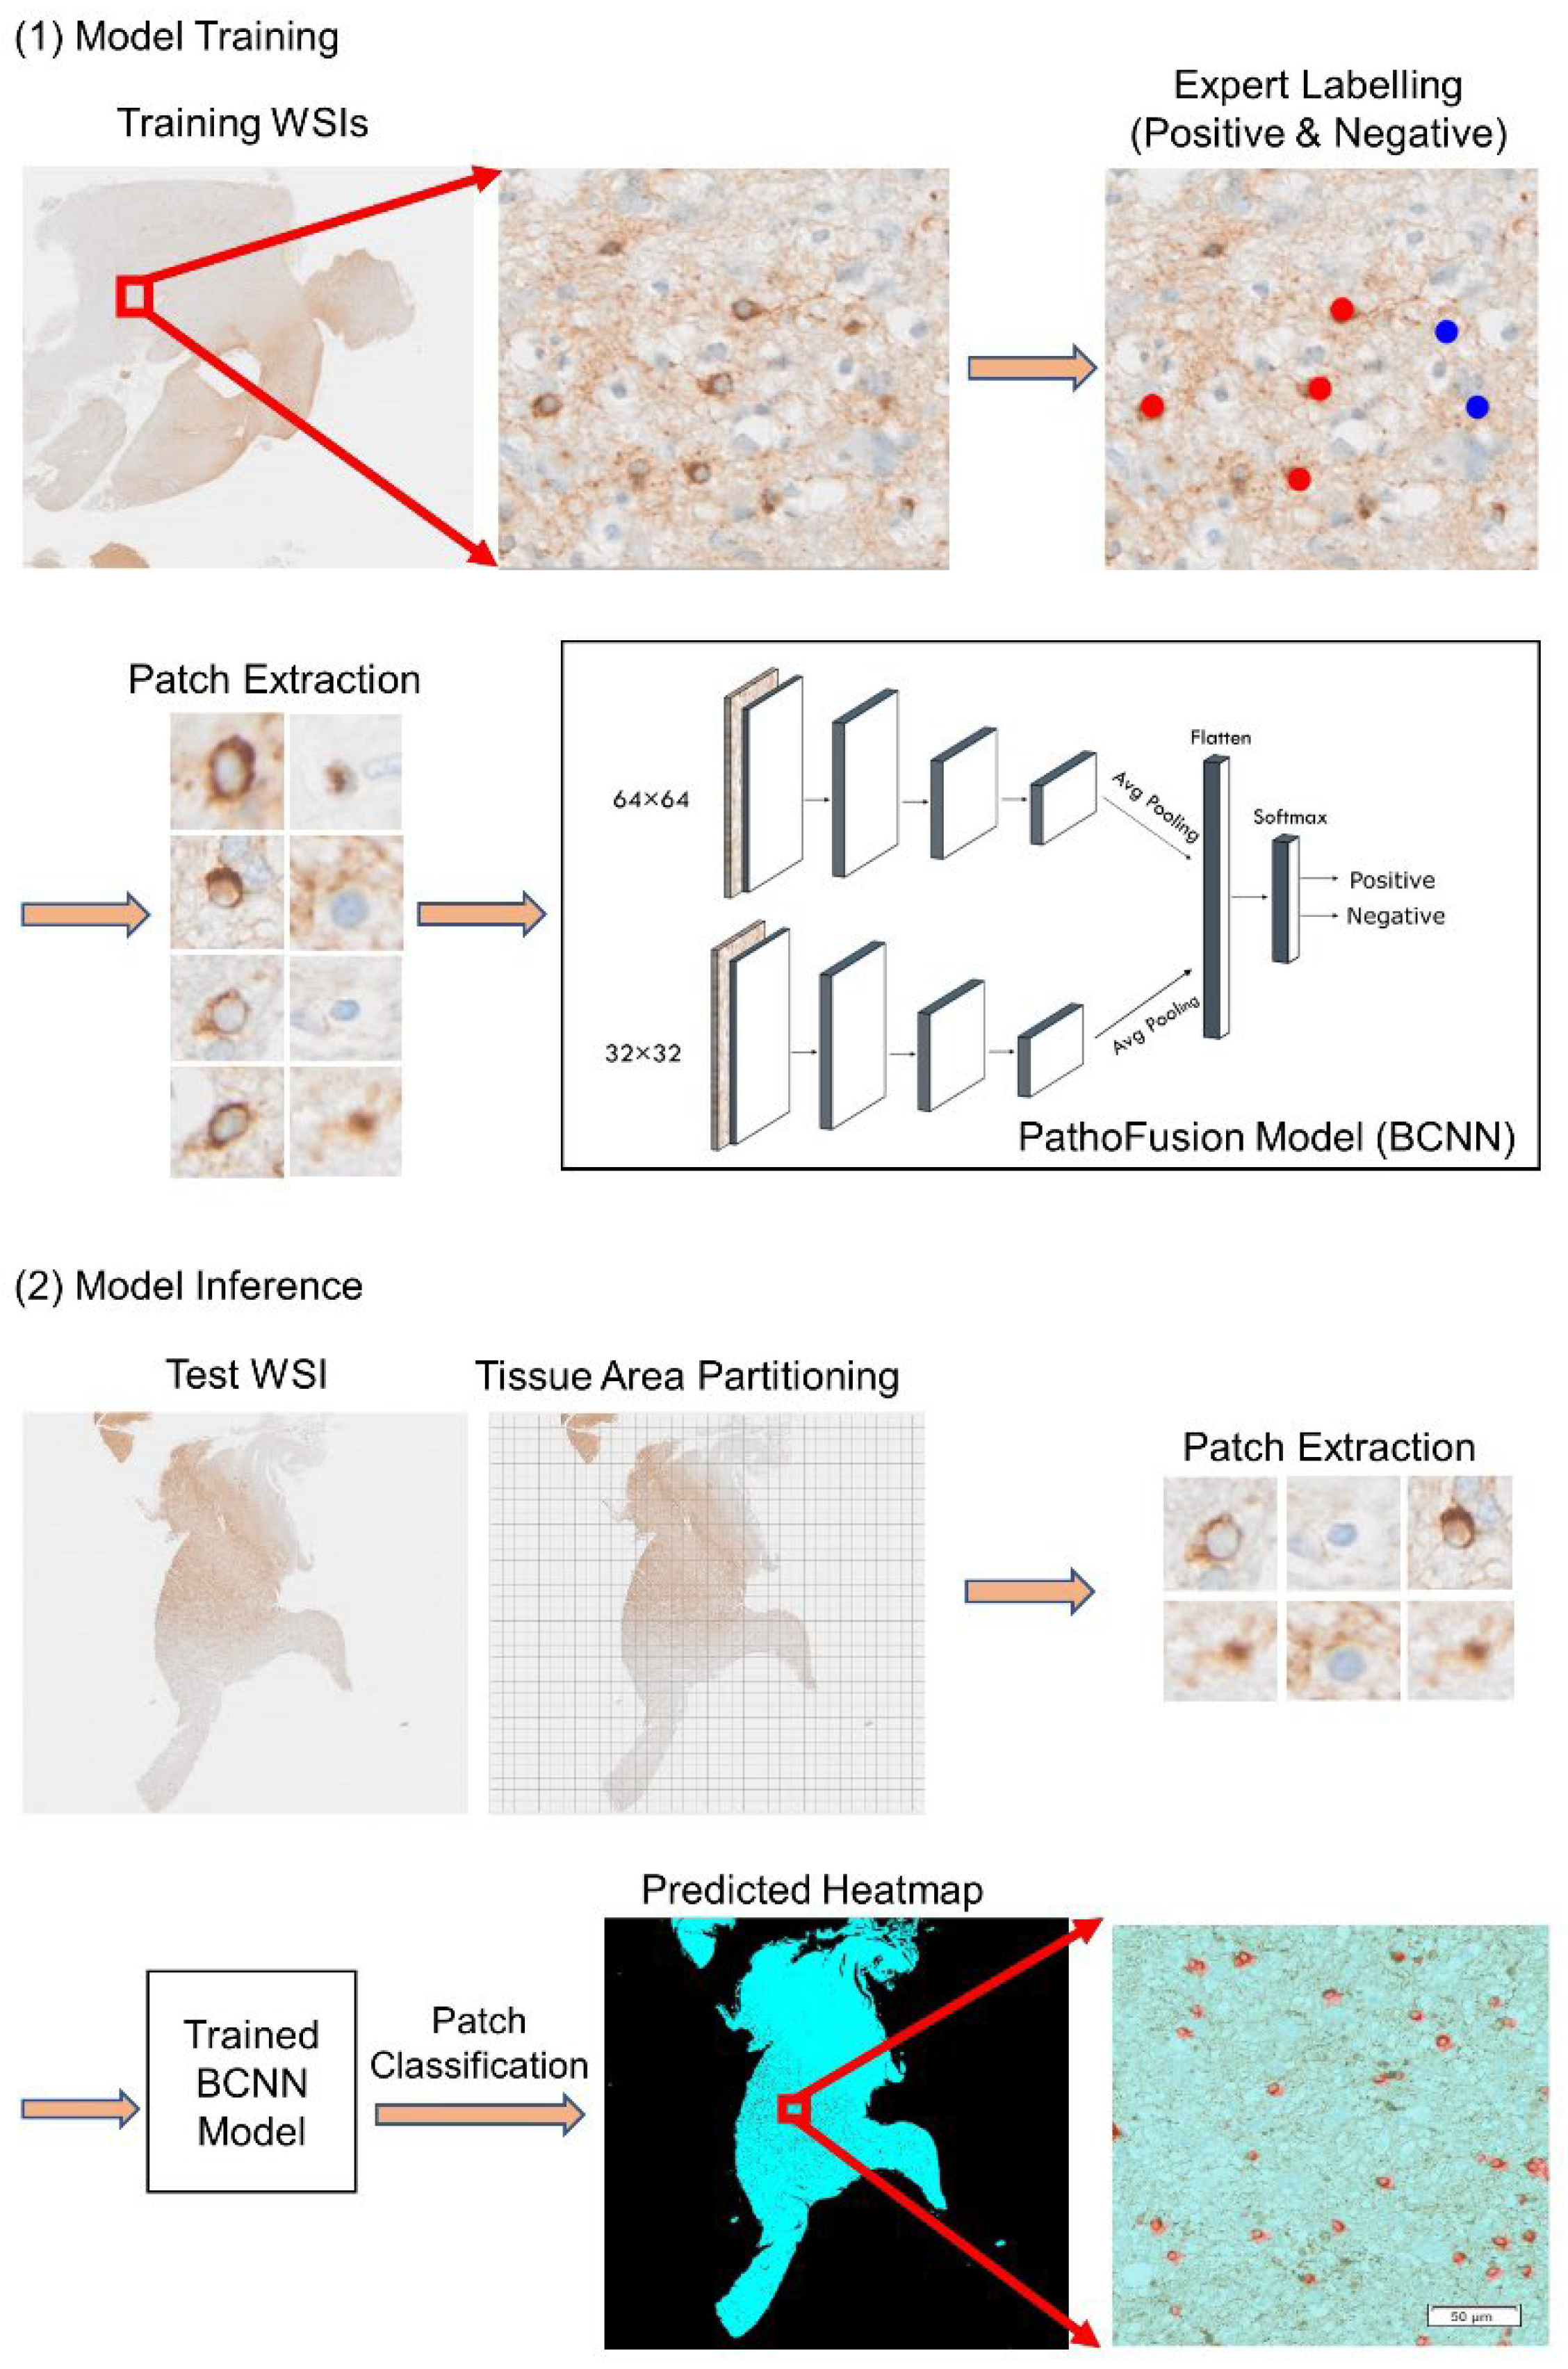
2.2. The Framework
2.3. The BCNN Model
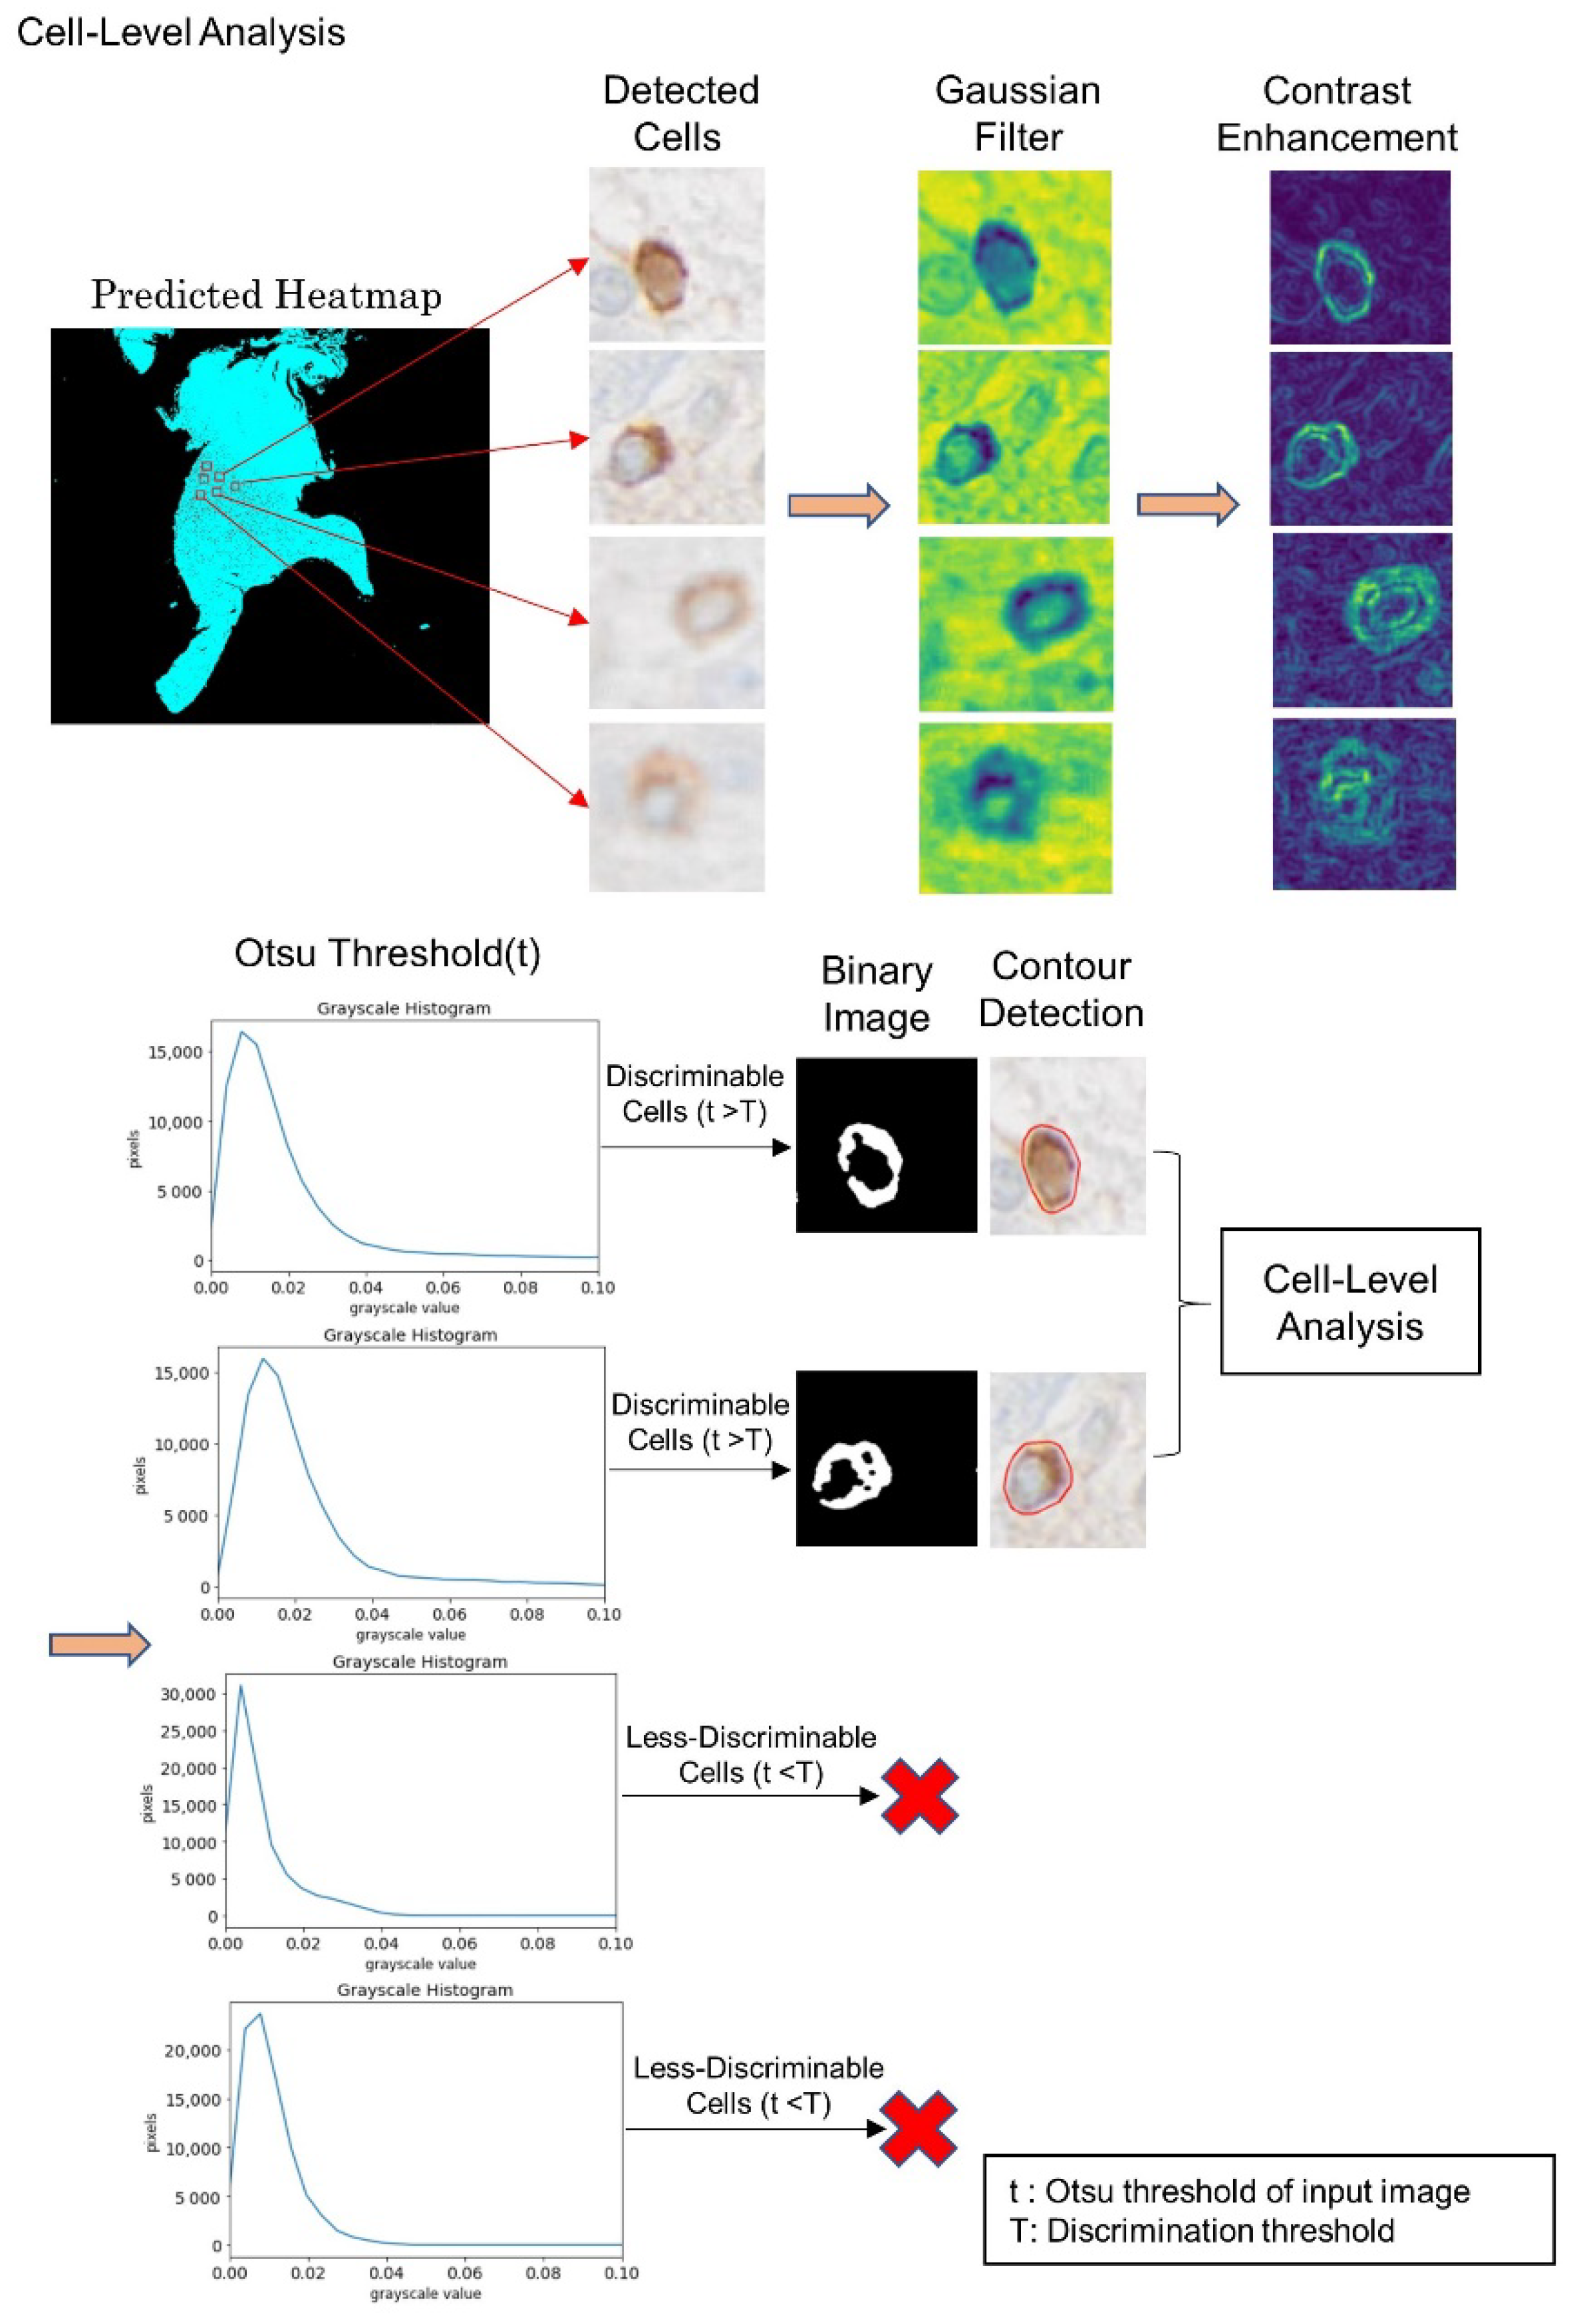
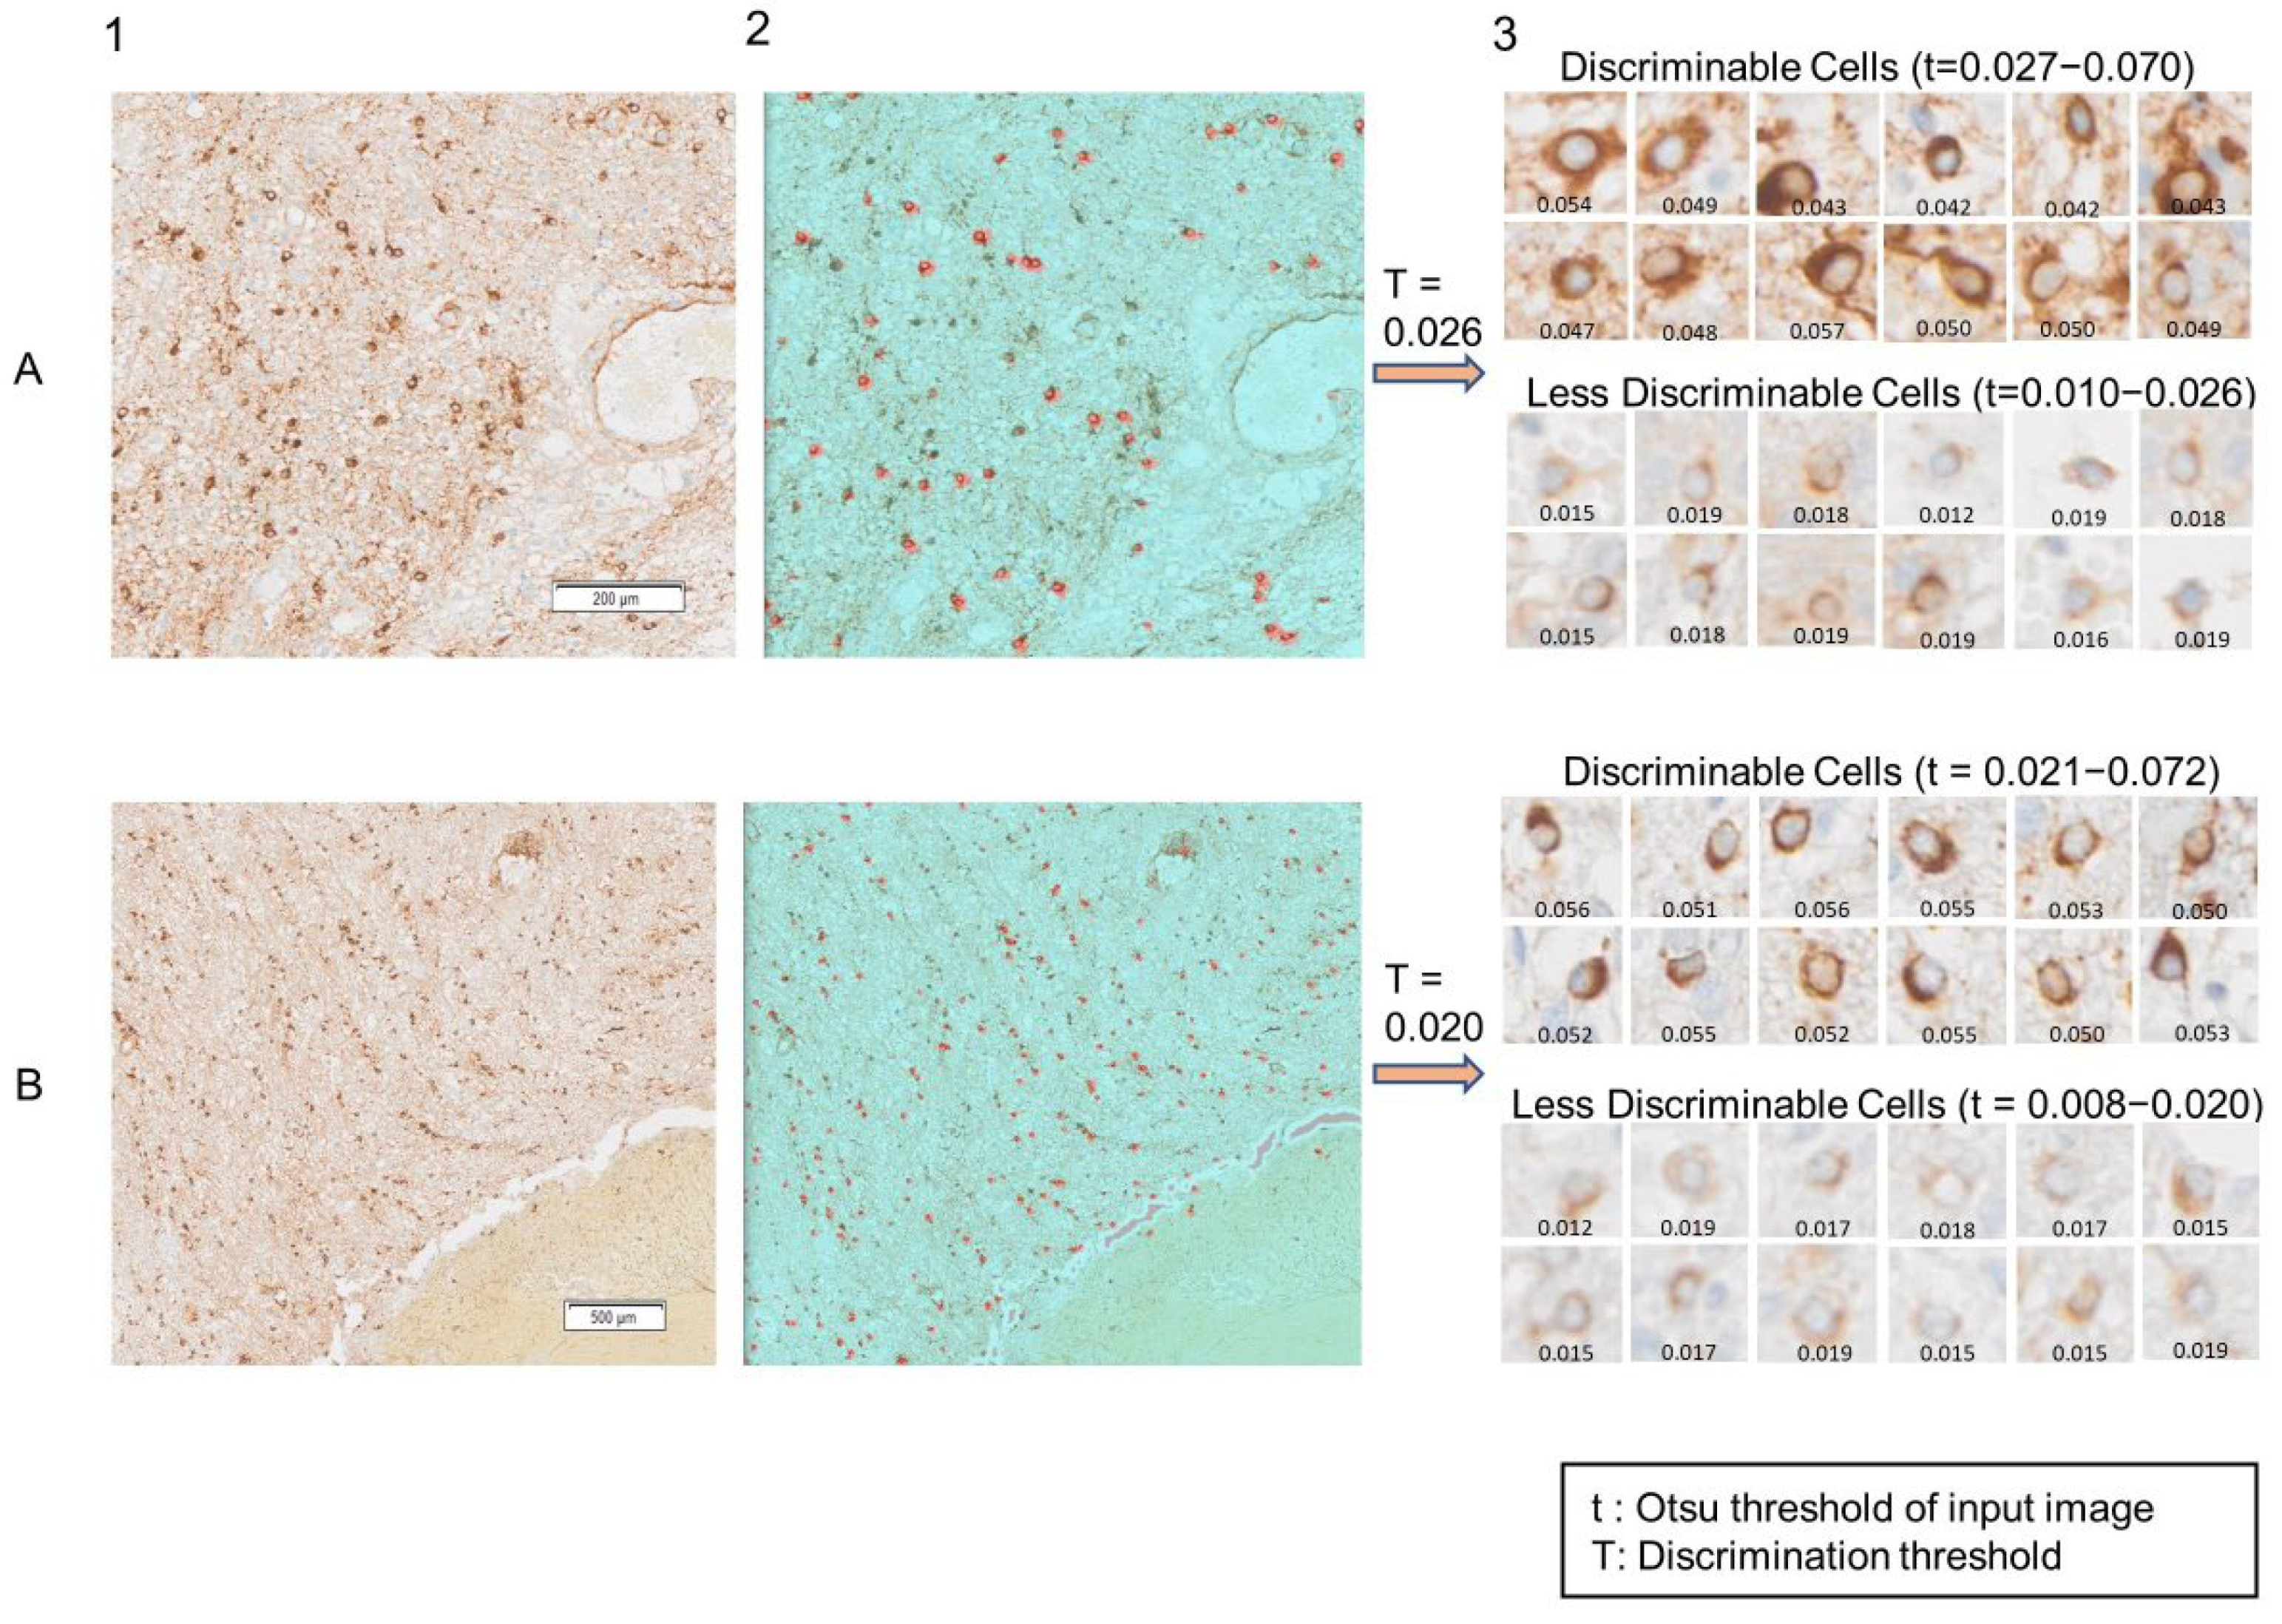
2.4. Filtering and Thresholding
2.5. Edge and Contour Detection
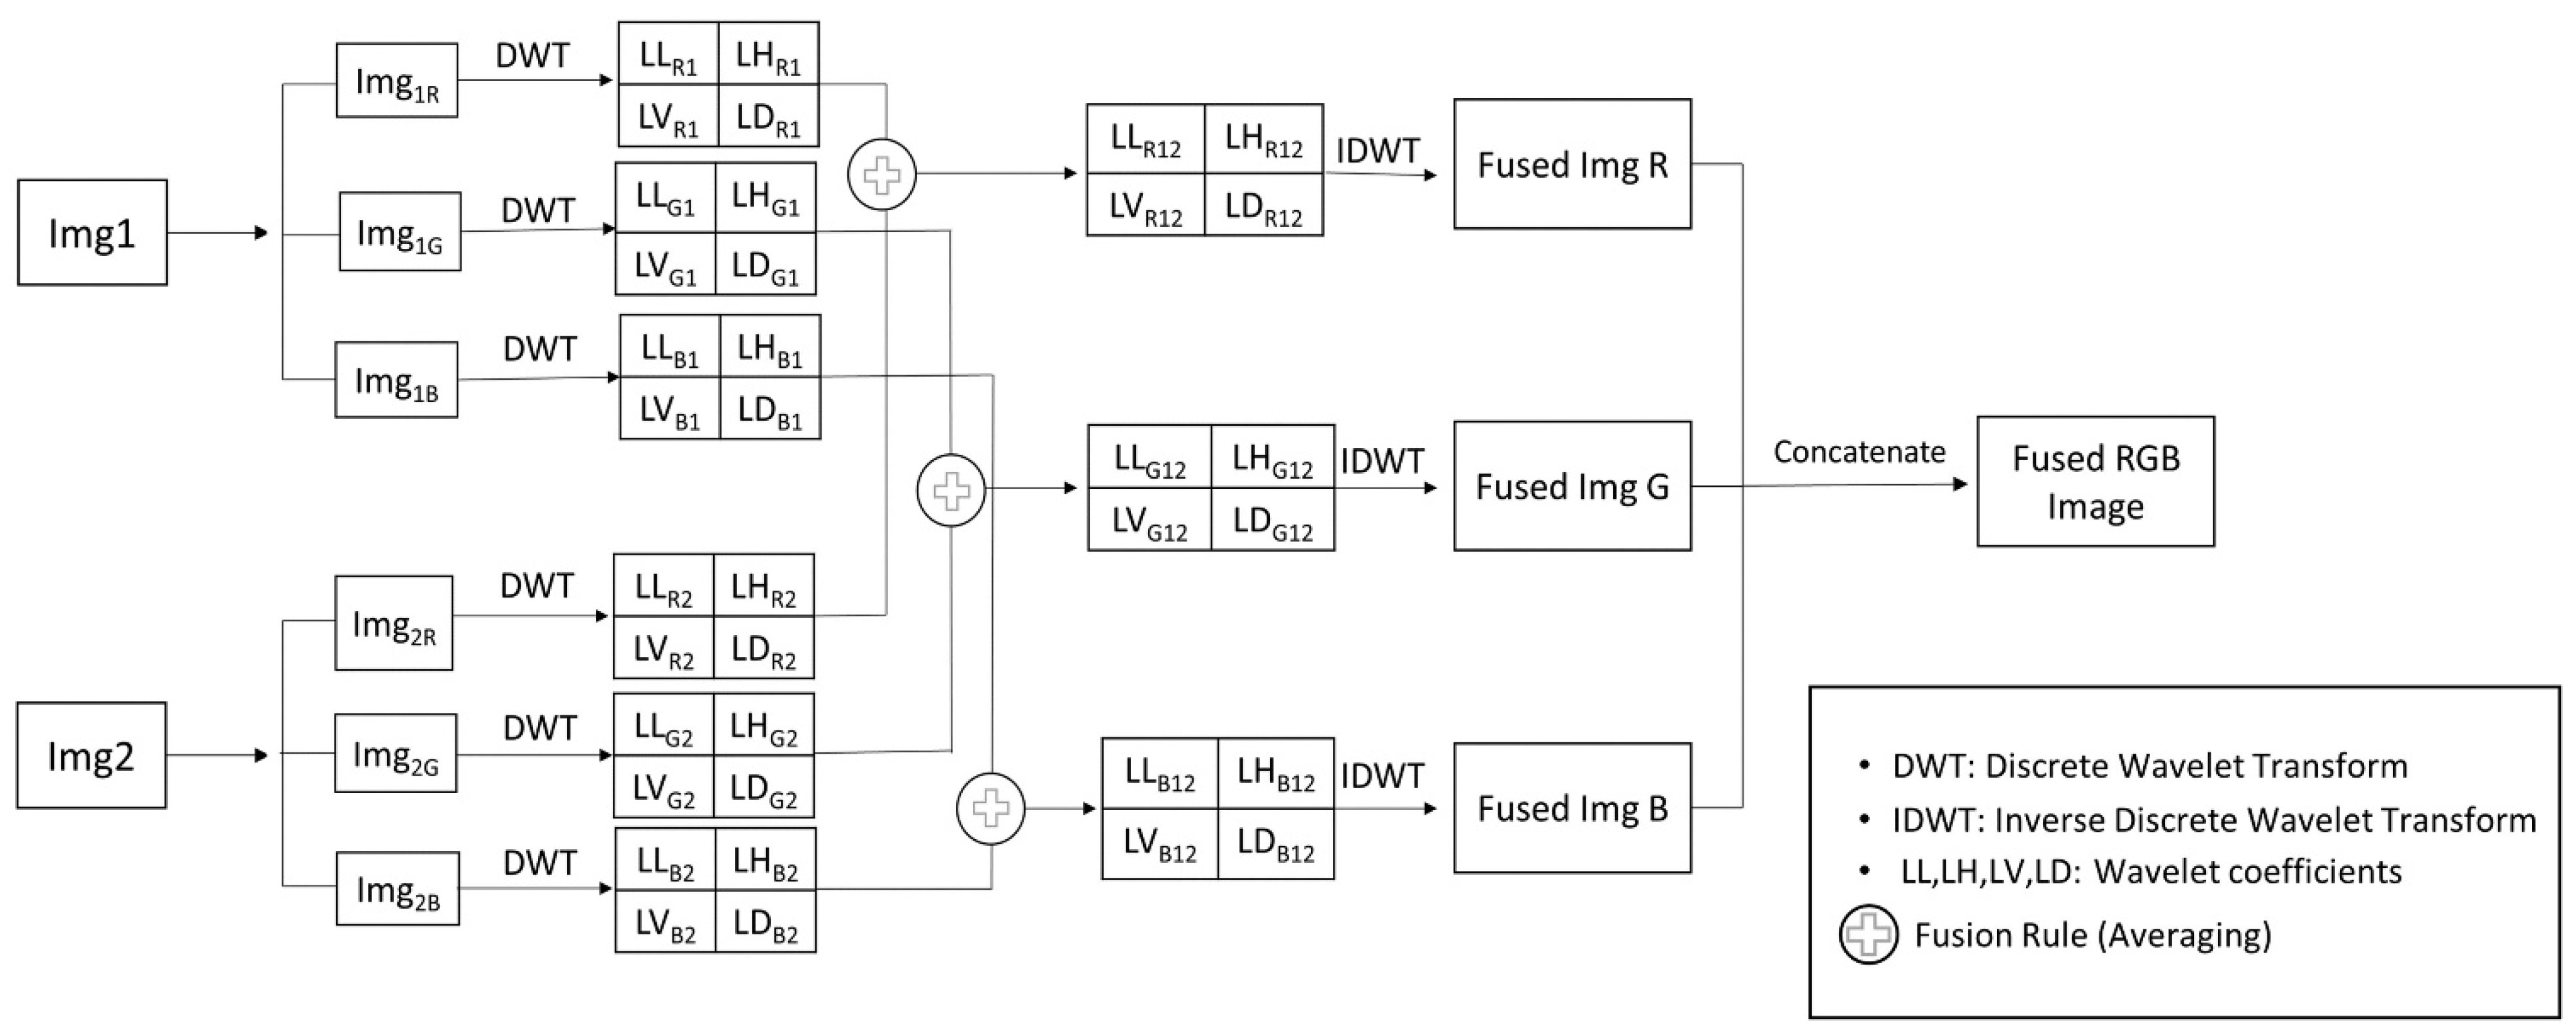
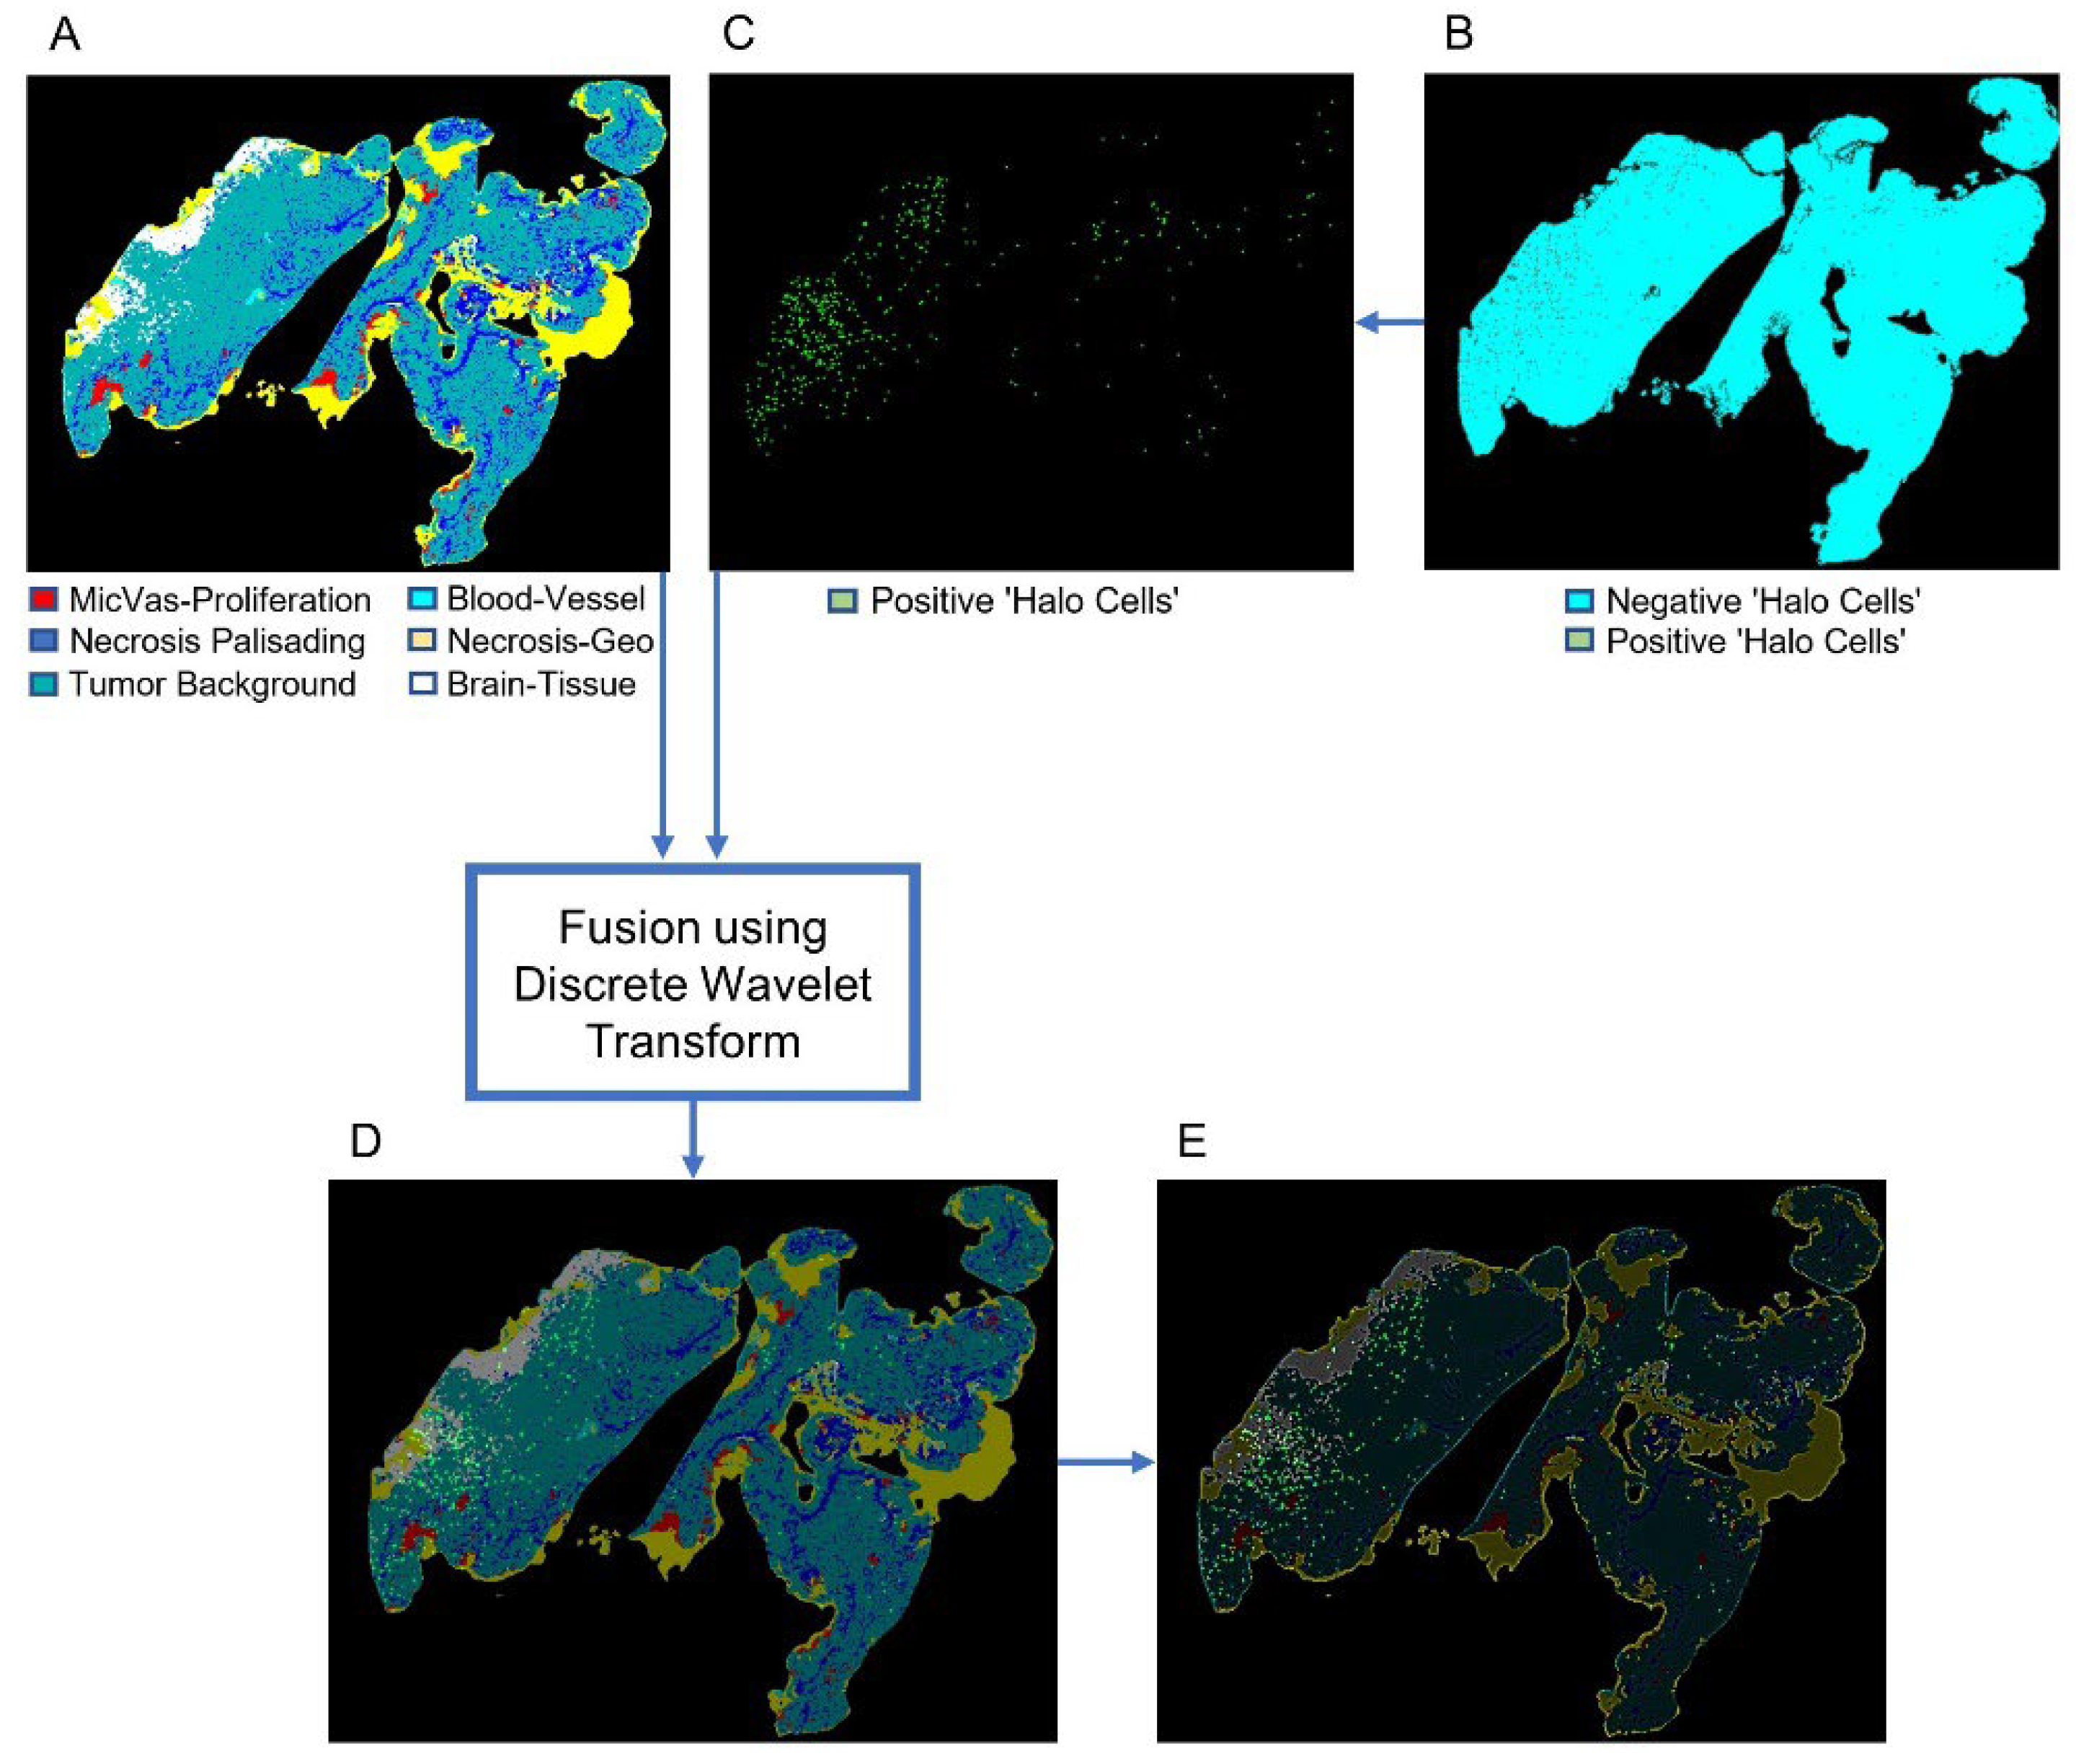
2.6. Discrete Wavelet Transform for Image Fusion
3. Results
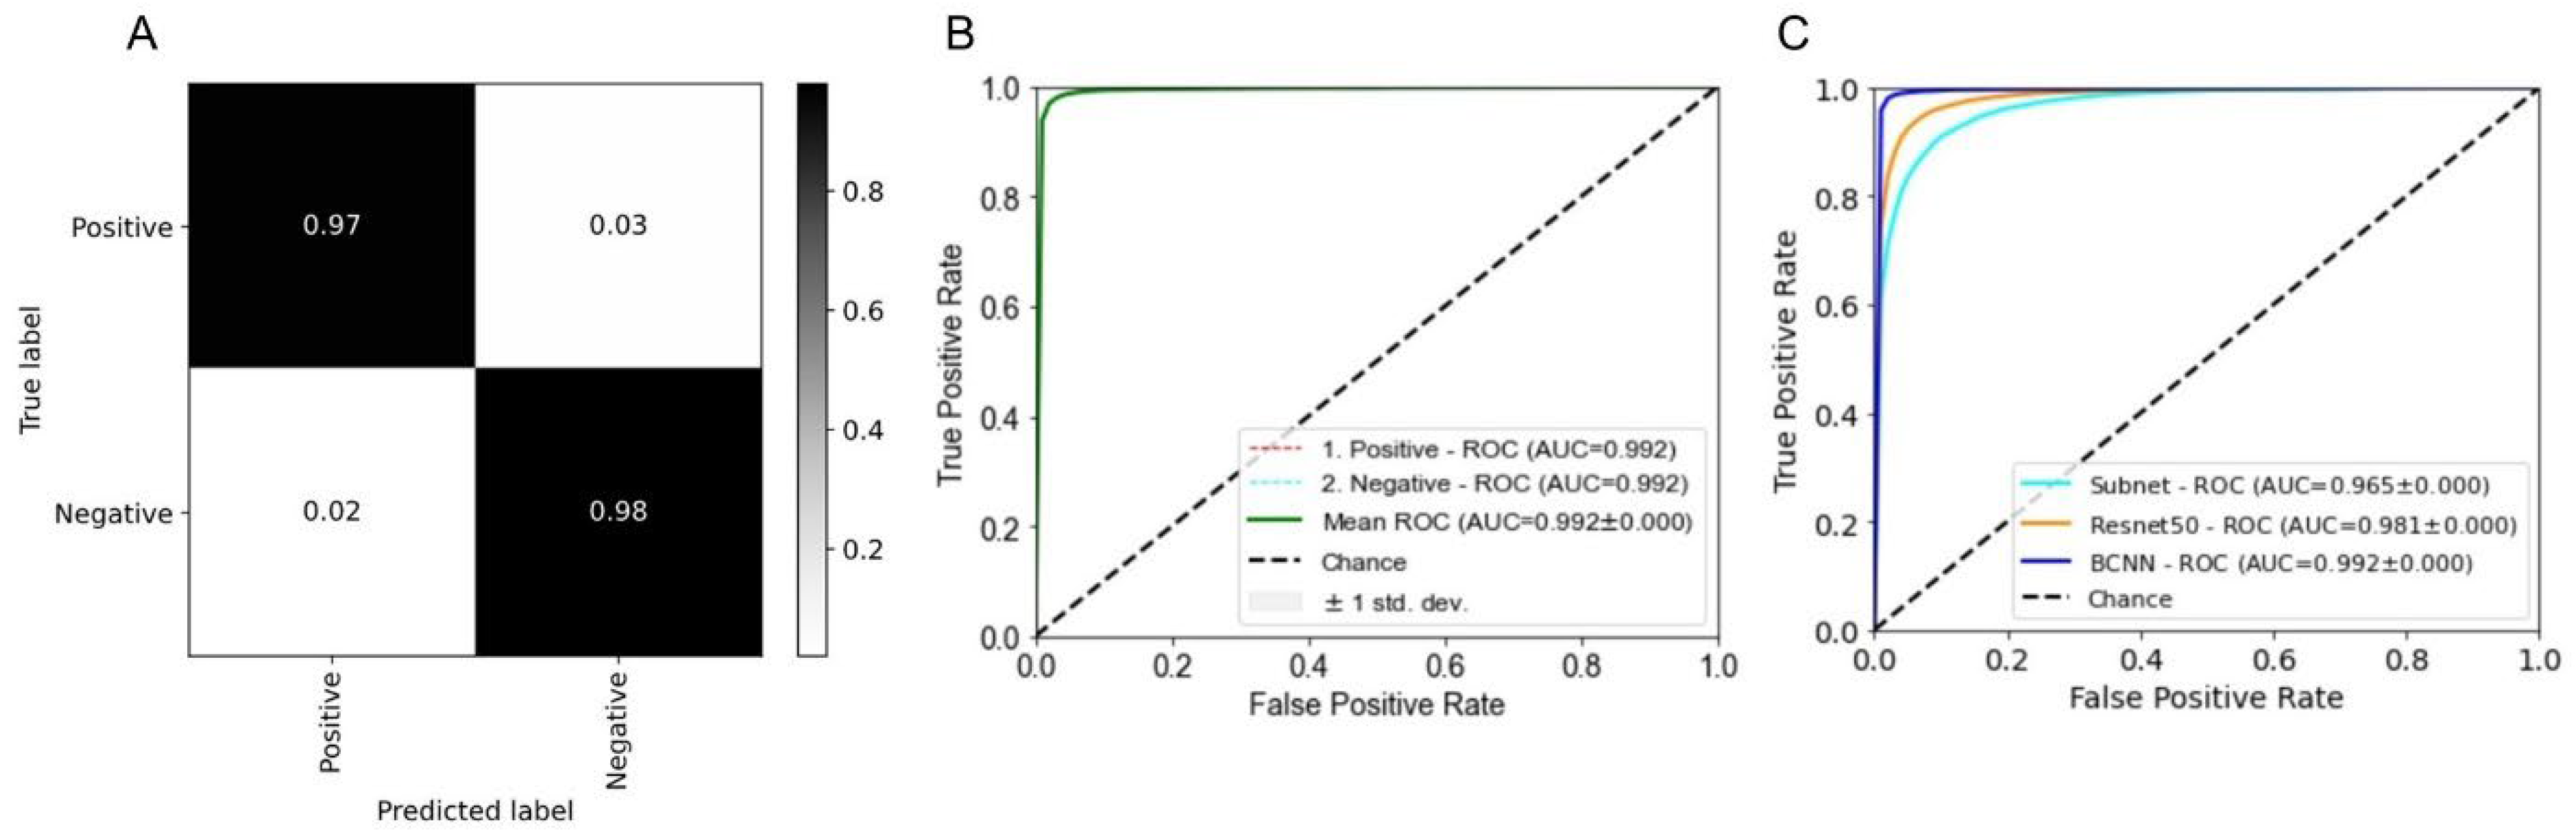
3.1. Performance Evaluation
3.2. Visualization
3.3. Statistical Analysis
3.4. Fusion of Bimodal Histological Images
4. Discussion
5. Conclusions
Author Contributions
Funding
Institutional Review Board Statement
Informed Consent Statement
Data Availability Statement
Acknowledgments
Conflicts of Interest
References
- Bao, G.; Wang, X.; Xu, R.; Loh, C.; Adeyinka, O.D.; Pieris, D.A.; Cherepanoff, S.; Gracie, G.; Lee, M.; McDonald, K.L.; et al. PathoFusion: An Open-Source AI Framework for Recognition of Pathomorphological Features and Mapping of Immunohistochemical Data. Cancers 2021, 13, 617. [Google Scholar] [CrossRef] [PubMed]
- Jothi, J.A.A.; Rajam, V.M.A. A survey on automated cancer diagnosis from histopathology images. Artif. Intell. Rev. 2017, 48, 31–81. [Google Scholar] [CrossRef]
- Malon, C.; Brachtel, E.; Cosatto, E.; Graf, H.P.; Kurata, A.; Kuroda, M.; Meyer, J.S.; Saito, A.; Wu, S.; Yagi, Y. Mitotic Figure Recognition: Agreement among Pathologists and Computerized Detector. Anal. Cell. Pathol. 2012, 35, 385271. [Google Scholar] [CrossRef]
- Zerhouni, E.; Lanyi, D.; Viana, M.P.; Gabrani, M. Wide residual networks for mitosis detection. In Proceedings of the 2017 IEEE 14th International Symposium on Biomedical Imaging (ISBI 2017), Melbourne, VIC, Australia, 18–21 April 2017; pp. 924–928. [Google Scholar]
- Li, C.; Wang, X.; Liu, W.; Latecki, L.J.; Wang, B.; Huang, J. Weakly supervised mitosis detection in breast histopathology images using concentric loss. Med. Image Anal. 2019, 53, 165–178. [Google Scholar] [CrossRef]
- Sheikh, T.S.; Lee, Y.; Cho, M. Histopathological Classification of Breast Cancer Images Using a Multi-Scale Input and Multi-Feature Network. Cancers 2020, 12, 2031. [Google Scholar] [CrossRef]
- Liu, S.; Liang, J.; Liu, Z.; Zhang, C.; Wang, Y.; Watson, A.H.; Zhou, C.; Zhang, F.; Wu, K.; Zhang, F.; et al. The Role of CD276 in Cancers. Front. Oncol. 2021, 11, 654684. [Google Scholar] [CrossRef]
- Zhang, J.; Wang, J.; Marzese, D.M.; Wang, X.; Yang, Z.; Li, C.; Zhang, H.; Zhang, J.; Chen, C.C.; Kelly, D.F.; et al. B7H3 regulates differentiation and serves as a potential biomarker and theranostic target for human glioblastoma. Lab. Investig. 2019, 99, 1117–1129. [Google Scholar] [CrossRef]
- Lemke, D.; Pfenning, P.-N.; Sahm, F.; Klein, A.-C.; Kempf, T.; Warnken, U.; Schnölzer, M.; Tudoran, R.; Weller, M.; Platten, M.; et al. Costimulatory protein 4IgB7H3 drives the malignant phenotype of glioblastoma by mediating immune escape and invasiveness. Clin. Cancer Res. 2012, 18, 105–117. [Google Scholar] [CrossRef] [Green Version]
- Wang, C.; Li, Y.; Jia, L.; Kim, J.K.; Li, J.; Deng, P.; Zhang, W.; Krebsbach, P.H.; Wang, C.-Y. CD276 expression enables squamous cell carcinoma stem cells to evade immune surveillance. Cell Stem Cell 2021, 28, 1597–1613. [Google Scholar] [CrossRef]
- Bao, G.; Graeber, M.B.; Wang, X. A Bifocal Classification and Fusion Network for Multimodal Image Analysis in Histopathology. In Proceedings of the 2020 16th International Conference on Control, Automation, Robotics and Vision (ICARCV), Shenzhen, China, 13–15 December 2020; pp. 466–471. [Google Scholar]
- Sezgin, M.; Sankur, B. Survey over image thresholding techniques and quantitative performance evaluation. J. Electron. Imaging 2004, 13, 146–165. [Google Scholar]
- Pajares, G.; De La Cruz, J.M. A wavelet-based image fusion tutorial. Pattern Recognit. 2004, 37, 1855–1872. [Google Scholar] [CrossRef]
- He, K.; Zhang, X.; Ren, S.; Sun, J. Deep Residual Learning for Image Recognition. In Proceedings of the IEEE Conference on Computer Vision and Pattern Recognition, Las Vegas, NV, USA, 27–30 June 2016; pp. 770–778. [Google Scholar]
- Brady, M.; Yuille, A. An extremum principle for shape from contour. In IEEE Transactions on Pattern Analysis and Machine Intelligence; IEEE: Manhattan, NY, USA, 1984; pp. 288–301. [Google Scholar]
- Dubrofsky, E. Homography Estimation. Master’s Thesis, Univerzita Britské Kolumbie, Vancouver, BC, Canada, 2009. [Google Scholar]
- Veta, M.; Pluim, J.P.; van Diest, P.J.; Viergever, M.A. Breast cancer histopathology image analysis: A review. IEEE Trans. Biomed. Eng. 2014, 61, 1400–1411. [Google Scholar] [CrossRef]
- Wang, P.; Hu, X.; Li, Y.; Liu, Q.; Zhu, X. Automatic cell nuclei segmentation and classification of breast cancer histopathology images. Signal Process. 2016, 122, 1–13. [Google Scholar] [CrossRef]
- Manivannan, S.; Li, W.; Akbar, S.; Wang, R.; Zhang, J.; McKenna, S.J. An automated pattern recognition system for classifying indirect immunofluorescence images of HEp-2 cells and specimens. Pattern Recogn. 2016, 51, 12–26. [Google Scholar] [CrossRef] [Green Version]
- Peikari, M.; Martel, A.L. Automatic Cell Detection and Segmentation from H and E Stained Pathology Slides Using Colorspace Decorrelation Stretching. In Proceedings of the Medical Imaging 2016: Digital Pathology, San Diego, CA, USA, 23 March 2016; pp. 292–297. [Google Scholar]
- Kowal, M.; Filipczuk, P.; Obuchowicz, A.; Korbicz, J.; Monczak, R. Computer-aided diagnosis of breast cancer based on fine needle biopsy microscopic images. Comput. Biol. Med. 2013, 43, 1563–1572. [Google Scholar] [CrossRef]
- Awan, R.; Aloraidi, N.A.; Qidwai, U.A.; Rajpoot, N.M. How Divided Is a Cell? Eigenphase Nuclei for Classification of Mitotic Phase in Cancer Histology Images. In Proceedings of the 2016 IEEE-EMBS International Conference on Biomedical and Health Informatics (BHI), Las Vegas, NV, USA, 24–27 February 2016; pp. 70–73. [Google Scholar]
- Daskalakis, A.; Kostopoulos, S.; Spyridonos, P.; Glotsos, D.; Ravazoula, P.; Kardari, M.; Kalatzis, I.; Cavouras, D.; Nikiforidis, G. Design of a multi-classifier system for discriminating benign from malignant thyroid nodules using routinely H&E-stained cytological images. Comput. Biol. Med. 2008, 38, 196–203. [Google Scholar]
- Kruk, M.; Kurek, J.; Osowski, S.; Koktysz, R.; Swiderski, B.; Markiewicz, T. Ensemble of classifiers and wavelet transformation for improved recognition of Fuhrman grading in clear-cell renal carcinoma. Biocybern. Biomed. Eng. 2017, 37, 357–364. [Google Scholar] [CrossRef]
- Wang, D.; Liu, C.; Wang, X.; Liu, X.; Lan, C.; Zhao, P.; Cho, W.C.; Graeber, M.B.; Liu, Y. Automated Machine-Learning Framework Integrating Histopathological and Radiological Information for Predicting IDH1 Mutation Status in Glioma. Front. Bioinform. 2021, 1, 52. [Google Scholar] [CrossRef]
- Gu, J.; Wang, Z.; Kuen, J.; Ma, L.; Shahroudy, A.; Shuai, B.; Liu, T.; Wang, X.; Wang, G. Recent advances in convolutional neural networks. arXiv 2015, arXiv:1512.07108. [Google Scholar] [CrossRef] [Green Version]
- Bejnordi, B.E.; Zuidhof, G.; Balkenhol, M.; Hermsen, M.; Bult, P.; van Ginneken, B.; Karssemeijer, N.; Litjens, G.; van der Laak, J. Context-aware stacked convolutional neural networks for classification of breast carcinomas in whole-slide histopathology images. J. Med. Imaging 2017, 4, 044504. [Google Scholar] [CrossRef]
- Wang, S.; Wang, T.; Yang, L.; Yang, D.M.; Fujimoto, J.; Yi, F.; Luo, X.; Yang, Y.; Yao, B.; Lin, S. ConvPath: A software tool for lung adenocarcinoma digital pathological image analysis aided by a convolutional neural network. eBioMedicine 2019, 50, 103–110. [Google Scholar] [CrossRef] [Green Version]
- Failmezger, H.; Muralidhar, S.; Rullan, A.; de Andrea, C.E.; Sahai, E.; Yuan, Y. Topological tumor graphs: A graph-based spatial model to infer stromal recruitment for immunosuppression in melanoma histology. Cancer Res. 2020, 80, 1199–1209. [Google Scholar] [CrossRef] [Green Version]
- Mousavi, H.S.; Monga, V.; Rao, G.; Rao, A.U. Automated discrimination of lower and higher grade gliomas based on histopathological image analysis. J. Pathol. Inform. 2015, 6, 15. [Google Scholar] [CrossRef]
- Hatipoglu, N.; Bilgin, G. Cell segmentation in histopathological images with deep learning algorithms by utilizing spatial relationships. Med. Biol. Eng. Comput. 2017, 55, 1829–1848. [Google Scholar] [CrossRef]
- Chandradevan, R.; Aljudi, A.A.; Drumheller, B.R.; Kunananthaseelan, N.; Amgad, M.; Gutman, D.A.; Cooper, L.A.; Jaye, D.L. Machine-based detection and classification for bone marrow aspirate differential counts: Initial development focusing on nonneoplastic cells. Lab. Investig. 2020, 100, 98–109. [Google Scholar] [CrossRef]
- Seaman, S.; Zhu, Z.; Saha, S.; Zhang, X.M.; Yang, M.Y.; Hilton, M.B.; Morris, K.; Szot, C.; Morris, H.; Swing, D.A.; et al. Eradication of Tumors through Simultaneous Ablation of CD276/B7-H3-Positive Tumor Cells and Tumor Vasculature. Cancer Cell 2017, 31, 501–515. [Google Scholar] [CrossRef] [Green Version]
- Johnston, M.J.; Nikolic, A.; Ninkovic, N.; Guilhamon, P.; Cavalli, F.M.G.; Seaman, S.; Zemp, F.J.; Lee, J.; Abdelkareem, A.; Ellestad, K.; et al. High-resolution structural genomics reveals new therapeutic vulnerabilities in glioblastoma. Genome Res. 2019, 29, 1211–1222. [Google Scholar] [CrossRef] [Green Version]
- Sun, F.; Yu, X.; Ju, R.; Wang, Z.; Wang, Y. Antitumor responses in gastric cancer by targeting B7H3 via chimeric antigen receptor T cells. Cancer Cell Int. 2022, 22, 50. [Google Scholar] [CrossRef]
- Mao, Y.; Chen, L.; Wang, F.; Zhu, D.; Ge, X.; Hua, D.; Sun, J. Cancer cell-expressed B7-H3 regulates the differentiation of tumor-associated macrophages in human colorectal carcinoma. Oncol. Lett. 2017, 14, 6177–6183. [Google Scholar] [CrossRef] [Green Version]
- Digregorio, M.; Coppieters, N.; Lombard, A.; Lumapat, P.N.; Scholtes, F.; Rogister, B. The expression of B7-H3 isoforms in newly diagnosed glioblastoma and recurrence and their functional role. Acta Neuropathol. Commun. 2021, 9, 59. [Google Scholar] [CrossRef]


| Model | Accuracy | Precision | Recall | F1-Score |
|---|---|---|---|---|
| BCNN | 97.7% | 97.7% | 97.7% | 97.7% |
| Subnet (BCNN) | 90.0% | 90.0% | 90.0% | 89.8% |
| Resnet−50 | 94.0% | 94.0% | 94.0% | 94.0% |
| Heading | Feature | Value Range |
|---|---|---|
| Number of detected “halo cells” | 100–15,000 cells | |
| Density of “halo cells” | 0.0003–0.045 cells/mm2 | |
| Cell-level features | Cell area | 7000–11,000 pixels |
| Cell perimeter | 450–800 pixels | |
| “Halo cell” pixel intensity | 0.026–0.070 | |
| Compactness | 2.5–4.5 |
| Morphological Features | Number of Halo Cells | Density—Number of Halo Cells/mm2 |
|---|---|---|
| Normal blood vessels | 481 | 0.051 |
| Normal brain tissue | 554 | 0.036 |
| Geographic necrosis | 2247 | 0.047 |
| Viable tumour tissue | 7045 | 0.034 |
| Palisading necrosis | 248 | 0.031 |
| Microvascular proliferation | 1636 | 0.036 |
Publisher’s Note: MDPI stays neutral with regard to jurisdictional claims in published maps and institutional affiliations. |
© 2022 by the authors. Licensee MDPI, Basel, Switzerland. This article is an open access article distributed under the terms and conditions of the Creative Commons Attribution (CC BY) license (https://creativecommons.org/licenses/by/4.0/).
Share and Cite
Alzoubi, I.; Bao, G.; Zhang, R.; Loh, C.; Zheng, Y.; Cherepanoff, S.; Gracie, G.; Lee, M.; Kuligowski, M.; Alexander, K.L.; et al. An Open-Source AI Framework for the Analysis of Single Cells in Whole-Slide Images with a Note on CD276 in Glioblastoma. Cancers 2022, 14, 3441. https://doi.org/10.3390/cancers14143441
Alzoubi I, Bao G, Zhang R, Loh C, Zheng Y, Cherepanoff S, Gracie G, Lee M, Kuligowski M, Alexander KL, et al. An Open-Source AI Framework for the Analysis of Single Cells in Whole-Slide Images with a Note on CD276 in Glioblastoma. Cancers. 2022; 14(14):3441. https://doi.org/10.3390/cancers14143441
Chicago/Turabian StyleAlzoubi, Islam, Guoqing Bao, Rong Zhang, Christina Loh, Yuqi Zheng, Svetlana Cherepanoff, Gary Gracie, Maggie Lee, Michael Kuligowski, Kimberley L. Alexander, and et al. 2022. "An Open-Source AI Framework for the Analysis of Single Cells in Whole-Slide Images with a Note on CD276 in Glioblastoma" Cancers 14, no. 14: 3441. https://doi.org/10.3390/cancers14143441
APA StyleAlzoubi, I., Bao, G., Zhang, R., Loh, C., Zheng, Y., Cherepanoff, S., Gracie, G., Lee, M., Kuligowski, M., Alexander, K. L., Buckland, M. E., Wang, X., & Graeber, M. B. (2022). An Open-Source AI Framework for the Analysis of Single Cells in Whole-Slide Images with a Note on CD276 in Glioblastoma. Cancers, 14(14), 3441. https://doi.org/10.3390/cancers14143441