
Estrogen Receptor β (ESR2) Transcriptome and Chromatin Binding in a Mantle Cell Lymphoma Tumor Model Reveal the Tumor-Suppressing Mechanisms of Estrogens

 , ,
, ,  and
and 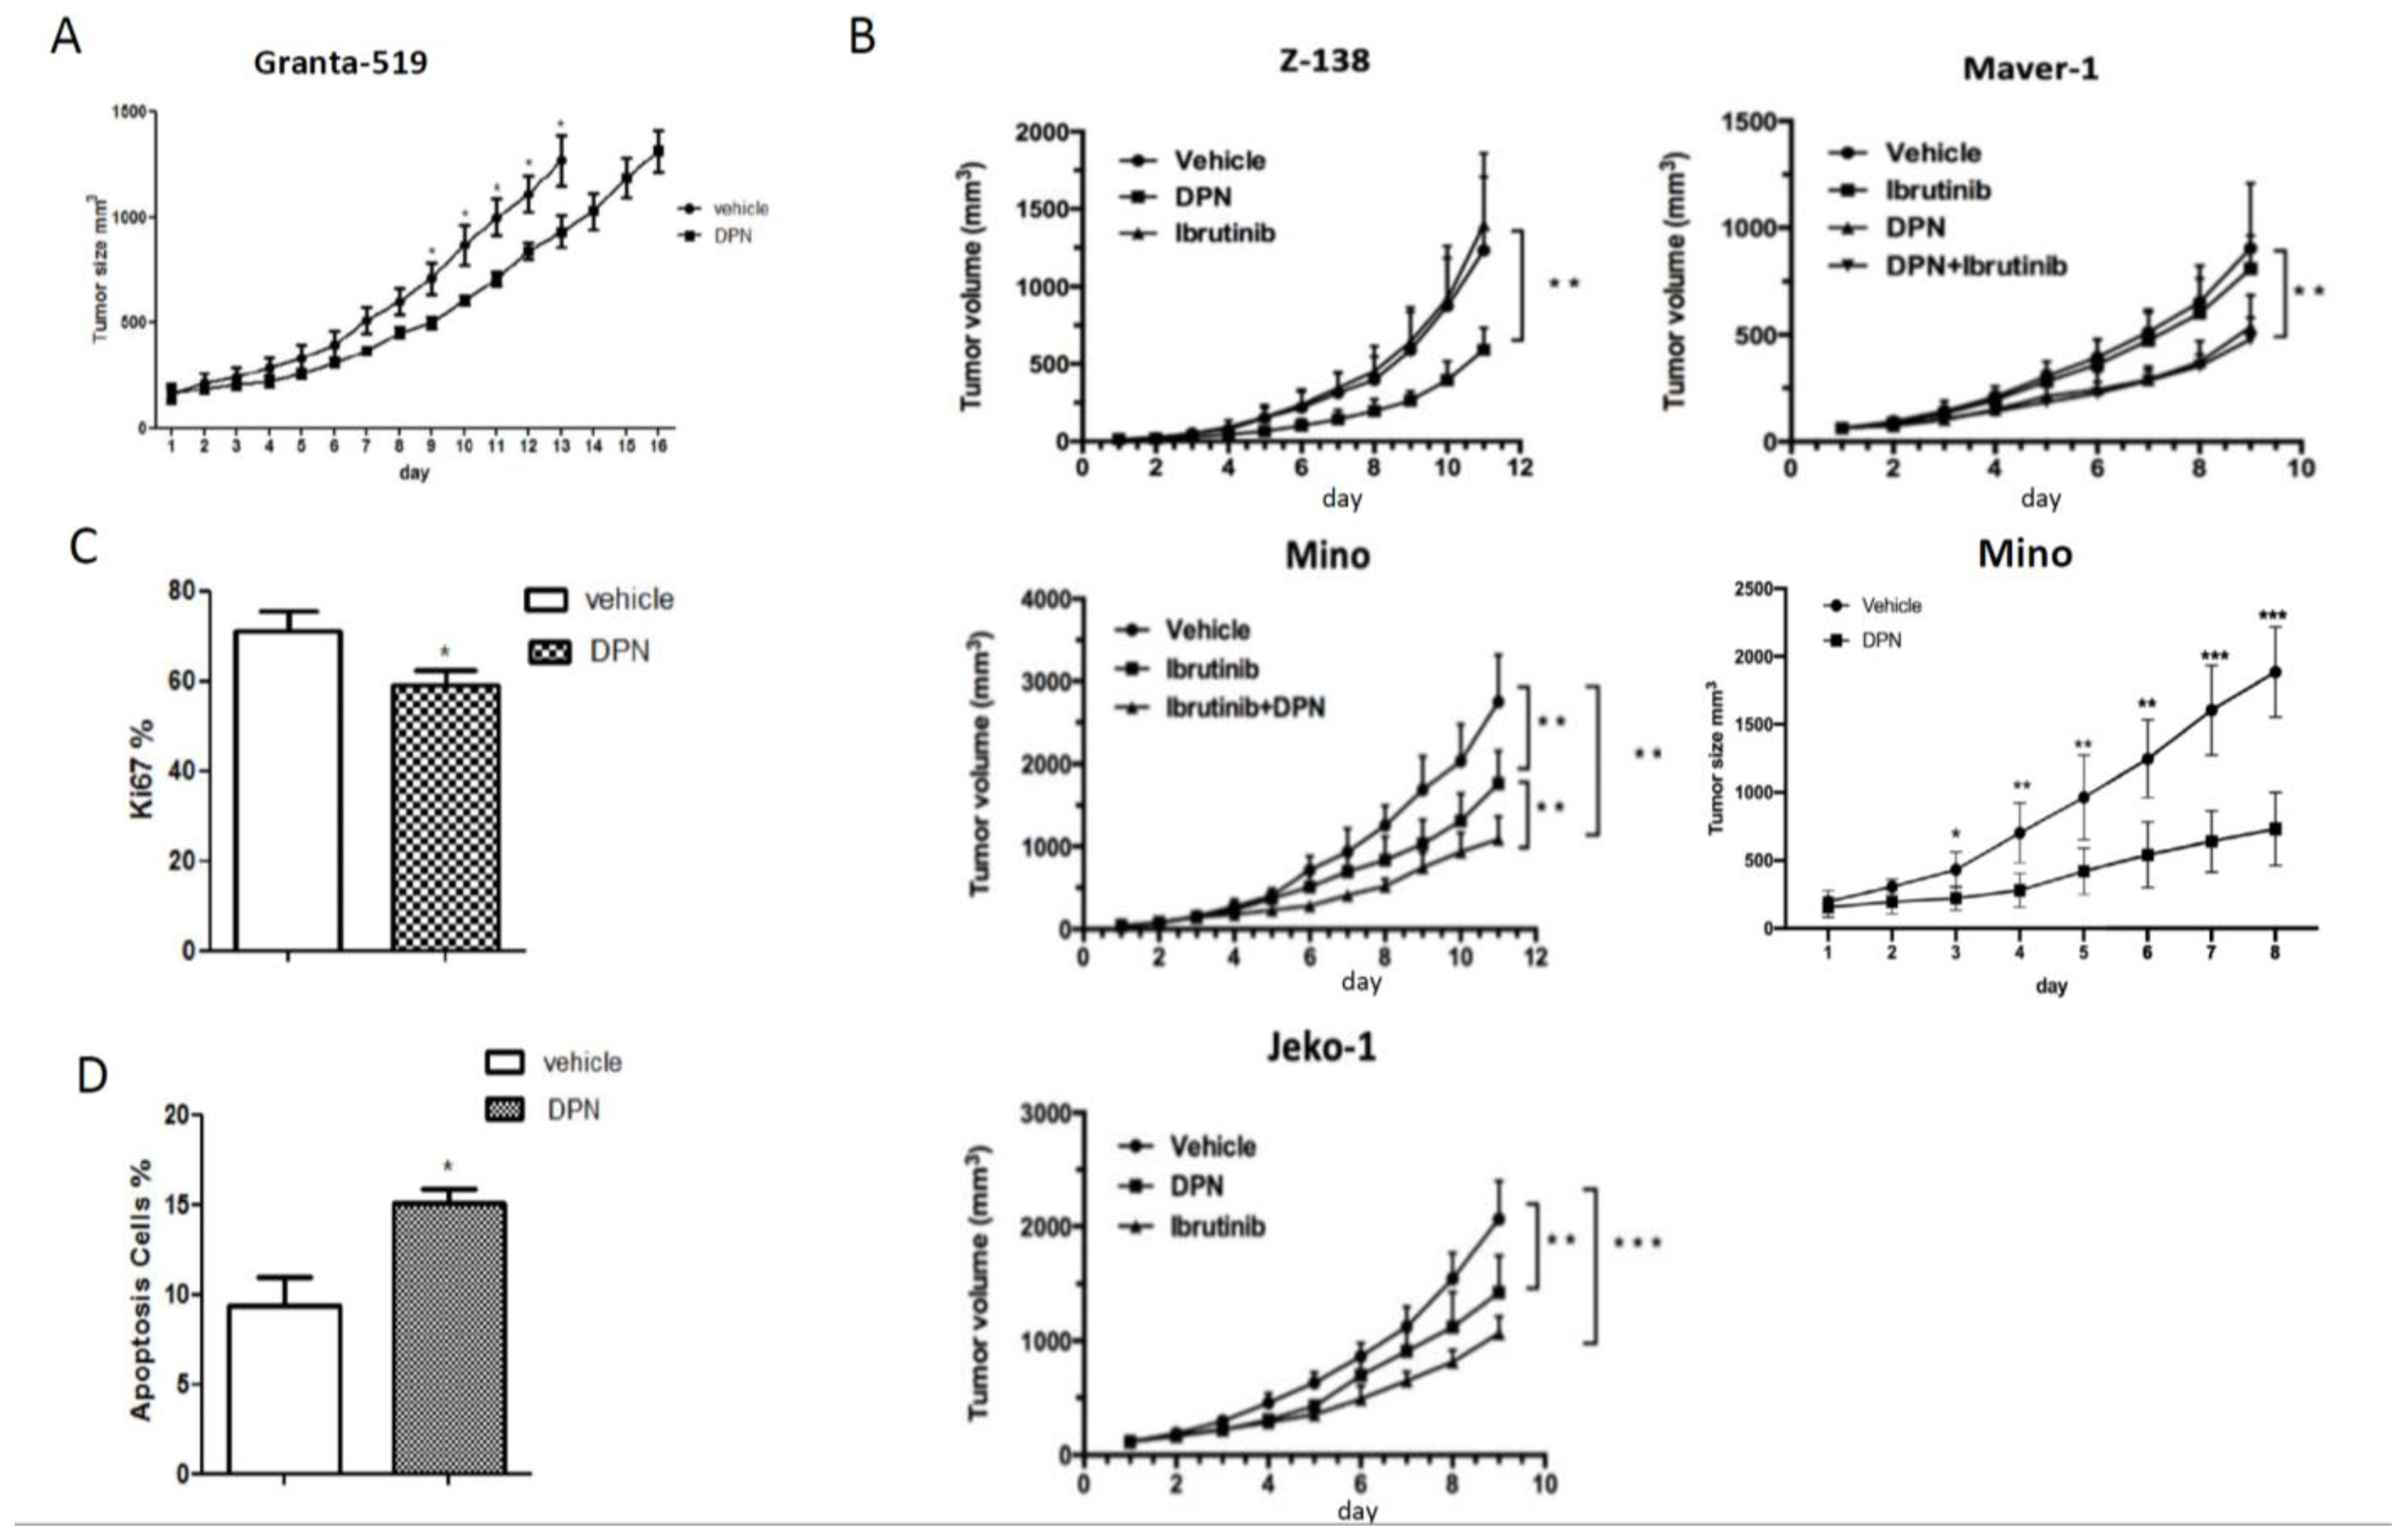
Abstract
:Simple Summary
Abstract
1. Introduction
2. Materials and Methods
2.1. Cell Lines
2.2. Mice and In Vivo Experiment
2.3. Library Preparation, RNA Sequencing, and Data Analysis
2.4. Chromatin Immunoprecipitation (ChIP) and ChIP-Seq Analysis
2.5. Statistical Tests
3. Results
3.1. The ERβ-Selective Agonist DPN Inhibits Growth In Vivo of Both Ibrutinib-Sensitive and -Resistant MCL Grafted to Mice
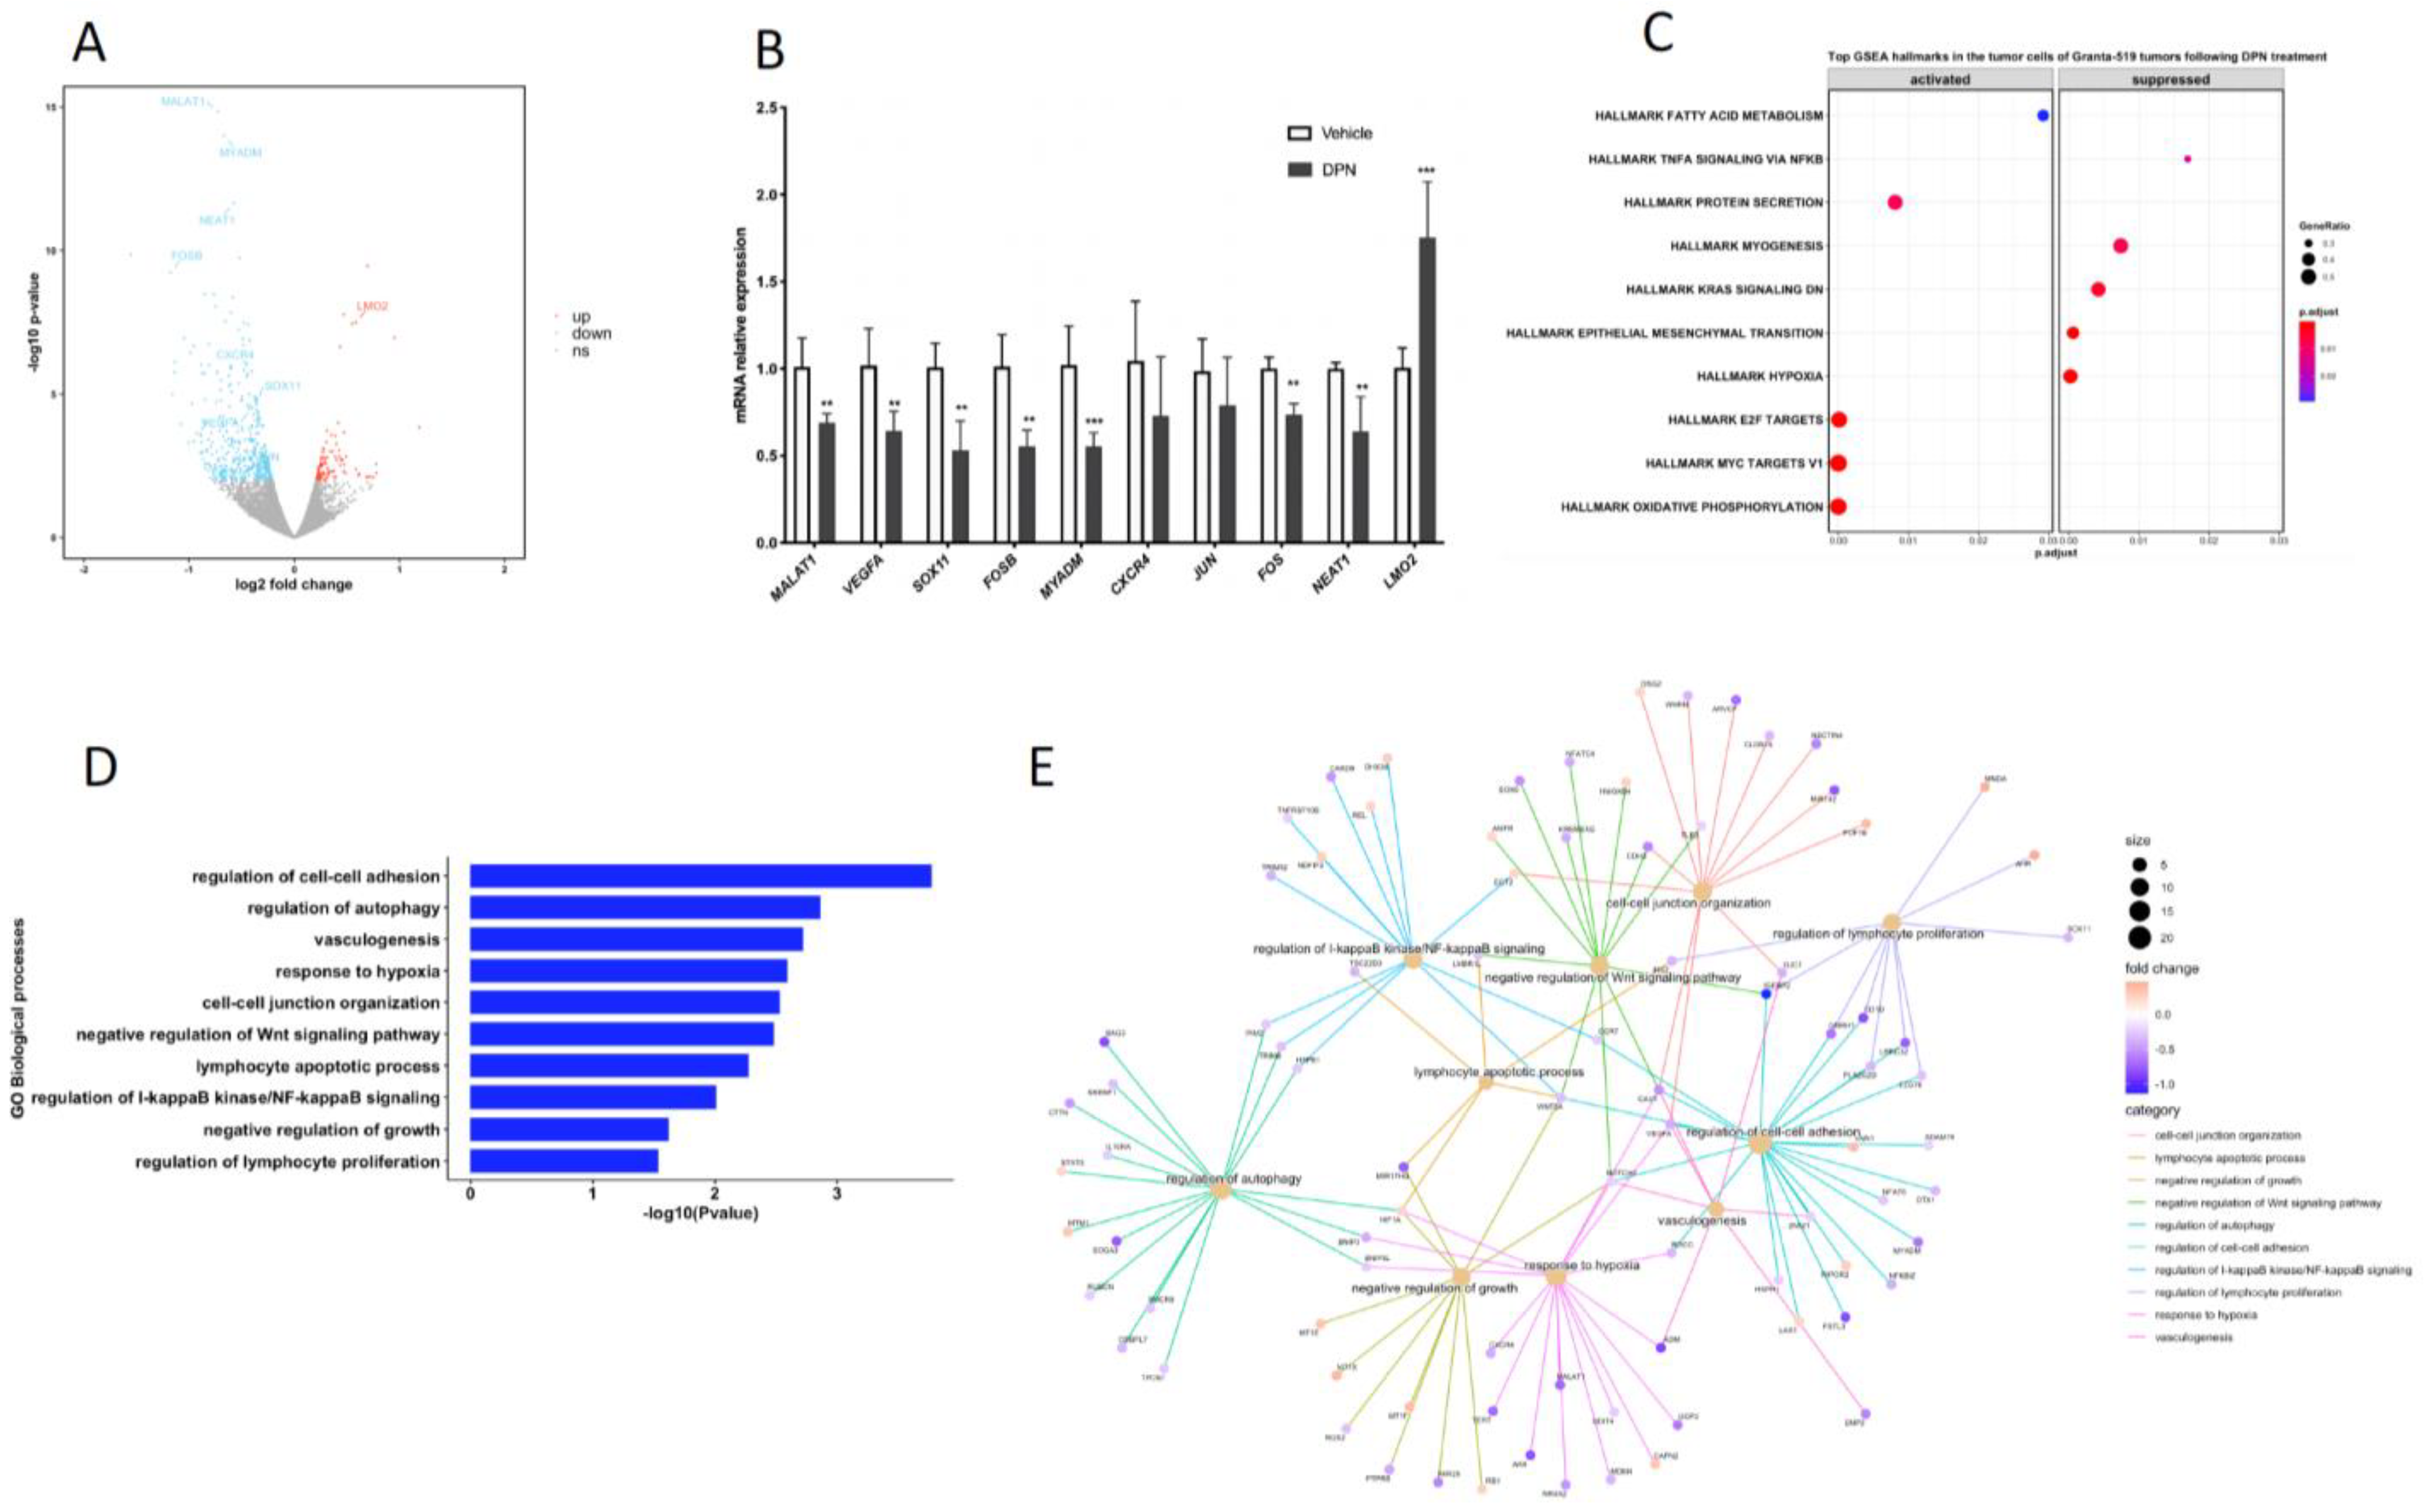
3.2. Transcriptome and Signaling Pathway Analysis of the Granta-519 MCL Tumor Cells Following DPN Treatment
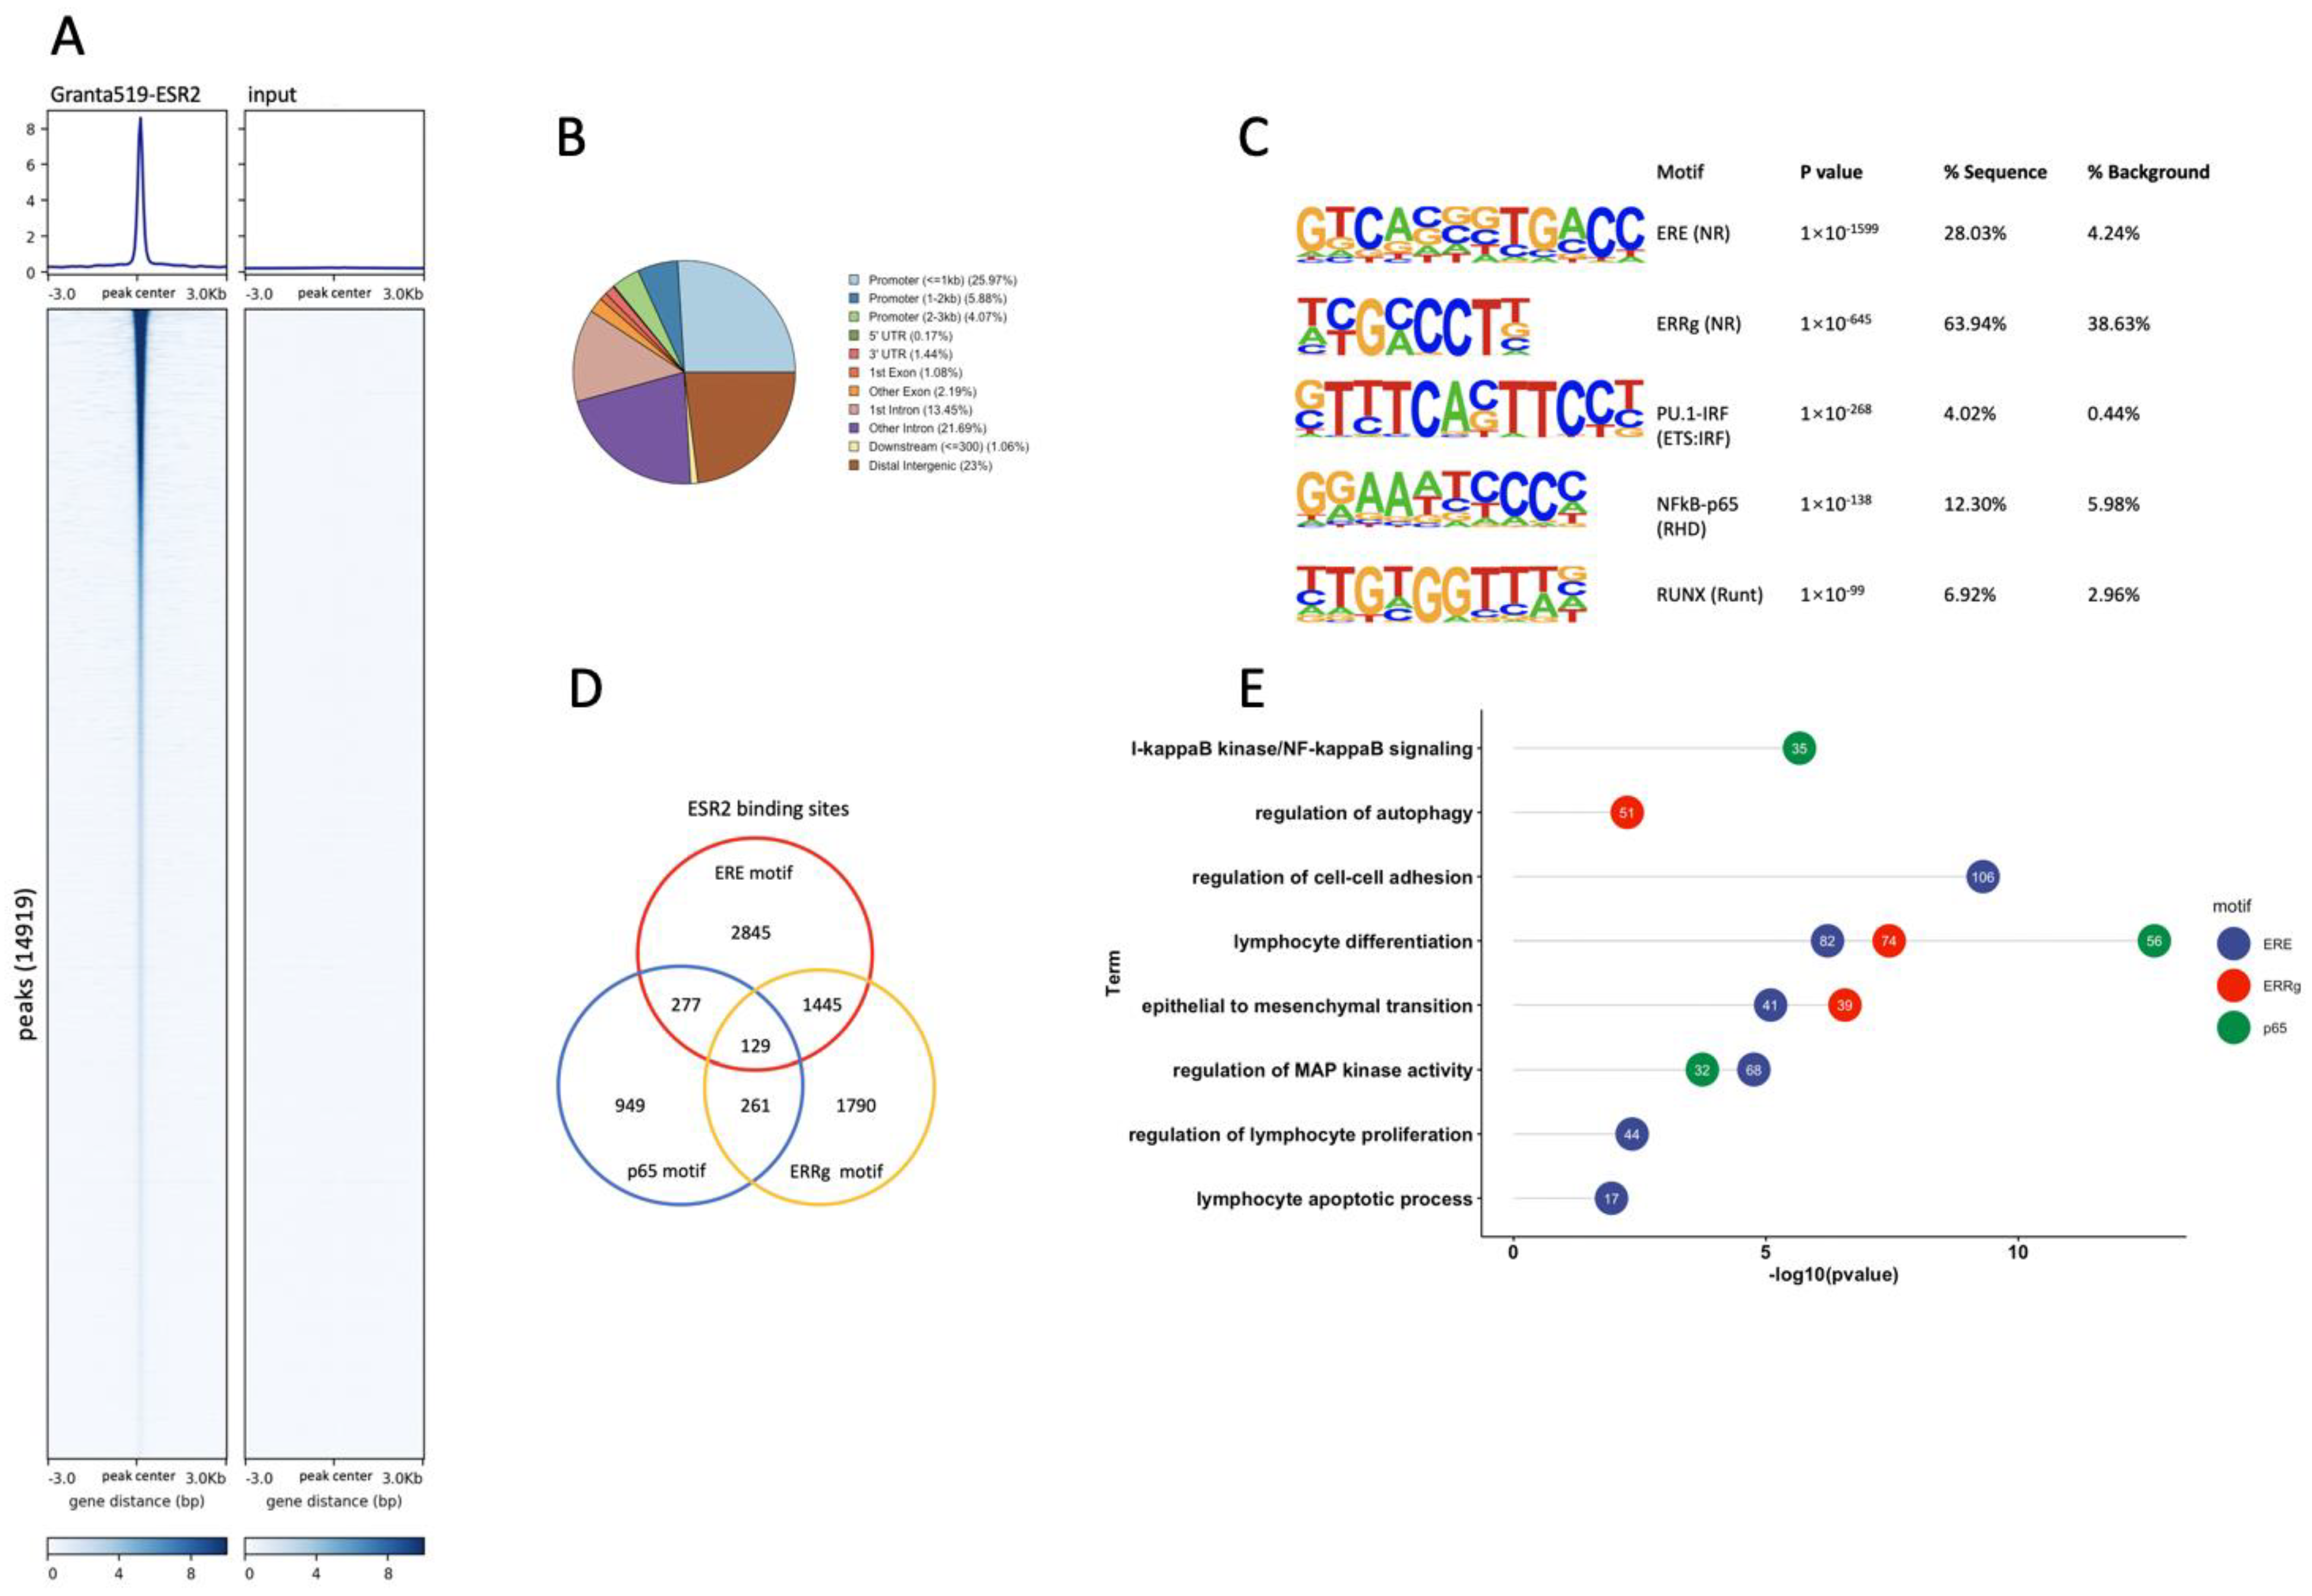
3.3. Genome-Wide Identification of ESR2 DNA-Binding Regions in the Granta-519 MCL Cells
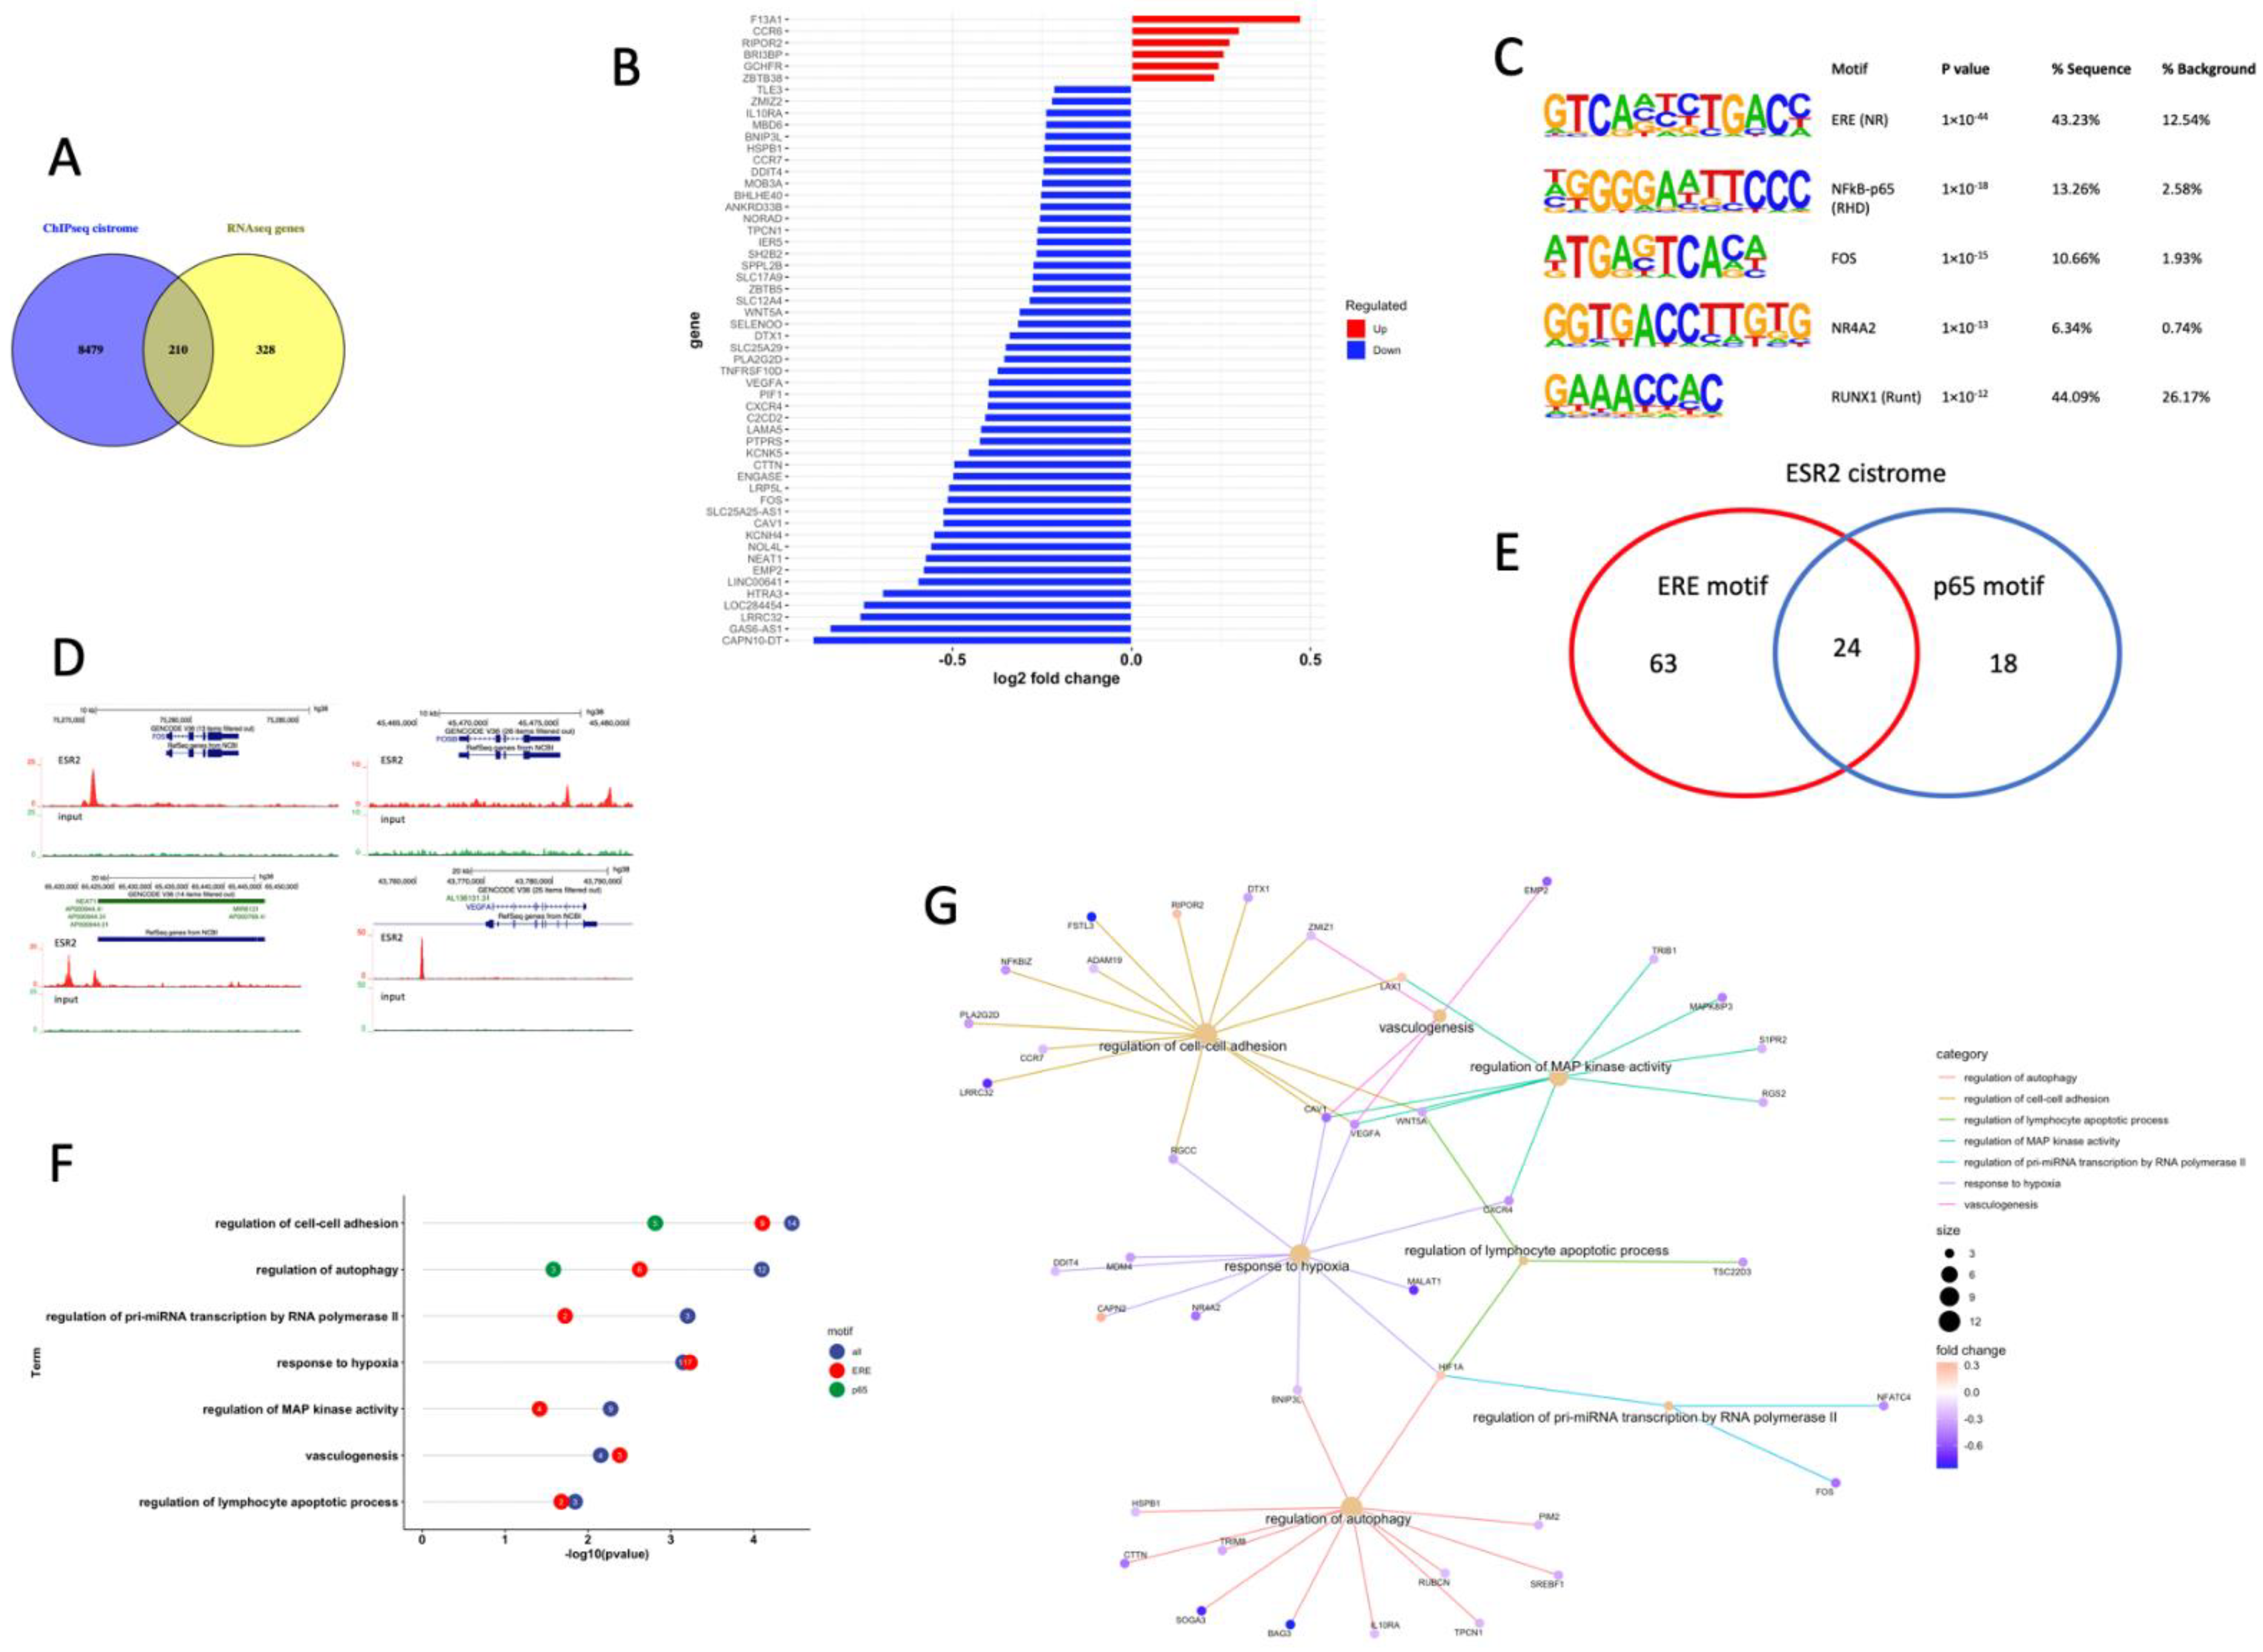
3.4. ESR2 Binding Occurs to the DPN-Regulated Genes in the Tumor Cells of the Granta-519 Tumors
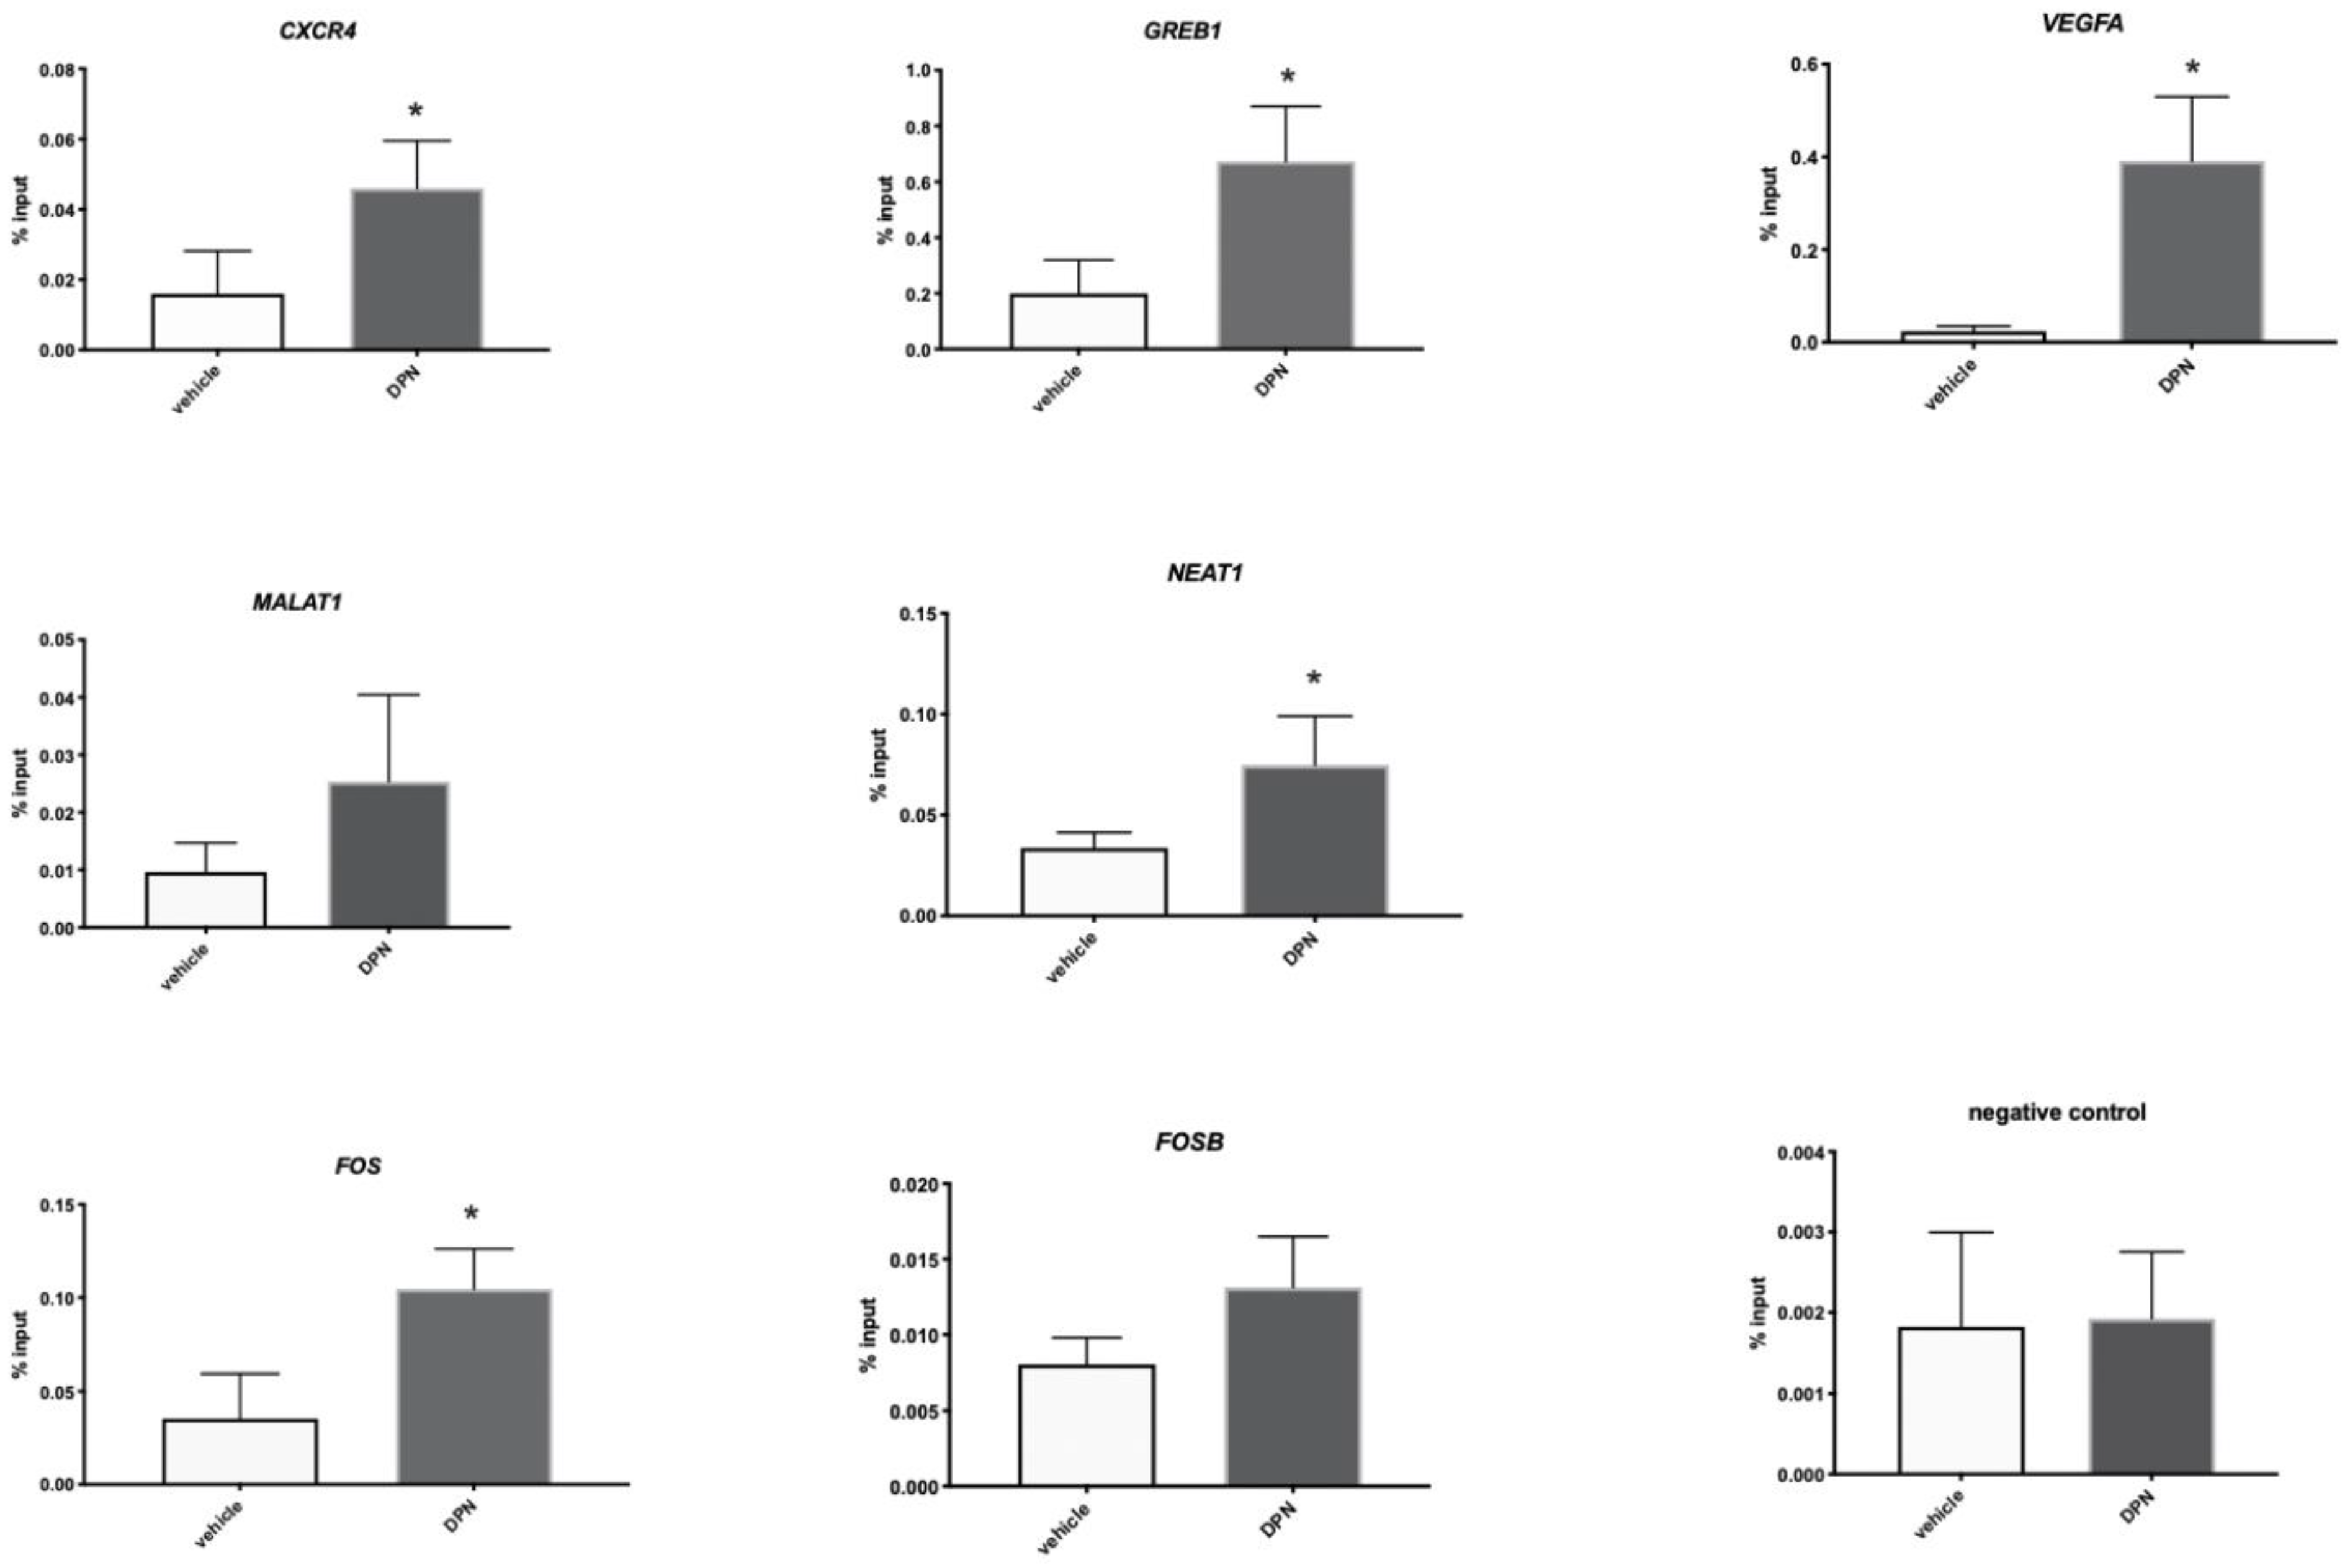
3.5. ESR2 Binding to the Regulated Genes Is Enhanced following DPN Treatment
3.6. DPN Treatment of Granta-519 Cells in Culture Does Not affect Proliferation or Apoptosis
3.7. Transcriptome and Signaling Pathway Analysis in the TME of the Granta-519 Tumors Following DPN Treatment
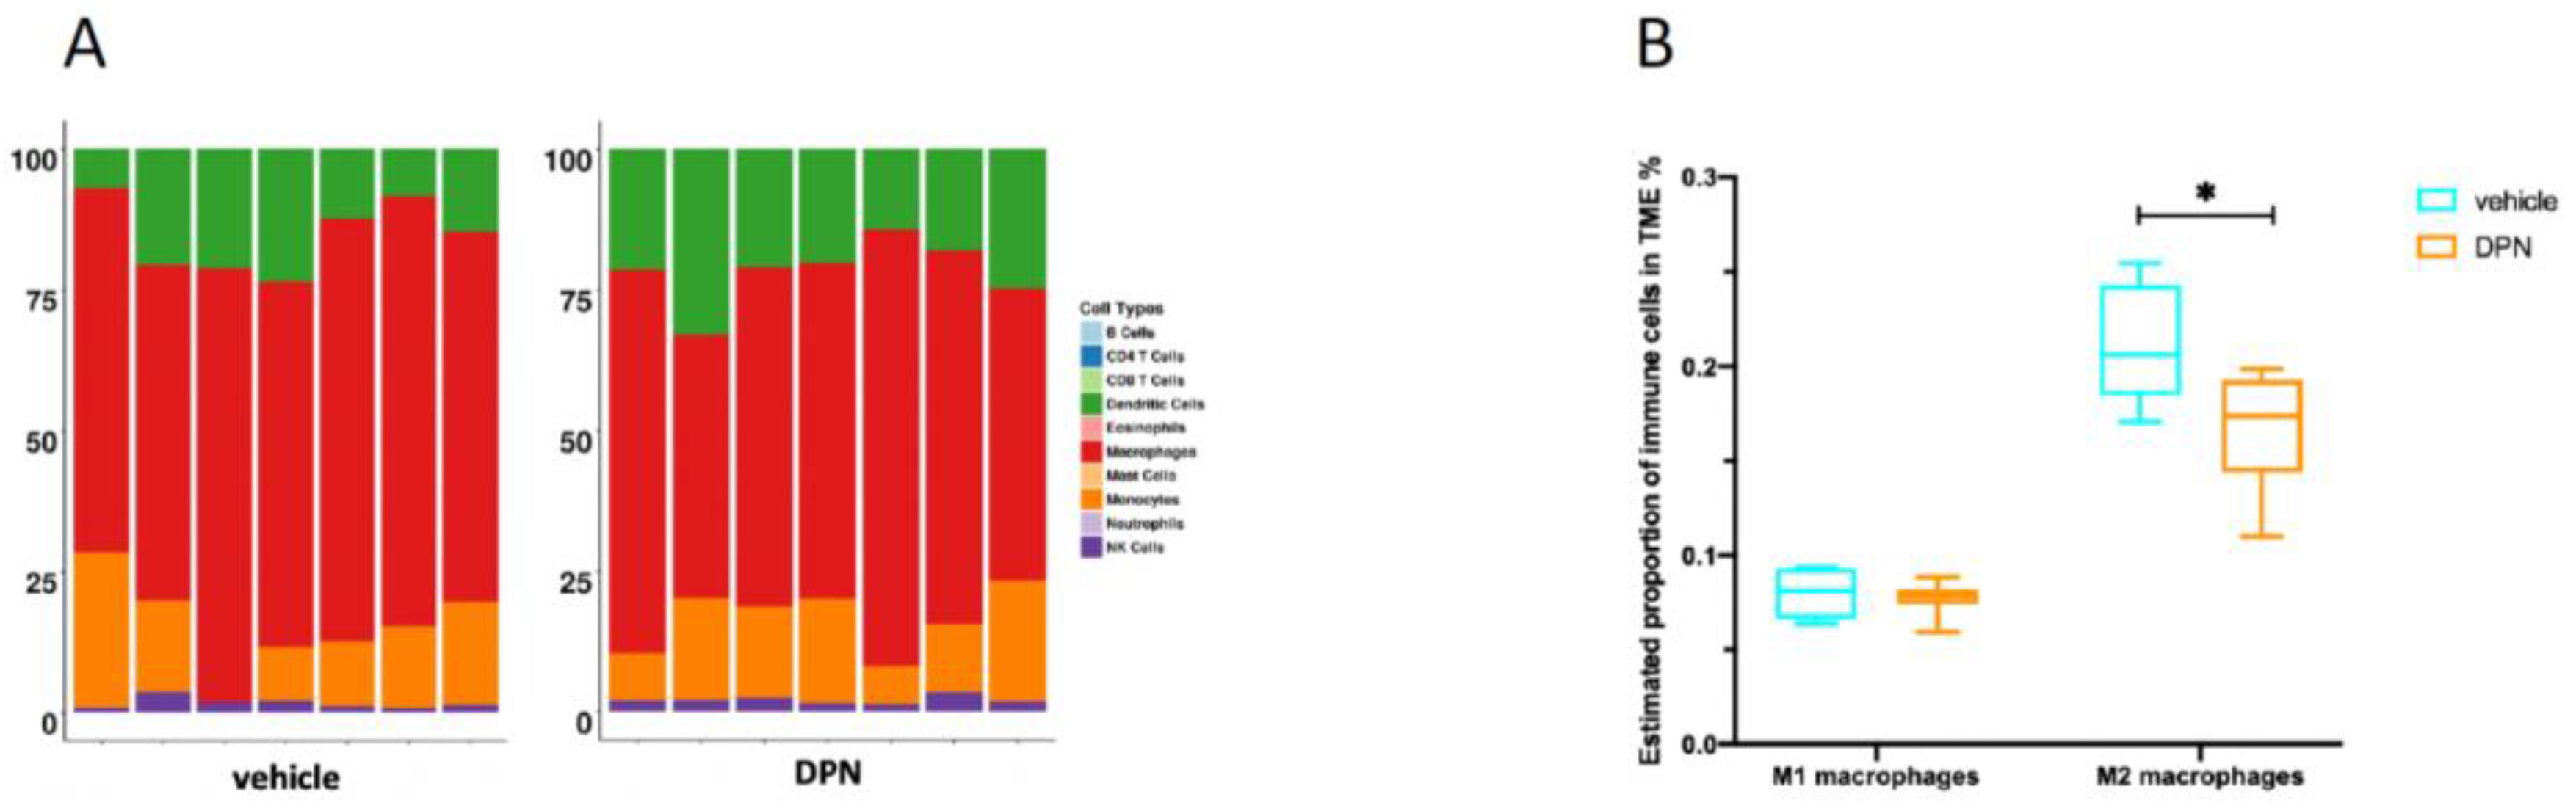
3.8. Changes in Immune Cell Composition of the TME following DPN Treatment
4. Discussion
5. Conclusions
Supplementary Materials
Author Contributions
Funding
Institutional Review Board Statement
Informed Consent Statement
Data Availability Statement
Acknowledgments
Conflicts of Interest
References
- Sapkota, S.; Shaikh, H. Non-Hodgkin Lymphoma. In StatPearls [Internet]; StatPearls Publishing: Treasure Island, FL, USA, 2022. [Google Scholar]
- Sant, M.; Allemani, C.; Tereanu, C.; De Angelis, R.; Capocaccia, R.; Visser, O.; Marcos-Gragera, R.; Maynadié, M.; Simonetti, A.; Lutz, J.M.; et al. Incidence of hematologic malignancies in Europe by morphologic subtype: Results of the HAEMACARE project. Blood 2010, 116, 3724–3734. [Google Scholar] [CrossRef] [PubMed]
- Jares, P.; Campo, E. Advances in the understanding of mantle cell lymphoma. Br. J. Haematol. 2008, 142, 149–165. [Google Scholar] [CrossRef] [PubMed] [Green Version]
- Abrahamsson, A.; Albertsson-Lindblad, A.; Brown, P.N.; Baumgartner-Wennerholm, S.; Pedersen, L.M.; D’Amore, F.; Nilsson-Ehle, H.; Jensen, P.; Pedersen, M.; Geisler, C.H.; et al. Real world data on primary treatment for mantle cell lymphoma: A Nordic Lymphoma Group observational study. Blood 2014, 124, 1288–1295. [Google Scholar] [CrossRef] [PubMed]
- Yakimchuk, K.; Revanna, C.B.; Huang, D.; Inzunza, J.; Okret, S. Suppression of lymphoma growth by the xenoestrogens bisphenol A and genistein. Endocr. Connect. 2018, 7, 1472–1479. [Google Scholar] [CrossRef] [Green Version]
- Vanura, K. Sex as decisive variable in lymphoid neoplasms—an update. ESMO Open 2021, 6, 100001. [Google Scholar] [CrossRef]
- Heldring, N.; Isaacs, G.D.; Diehl, A.G.; Sun, M.; Cheung, E.; Ranish, J.A.; Kraus, W.L. Multiple Sequence-Specific DNA-Binding Proteins Mediate Estrogen Receptor Signaling through a Tethering Pathway. Mol. Endocrinol. 2011, 25, 564–574. [Google Scholar] [CrossRef] [Green Version]
- Fuentes, N.; Silveyra, P. Estrogen receptor signaling mechanisms. Adv. Protein Chem. Struct. Biol. 2019, 116, 135–170. [Google Scholar] [CrossRef]
- Shim, G.J.; Gherman, D.; Kim, H.J.; Omoto, Y.; Iwase, H.; Bouton, D.; Kis, L.L.; Andersson, C.T.; Warner, M.; Gustafsson, J. Differential expression of oestrogen receptors in human secondary lymphoid tissues. J. Pathol. 2005, 208, 408–414. [Google Scholar] [CrossRef]
- Andersson, S.; Sundberg, M.; Pristovsek, N.; Ibrahim, A.; Jonsson, P.; Katona, B.; Clausson, C.; Zieba, A.; Ramström, M.; Söderberg, O.; et al. Insufficient antibody validation challenges oestrogen receptor beta research. Nat. Commun. 2017, 8, 15840. [Google Scholar] [CrossRef]
- Notas, G.; Kampa, M.; Castanas, E. G Protein-Coupled Estrogen Receptor in Immune Cells and Its Role in Immune-Related Diseases. Front. Endocrinol. 2020, 11, 579420. [Google Scholar] [CrossRef]
- Rudelius, M.; Rauert-Wunderlich, H.; Hartmann, E.; Hoster, E.; Dreyling, M.; Klapper, W.; Ott, G.; Rosenwald, A. The G protein-coupled estrogen receptor 1 (GPER-1) contributes to the proliferation and survival of mantle cell lymphoma cells. Haematologica 2015, 100, e458–e461. [Google Scholar] [CrossRef] [PubMed] [Green Version]
- Said, S.A.; Isedowo, R.; Guerin, C.; Nar, N.N.; Lillie, L.; Bukovac, S.; Simone, J.J.; Green, M.R.; McCormick, C.M.; Stuart, J.A. Effects of long-term dietary administration of estrogen receptor-beta agonist diarylpropionitrile on ovariectomized female ICR (CD-1) mice. GeroScience 2018, 40, 393–403. [Google Scholar] [CrossRef] [PubMed]
- Petrie, W.K.; Dennis, M.K.; Hu, C.; Dai, D.; Arterburn, J.B.; Smith, H.O.; Hathaway, H.J.; Prossnitz, E.R. G Protein-Coupled Estrogen Receptor-Selective Ligands Modulate Endometrial Tumor Growth. Obstet. Gynecol. Int. 2013, 2013, 472720. [Google Scholar] [CrossRef] [PubMed] [Green Version]
- Yakimchuk, K.; Jondal, M.; Okret, S. Estrogen receptor alpha and beta in the normal immune system and in lymphoid malignancies. Mol. Cell. Endocrinol. 2013, 375, 121–129. [Google Scholar] [CrossRef] [PubMed]
- Yakimchuk, K.; Hasni, M.S.; Guan, J.; Chao, M.P.; Sander, B.; Okret, S. Inhibition of lymphoma vascularization and dissemination by estrogen receptor beta agonists. Blood 2014, 123, 2054–2061. [Google Scholar] [CrossRef] [PubMed] [Green Version]
- Guan, J.; Huang, D.; Yakimchuk, K.; Okret, S. p110α Inhibition Overcomes Stromal Cell–Mediated Ibrutinib Resistance in Mantle Cell Lymphoma. Mol. Cancer Ther. 2018, 17, 1090–1100. [Google Scholar] [CrossRef] [Green Version]
- Indukuri, R.; Jafferali, M.H.; Song, D.; Damdimopoulos, A.; Hases, L.; Zhao, C.; Archer, A.; Williams, C. Genome-wide estrogen receptor beta chromatin binding in human colon cancer cells reveals its tumor suppressor activity. Int. J. Cancer 2021, 149, 692–706. [Google Scholar] [CrossRef]
- Rahal, R.; Frick, M.; Romero, R.; Korn, J.M.; Kridel, R.; Chan, F.C.; Meissner, B.; Bhang, H.; Ruddy, D.; Kauffmann, A.; et al. Pharmacological and genomic profiling identifies NF-kappaB-targeted treatment strategies for mantle cell lymphoma. Nat. Med. 2014, 20, 87–92. [Google Scholar] [CrossRef]
- Chen, Z.; Quan, L.; Huang, A.; Zhao, Q.; Yuan, Y.; Yuan, X.; Shen, Q.; Shang, J.; Ben, Y.; Qin, F.X.; et al. seq-ImmuCC: Cell-Centric View of Tissue Transcriptome Measuring Cellular Compositions of Immune Microenvironment From Mouse RNA-Seq Data. Front. Immunol. 2018, 9, 1286. [Google Scholar] [CrossRef]
- Newman, A.M.; Liu, C.L.; Green, M.R.; Gentles, A.J.; Feng, W.; Xu, Y.; Hoang, C.D.; Diehn, M.; Alizadeh, A.A. Robust enumeration of cell subsets from tissue expression profiles. Nat. Methods 2015, 12, 453–457. [Google Scholar] [CrossRef] [Green Version]
- Hoster, E.; Rosenwald, A.; Berger, F.; Bernd, H.W.; Hartmann, S.; Loddenkemper, C.; Barth, T.F.; Brousse, N.; Pileri, S.; Rymkiewicz, G.; et al. Prognostic Value of Ki-67 Index, Cytology, and Growth Pattern in Mantle-Cell Lymphoma: Results from Randomized Trials of the European Mantle Cell Lymphoma Network. J. Clin. Oncol. 2016, 34, 1386–1394. [Google Scholar] [CrossRef]
- Balaji, S.; Ahmed, M.; Lorence, E.; Yan, F.; Nomie, K.; Wang, M. NF-kappaB signaling and its relevance to the treatment of mantle cell lymphoma. J. Hematol. Oncol. 2018, 11, 83. [Google Scholar] [CrossRef] [PubMed]
- Wang, C.Y.; Cusack, J.C., Jr.; Liu, R.; Baldwin, A.S., Jr. Control of inducible chemoresistance: Enhanced anti-tumor therapy through increased apoptosis by inhibition of NF-kappaB. Nat. Med. 1999, 5, 412–417. [Google Scholar] [CrossRef] [Green Version]
- Saba, N.S.; Liu, D.; Herman, S.E.; Underbayev, C.; Tian, X.; Behrend, D.; Weniger, M.A.; Skarzynski, M.; Gyamfi, J.; Fontan, L.; et al. Pathogenic role of B-cell receptor signaling and canonical NF-kappaB activation in mantle cell lymphoma. Blood 2016, 128, 82–92. [Google Scholar] [CrossRef] [PubMed] [Green Version]
- Drillenburg, P.; Pals, S.T. Cell adhesion receptors in lymphoma dissemination. Blood 2000, 95, 1900–1910. [Google Scholar] [CrossRef] [PubMed]
- Wu, W.; Wang, W.; Franzen, C.A.; Guo, H.; Lee, J.; Li, Y.; Sukhanova, M.; Sheng, D.; Venkataraman, G.; Ming, M.; et al. Inhibition of B-cell receptor signaling disrupts cell adhesion in mantle cell lymphoma via RAC2. Blood Adv. 2021, 5, 185–197. [Google Scholar] [CrossRef]
- Chen, S.C.; Liao, T.T.; Yang, M.H. Emerging roles of epithelial-mesenchymal transition in hematological malignancies. J. Biomed. Sci. 2018, 25, 37. [Google Scholar] [CrossRef] [Green Version]
- Kahlert, U.; Joseph, J.V.; Kruyt, F.A.E. EMT- and MET-related processes in nonepithelial tumors: Importance for disease progression, prognosis, and therapeutic opportunities. Mol. Oncol. 2017, 11, 860–877. [Google Scholar] [CrossRef]
- Taki, M.; Abiko, K.; Ukita, M.; Murakami, R.; Yamanoi, K.; Yamaguchi, K.; Hamanishi, J.; Baba, T.; Matsumura, N.; Mandai, M. Tumor Immune Microenvironment during Epithelial–Mesenchymal Transition. Clin. Cancer Res. 2021, 27, 4669–4679. [Google Scholar] [CrossRef]
- Hass, R.; Von Der Ohe, J.; Ungefroren, H. The Intimate Relationship among EMT, MET and TME: A T(ransdifferentiation) E(nhancing) M(ix) to Be Exploited for Therapeutic Purposes. Cancers 2020, 12, 3674. [Google Scholar] [CrossRef]
- Aggarwal, V.; Montoya, C.A.; Donnenberg, V.S.; Sant, S. Interplay between tumor microenvironment and partial EMT as the driver of tumor progression. iScience 2021, 24, 102113. [Google Scholar] [CrossRef] [PubMed]
- Jung, H.Y.; Fattet, L.; Yang, J. Molecular Pathways: Linking Tumor Microenvironment to Epithelial–Mesenchymal Transition in Metastasis. Clin. Cancer Res. 2015, 21, 962–968. [Google Scholar] [CrossRef] [PubMed] [Green Version]
- Beekman, R.; Amador, V.; Campo, E. SOX11, a key oncogenic factor in mantle cell lymphoma. Curr. Opin. Hematol. 2018, 25, 299–306. [Google Scholar] [CrossRef] [PubMed]
- Kuo, P.Y.; Jatiani, S.S.; Rahman, A.H.; Edwards, D.; Jiang, Z.; Ahr, K.; Perumal, D.; Leshchenko, V.V.; Brody, J.; Shaknovich, R.; et al. SOX11 augments BCR signaling to drive MCL-like tumor development. Blood 2018, 131, 2247–2255. [Google Scholar] [CrossRef] [PubMed]
- Kurtova, A.V.; Tamayo, A.T.; Ford, R.J.; Burger, J.A. Mantle cell lymphoma cells express high levels of CXCR4, CXCR5, and VLA-4 (CD49d): Importance for interactions with the stromal microenvironment and specific targeting. Blood 2009, 113, 4604–4613. [Google Scholar] [CrossRef]
- Wang, X.; Sehgal, L.; Jain, N.; Khashab, T.; Mathur, R.; Samaniego, F. LncRNA MALAT1 promotes development of mantle cell lymphoma by associating with EZH2. J. Transl. Med. 2016, 14, 346. [Google Scholar] [CrossRef] [Green Version]
- Qian, C.S.; Li, L.J.; Huang, H.W.; Yang, H.F.; Wu, D.P. MYC-regulated lncRNA NEAT1 promotes B cell proliferation and lymphomagenesis via the miR-34b-5p-GLI1 pathway in diffuse large B-cell lymphoma. Cancer Cell Int. 2020, 20, 87. [Google Scholar] [CrossRef] [Green Version]
- Zhang, M.; Weng, W.; Zhang, Q.; Wu, Y.; Ni, S.; Tan, C.; Xu, M.; Sun, H.; Liu, C.; Wei, P.; et al. The lncRNA NEAT1 activates Wnt/beta-catenin signaling and promotes colorectal cancer progression via interacting with DDX5. J. Hematol. Oncol. 2018, 11, 113. [Google Scholar] [CrossRef] [Green Version]
- Kalaitzidis, D.; Gilmore, T.D. Transcription factor cross-talk: The estrogen receptor and NF-kappaB. Trends Endocrinol. Metab. 2005, 16, 46–52. [Google Scholar] [CrossRef]
- Sas, L.; Lardon, F.; Vermeulen, P.B.; Hauspy, J.; Van Dam, P.; Pauwels, P.; Dirix, L.Y.; van Laere, S.J. The interaction between ER and NFkappaB in resistance to endocrine therapy. Breast Cancer Res. 2012, 14, 212. [Google Scholar] [CrossRef] [Green Version]
- Dahlman-Wright, K.; Qiao, Y.; Jonsson, P.; Gustafsson, J.; Williams, C.; Zhao, C. Interplay between AP-1 and estrogen receptor α in regulating gene expression and proliferation networks in breast cancer cells. Carcinogenesis 2012, 33, 1684–1691. [Google Scholar] [CrossRef] [PubMed] [Green Version]
- Zhao, C.; Gao, H.; Liu, Y.; Papoutsi, Z.; Jaffrey, S.; Gustafsson, J.A.; Dahlman-Wright, K. Genome-wide mapping of estrogen receptor-beta-binding regions reveals extensive cross-talk with transcription factor activator protein-1. Cancer Res. 2010, 70, 5174–5183. [Google Scholar] [CrossRef] [PubMed] [Green Version]
- Rojas, A.; Otálora-Otálora, B.A.; Henríquez, B.; López-Kleine, L. RUNX family: Oncogenes or tumor suppressors (Review). Oncol. Rep. 2019, 42, 3–19. [Google Scholar] [CrossRef]
- Merolle, M.; Ahmed, M.; Nomie, K.; Wang, M.L. The B cell receptor signaling pathway in mantle cell lymphoma. Oncotarget 2018, 9, 25332–25341. [Google Scholar] [CrossRef] [Green Version]
- Stuelten, C.H.; Zhang, Y.E. Transforming Growth Factor-beta: An Agent of Change in the Tumor Microenvironment. Front. Cell Dev. Biol. 2021, 9, 764727. [Google Scholar] [CrossRef]
- Gil Rizzatti, E.; Falcao, R.P.; Panepucci, R.A.; Proto-Siqueira, R.; Anselmo-Lima, W.T.; Okamoto, O.K.; Zago, M.A. Gene expression profiling of mantle cell lymphoma cells reveals aberrant expression of genes from the PI3K-AKT, WNT and TGFbeta signalling pathways. Br. J. Haematol. 2005, 130, 516–526. [Google Scholar] [CrossRef]
- Derynck, R.; Turley, S.J.; Akhurst, R.J. TGFbeta biology in cancer progression and immunotherapy. Nat. Rev. Clin. Oncol. 2021, 18, 9–34. [Google Scholar] [CrossRef]
- Pan, Y.; Yu, Y.; Wang, X.; Zhang, T. Tumor-Associated Macrophages in Tumor Immunity. Front. Immunol. 2020, 11, 583084. [Google Scholar] [CrossRef]


Publisher’s Note: MDPI stays neutral with regard to jurisdictional claims in published maps and institutional affiliations. |
© 2022 by the authors. Licensee MDPI, Basel, Switzerland. This article is an open access article distributed under the terms and conditions of the Creative Commons Attribution (CC BY) license (https://creativecommons.org/licenses/by/4.0/).
Share and Cite
Huang, D.; Huang, Z.; Indukuri, R.; Bangalore Revanna, C.; Berglund, M.; Guan, J.; Yakimchuk, K.; Damdimopoulos, A.; Williams, C.; Okret, S. Estrogen Receptor β (ESR2) Transcriptome and Chromatin Binding in a Mantle Cell Lymphoma Tumor Model Reveal the Tumor-Suppressing Mechanisms of Estrogens. Cancers 2022, 14, 3098. https://doi.org/10.3390/cancers14133098
Huang D, Huang Z, Indukuri R, Bangalore Revanna C, Berglund M, Guan J, Yakimchuk K, Damdimopoulos A, Williams C, Okret S. Estrogen Receptor β (ESR2) Transcriptome and Chromatin Binding in a Mantle Cell Lymphoma Tumor Model Reveal the Tumor-Suppressing Mechanisms of Estrogens. Cancers. 2022; 14(13):3098. https://doi.org/10.3390/cancers14133098
Chicago/Turabian StyleHuang, Dan, Zhiqiang Huang, Rajitha Indukuri, Chandrashekar Bangalore Revanna, Mattias Berglund, Jiyu Guan, Konstantin Yakimchuk, Anastasios Damdimopoulos, Cecilia Williams, and Sam Okret. 2022. "Estrogen Receptor β (ESR2) Transcriptome and Chromatin Binding in a Mantle Cell Lymphoma Tumor Model Reveal the Tumor-Suppressing Mechanisms of Estrogens" Cancers 14, no. 13: 3098. https://doi.org/10.3390/cancers14133098
APA StyleHuang, D., Huang, Z., Indukuri, R., Bangalore Revanna, C., Berglund, M., Guan, J., Yakimchuk, K., Damdimopoulos, A., Williams, C., & Okret, S. (2022). Estrogen Receptor β (ESR2) Transcriptome and Chromatin Binding in a Mantle Cell Lymphoma Tumor Model Reveal the Tumor-Suppressing Mechanisms of Estrogens. Cancers, 14(13), 3098. https://doi.org/10.3390/cancers14133098