
A Fraction of CD8+ T Cells from Colorectal Liver Metastases Preferentially Repopulate Autologous Patient-Derived Xenograft Tumors as Tissue-Resident Memory T Cells

 , , ,
, , ,  and
and 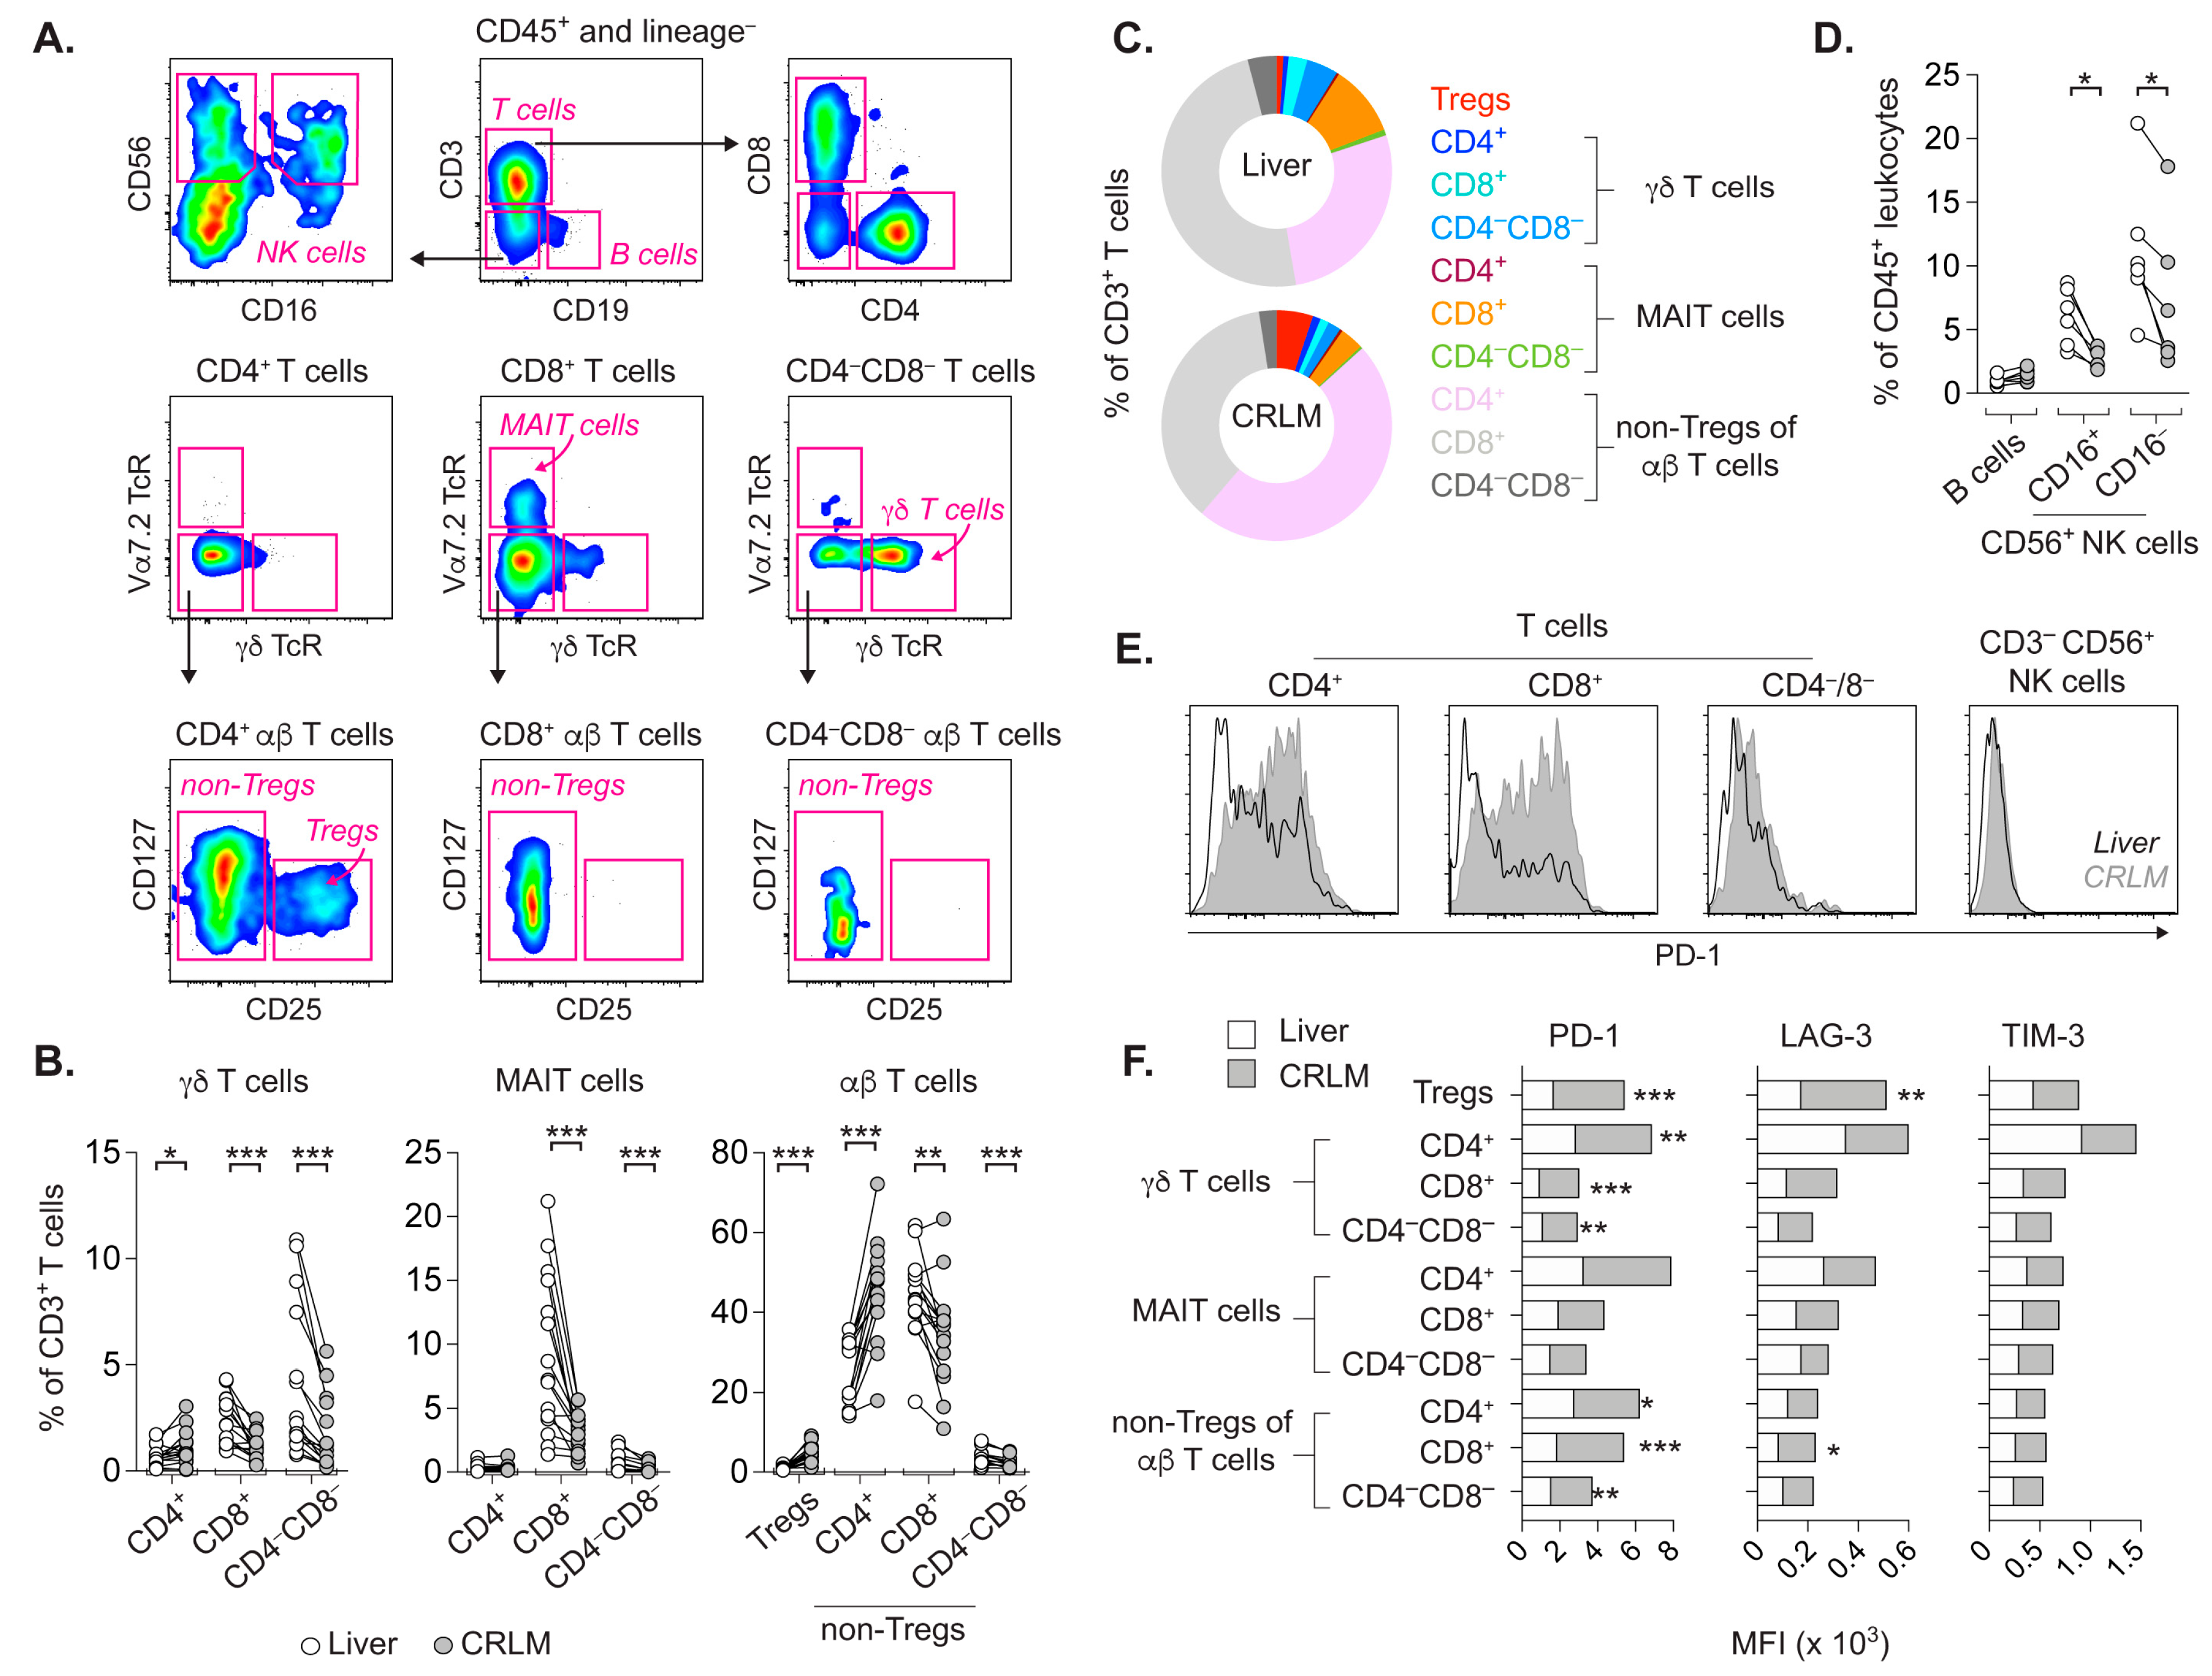
Abstract
:Simple Summary
Abstract
1. Introduction
2. Results
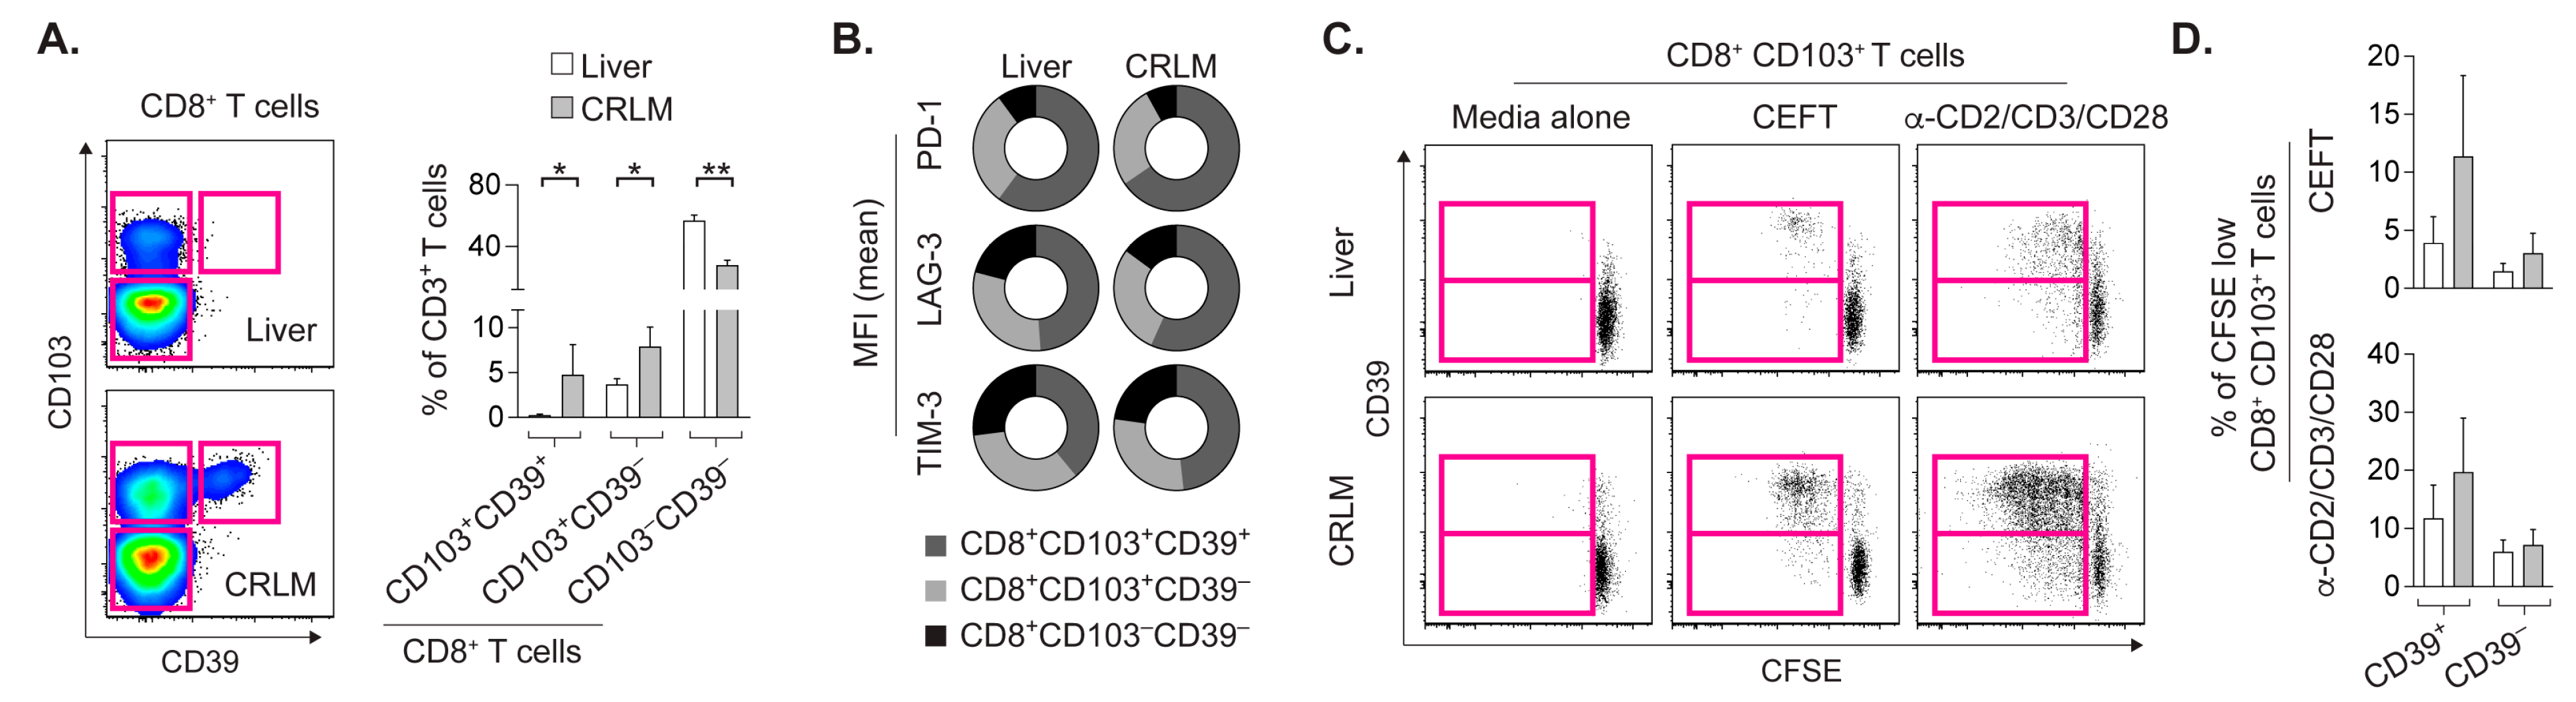
2.1. T Cell Subsets from CRLM and Adjacent Liver Differ in Frequency and Activation Status
2.2. CD8+CD103+ TRM Cells from CRLM and Liver Proliferate upon Cognate Stimulation
2.3. Prominent DC Activation in CRLM Compared to the Adjacent Liver
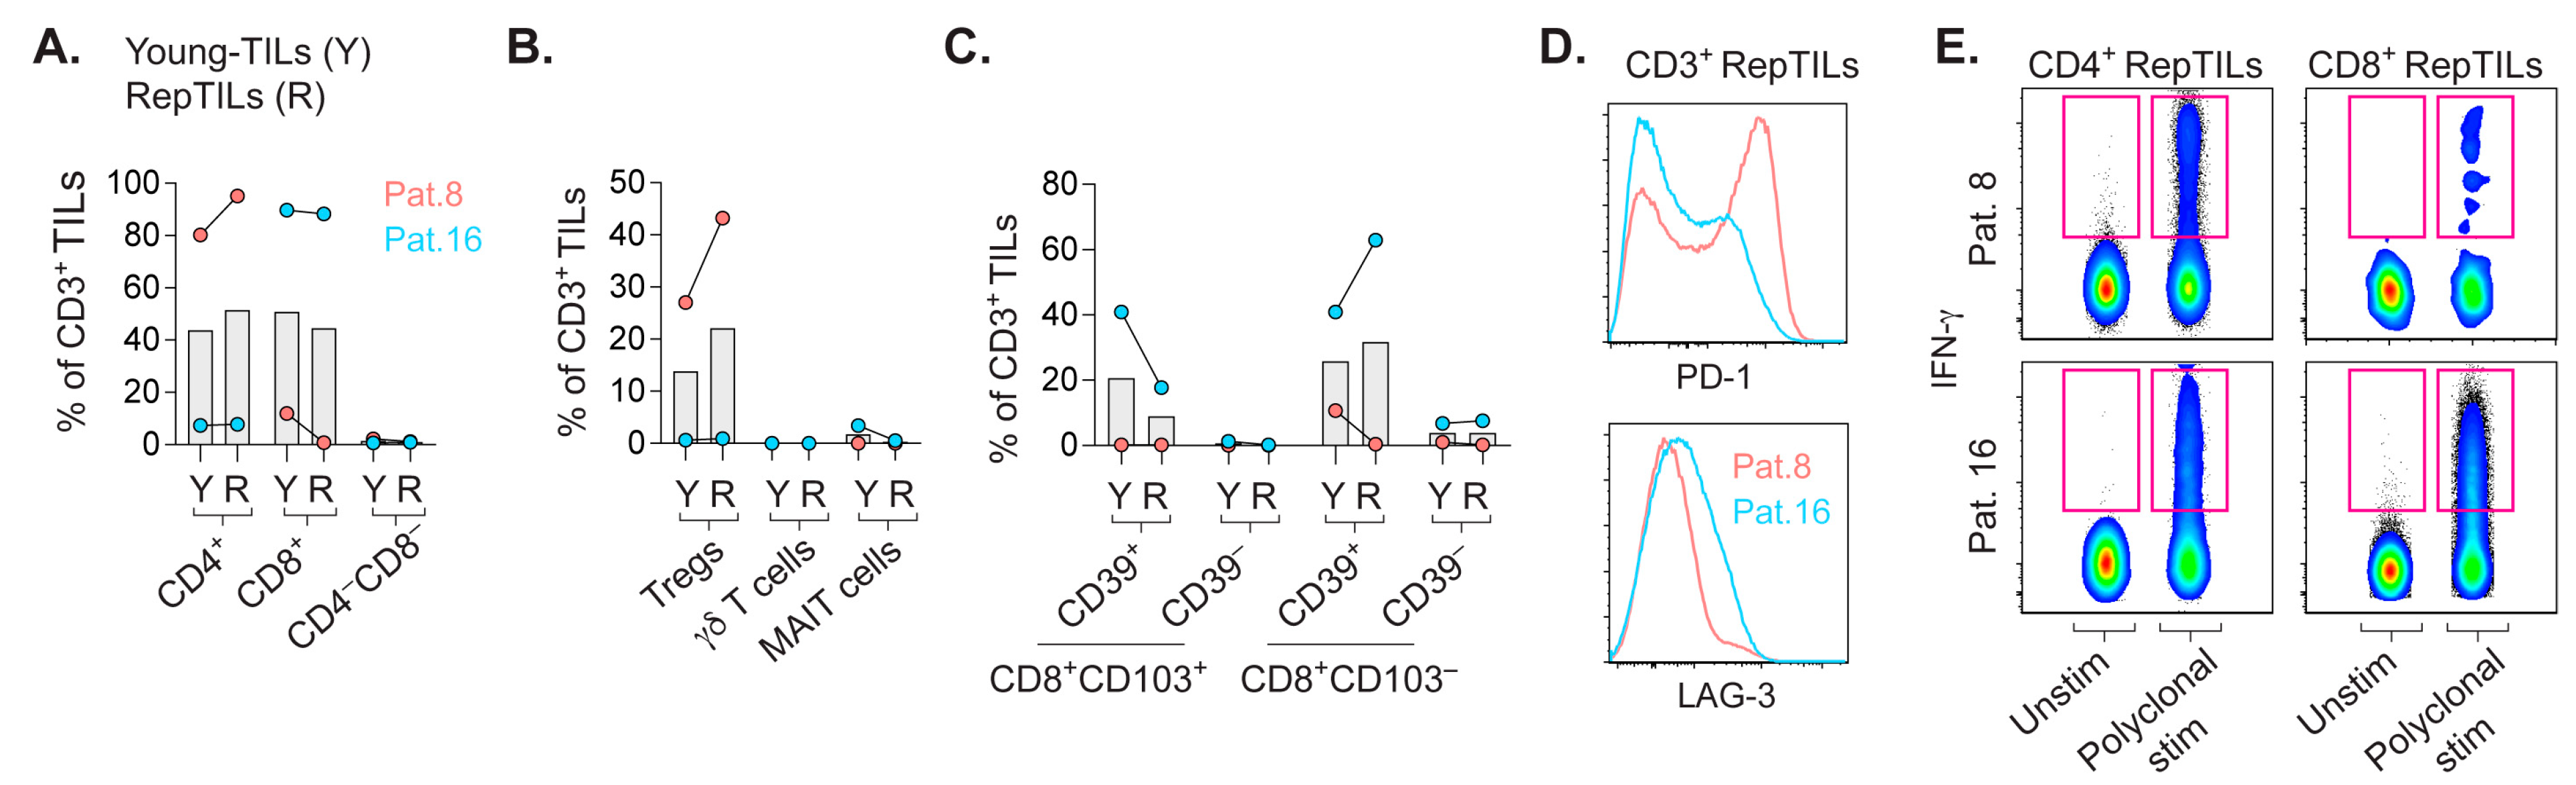
2.4. In-Vitro-Expanded TILs Largely Consist of αβ T Cells Capable of IFN-γ Production
2.5. MEKi after Transfer of RepTILs Modestly Control Growth of Tumor of Limited Size
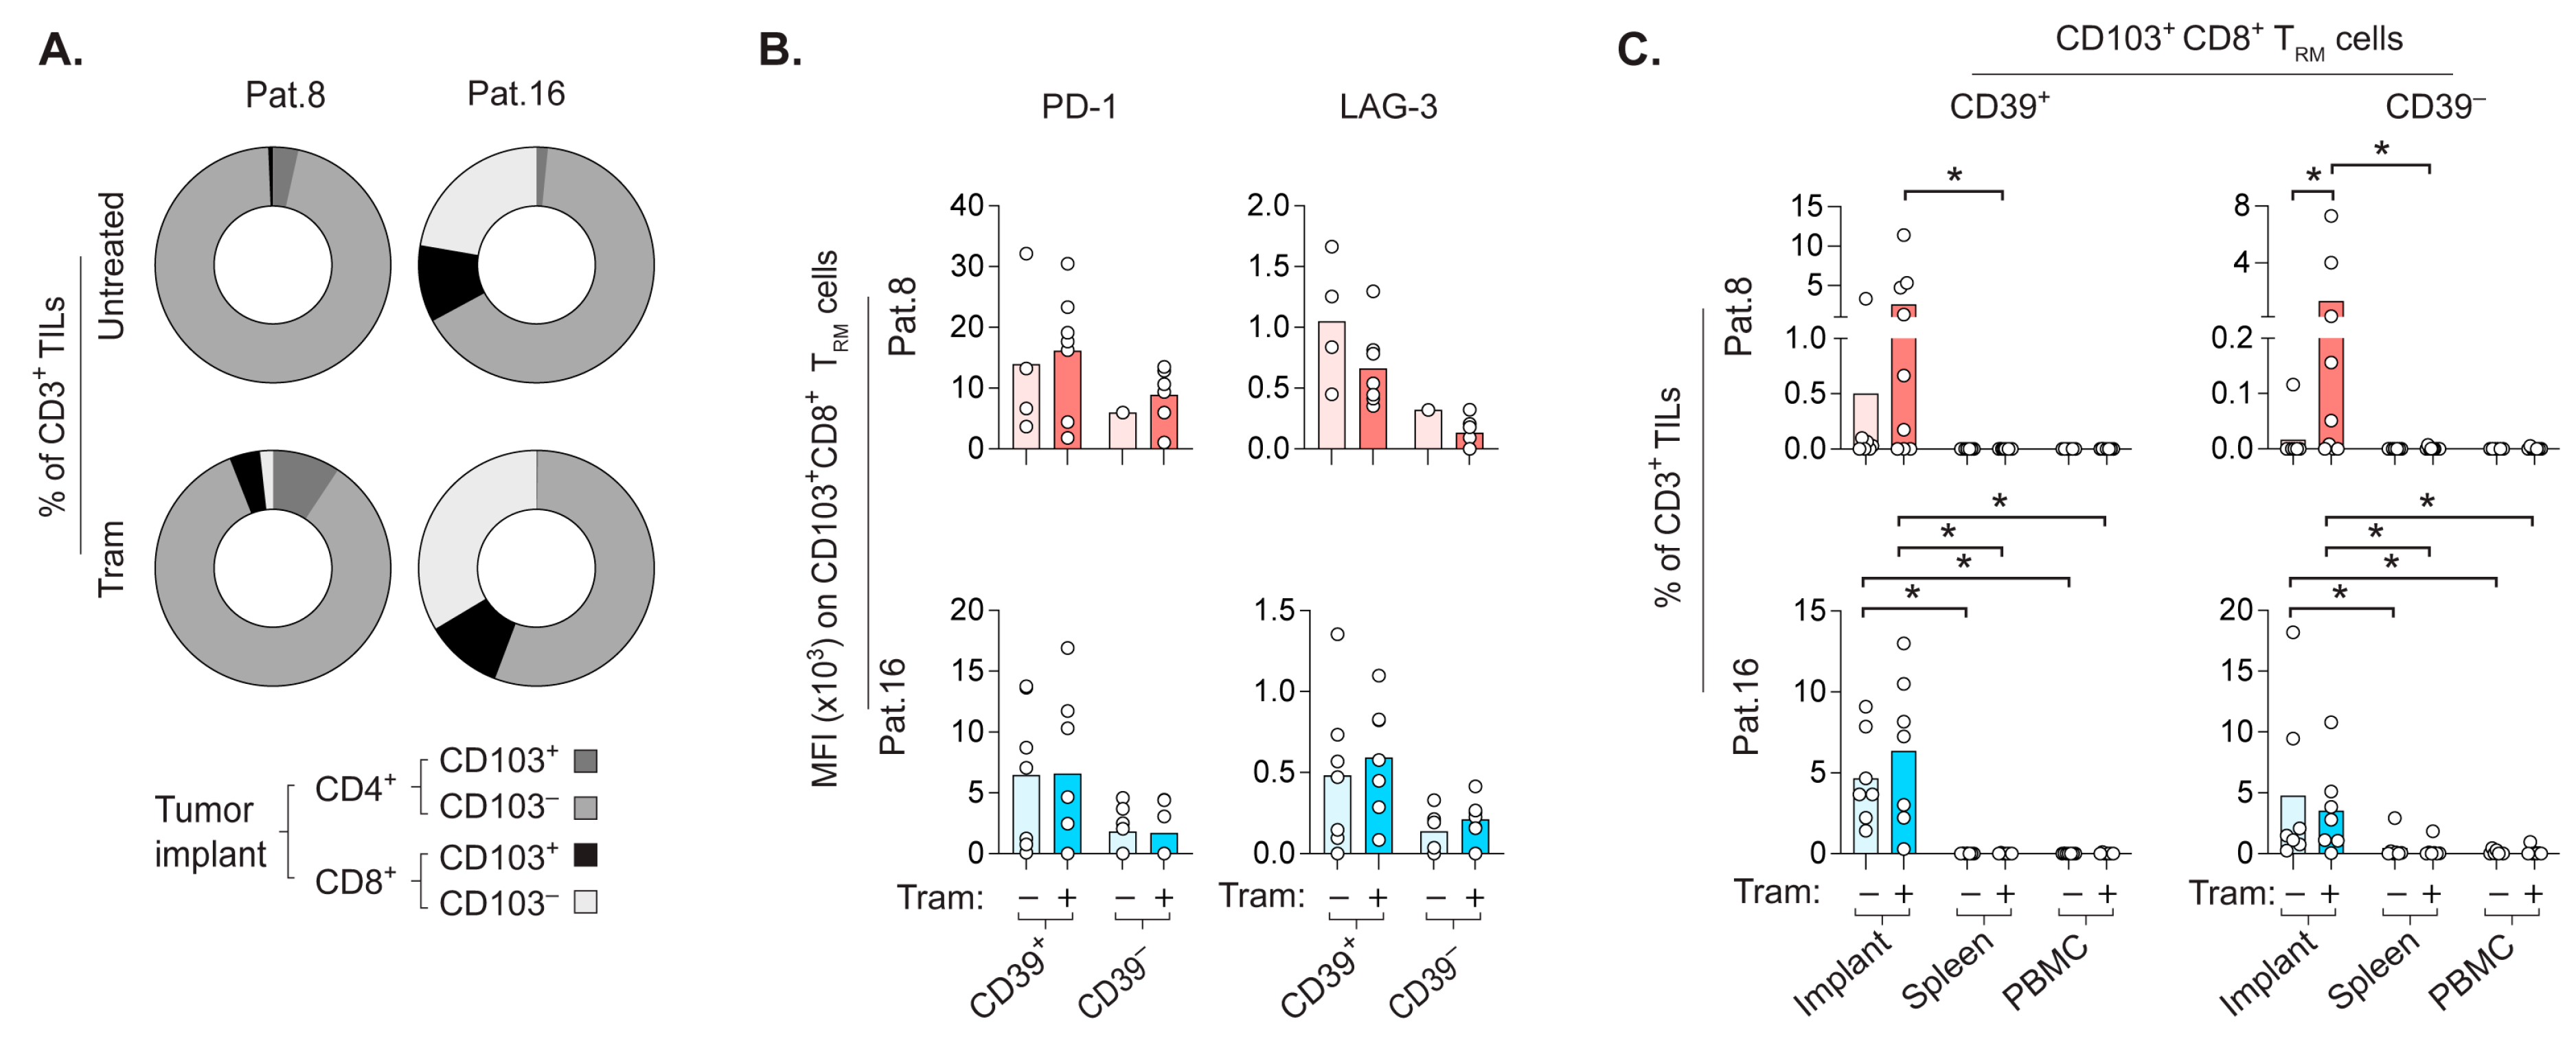
2.6. CD8+ TRM Cells Prefer to Repopulate the Autologous CRLM-Derived Tumor Implant
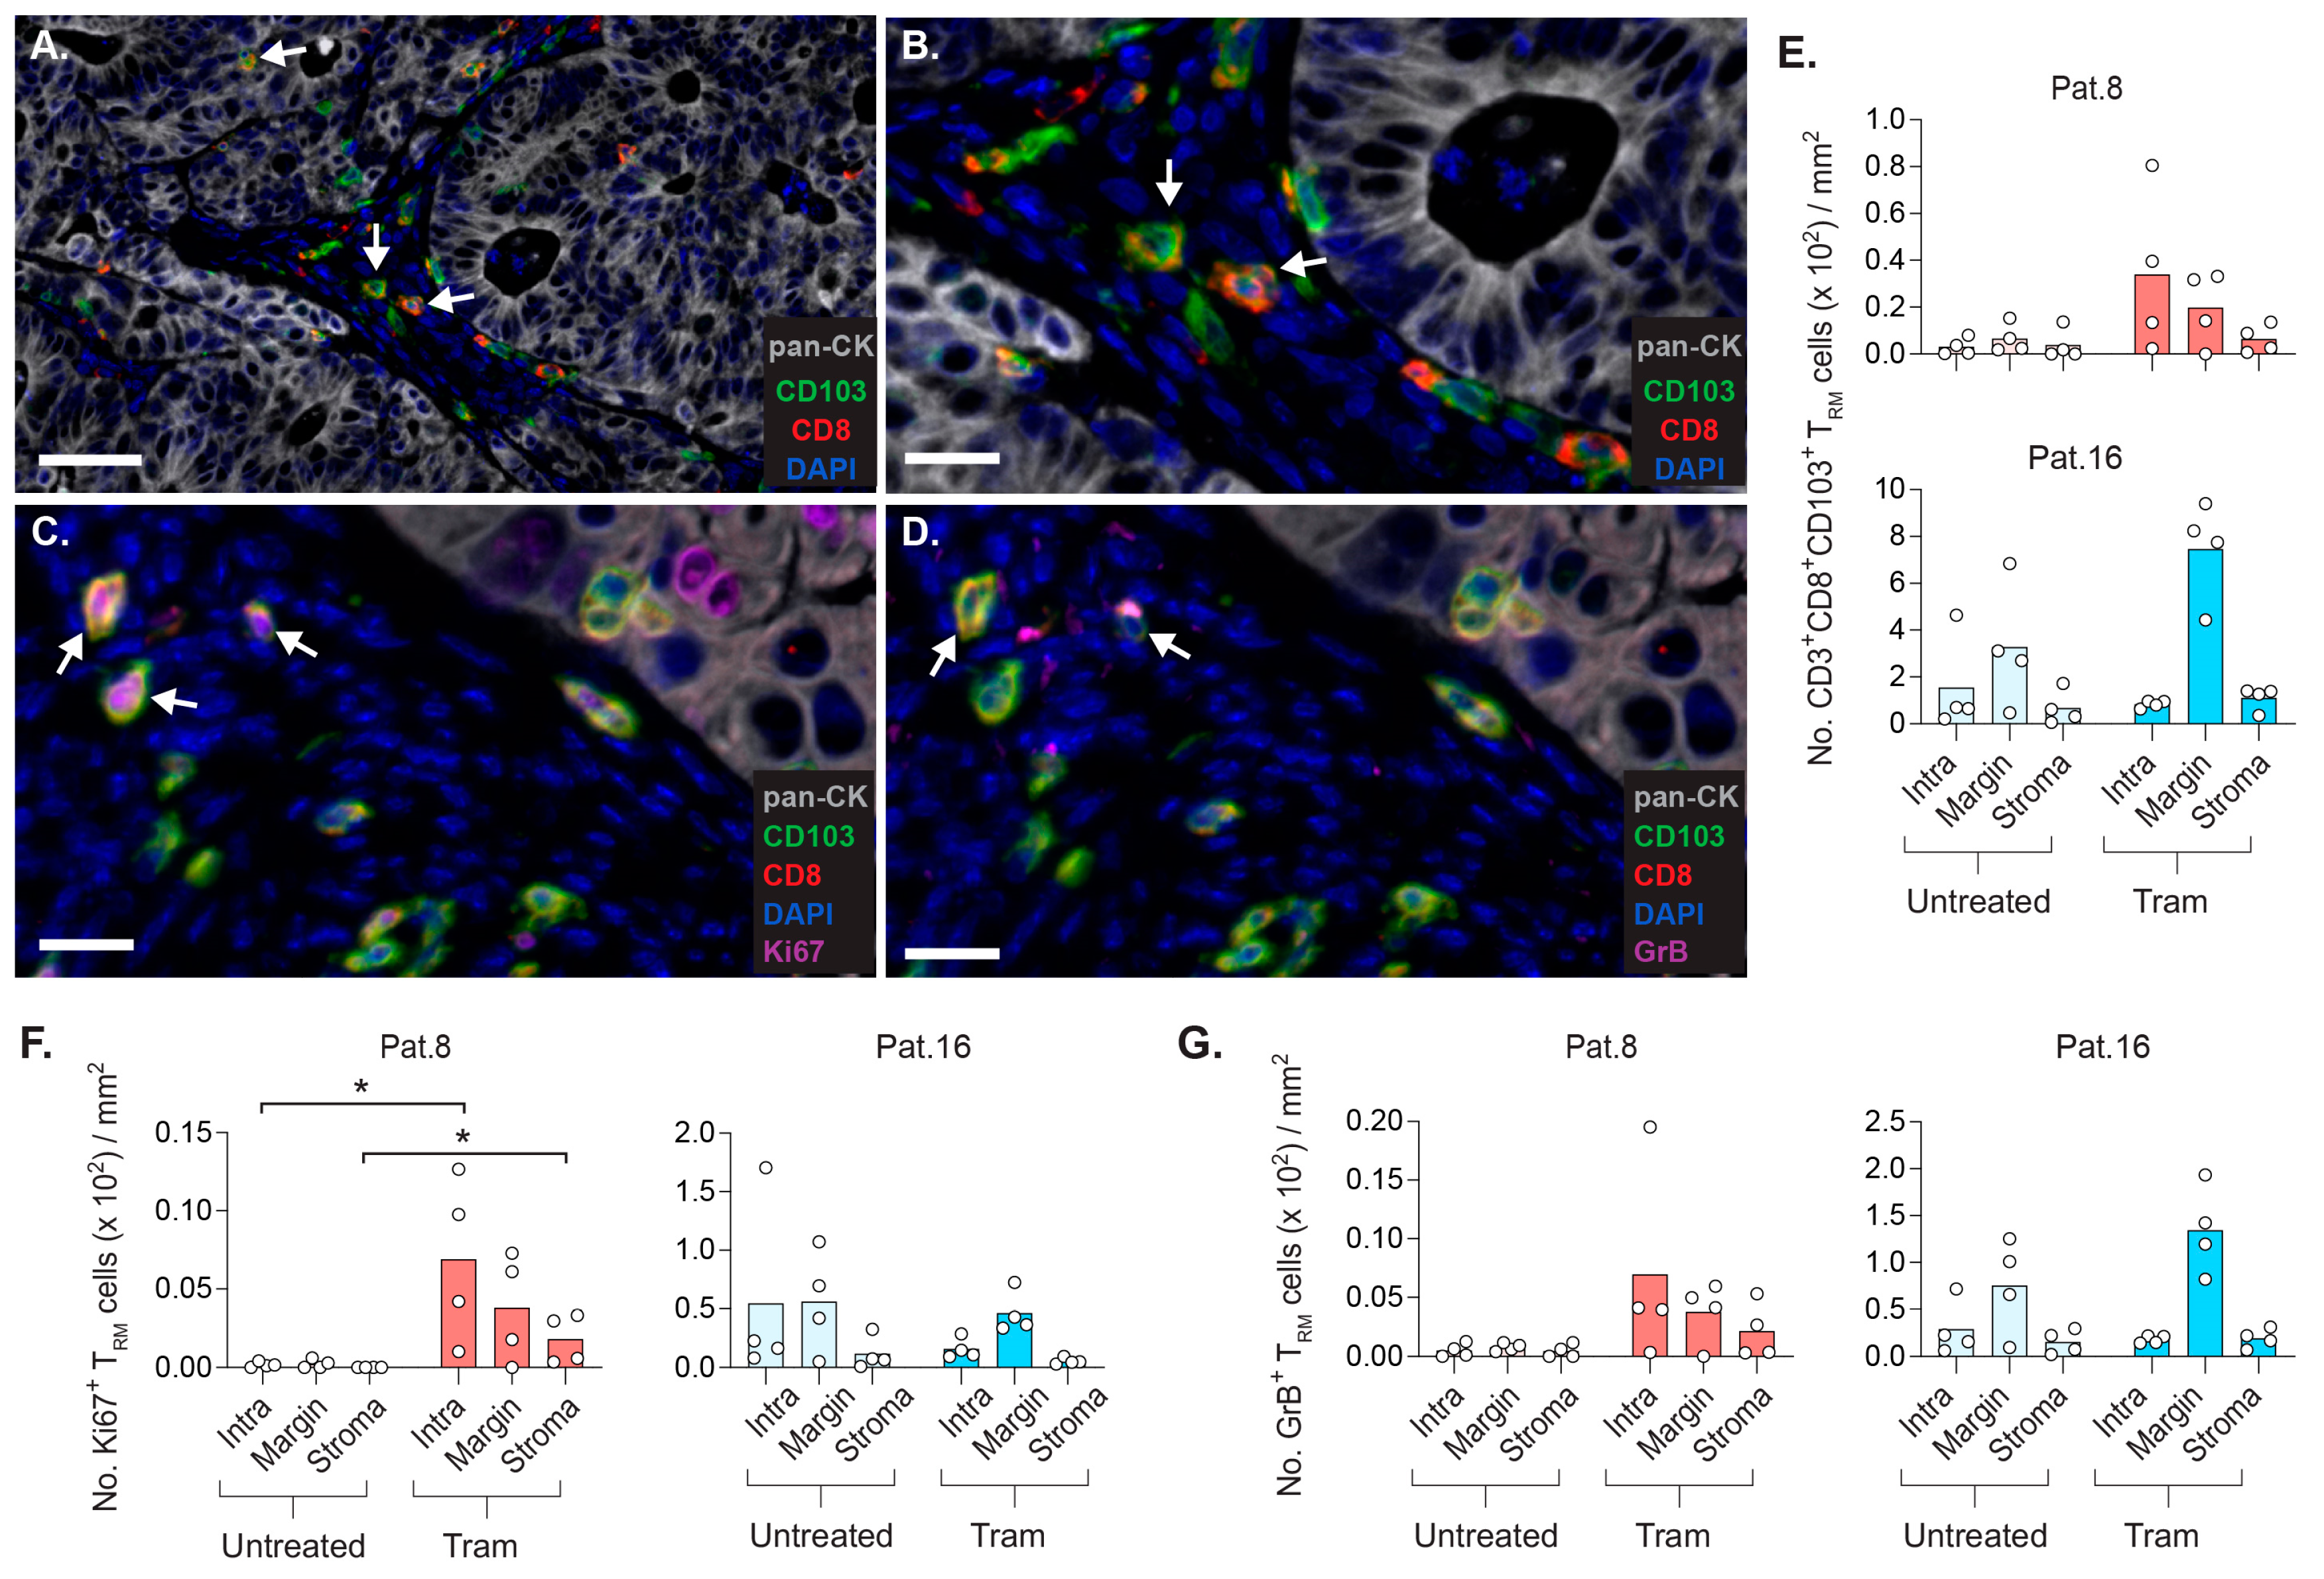
2.7. CD8+ TRM Cells Display Strategic Intratumoral Positioning after Trametinib Treatment
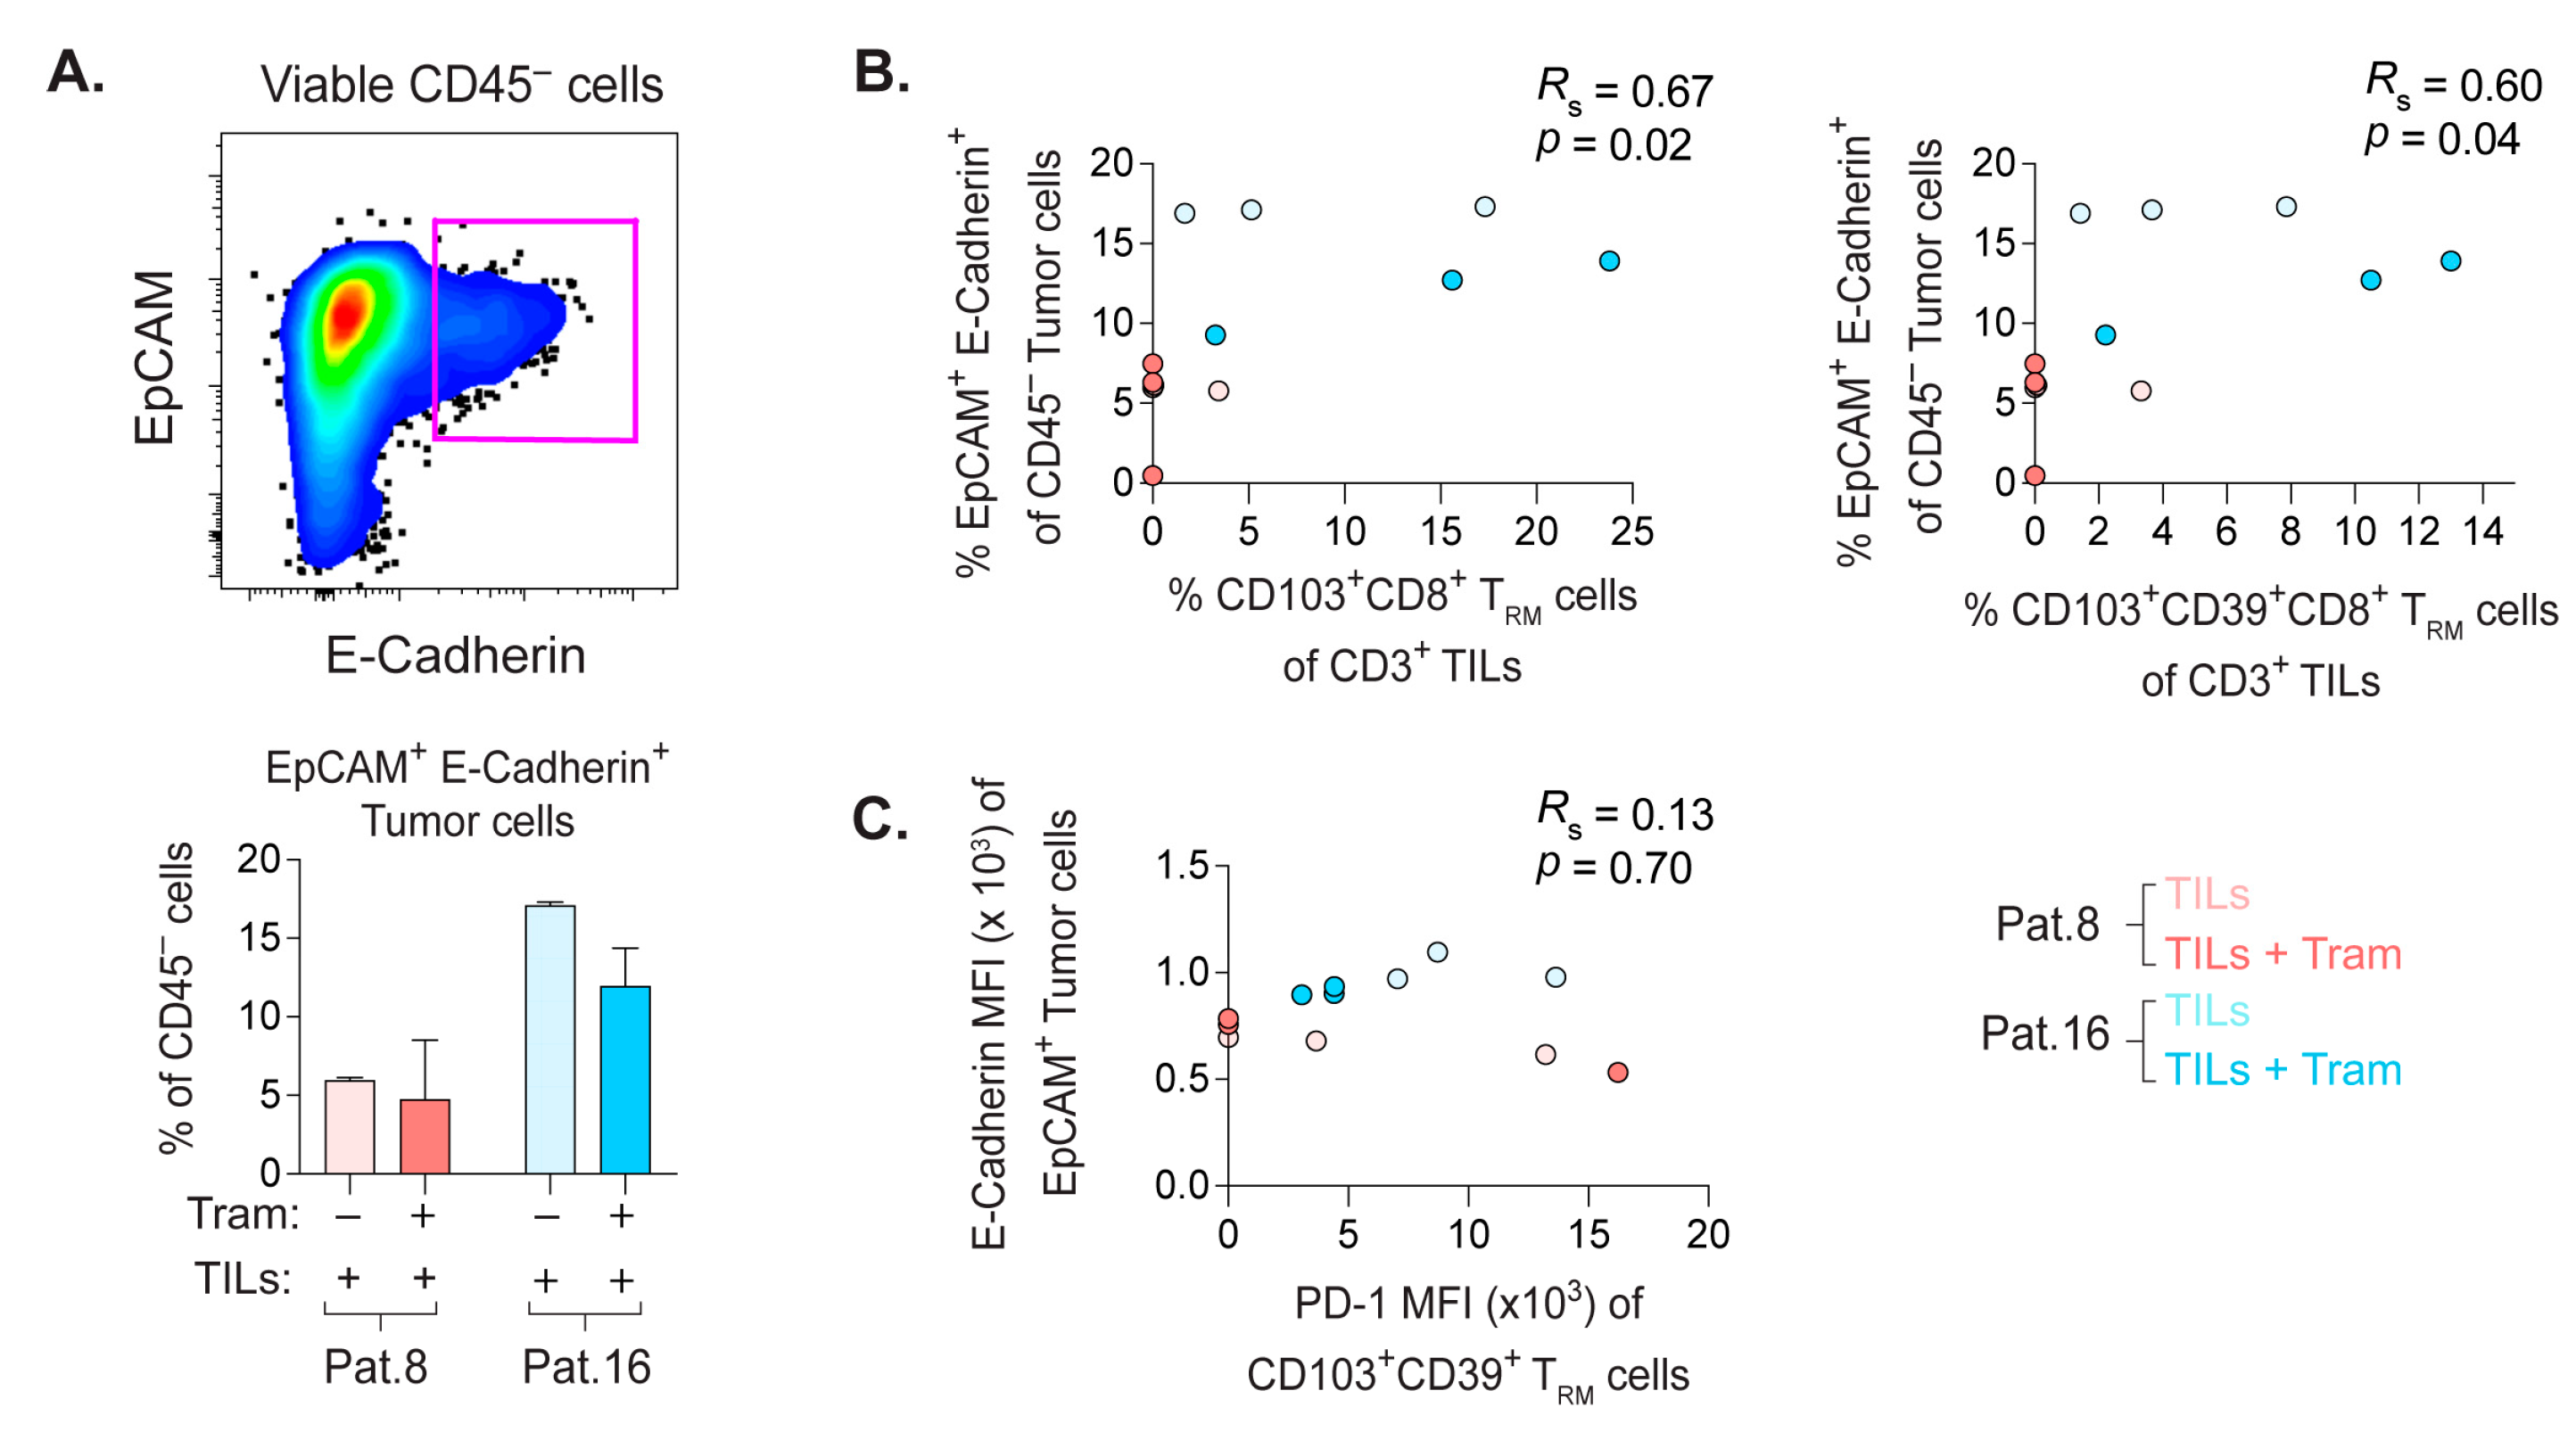
2.8. Frequency of E-Cadherin+ PDX Tumor Cells Correlate with the Quantity of CD8+ TRM Cells
3. Discussion
4. Materials and Methods
4.1. CRC Patients
4.2. Single-Cell Suspensions from Patient Samples
4.3. Flow Cytometry
4.4. T Cell Proliferation Assay
4.5. Expansion and Stimulation of TILs In Vitro
4.6. Establishment of PDX Mouse Model and Treatments
4.7. Samples from PDX Model
4.8. Immunohistochemistry
4.9. Image Analyses
4.10. Statistical Analyses
5. Conclusions
Supplementary Materials
Author Contributions
Funding
Institutional Review Board Statement
Informed Consent Statement
Data Availability Statement
Acknowledgments
Conflicts of Interest
References
- Martin, J.; Petrillo, A.; Smyth, E.C.; Shaida, N.; Khwaja, S.; Cheow, H.K.; Duckworth, A.; Heister, P.; Praseedom, R.; Jah, A.; et al. Colorectal liver metastases: Current management and future perspectives. World J. Clin. Oncol. 2020, 11, 761–808. [Google Scholar] [CrossRef] [PubMed]
- Sung, H.; Ferlay, J.; Siegel, R.L.; Laversanne, M.; Soerjomataram, I.; Jemal, A.; Bray, F. Global Cancer Statistics 2020: GLOBOCAN Estimates of Incidence and Mortality Worldwide for 36 Cancers in 185 Countries. CA Cancer J. Clin. 2021, 71, 209–249. [Google Scholar] [CrossRef] [PubMed]
- Galon, J.; Costes, A.; Sanchez-Cabo, F.; Kirilovsky, A.; Mlecnik, B.; Lagorce-Pages, C.; Tosolini, M.; Camus, M.; Berger, A.; Wind, P.; et al. Type, density, and location of immune cells within human colorectal tumors predict clinical outcome. Science 2006, 313, 1960–1964. [Google Scholar] [CrossRef] [PubMed]
- Pages, F.; Kirilovsky, A.; Mlecnik, B.; Asslaber, M.; Tosolini, M.; Bindea, G.; Lagorce, C.; Wind, P.; Marliot, F.; Bruneval, P.; et al. In situ cytotoxic and memory T cells predict outcome in patients with early-stage colorectal cancer. J. Clin. Oncol. 2009, 27, 5944–5951. [Google Scholar] [CrossRef] [PubMed]
- Liang, J.Y.; Xi, S.Y.; Shao, Q.; Yuan, Y.F.; Li, B.K.; Zheng, Y.; Wang, D.S.; Wu, X.J.; Ding, P.R.; Chen, G.; et al. Histopathological growth patterns correlate with the immunoscore in colorectal cancer liver metastasis patients after hepatectomy. Cancer Immunol. Immunother. 2020, 69, 2623–2634. [Google Scholar] [CrossRef] [PubMed]
- Wang, E.; Shibutani, M.; Nagahara, H.; Fukuoka, T.; Iseki, Y.; Okazaki, Y.; Kashiwagi, S.; Tanaka, H.; Maeda, K. Prognostic value of the density of tumor-infiltrating lymphocytes in colorectal cancer liver metastases. Oncol. Lett. 2021, 22, 837. [Google Scholar] [CrossRef]
- Wang, Y.; Lin, H.C.; Huang, M.Y.; Shao, Q.; Wang, Z.Q.; Wang, F.H.; Yuan, Y.F.; Li, B.K.; Wang, D.S.; Ding, P.R.; et al. The Immunoscore system predicts prognosis after liver metastasectomy in colorectal cancer liver metastases. Cancer Immunol. Immunother. 2018, 67, 435–444. [Google Scholar] [CrossRef]
- Strauss, O.; Dunbar, P.R.; Bartlett, A.; Phillips, A. The immunophenotype of antigen presenting cells of the mononuclear phagocyte system in normal human liver--a systematic review. J. Hepatol. 2015, 62, 458–468. [Google Scholar] [CrossRef]
- Wang, Y.; Zhang, C. The Roles of Liver-Resident Lymphocytes in Liver Diseases. Front. Immunol. 2019, 10, 1582. [Google Scholar] [CrossRef]
- Bartsch, L.M.; Damasio, M.P.S.; Subudhi, S.; Drescher, H.K. Tissue-Resident Memory T Cells in the Liver-Unique Characteristics of Local Specialists. Cells 2020, 9, 2457. [Google Scholar] [CrossRef]
- Duhen, T.; Duhen, R.; Montler, R.; Moses, J.; Moudgil, T.; de Miranda, N.F.; Goodall, C.P.; Blair, T.C.; Fox, B.A.; McDermott, J.E.; et al. Co-expression of CD39 and CD103 identifies tumor-reactive CD8 T cells in human solid tumors. Nat. Commun. 2018, 9, 2724. [Google Scholar] [CrossRef] [PubMed]
- Simoni, Y.; Becht, E.; Fehlings, M.; Loh, C.Y.; Koo, S.L.; Teng, K.W.W.; Yeong, J.P.S.; Nahar, R.; Zhang, T.; Kared, H.; et al. Bystander CD8(+) T cells are abundant and phenotypically distinct in human tumour infiltrates. Nature 2018, 557, 575–579. [Google Scholar] [CrossRef] [PubMed]
- Liang, F.; Rezapour, A.; Szeponik, L.; Alsen, S.; Wettergren, Y.; Bexe Lindskog, E.; Quiding-Jarbrink, M.; Yrlid, U. Antigen Presenting Cells from Tumor and Colon of Colorectal Cancer Patients Are Distinct in Activation and Functional Status, but Comparably Responsive to Activated T Cells. Cancers 2021, 13, 5247. [Google Scholar] [CrossRef] [PubMed]
- Okla, K.; Farber, D.L.; Zou, W. Tissue-resident memory T cells in tumor immunity and immunotherapy. J. Exp. Med. 2021, 218, e20201605. [Google Scholar] [CrossRef] [PubMed]
- Corgnac, S.; Boutet, M.; Kfoury, M.; Naltet, C.; Mami-Chouaib, F. The Emerging Role of CD8(+) Tissue Resident Memory T (TRM) Cells in Antitumor Immunity: A Unique Functional Contribution of the CD103 Integrin. Front. Immunol. 2018, 9, 1904. [Google Scholar] [CrossRef] [PubMed]
- Hu, W.; Sun, R.; Chen, L.; Zheng, X.; Jiang, J. Prognostic significance of resident CD103(+)CD8(+)T cells in human colorectal cancer tissues. Acta Histochem. 2019, 121, 657–663. [Google Scholar] [CrossRef]
- Bommareddy, P.K.; Aspromonte, S.; Zloza, A.; Rabkin, S.D.; Kaufman, H.L. MEK inhibition enhances oncolytic virus immunotherapy through increased tumor cell killing and T Cell activation. Sci. Transl. Med. 2018, 10, eaau0417. [Google Scholar] [CrossRef]
- Ebert, P.J.R.; Cheung, J.; Yang, Y.; McNamara, E.; Hong, R.; Moskalenko, M.; Gould, S.E.; Maecker, H.; Irving, B.A.; Kim, J.M.; et al. MAP Kinase Inhibition Promotes T Cell and Anti-tumor Activity in Combination with PD-L1 Checkpoint Blockade. Immunity 2016, 44, 609–621. [Google Scholar] [CrossRef]
- Liu, L.; Mayes, P.A.; Eastman, S.; Shi, H.; Yadavilli, S.; Zhang, T.; Yang, J.; Seestaller-Wehr, L.; Zhang, S.Y.; Hopson, C.; et al. The BRAF and MEK Inhibitors Dabrafenib and Trametinib: Effects on Immune Function and in Combination with Immunomodulatory Antibodies Targeting PD-1, PD-L1, and CTLA-4. Clin. Cancer Res. 2015, 21, 1639–1651. [Google Scholar] [CrossRef]
- Kang, S.H.; Keam, B.; Ahn, Y.O.; Park, H.R.; Kim, M.; Kim, T.M.; Kim, D.W.; Heo, D.S. Inhibition of MEK with trametinib enhances the efficacy of anti-PD-L1 inhibitor by regulating anti-tumor immunity in head and neck squamous cell carcinoma. Oncoimmunology 2019, 8, e1515057. [Google Scholar] [CrossRef]
- Choi, H.; Deng, J.; Li, S.; Silk, T.; Dong, L.; Brea, E.J.; Houghton, S.; Redmond, D.; Zhong, H.; Boiarsky, J.; et al. Pulsatile MEK Inhibition Improves Anti-tumor Immunity and T Cell Function in Murine Kras Mutant Lung Cancer. Cell Rep. 2019, 27, 806–819.e805. [Google Scholar] [CrossRef] [PubMed]
- Infante, J.R.; Fecher, L.A.; Falchook, G.S.; Nallapareddy, S.; Gordon, M.S.; Becerra, C.; DeMarini, D.J.; Cox, D.S.; Xu, Y.; Morris, S.R.; et al. Safety, pharmacokinetic, pharmacodynamic, and efficacy data for the oral MEK inhibitor trametinib: A phase 1 dose-escalation trial. Lancet Oncol. 2012, 13, 773–781. [Google Scholar] [CrossRef]
- Jespersen, H.; Lindberg, M.F.; Donia, M.; Soderberg, E.M.V.; Andersen, R.; Keller, U.; Ny, L.; Svane, I.M.; Nilsson, L.M.; Nilsson, J.A. Clinical responses to adoptive T-cell transfer can be modeled in an autologous immune-humanized mouse model. Nat. Commun. 2017, 8, 707. [Google Scholar] [CrossRef] [PubMed]
- Liang, F.; Rezapour, A.; Falk, P.; Angenete, E.; Yrlid, U. Cryopreservation of Whole Tumor Biopsies from Rectal Cancer Patients Enable Phenotypic and In Vitro Functional Evaluation of Tumor-Infiltrating T Cells. Cancers 2021, 13, 2428. [Google Scholar] [CrossRef] [PubMed]
- Meraviglia, S.; Lo Presti, E.; Tosolini, M.; La Mendola, C.; Orlando, V.; Todaro, M.; Catalano, V.; Stassi, G.; Cicero, G.; Vieni, S.; et al. Distinctive features of tumor-infiltrating gammadelta T lymphocytes in human colorectal cancer. Oncoimmunology 2017, 6, e1347742. [Google Scholar] [CrossRef]
- Sundstrom, P.; Szeponik, L.; Ahlmanner, F.; Sundquist, M.; Wong, J.S.B.; Lindskog, E.B.; Gustafsson, B.; Quiding-Jarbrink, M. Tumor-infiltrating mucosal-associated invariant T (MAIT) cells retain expression of cytotoxic effector molecules. Oncotarget 2019, 10, 2810–2823. [Google Scholar] [CrossRef]
- Hofving, T.; Liang, F.; Karlsson, J.; Yrlid, U.; Nilsson, J.A.; Nilsson, O.; Nilsson, L.M. The Microenvironment of Small Intestinal Neuroendocrine Tumours Contains Lymphocytes Capable of Recognition and Activation after Expansion. Cancers 2021, 13, 4305. [Google Scholar] [CrossRef]
- Burandt, E.; Lubbersmeyer, F.; Gorbokon, N.; Buscheck, F.; Luebke, A.M.; Menz, A.; Kluth, M.; Hube-Magg, C.; Hinsch, A.; Hoflmayer, D.; et al. E-Cadherin expression in human tumors: A tissue microarray study on 10,851 tumors. Biomark Res. 2021, 9, 44. [Google Scholar] [CrossRef]
- Canale, F.P.; Ramello, M.C.; Nunez, N.; Araujo Furlan, C.L.; Bossio, S.N.; Gorosito Serran, M.; Tosello Boari, J.; Del Castillo, A.; Ledesma, M.; Sedlik, C.; et al. CD39 Expression Defines Cell Exhaustion in Tumor-Infiltrating CD8(+) T Cells. Cancer Res. 2018, 78, 115–128. [Google Scholar] [CrossRef]
- Gholami, S.; Grothey, A.; Lenz, H.J. Microsatellite Stable Colorectal Liver Metastases-Understanding the Mechanisms of Immune Resistance. JAMA Netw. Open 2021, 4, e2119025. [Google Scholar] [CrossRef]
- Yamashita, S.; Chun, Y.S.; Kopetz, S.E.; Vauthey, J.N. Biomarkers in colorectal liver metastases. Br. J. Surg. 2018, 105, 618–627. [Google Scholar] [CrossRef] [PubMed]
- Nishikawa, H.; Koyama, S. Mechanisms of regulatory T cell infiltration in tumors: Implications for innovative immune precision therapies. J. Immunother. Cancer 2021, 9, e002591. [Google Scholar] [CrossRef] [PubMed]


Publisher’s Note: MDPI stays neutral with regard to jurisdictional claims in published maps and institutional affiliations. |
© 2022 by the authors. Licensee MDPI, Basel, Switzerland. This article is an open access article distributed under the terms and conditions of the Creative Commons Attribution (CC BY) license (https://creativecommons.org/licenses/by/4.0/).
Share and Cite
Liang, F.; Nilsson, L.M.; Byvald, F.; Rezapour, A.; Taflin, H.; Nilsson, J.A.; Yrlid, U. A Fraction of CD8+ T Cells from Colorectal Liver Metastases Preferentially Repopulate Autologous Patient-Derived Xenograft Tumors as Tissue-Resident Memory T Cells. Cancers 2022, 14, 2882. https://doi.org/10.3390/cancers14122882
Liang F, Nilsson LM, Byvald F, Rezapour A, Taflin H, Nilsson JA, Yrlid U. A Fraction of CD8+ T Cells from Colorectal Liver Metastases Preferentially Repopulate Autologous Patient-Derived Xenograft Tumors as Tissue-Resident Memory T Cells. Cancers. 2022; 14(12):2882. https://doi.org/10.3390/cancers14122882
Chicago/Turabian StyleLiang, Frank, Lisa M. Nilsson, Fabian Byvald, Azar Rezapour, Helena Taflin, Jonas A. Nilsson, and Ulf Yrlid. 2022. "A Fraction of CD8+ T Cells from Colorectal Liver Metastases Preferentially Repopulate Autologous Patient-Derived Xenograft Tumors as Tissue-Resident Memory T Cells" Cancers 14, no. 12: 2882. https://doi.org/10.3390/cancers14122882
APA StyleLiang, F., Nilsson, L. M., Byvald, F., Rezapour, A., Taflin, H., Nilsson, J. A., & Yrlid, U. (2022). A Fraction of CD8+ T Cells from Colorectal Liver Metastases Preferentially Repopulate Autologous Patient-Derived Xenograft Tumors as Tissue-Resident Memory T Cells. Cancers, 14(12), 2882. https://doi.org/10.3390/cancers14122882