Article

RP-Rs-fMRIomics as a Novel Imaging Analysis Strategy to Empower Diagnosis of Brain Gliomas

1
Department of Diagnostic Radiology, Affiliated Jinling Hospital, Medical School of Nanjing University, Nanjing 210002, China
2
Department of Neurosurgery, Affiliated Jinling Hospital, Medical School of Nanjing University, Nanjing 210002, China
3
Department of Pathology, Affiliated Jinling Hospital, Medical School of Nanjing University, Nanjing 210002, China
4
State Key Laboratory of Analytical Chemistry for Life Science, Nanjing University, Nanjing 210093, China
*
Author to whom correspondence should be addressed.
These authors contributed equally to this work.
Cancers 2022, 14(12), 2818; https://doi.org/10.3390/cancers14122818
Submission received: 26 April 2022 / Revised: 29 May 2022 / Accepted: 1 June 2022 / Published: 7 June 2022

Abstract

:

Simple Summary

Resting-state functional magnetic resonance imaging (rs-fMRI), a popular neuroimaging technique, can provide rich information about functional processes in the brain with a large array of imaging parameters and is suitable for exploring the pathophysiological essence of gliomas. In this study, by applying omics analysis strategy to rs-fMRI with exhaustive regional parameters, we proposed a novel approach, named Regional Parameter of Resting-state fMRI-omics (RP-Rs-fMRIomics), and further evaluated the diagnosis performance of the method on brain gliomas. We found that the RP-Rs-fMRIomics, featuring entire investigation and high interpretability, presented superior performance in prediction of tumor grade, IDH genotype and prognosis of brain gliomas. This RP-Rs-fMRIomics not only contributed a new imaging method for brain glioma research, but also expanded the clinical application of rs-fMRI.

Abstract

Rs-fMRI can provide rich information about functional processes in the brain with a large array of imaging parameters and is also suitable for investigating the biological processes in cerebral gliomas. We aimed to propose an imaging analysis method of RP-Rs-fMRIomics by adopting omics analysis on rs-fMRI with exhaustive regional parameters and subsequently estimating its feasibility on the prediction diagnosis of gliomas. In this retrospective study, preoperative rs-fMRI data were acquired from patients confirmed with diffuse gliomas (n = 176). A total of 420 features were extracted through measuring 14 regional parameters of rs-fMRI as much as available currently in 10 specific narrow frequency bins and three parts of gliomas. With a randomly split training and testing dataset (ratio 7:3), four classifiers were implemented to construct and optimize RP-Rs-fMRIomics models for predicting glioma grade, IDH status and Karnofsky Performance Status scores. The RP-Rs-fMRIomics models (AUROC 0.988, 0.905, 0.801) were superior to the corresponding traditional single rs-fMRI index (AUROC 0.803, 0.731, 0.632) in predicting glioma grade, IDH and survival. The RP-Rs-fMRIomics analysis, featuring high interpretability, was competitive for prediction of glioma grading, IDH genotype and prognosis. The method expanded the clinical application of rs-fMRI and also contributed a new imaging analysis for brain tumor research.

1. Introduction

Resting-state functional magnetic resonance imaging (rs-fMRI) has been increasingly the most popular neuroimaging technique for investigating human brain function in physiological and pathological states [1]. By measuring low-frequency blood oxygen level dependent (BOLD) fluctuations with a growing array of parameters, rs-fMRI provides rich information for depicting features of spontaneous brain activity from connectivity and regional aspects [2,3,4]. Connectivity measures interregional relationships and is dedicated to the construction of functional brain networks [5,6]. On the contrary, regional parameters, including amplitude of low-frequency fluctuation (ALFF) [7], regional homogeneity (ReHo) [8,9], Hurst exponent (HE) [10] and time-shift-analysis (TSA) [11], voxel-wisely describe the local brain activity in amplitude, frequency and temporal profiles.
Rs-fMRI has also been extensively applied to brain gliomas in clinics. The values of rs-fMRI have been well established in mapping eloquent regions and estimating cognitive function for presurgical planning [12,13]. Moreover, recent investigation has increasingly expanded rs-fMRI to the pathophysiological essence of the tumors by taking advantage of the features of rich information and versatile measures in the technique. In particular, studies have applied rs-fMRI to classify gliomas through observing network characteristics [5,12,14]. However, the network metrics, which measure signals mostly outside the tumor at the whole brain level, might not be specific to the nature of gliomas under a black-box model. A few of other studies observed regional parameters of rs-fMRI within the tumor itself [14,15,16]. Metwali et al. [14] adopted ALFF to investigate tumor grades and found that high-grade gliomas showed significantly higher amplitudes of fluctuation compared with low-grade gliomas. Gupta et al. [16] combined the temporal shift, ALFF and ReHo to characterize the BOLD signal in gliomas and found that the temporal shift and ALFF were significantly distinguishable between high- and low-grade gliomas. These phenotypes of regional parameters within the tumor have been illustrated as intratumoral changes in oxygenation and hemodynamics caused by vascular dysregulation and venous effects in gliomas [14,16,17,18,19,20,21], suggesting that BOLD signals could reflect the biological characteristics of gliomas.
However, previous studies have mostly adopted univariate analysis on one or several imaging parameters separately, and the adopted parameters were all based on conventional frequency bands (approximately 0.01–0.08 Hz) of BOLD signals. The operations would fail to take full advantage of the fMRI nature with versatile measures and rich intrinsic information [22]. Accordingly, a concept of biomedicine analysis strategy, omics, can comprehensively measure the profiles of structure and functions of the whole makeup of a given biological function by analyzing large amounts of data representing an entire set of genes, proteins, metabolism, etc. [23]. Notably, a recent omics analysis method in medical imaging, radiomics [24,25], can introduce thousands of high-throughput features at one time, followed by various methods for feature selection and model building to seek the best combination of features for clinical prediction, which has the advantage of making full use of multiple indicators. However, feature extraction in radiomics is based on measuring the intensity and morphological characteristics, and the data-driven nature of radiomics inherently offers no insight into the biological underpinnings of observed relationships [26]. A few recent fMRI studies [27,28,29,30] innovatively borrowed tactics of radiomics analysis. Features were extracted from parameters within multiple brain parcellations or based on constructed connectivity between the brain parcellations. However, the parcellation-based fMRI-radiomics analysis concerning spatial information of the whole brain characteristics might be suitable for applying to diseases with overall brain changes, rather than the gliomas with regional brain abnormality.
On the basis that rs-fMRI can provide a large number of imaging metrics describing pathophysiological processes of gliomas, here we intended to propose a novel omics analysis approach, named Regional Parameter of Resting-state fMRI-omics (RP-Rs-fMRIomics), by employing exhaustive regional parameters in a spectrum of specific frequency bands. Subsequently, we evaluated the diagnosis feasibilities of RP-Rs-fMRIomics in grading, molecular typing and prognosis on gliomas. We hypothesized that, in comparison with univariate analysis using single or finite imaging parameters [14,15,16], the RP-Rs-fMRIomics would ensure more precise diagnosis through comprehensive data analysis. On the other hand, in comparison with traditional radiomics with parcellation-based analysis [24,25], the RP-Rs-fMRIomics would be more readable with the explicit meaning of each feature as a certain rs-fMRI parameter at a certain frequency.

2. Material and Methods

2.1. Patients Enrollment

This retrospective study was approved by the Affiliated Jinling Hospital, Medical School of Nanjing University Medical Research Ethics Committee (protocol code 2019NZGKJ-083 and date of approval 5 March 2019). From December 2015 to February 2020, 288 consecutive patients pathologically confirmed for supratentorial WHO II-IV glioma were involved. Among them, 176 glioma patients who met the inclusion criteria were enrolled in this study (Figure 1).

2.2. Clinical Data

Glioma grades were diagnosed on histopathological examinations according to the 2007 or 2016 WHO classification criteria of central nervous system tumors [31,32]. High-grade gliomas (WHO III-IV) were found in 113 cases and low-grade gliomas (WHO II) were found in 63 cases. Isocitrate dehydrogenase (IDH) genetic diagnosis of gliomas was performed in 150 cases out of the 176 patients, with DNA sequencing (n = 112, Sanger sequencing or pyrosequencing) or immunohistochemistry (n = 38, antibody IDH1-R132H) on tumor samples. IDH wild/mutation types were found in 94/56 cases. The patients received partial (n = 86) or gross total (n = 90) resection followed by chemotherapy and radiation. Karnofsky Performance Status (KPS) scores (binary, score >70 or ≤70) [5,33], as a strong independent predictor of clinical outcome [34] determined by postoperative treatment, were retrieved from their electronic medical records. The demographic and clinical information are shown in Table 1.

2.3. MRI Data Acquisition

All patients underwent preoperative MR examinations on a 3.0-T scanner (Discovery MR750 System; GE Medical Systems, Milwaukee, WI, USA) with a 32-channel head coil. They were instructed to keep their eyes closed and stay awake.
Rs-MRI data were acquired using a gradient-echo planar imaging sequence (TR = 1000 ms, TE = 19 ms, FOV = 220 × 220 mm2, in-plane matrix = 64 × 64, flip angle = 75°, slice number = 20, slice thickness = 5 mm, interslice gap = 1.5 mm). Scan time lasted 6 min 45 s, and a total of 405 volumes were acquired.
High-resolution 3D T1WI images were obtained using a 3D-BRAVO sequence after contrast enhancement: TR = 8.2 ms, TE = 3.2 ms, matrix = 256 × 256, slice thickness = 1.0 mm and number of slices = 144. Moreover, routine MR images including pre- and post-enhanced T1WI, T2WI, T2-FLAIR weighted imaging were acquired for radiological diagnosis. About 0.1 mmol/kg of gadolinium chelate contrast was injected for contrast-enhanced imaging.

2.4. Imaging Processing

2.4.1. Data Preprocessing

Rs-fMRI data were preprocessed using SPM 12 (http://www.fil.ion.ucl.ac.uk/spm (access on 8 April 2021))-based toolkit of DPARSF toolbox (DPARSF_V2.3; www.restfmri.net (access on 8 April 2021)) [35], including: (1) discarding the first 5 volumes; (2) slice timing correction; (3) head motion correction; (4) registering to individual 3DT1-CE images; (5) smoothing with a 6 mm FWHM isotropic Gaussian kernel (except for ReHo calculation; for the calculation of Hurst and TSA, including smooth and non-smooth); (6) removing covariates of head motion, white matter signal and cerebrospinal fluid; (7) considering the physiological information contained in potential specificity in different frequency bands, in addition to the frequency range (0.01–0.1 Hz) of BOLD fluctuation, we also divided them into 9 narrow band bins, i.e., each narrow frequency band covered 0.01 Hz. Based on these 10 frequency bands, we reckoned that the measures on the pinpoint frequency fluctuation would increase as much of the information about the BOLD fluctuations and find the optimal frequency sub-band of BOLD effects in gliomas
To comprehensively delineate the features of the BOLD signals within the tumor, we calculated the regional rs-fMRI parameters as much as available currently, including four main parameters: ReHo [8,9], ALFF [7], HE [10,36,37,38] and TSA [39]. Moreover, fraction of ALFF (fALFF) [7,40] as a commonly used variant of ALFF was also calculated. The definition of each parameter is presented in Supplementary Material S1. ReHo and ALFF analyses were performed using rs-fMRI Data Analysis Toolkit (http://resting-fmri.sourceforge.net (accessed on 8 April 2021)), while HE and TSA were calculated using an in-house toolkit in line with methods in Lei et al. [41] and Lv et al. [42]. Moreover, considering the controversy about the physiological meaning of the global signal, we further calculated the above parameters after global regression.

2.4.2. Tumor Segmentation and Feature Extraction

Blinded to all the information of patients, two experienced neuroradiologists manually segmented the tumors into three subregions (enhancement, non-enhancement and peritumor edema areas) slice by slice on 3DT1-CE images using MRIcron software (http://www.nitric.org/projects/mricron (access on 5 February 2021)) (Figure 2). The segmentation of these three subregions refers to the Multimodal Brain Tumor Image Segmentation Benchmark [43]. Then, the regions of interest (ROIs) were co-registered with functional data and normalized to MNI coordinates.
Finally, we adopted 420 features at three levels: 14 parameters (ALFF, fALFF, ReHo, HE, and TSA with and without global regression, and HE, TSA with and without smooth), measured in 10 specific frequency bands, and the values extracted within 3 regions.

2.5. Statistical Analysis

2.5.1. Conventional rs-fMRI Analysis

We calculated the regional parameters in the conventional strategy within frequency at 0.01~0.1Hz in order to perform prediction analysis of each rs-fMRI parameter on gliomas. Receiver operating characteristic (ROC) analysis was performed to measure the diagnostic performance of these indexes based on ROIs for tumor grading, IDH status and prognosis in gliomas. According to the AUC, the best index was chosen for each task.

2.5.2. Feature Selection, RP-Rs-fMRIomics Model Construction and Validation

With 420 features extracted from rs-fMRI, we constructed RP-Rs-fMRIomics models for (1) glioma grades, (2) IDH genotype and (3) prognosis. Our dataset was randomly split into a training set and a testing set (ratio 7:3). A few multiple machine-learning classifiers, including Logistic Regression (LR), Support Vector Machine (SVM), Random Forest (RF), and Linear support vector classification (Linear SVC) were used. Firstly, we used Spearman correlation analysis to alleviate the redundancy between the features. When the linear correlation coefficient between any two independent variables on the training set was greater than 0.9, a feature would be removed. The features which had a high linear correlation coefficient with the dependent variables were preferentially retained. Then, three feature selection methods of F-test, L1-based feature selection with linear models and Tree-based feature selection were utilized for model building.
Fivefold cross-validation and a grid search with F1 score as the optimization goal were carried out on the training set to tune the model hyperparameters, and the performances were tested on the testing set. Considering the area under the receiver operating characteristic (AUROC) [44] and precision−recall curves (AUPRC) [45] could display the accuracy, precision and recall of the model in a more comprehensive way with varying thresholds, an optimal model with the top AUROC and the highest AUPRC was selected for each prediction task. We also performed comparisons of diagnosis performance between each optimal model of conventional rs-fMRI and RP-Rs-fMRIomics using the Delong’s test [46].

3. Results

3.1. Patient Characteristics

There was no significant difference in age, histopathologic grade, IDH status and extent of resection between training and validation sets in the three models (grading, IDH and survival model). The gender of the IDH model and the KPS of the grading and survival models were not statistically different in the training and validation sets (all p > 0.05).
However, the validation set showed a higher proportion of male patients in the grading and survival model (p = 0.019, 0.008) and a higher proportion of patients with KPS > 70 in the IDH model (p = 0.001) (Table 1).

3.2. Performance of Conventional rs-fMRI Analysis

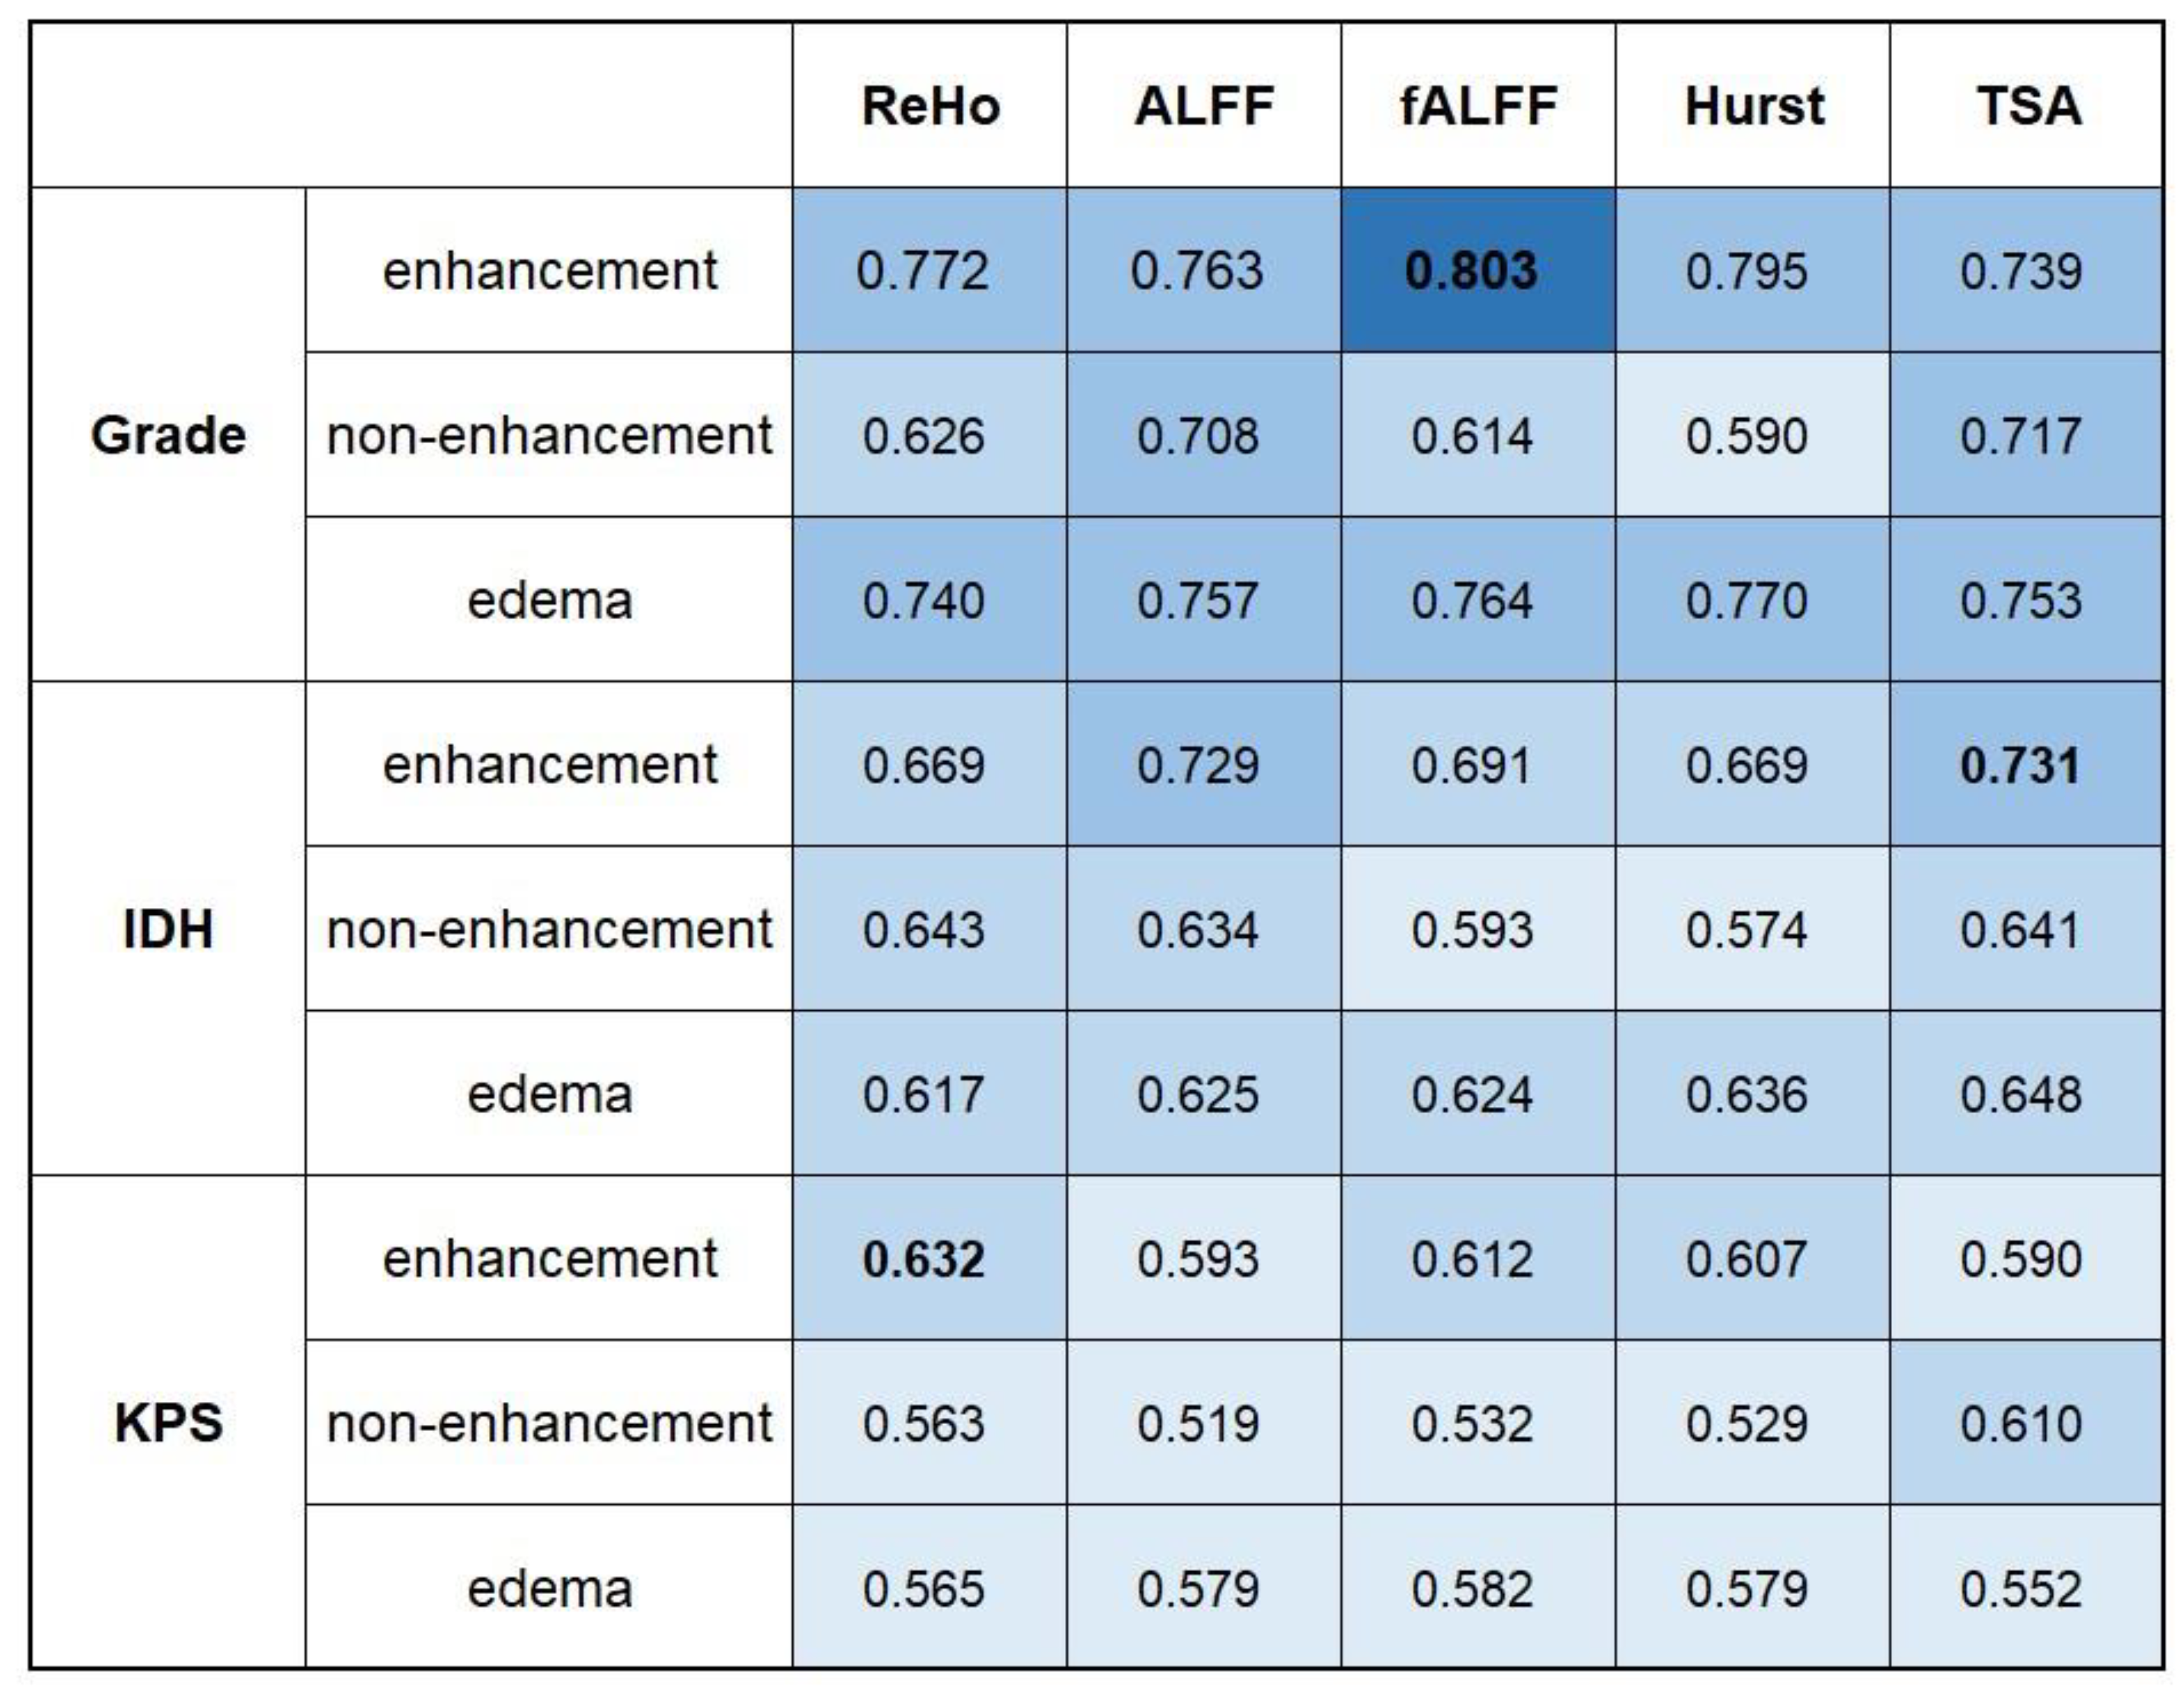
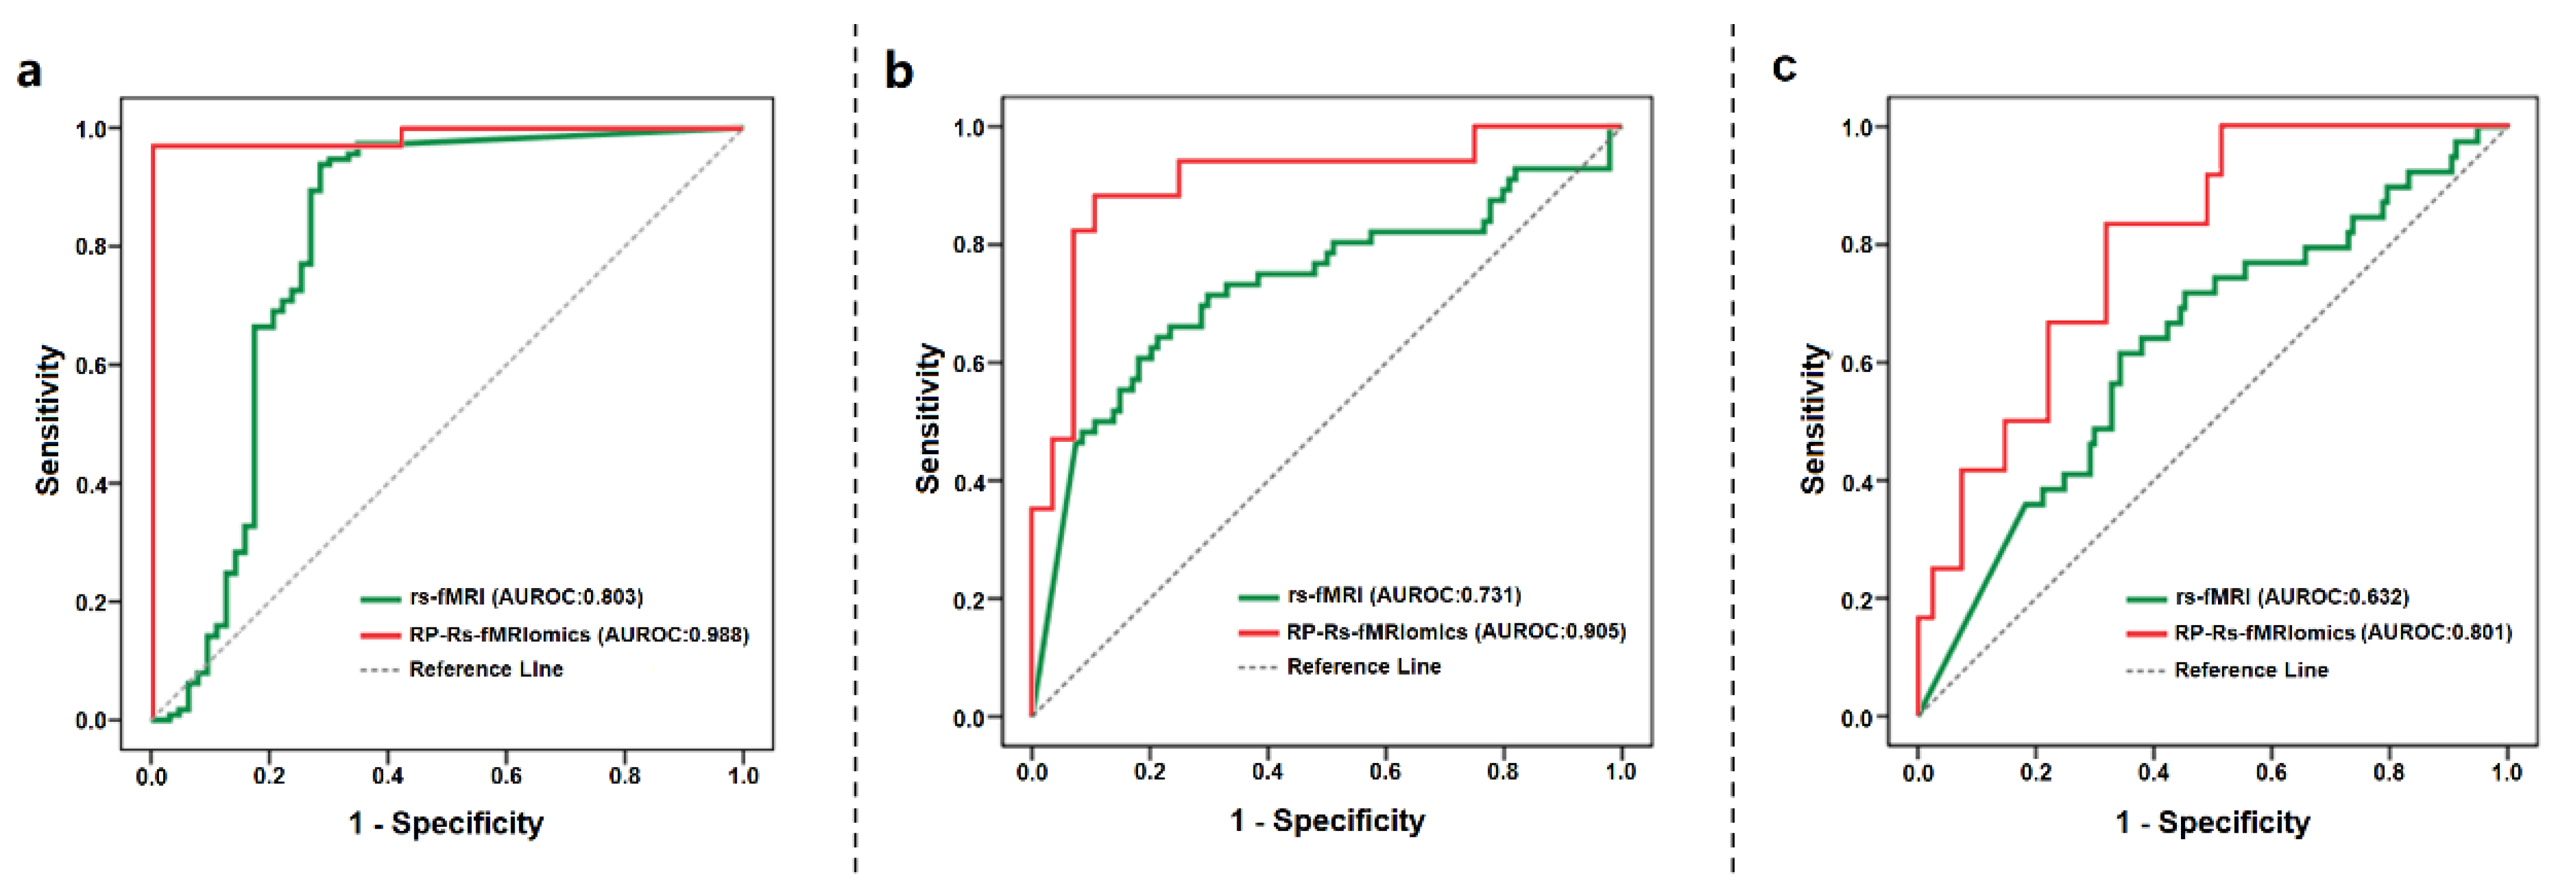
The AUROCs of five conventional indexes based on three ROIs were calculated to quantify the predictive performance of these indexes (Figure 3). According to the AUROC, fALFF, TSA and ReHo based on enhancement ROI achieved slightly higher AUCs of 0.803, 0.731 and 0.632 in tumor grading, IDH status and progression models, respectively. However, there was no statistical significance of the improvement in AUCs above compared with other indexes based on different ROIs (p > 0.0036 for all). The specific p value was shown in Supplementary Materials Table S2. This might be related to our limited amount of data. Therefore, we still chose fALFF, TSA and ReHo based on enhancement ROI as the best models for predicting tumor grading, IDH status and progression, and the ROC curves are presented in Figure 4.

3.3. Performance of RP-Rs-fMRIomics Models

The optimal model for each task was chosen on the training set and validated on the testing set. The RP-Rs-fMRIomics with the optimal hyperparameter configuration showed outstanding performance to predict grading (AUROC 0.988, AUPRC 0.971), IDH (AUROC 0.905, AUPRC 0.824), and survival (AUROC 0.801, AUPRC 0.667) (Table 2). The grading and IDH models combining RF and F test and the survival model combining LR and F test achieved the best classification performances. The hyperparameters search ranges and optimal sets in each model are presented in Supplementary Material S3. The ROC curves of the three models are presented in Figure 4.

3.4. Key Imaging Features in RP-Rs-fMRIomics Models

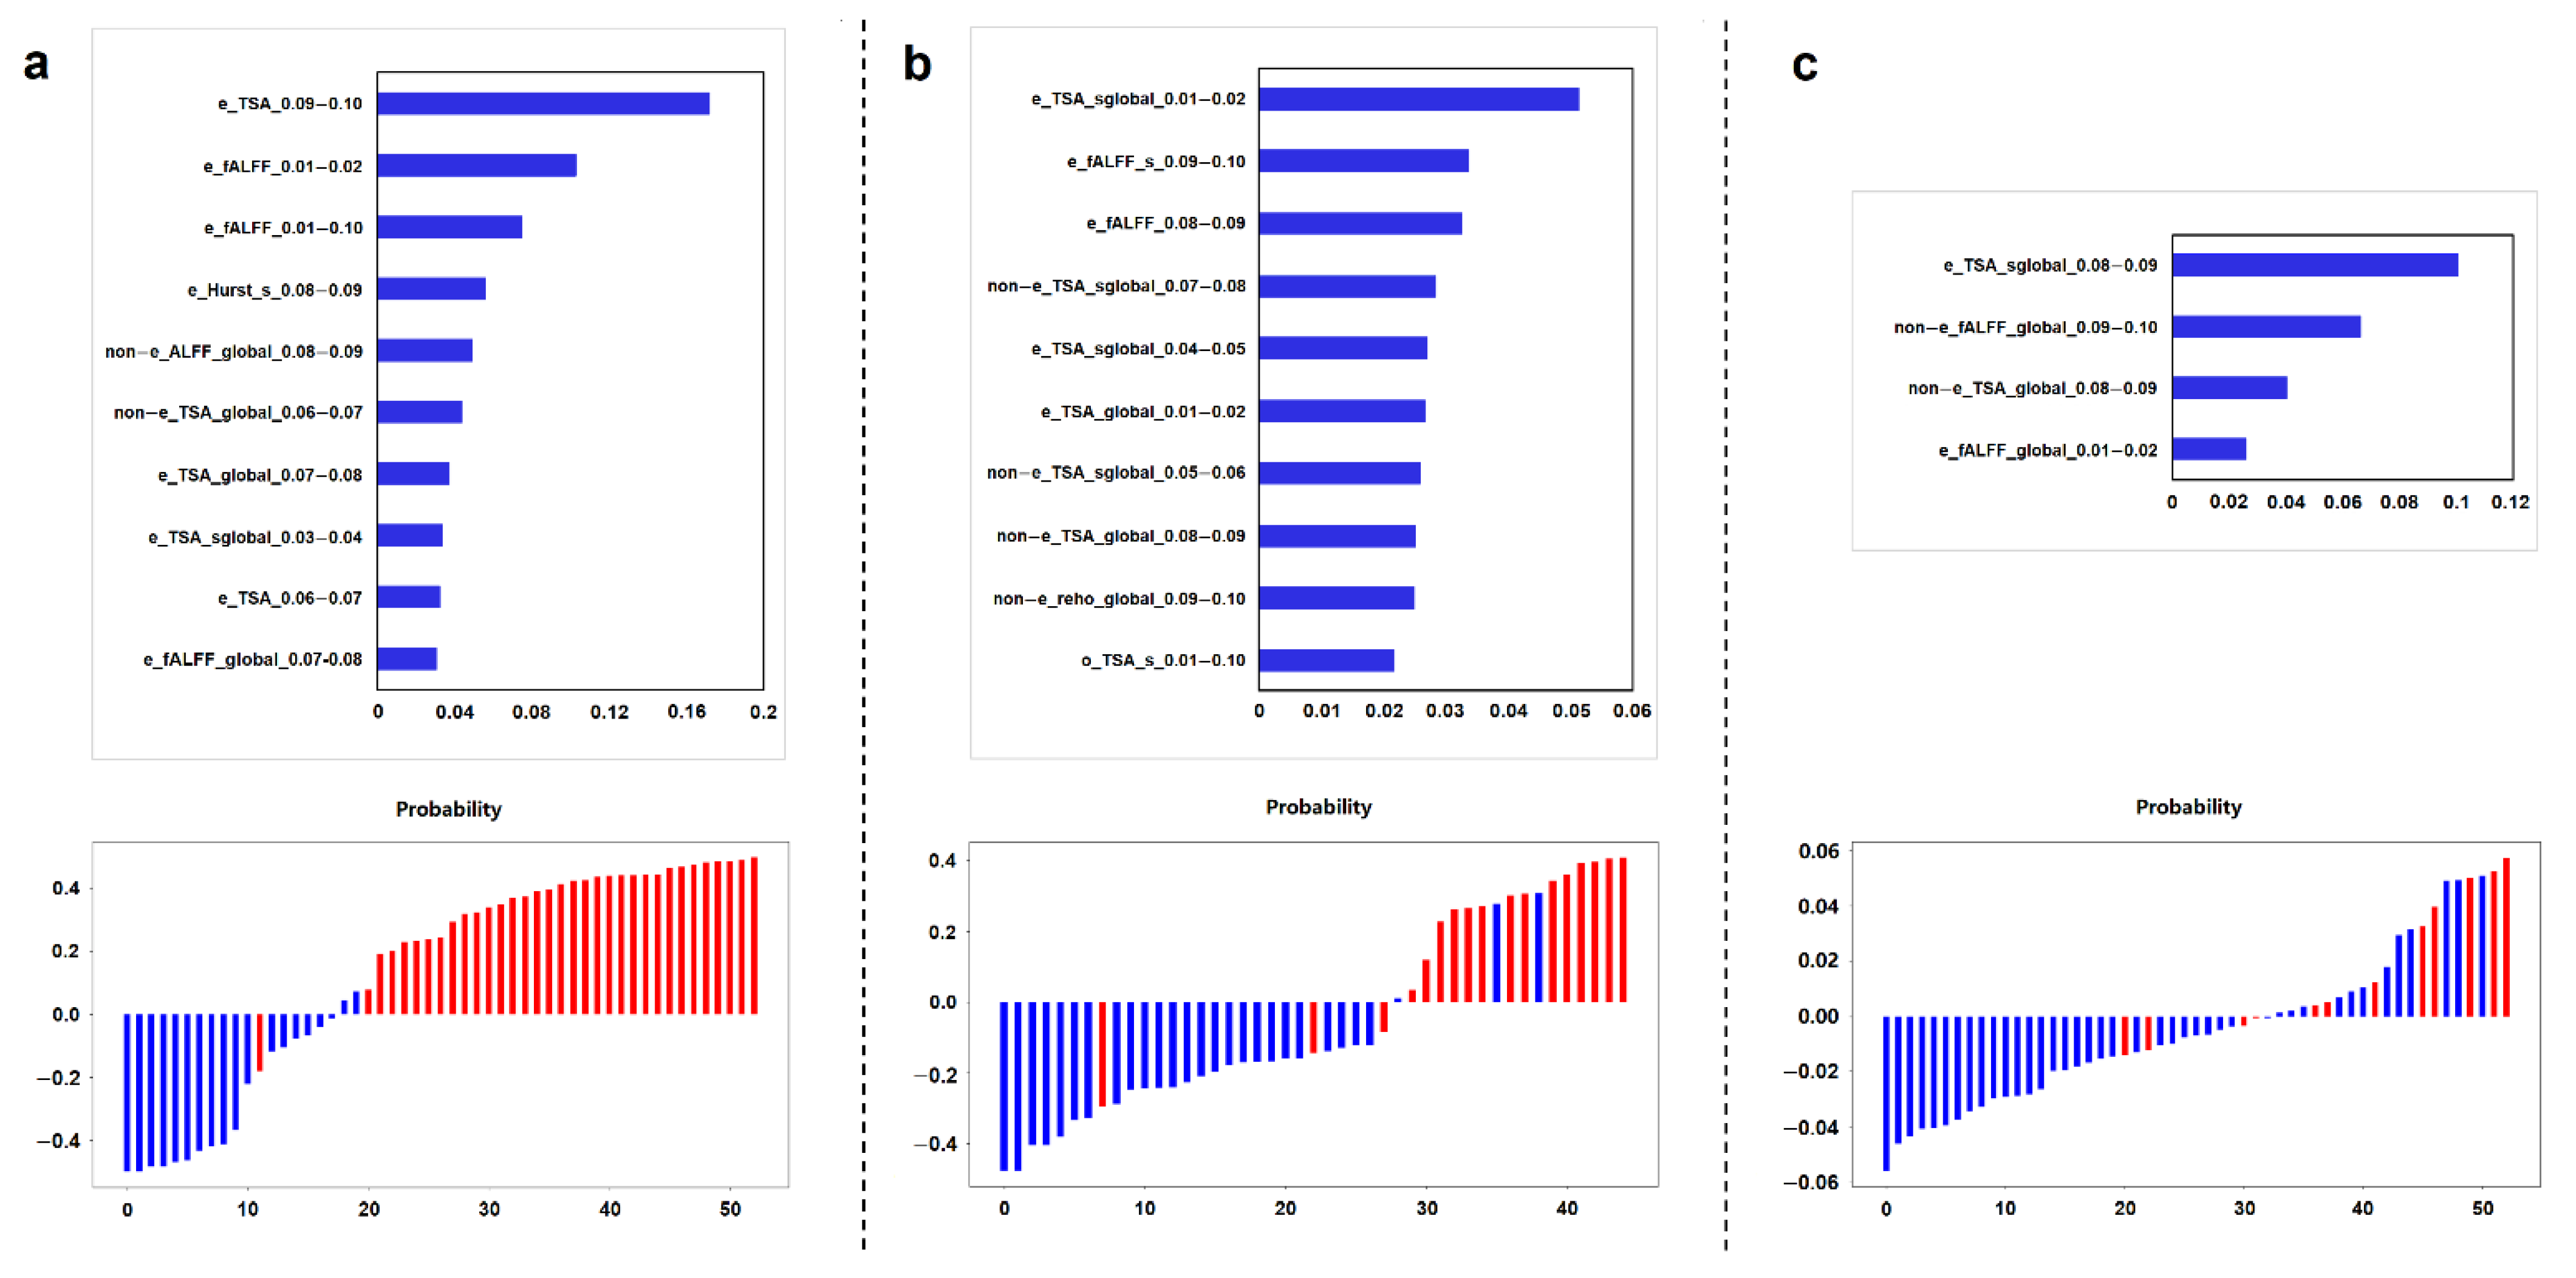
In the grading model, IDH model and survival models, 59 features, 73 features and 4 features were selected, respectively. A detailed feature list of each RP-Rs-fMRIomics model can be found in Supplementary Material Table S4. Figure 5 shows the top 10 importance ranking of RP-Rs-fMRIomics features in both the grading model and IDH model, and 4 importance ranking of RP-Rs-fMRIomics features in the survival model. In terms of parameters, what stood out in the result was TSA-based RP-Rs-fMRIomics features, and they had a large proportion in each model (61.02%, 67.12%, 50.00%). In terms of space, the features of the enhancement area accounted for a large proportion in each model (62.71%, 53.42%, 50.00%). In terms of frequency, RP-Rs-fMRIomics features in the grading model and IDH model were relatively balanced in ten specific frequency bands. However, the high-frequency features distributed between 0.08–0.10 Hz were useful for predicting the prognosis of glioma patients.

3.5. Comparisons of Prediction Performance between Conventional rs-fMRI and RP-Rs-fMRIomics Model

The AUROC of each optimal RP-Rs-fMRIomics model out-performed the corresponding best conventional rs-fMRI index for three prediction tasks (p < 0.0001 in grading model and IDH model, p = 0.0044 in survival model). For tumor grading, two of the first three features of RP-Rs-fMRIomics model were derived from the fALFF parameter, which also performed superiorly in conventional rs-fMRI. In terms of space, whether in the conventional rs-fMRI or RP-Rs-fMRIomics model, the features of the tumor enhancement area were very important for each clinical task.

4. Discussion

In this work, based on a large number of regional parameters of rs-fMRI comprehensively and meticulously extracted in specific parts of gliomas, we innovatively introduced omics analysis and proposed a novel concept of RP-Rs-fMRIomics analysis. With a pilot study by applying the method to prediction diagnosis of brain gliomas, we found that the method presented superior performance in tumor grade, molecular type and prognosis of brain gliomas, with significant improvement relative to the conventional rs-fMRI methods. Featuring high interpretability, this RP-Rs-fMRIomics contributed a new method for brain tumor research and also expanded the clinical application of rs-fMRI.
By proposing a novel technique of RP-Rs-fMRIomics, we extract comprehensive rs-fMRI features for clinical prediction. Many previous studies [5,14,15,47] have adopted only limited parameters in specific frequency bands, according to the researchers’ best prior knowledge, inevitably neglecting other potentially useful information. On the other hand, our RP-Rs-fMRIomics has the advantage of full coverage of rs-fMRI indexes, including parameters, frequency and space information, and can reflect rich physiological information. Moreover, in previous studies [48,49,50], the common radiomics analysis strategy was making various clinical predictions based on tumor attributes and engineering complex image descriptors inside or nearby the tumors. It is difficult to fully understand the biological meaning of the numerical data derived from the analysis, such as texture features [51] and wavelet transform features [52]. Compared with radiomics, the features of RP-Rs-fMRIomics are more interpretable, which can well define the specific parameter in a specific frequency band and lesion area. Recently, functional connectomics, based on the combination of radiomics and functional connectivity, has been used to predict individualized overall survival time of glioma patients [27]. However, to some extent, the network metrics at the whole brain level lack a certain logic in reflecting the attributes of the tumor itself because of spatial heterogeneity in gliomas. In contrast, our RP-Rs-fMRIomics would be more logical for using regional parameters within the tumor to construct models.
Of note, as a prediction study, our RP-Rs-fMRIomics has achieved excellent performance in predicting tumor grade, molecular type and prognosis in gliomas, compared with conventional rs-fMRI. Several rs-fMRI studies [14,15,16] showed that quantification of spontaneous fluctuations—such as parameters power spectra, signal intensity correlation, ALFF, fALFF and TSA—had the potential for distinguishing between high- and low-grade gliomas (AUROC:0.67–0.89). These results were similar to our conventional rs-fMRI, but the AUROCs were significantly lower than those of our RP-Rs-fMRIomics. Additionally, Englander et al. [47] observed greater vascular dysfunction outside the identifiable margins in IDH wide-type tumors than in IDH mutant tumors, and showed that rs-fMRI was highly predictive of the IDH mutation. Petridis et al. [18] used rs-fMRI to measure asynchrony in vascular dynamics measured to quantify the tumor burden and infiltration degree in IDH-mutated gliomas. In accordance with previously reported research, patients with high postoperative KPS (KPS > 70) had longer survival times. Daniel et al. [5] and Liu et al. [27] have highlighted that the rs-fMRI and the strength of functional connectivity have prognostic value and can predict the overall survival time of gliomas. Relative to the previous studies [53,54,55,56,57,58,59], our RP-Rs-fMRIomics models for predicting tumor grading and IDH status presented comparable or even better performances to the radiomics models. Hence, our study indicated that RP-Rs-fMRIomics could be a promising application in various clinical predictions of gliomas.
With significantly increased prediction accuracy of tumor grading, IDH status and KPS, we can further analyze which RP-Rs-fMRIomics features could contribute to these predictions and why. Our results showed that TSA-based RP-Rs-fMRIomics features and enhancement region-based features were more prominent in various prediction models. As previous studies reported, BOLD signals contain not only information about local blood flow but also oxygen consumption [60], which can be used to evaluate the damaged hemodynamic status or severity [61]. TSA has recently been used to assess pathophysiological events related to hemodynamics [42,61,62] and provides a high spatial correspondence with the hypoperfusion area defined by DSC-PWI on the individual level. Gupta et al. [16] tried to use TSA to characterize tumor vascularity in gliomas by observing the aberrant dynamics of tumor vascular and corresponding blood perfusion. They found that TSA was significantly different between high-grade and low-grade, with advanced TSA in high-grade gliomas. Because the increase in tumor vascularization and the decrease in microvascular blood flow resistance may advance hemodynamics, TSA plays an important role in tumor grading, IDH status and prognosis prediction. Many studies [63,64,65] have revealed the microenvironmental heterogeneity in gliomas, such as histologic heterogeneity composed of tumor cells and different stromal cells, and cell heterogeneity with extensive genetic and epigenetic variations. Recent studies [56,66,67,68] have highlighted the value of multiregional image analysis. Li et al. [57] found that, for predicting glioblastoma IDH1 status, the multiregional model built with all region features outperformed the single region models. However, in the single region model, the model constructed by enhancement area achieved the highest AUROC in the primary cohort. The result of this part is consistent with that of our research. The contrast enhancement indicates an interruption and leakage of the blood−brain barrier, which is mainly found in the area of a highly vascular tumor [69,70]. Compared with other regions, the enhancement area may better reflect the pathophysiological mechanism of the tumor and is conducive to clinical evaluation.
Several limitations should be noted. First, our study only employed a single-center dataset. Independent data from multiple centers were warranted for external validation. Second, the ten specific frequency divisions for BOLD signals were arbitrary. Third, we only employed the regional parameters of rs-fMRI that were commonly used and were within the reach of our ability. Finally, this was a pilot application study, and further studies are needed to better understand this disease.

5. Conclusions

Based on exhaustive regional parameters of rs-fMRI and by adopting an omics analysis tactic, we proposed an RP-Rs-fMRIomics analysis. With an entire investigation of the data and the high interpretability of the results, the RP-Rs-fMRIomics outperformed traditional rs-fMRI in the prediction of tumor grade, molecular type and prognosis of gliomas. The RP-Rs-fMRIomics expanded the clinical application of rs-fMRI and could be used as a novel strategy for the diagnosis of gliomas.

Supplementary Materials

The following supporting information can be downloaded at: https://www.mdpi.com/article/10.3390/cancers14122818/s1, Supplementary Material S1: The definition of regional rs-fMRI parameters, Table S1: p values of DeLong analysis among the AUROCs of five conventional indexes based on three ROIs, Supplementary Material S2: Hyperparameters for model optimization, Table S2: Detailed imaging features in RP-Rs-fMRIomics models.

Author Contributions

Conceptualization, X.L. and Z.Z.; Methodology, X.L., Q.X., Q.Z. and Z.Z.; Software, Q.X. and Q.Z.; Validation, X.L., and J.L.; Formal Analysis, X.L.; Investigation, X.L., J.L. and X.Z.; Resources, H.P., Q.X. and N.W.; Data Curation, X.L., J.L. and X.Z.; Writing—Original Draft Preparation, X.L.; Writing—Review and Editing, Z.Z.; Visualization, X.L.; Supervision, J.L. and Z.Z.; Project Administration, X.L., J.L. and Z.Z.; Funding Acquisition, G.L. and Z.Z. All authors have read and agreed to the published version of the manuscript.

Funding

This research was funded by grants from the National Key Technology (R&D) Program of the Ministry of Science and Technology (2018YFA0701703 to Z.Z.); the National Science and Technology Innovation 2030−Major program of “Brain Science and Brain-Like Research” (2022ZD0211800 to Z.Z.); Xuzhou Medical University Open Fund Project (XYKF202101 to Z.Z.); the National Key R&D Program of China (2020AAA0109505 to G.L.); and the National Natural Science Foundation of China (82127806 to G.L.).

Institutional Review Board Statement

The study was conducted according to the guidelines of the Declaration of Helsinki and approved by the Institutional Medical Research Ethics Committee of Affiliated Jinling Hospital, Medical School of Nanjing University (protocol code 2019NZGKJ-083 and date of approval 5 March 2019).

Informed Consent Statement

Patient consent was waived due to this retrospective analysis.

Data Availability Statement

The datasets used in the current study are available from the corresponding author on reasonable request.

Conflicts of Interest

The authors declare no conflict of interest.

References

  1. Lee, M.H.; Smyser, C.D.; Shimony, J.S. Resting-State fMRI: A Review of Methods and Clinical Applications. Am. J. Neuroradiol. 2013, 34, 1866–1872. [Google Scholar] [CrossRef] [PubMed] [Green Version]
  2. Biswal, B.B. Resting state fMRI: A personal history. Neuroimage 2012, 62, 938–944. [Google Scholar] [CrossRef] [PubMed]
  3. Fox, M.D.; Raichle, M.E. Spontaneous fluctuations in brain activity observed with functional magnetic resonance imaging. Nat. Rev. Neurosci. 2007, 8, 700–711. [Google Scholar] [CrossRef]
  4. Zhang, D.; Raichle, M.E. Disease and the brain’s dark energy. Nat. Rev. Neurol. 2010, 6, 15–28. [Google Scholar] [CrossRef] [PubMed]
  5. Daniel, A.G.S.; Park, K.Y.; Roland, J.L.; Dierker, D.; Gross, J.; Humphries, J.B.; Hacker, C.D.; Snyder, A.Z.; Shimony, J.S.; Leuthardt, E.C. Functional connectivity within glioblastoma impacts overall survival. Neuro-Oncology 2021, 23, 412–421. [Google Scholar] [CrossRef]
  6. Yuan, B.K.; Zhang, N.; Yan, J.; Cheng, J.L.; Lu, J.F.; Wu, J.S. Tumor grade-related language and control network reorganization in patients with left cerebral glioma. Cortex 2020, 129, 141–157. [Google Scholar] [CrossRef] [PubMed]
  7. Zou, Q.H.; Zhu, C.Z.; Yang, Y.H.; Zuo, X.N.; Long, X.Y.; Cao, Q.J.; Wang, Y.F.; Zang, Y.F. An improved approach to detection of amplitude of low-frequency fluctuation (ALFF) for resting-state fMRI: Fractional ALFF. J. Neurosci. Methods 2008, 172, 137–141. [Google Scholar] [CrossRef] [Green Version]
  8. Zang, Y.F.; Jiang, T.Z.; Lu, Y.L.; He, Y.; Tian, L.X. Regional homogeneity approach to fMRI data analysis. Neuroimage 2004, 22, 394–400. [Google Scholar] [CrossRef] [PubMed]
  9. Jiang, L.L.; Zuo, X.N. Regional Homogeneity: A Multimodal, Multiscale Neuroimaging Marker of the Human Connectome. Neuroscientist 2016, 22, 486–505. [Google Scholar] [CrossRef]
  10. Maxim, V.; Sendur, L.; Fadili, J.; Suckling, J.; Gould, R.; Howard, R.; Bullmore, E.T. Fractional Gaussian noise, functional MRI and Alzheimer’s disease. Neuroimage 2005, 25, 141–158. [Google Scholar] [CrossRef] [PubMed] [Green Version]
  11. Chen, Q.; Zhou, J.S.; Zhang, H.; Chen, Y.C.; Mao, C.N.; Chen, X.L.; Ni, L.; Zhuo, Z.Z.; Zhang, Y.D.; Geng, W.; et al. One-step analysis of brain perfusion and function for acute stroke patients after reperfusion: A resting-state fMRI study. J. Magn. Reson. Imaging 2019, 50, 221–229. [Google Scholar] [CrossRef]
  12. Stoecklein, V.M.; Stoecklein, S.; Galie, F.; Ren, J.X.; Schmutzer, M.; Unterrainer, M.; Albert, N.L.; Kreth, F.W.; Thon, N.; Liebig, T.; et al. Resting-state fMRI detects alterations in whole brain connectivity related to tumor biology in glioma patients. Neuro-Oncology 2020, 22, 1388–1398. [Google Scholar] [CrossRef]
  13. Haberg, A.; Kvistad, K.A.; Unsgard, G.; Haraldseth, O. Preoperative blood oxygen level-dependent functional magnetic resonance imaging in patients with primary brain tumors: Clinical application and outcome. Neurosurgery 2004, 54, 902–914. [Google Scholar] [CrossRef]
  14. Metwali, H.; Raemaekers, M.; Ibrahim, T.; Samii, A. The Fluctuations of Blood Oxygen Level-Dependent Signals as a Method of Brain Tumor Characterization: A Preliminary Report. World Neurosurg. 2020, 142, E10–E17. [Google Scholar] [CrossRef]
  15. Wu, J.F.; Qian, Z.Y.; Tao, L.; Yin, J.H.; Ding, S.W.; Zhang, Y.M.; Yu, Z. Resting state fMRI feature-based cerebral glioma grading by support vector machine. Int. J. Comput. Assist. Radiol. Surg. 2015, 10, 1167–1174. [Google Scholar] [CrossRef] [PubMed]
  16. Gupta, L.; Gupta, R.K.; Postma, A.A.; Sahoo, P.; Gupta, P.K.; Patir, R.; Ahlawat, S.; Saha, I.; Backes, W.H. Advanced and Amplified BOLD Fluctuations in High-Grade Gliomas. J. Magn. Reson. Imaging 2018, 47, 1616–1625. [Google Scholar] [CrossRef]
  17. Holodny, A.I.; Schulder, M.; Liu, W.C.; Wolko, J.; Maldjian, J.A.; Kalnin, A.J. The effect of brain tumors on BOLD functional MR imaging activation in the adjacent motor cortex: Implications for image-guided neurosurgery. Am. J. Neuroradiol. 2000, 21, 1415–1422. [Google Scholar] [PubMed]
  18. Petridis, P.D.; Horenstein, C.; Pereira, B.; Wu, P.; Samanamud, J.; Marie, T.; Boyett, D.; Sudhakar, T.; Sheth, S.A.; McKhann, G.M.; et al. BOLD Asynchrony Elucidates Tumor Burden in IDH-Mutated Gliomas. Neuro-Oncology 2022, 24, 78–87. [Google Scholar] [CrossRef] [PubMed]
  19. Chow, D.S.; Horenstein, C.I.; Canoll, P.; Lignelli, A.; Hillman, E.M.C.; Filippi, C.G.; Grinband, J. Glioblastoma Induces Vascular Dysregulation in Nonenhancing Peritumoral Regions in Humans. Am. J. Roentgenol. 2016, 206, 1073–1081. [Google Scholar] [CrossRef] [Green Version]
  20. Maralani, P.J.; Das, S.; Mainprize, T.; Phan, N.; Bharatha, A.; Keith, J.; Munoz, D.G.; Sahgal, A.; Symons, S.; Ironside, S.; et al. Hypoxia Detection in Infiltrative Astrocytoma: Ferumoxytol-based Quantitative BOLD MRI with Intraoperative and Histologic Validation. Radiology 2018, 288, 821–829. [Google Scholar] [CrossRef] [Green Version]
  21. Agarwal, S.; Sair, H.I.; Yahyavi-Firouz-Abadi, N.; Airan, R.; Pillai, J.J. Neurovascular Uncoupling in Resting State fMRI Demonstrated in Patients With Primary Brain Gliomas. J. Magn. Reson. Imaging 2016, 43, 620–626. [Google Scholar] [CrossRef]
  22. Logothetis, N.K. What we can do and what we cannot do with fMRI. Nature 2008, 453, 869–878. [Google Scholar] [CrossRef] [PubMed]
  23. Olivier, M.; Asmis, R.; Hawkins, G.A.; Howard, T.D.; Cox, L.A. The Need for Multi-Omics Biomarker Signatures in Precision Medicine. Int. J. Mol. Sci. 2019, 20, 4781. [Google Scholar] [CrossRef] [PubMed] [Green Version]
  24. Gillies, R.J.; Kinahan, P.E.; Hricak, H. Radiomics: Images Are More than Pictures, They Are Data. Radiology 2016, 278, 563–577. [Google Scholar] [CrossRef] [PubMed] [Green Version]
  25. Aerts, H.; Velazquez, E.R.; Leijenaar, R.T.H.; Parmar, C.; Grossmann, P.; Cavalho, S.; Bussink, J.; Monshouwer, R.; Haibe-Kains, B.; Rietveld, D.; et al. Decoding tumour phenotype by noninvasive imaging using a quantitative radiomics approach. Nat. Commun. 2014, 5, 8. [Google Scholar] [CrossRef] [PubMed]
  26. Tomaszewski, M.R.; Gillies, R.J. The Biological Meaning of Radiomic Features. Radiology 2021, 299, E256. [Google Scholar] [CrossRef] [PubMed]
  27. Liu, L.Y.; Zhang, H.; Wu, J.S.; Yu, Z.D.; Chen, X.B.; Rekik, I.; Wang, Q.; Lu, J.F.; Shen, D.G. Overall survival time prediction for high-grade glioma patients based on large-scale brain functional networks. Brain Imaging Behav. 2019, 13, 1333–1351. [Google Scholar] [CrossRef] [Green Version]
  28. Sun, K.; Liu, Z.; Chen, G.; Zhou, Z.; Zhong, S.; Tang, Z.; Wang, S.; Zhou, G.; Zhou, X.; Shao, L.; et al. A two-center radiomic analysis for differentiating major depressive disorder using multi-modality MRI data under different parcellation methods. J. Affect. Disord. 2022, 300, 1–9. [Google Scholar] [CrossRef] [PubMed]
  29. Wang, Y.; Sun, K.; Liu, Z.; Chen, G.; Jia, Y.; Zhong, S.; Pan, J.; Huang, L.; Tian, J. Classification of Unmedicated Bipolar Disorder Using Whole-Brain Functional Activity and Connectivity: A Radiomics Analysis. Cereb. Cortex 2020, 30, 1117–1128. [Google Scholar] [CrossRef]
  30. Zhang, B.; Liu, S.; Liu, X.; Chen, S.; Ke, Y.; Qi, S.; Wei, X.; Ming, D. Discriminating subclinical depression from major depression using multi-scale brain functional features: A radiomics analysis. J. Affect. Disord. 2022, 297, 542–552. [Google Scholar] [CrossRef]
  31. Louis, D.N.; Ohgaki, H.; Wiestler, O.D.; Cavenee, W.K.; Burger, P.C.; Jouvet, A.; Scheithauer, B.W.; Kleihues, P. The 2007 WHO classification of tumours of the central nervous system. Acta Neuropathol. 2007, 114, 97–109. [Google Scholar] [CrossRef] [Green Version]
  32. Louis, D.N.; Perry, A.; Reifenberger, G.; von Deimling, A.; Figarella-Branger, D.; Cavenee, W.K.; Ohgaki, H.; Wiestler, O.D.; Kleihues, P.; Ellison, D.W. The 2016 World Health Organization Classification of Tumors of the Central Nervous System: A summary. Acta Neuropathol. 2016, 131, 803–820. [Google Scholar] [CrossRef] [Green Version]
  33. Park, J.E.; Kim, H.S.; Jo, Y.; Yoo, R.E.; Choi, S.H.; Nam, S.J.; Kim, J.H. Radiomics prognostication model in glioblastoma using diffusion- and perfusion-weighted MRI. Sci. Rep. 2020, 10, 9. [Google Scholar] [CrossRef]
  34. Pan, Z.Q.; Zhang, S.J.; Wang, X.L.; Jiao, Y.X.; Qiu, J.J. Machine Learning Based on a Multiparametric and Multiregional Radiomics Signature Predicts Radiotherapeutic Response in Patients with Glioblastoma. Behav. Neurol. 2020, 2020, 1712604. [Google Scholar] [CrossRef]
  35. Chao-Gan, Y.; Yu-Feng, Z. DPARSF: A MATLAB Toolbox for “Pipeline” Data Analysis of Resting-State fMRI. Front. Syst. Neurosci. 2010, 4, 13. [Google Scholar] [CrossRef] [Green Version]
  36. He, B.Y.J. Scale-Free Properties of the Functional Magnetic Resonance Imaging Signal during Rest and Task. J. Neurosci. 2011, 31, 13786–13795. [Google Scholar] [CrossRef] [PubMed] [Green Version]
  37. He, B.Y.J.; Zempel, J.M.; Snyder, A.Z.; Raichle, M.E. The Temporal Structures and Functional Significance of Scale-free Brain Activity. Neuron 2010, 66, 353–369. [Google Scholar] [CrossRef] [PubMed] [Green Version]
  38. Dehghani, N.; Hatsopoulos, N.G.; Haga, Z.D.; Parker, R.A.; Greger, B.; Halgren, E.; Cash, S.S.; Destexhe, A. Avalanche analysis from multielectrode ensemble recordings in cat, monkey, and human cerebral cortex during wakefulness and sleep. Front. Physiol. 2012, 3, 18. [Google Scholar] [CrossRef] [Green Version]
  39. Lv, Y.T.; Wei, W.; Song, Y.L.; Han, Y.; Zhou, C.S.; Zhou, D.; Zhang, F.D.; Xue, Q.M.; Liu, J.L.; Zhao, L.J.; et al. Non-invasive evaluation of cerebral perfusion in patients with transient ischemic attack: An fMRI study. J. Neurol. 2019, 266, 157–164. [Google Scholar] [CrossRef]
  40. Wang, C.; Shen, Z.J.; Huang, P.Y.; Yu, H.L.; Qian, W.; Guan, X.J.; Gu, Q.Q.; Yang, Y.H.; Zhang, M.M. Altered spontaneous brain activity in chronic smokers revealed by fractional ramplitude of lowfrequency fluctuation analysis: A preliminary study. Sci. Rep. 2017, 7, 7. [Google Scholar] [CrossRef] [Green Version]
  41. Lei, X.; Zhao, Z.Y.; Chen, H. Extraversion is encoded by scale-free dynamics of default mode network. Neuroimage 2013, 74, 52–57. [Google Scholar] [CrossRef]
  42. Lv, Y.T.; Margulies, D.S.; Craddock, R.C.; Long, X.Y.; Winter, B.; Gierhake, D.; Endres, M.; Villringer, K.; Fiebach, J.; Villringer, A. Identifying the Perfusion Deficit in Acute Stroke with Resting-State Functional Magnetic Resonance Imaging. Ann. Neurol. 2013, 73, 136–139. [Google Scholar] [CrossRef] [PubMed]
  43. Menze, B.H.; Jakab, A.; Bauer, S.; Kalpathy-Cramer, J.; Farahani, K.; Kirby, J.; Burren, Y.; Porz, N.; Slotboom, J.; Wiest, R.; et al. The Multimodal Brain Tumor Image Segmentation Benchmark (BRATS). IEEE Trans. Med. Imaging 2015, 34, 1993–2024. [Google Scholar] [CrossRef]
  44. Hanley, J.A.; McNeil, B.J. A method of comparing the areas under receiver operating characteristic curves derived from the same cases. Radiology 1983, 148, 839–843. [Google Scholar] [CrossRef] [Green Version]
  45. Saito, T.; Rehmsmeier, M. The Precision-Recall Plot Is More Informative than the ROC Plot When Evaluating Binary Classifiers on Imbalanced Datasets. PLoS ONE 2015, 10, e0118432. [Google Scholar] [CrossRef] [Green Version]
  46. Delong, E.R.; Delong, D.M.; Clarkepearson, D.I. Comparing the areas under 2 or more correlated receiver operating characteristic curves—A nonparametric approach. Biometrics 1988, 44, 837–845. [Google Scholar] [CrossRef]
  47. Englander, Z.K.; Horenstein, C.I.; Bowden, S.G.; Chow, D.S.; Otten, M.L.; Lignelli, A.; Bruce, J.N.; Canoll, P.; Grinband, J. Extent of BOLD Vascular Dysregulation Is Greater in Diffuse Gliomas without Isocitrate Dehydrogenase 1 R132H Mutation. Radiology 2018, 287, 965–972. [Google Scholar] [CrossRef]
  48. Su, X.R.; Chen, N.; Sun, H.Q.; Liu, Y.H.; Yang, X.B.; Wang, W.N.; Zhang, S.M.; Tan, Q.Y.; Su, J.K.; Gong, Q.Y.; et al. Automated machine learning based on radiomics features predicts H3 K27M mutation in midline gliomas of the brain. Neuro-Oncolpgy 2020, 22, 393–401. [Google Scholar] [CrossRef]
  49. Zhuo, Z.Z.; Qu, L.Y.; Zhang, P.; Duan, Y.Y.; Cheng, D.; Xu, X.L.; Sun, T.; Ding, J.L.; Xie, C.; Liu, X.; et al. Prediction of H3K27M-mutant brainstem glioma by amide proton transfer-weighted imaging and its derived radiomics. Eur. J. Nucl. Med. Mol. Imaging 2021, 48, 4426–4436. [Google Scholar] [CrossRef] [PubMed]
  50. Lu, C.F.; Hsu, F.T.; Hsieh, K.L.C.; Kao, Y.C.J.; Cheng, S.J.; Hsu, J.B.K.; Tsai, P.H.; Chen, R.J.; Huang, C.C.; Yen, Y.; et al. Machine Learning-Based Radiomics for Molecular Subtyping of Gliomas. Clin. Cancer Res. 2018, 24, 4429–4436. [Google Scholar] [CrossRef] [Green Version]
  51. Liu, X.X.; Li, J.R.; Liao, X.; Luo, Z.Q.; Xu, Q.; Pan, H.; Zhou, Q.; Tao, Y.; Shi, F.; Lu, G.M.; et al. Radiomics-based MRI for predicting Erythropoietin-producing hepatocellular receptor A2 expression and tumor grade in brain diffuse gliomas. Neuroradiology 2022, 64, 323–331. [Google Scholar] [CrossRef]
  52. Li, M.M.; Wang, H.F.; Shang, Z.G.; Yang, Z.L.; Zhang, Y.; Wan, H. Ependymoma and pilocytic astrocytoma: Differentiation using radiomics approach based on machine learning. J. Clin. Neurosci. 2020, 78, 175–180. [Google Scholar] [CrossRef]
  53. Tan, Y.; Zhang, S.T.; Wei, J.W.; Dong, D.; Wang, X.C.; Yang, G.Q.; Tian, J.; Zhang, H. A radiomics nomogram may improve the prediction of IDH genotype for astrocytoma before surgery. Eur. Radiol. 2019, 29, 3325–3337. [Google Scholar] [CrossRef]
  54. Wu, S.; Meng, J.; Yu, Q.; Li, P.; Fu, S. Radiomics-based machine learning methods for isocitrate dehydrogenase genotype prediction of diffuse gliomas. J. Cancer Res. Clin. Oncol. 2019, 145, 543–550. [Google Scholar] [CrossRef] [PubMed] [Green Version]
  55. Arita, H.; Kinoshita, M.; Kawaguchi, A.; Takahashi, M.; Narita, Y.; Terakawa, Y.; Tsuyuguchi, N.; Okita, Y.; Nonaka, M.; Moriuchi, S.; et al. Lesion location implemented magnetic resonance imaging radiomics for predicting IDH and TERT promoter mutations in grade II/III gliomas. Sci. Rep. 2018, 8, 11773. [Google Scholar] [CrossRef] [Green Version]
  56. Li, Z.C.; Bai, H.M.; Sun, Q.C.; Zhao, Y.S.; Lv, Y.C.; Zhou, J.; Liang, C.F.; Chen, Y.S.; Liang, D.; Zheng, H.R. Multiregional radiomics profiling from multiparametric MRI: Identifying an imaging predictor of IDH1 mutation status in glioblastoma. Cancer Med. 2018, 7, 5999–6009. [Google Scholar] [CrossRef] [Green Version]
  57. Kim, M.; Jung, S.Y.; Park, J.E.; Jo, Y.; Park, S.Y.; Nam, S.J.; Kim, J.H.; Kim, H.S. Diffusion- and perfusion-weighted MRI radiomics model may predict isocitrate dehydrogenase (IDH) mutation and tumor aggressiveness in diffuse lower grade glioma. Eur. Radiol. 2020, 30, 2142–2151. [Google Scholar] [CrossRef]
  58. Hashido, T.; Saito, S.; Ishida, T. A radiomics-based comparative study on arterial spin labeling and dynamic susceptibility contrast perfusion-weighted imaging in gliomas. Sci. Rep. 2020, 10, 6121. [Google Scholar] [CrossRef] [Green Version]
  59. Cho, H.H.; Park, H. Classification of Low-grade and High-grade Glioma using Multi-modal Image Radiomics Features. In Proceedings of the 2017 39th Annual International Conference of the IEEE Engineering in Medicine and Biology Society (EMBC), Jeju, Korea, 11–15 July 2017; pp. 3081–3084. [Google Scholar]
  60. Villringer, A.; Dirnagl, U. Coupling of brain activity and cerebral blood-flow—Basis of functional neuroimaging. Cerebrovasc. Brain Metab. Rev. 1995, 7, 240–276. [Google Scholar]
  61. Ni, L.; Li, J.W.; Li, W.P.; Zhou, F.; Wang, F.F.; Schwarz, C.G.; Liu, R.Y.; Zhao, H.; Wu, W.B.; Zhang, X.; et al. The value of resting-state functional MRI in subacute ischemic stroke: Comparison with dynamic susceptibility contrast-enhanced perfusion MRI. Sci. Rep. 2017, 7, 41586. [Google Scholar] [CrossRef]
  62. Amemiya, S.; Kunimatsu, A.; Saito, N.; Ohtomo, K. Cerebral Hemodynamic Impairment: Assessment with Resting-State Functional MR Imaging. Radiology 2014, 270, 548–555. [Google Scholar] [CrossRef] [PubMed]
  63. Fanelli, G.N.; Grassini, D.; Ortenzi, V.; Pasqualetti, F.; Montemurro, N.; Perrini, P.; Naccarato, A.G.; Scatena, C. Decipher the Glioblastoma Microenvironment: The First Milestone for New Groundbreaking Therapeutic Strategies. Genes 2021, 12, 445. [Google Scholar] [CrossRef]
  64. Yekula, A.; Yekula, A.; Muralidharan, K.; Kang, K.K.; Carter, B.S.; Balaj, L. Extracellular Vesicles in Glioblastoma Tumor Microenvironment. Front. Immunol. 2020, 10, 3137. [Google Scholar] [CrossRef]
  65. Rooj, A.K.; Mineo, M.; Godlewski, J. MicroRNA and extracellular vesicles in glioblastoma: Small but powerful. Brain Tumor Pathol. 2016, 33, 77–88. [Google Scholar] [CrossRef] [Green Version]
  66. Li, Z.C.; Bai, H.M.; Sun, Q.C.; Li, Q.H.; Liu, L.; Zou, Y.; Chen, Y.S.; Liang, C.F.; Zheng, H.R. Multiregional radiomics features from multiparametric MRI for prediction of MGMT methylation status in glioblastoma multiforme: A multicentre study. Eur. Radiol. 2018, 28, 3640–3650. [Google Scholar] [CrossRef]
  67. Prasanna, P.; Patel, J.; Partovi, S.; Madabhushi, A.; Tiwari, P. Radiomic features from the peritumoral brain parenchyma on treatment-naive multi-parametric MR imaging predict long versus short-term survival in glioblastoma multiforme: Preliminary findings. Eur. Radiol. 2017, 27, 4198–4199. [Google Scholar] [CrossRef] [PubMed] [Green Version]
  68. Cui, Y.; Tha, K.K.; Terasaka, S.; Yamaguchi, S.; Wang, J.; Kudo, K.; Xing, L.; Shirato, H.; Li, R.J. Prognostic Imaging Biomarkers in Glioblastoma: Development and Independent Validation on the Basis of Multiregion and Quantitative Analysis of MR Images. Radiology 2016, 278, 546–553. [Google Scholar] [CrossRef] [Green Version]
  69. Kiviniemi, A.; Gardberg, M.; Ek, P.; Frantzen, J.; Bobacka, J.; Minn, H. Gadolinium retention in gliomas and adjacent normal brain tissue: Association with tumor contrast enhancement and linear/macrocyclic agents. Neuroradiology 2019, 61, 535–544. [Google Scholar] [CrossRef] [PubMed] [Green Version]
  70. Xia, D.; Davis, R.L.; Crawford, J.A.; Abraham, J.L. Gadolinium released from MR contrast agents is deposited in brain tumors: In situ demonstration using scanning electron microscopy with energy dispersive X-ray spectroscopy. Acta Radiol. 2010, 51, 1126–1136. [Google Scholar] [CrossRef]
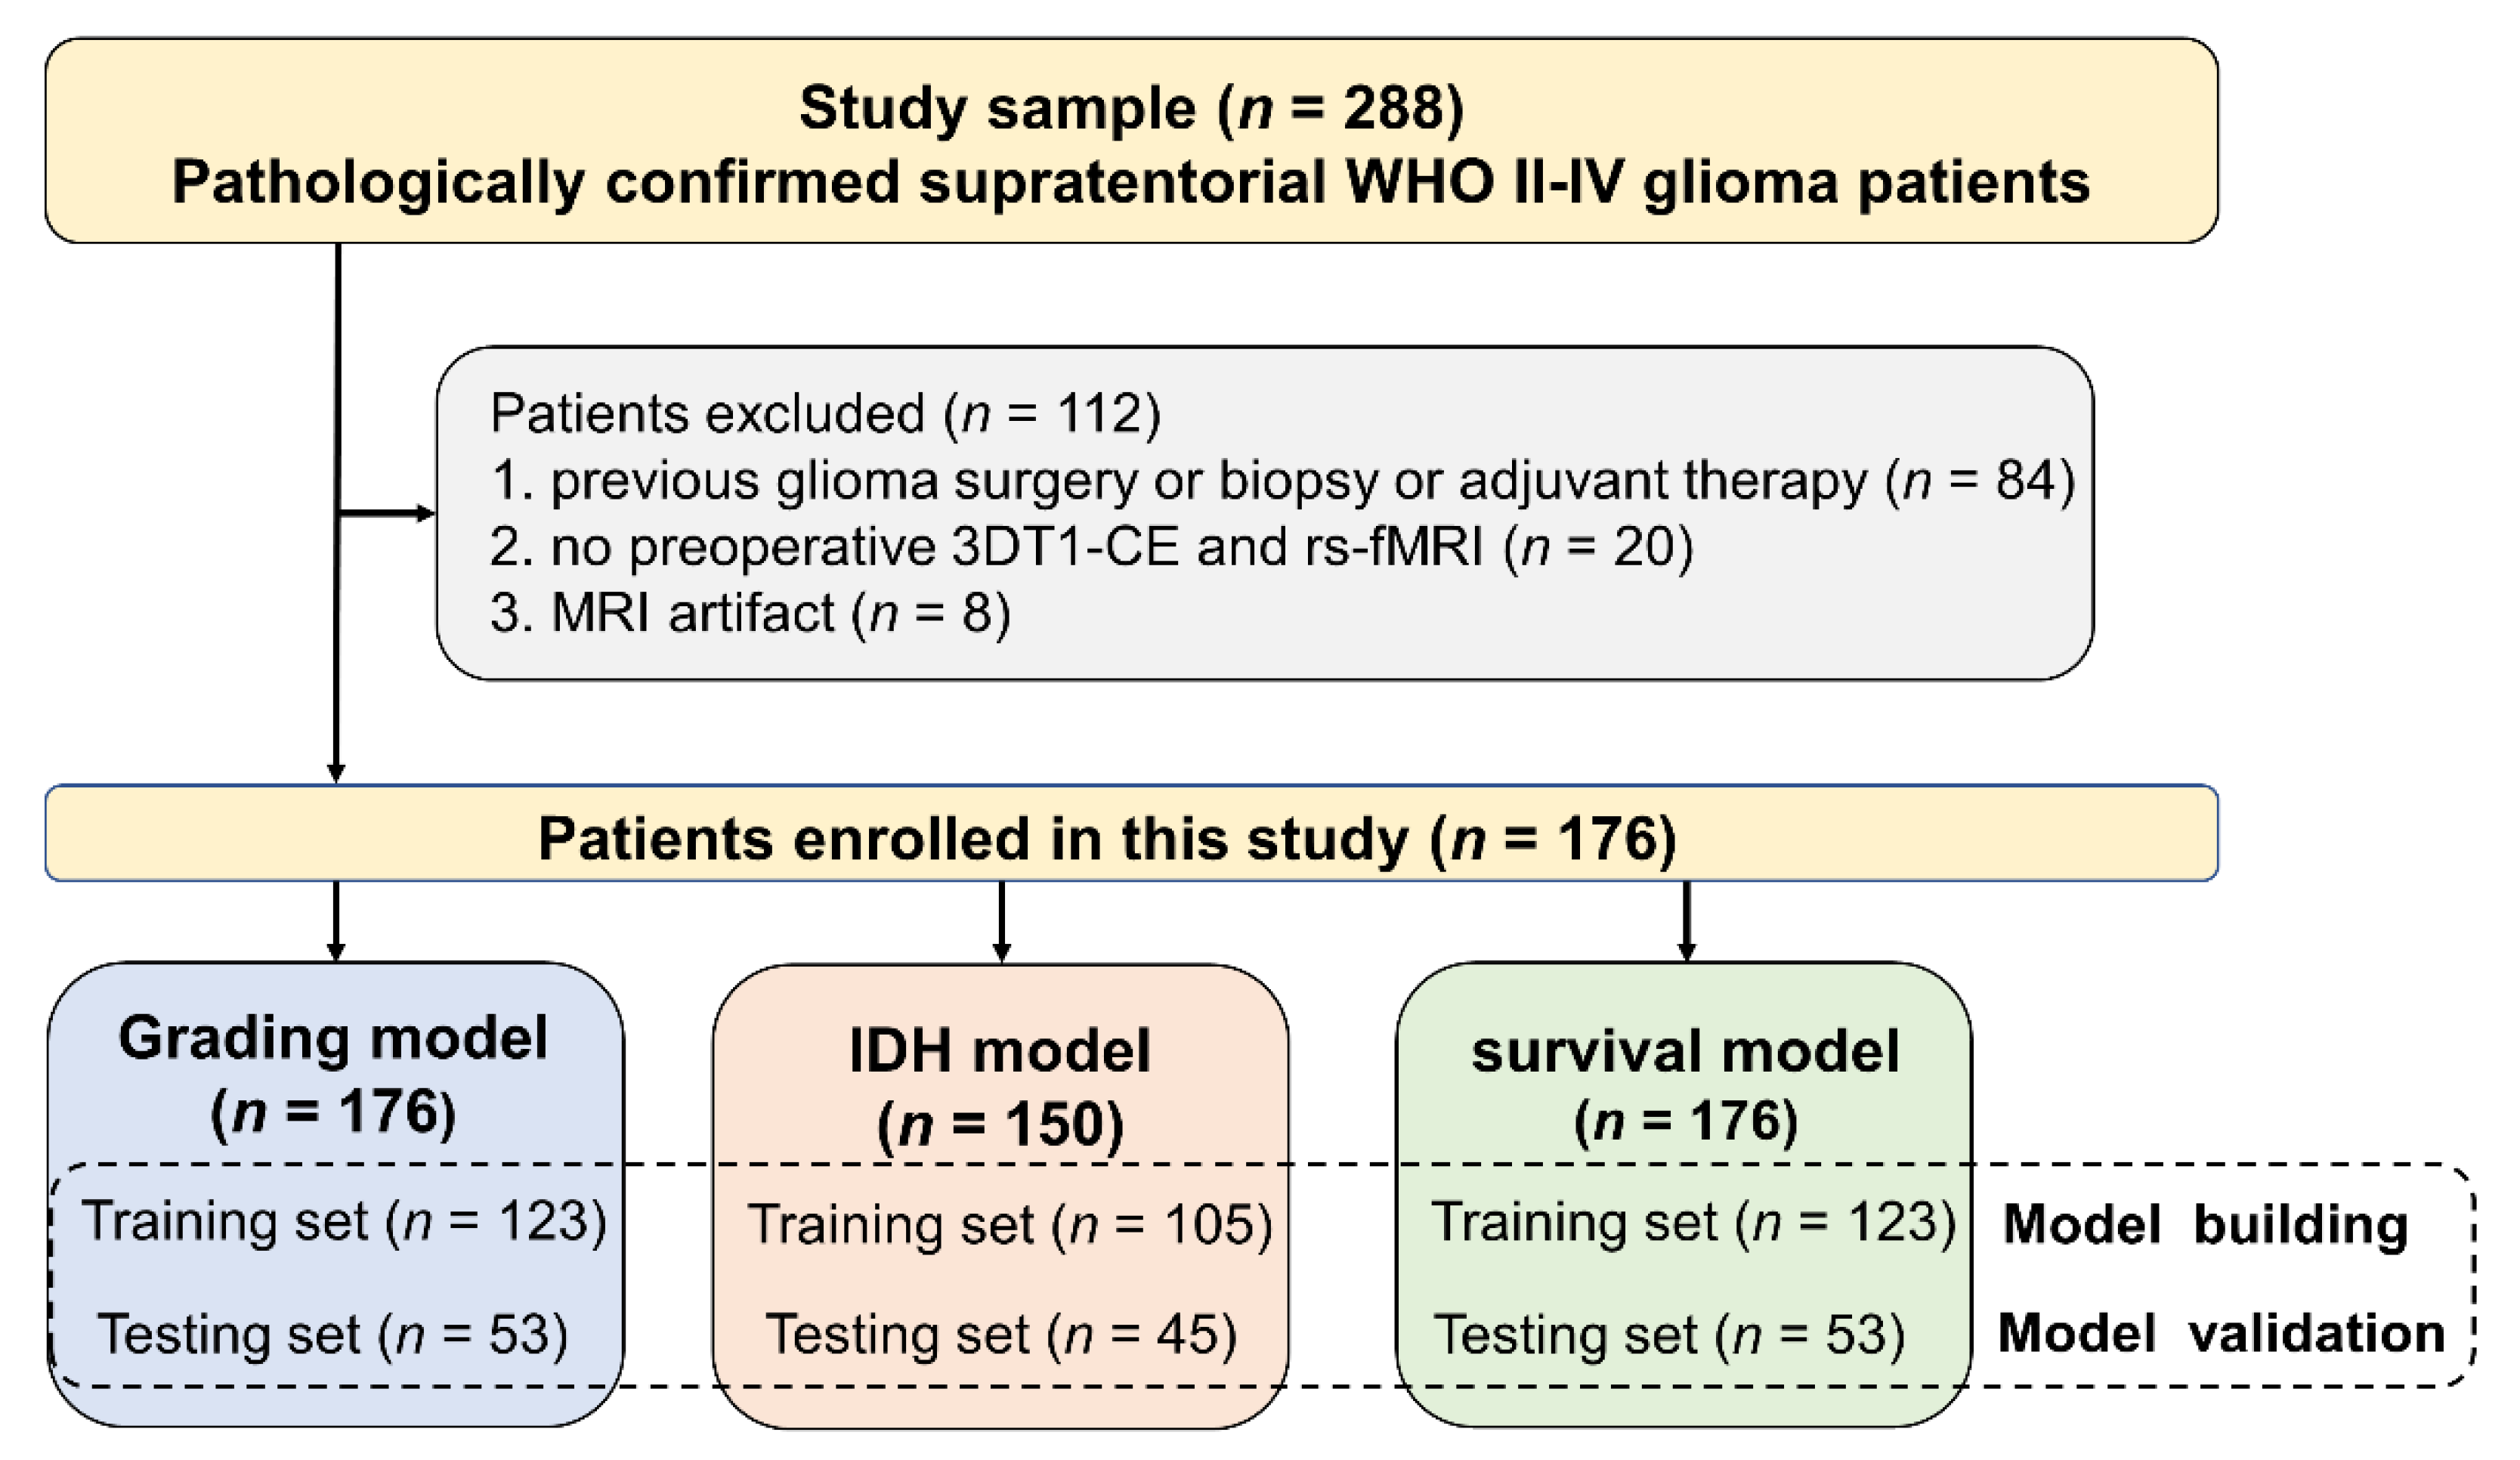
Figure 1. Flowchart of the inclusion and exclusion criteria for patients.
Cancers 14 02818 g001
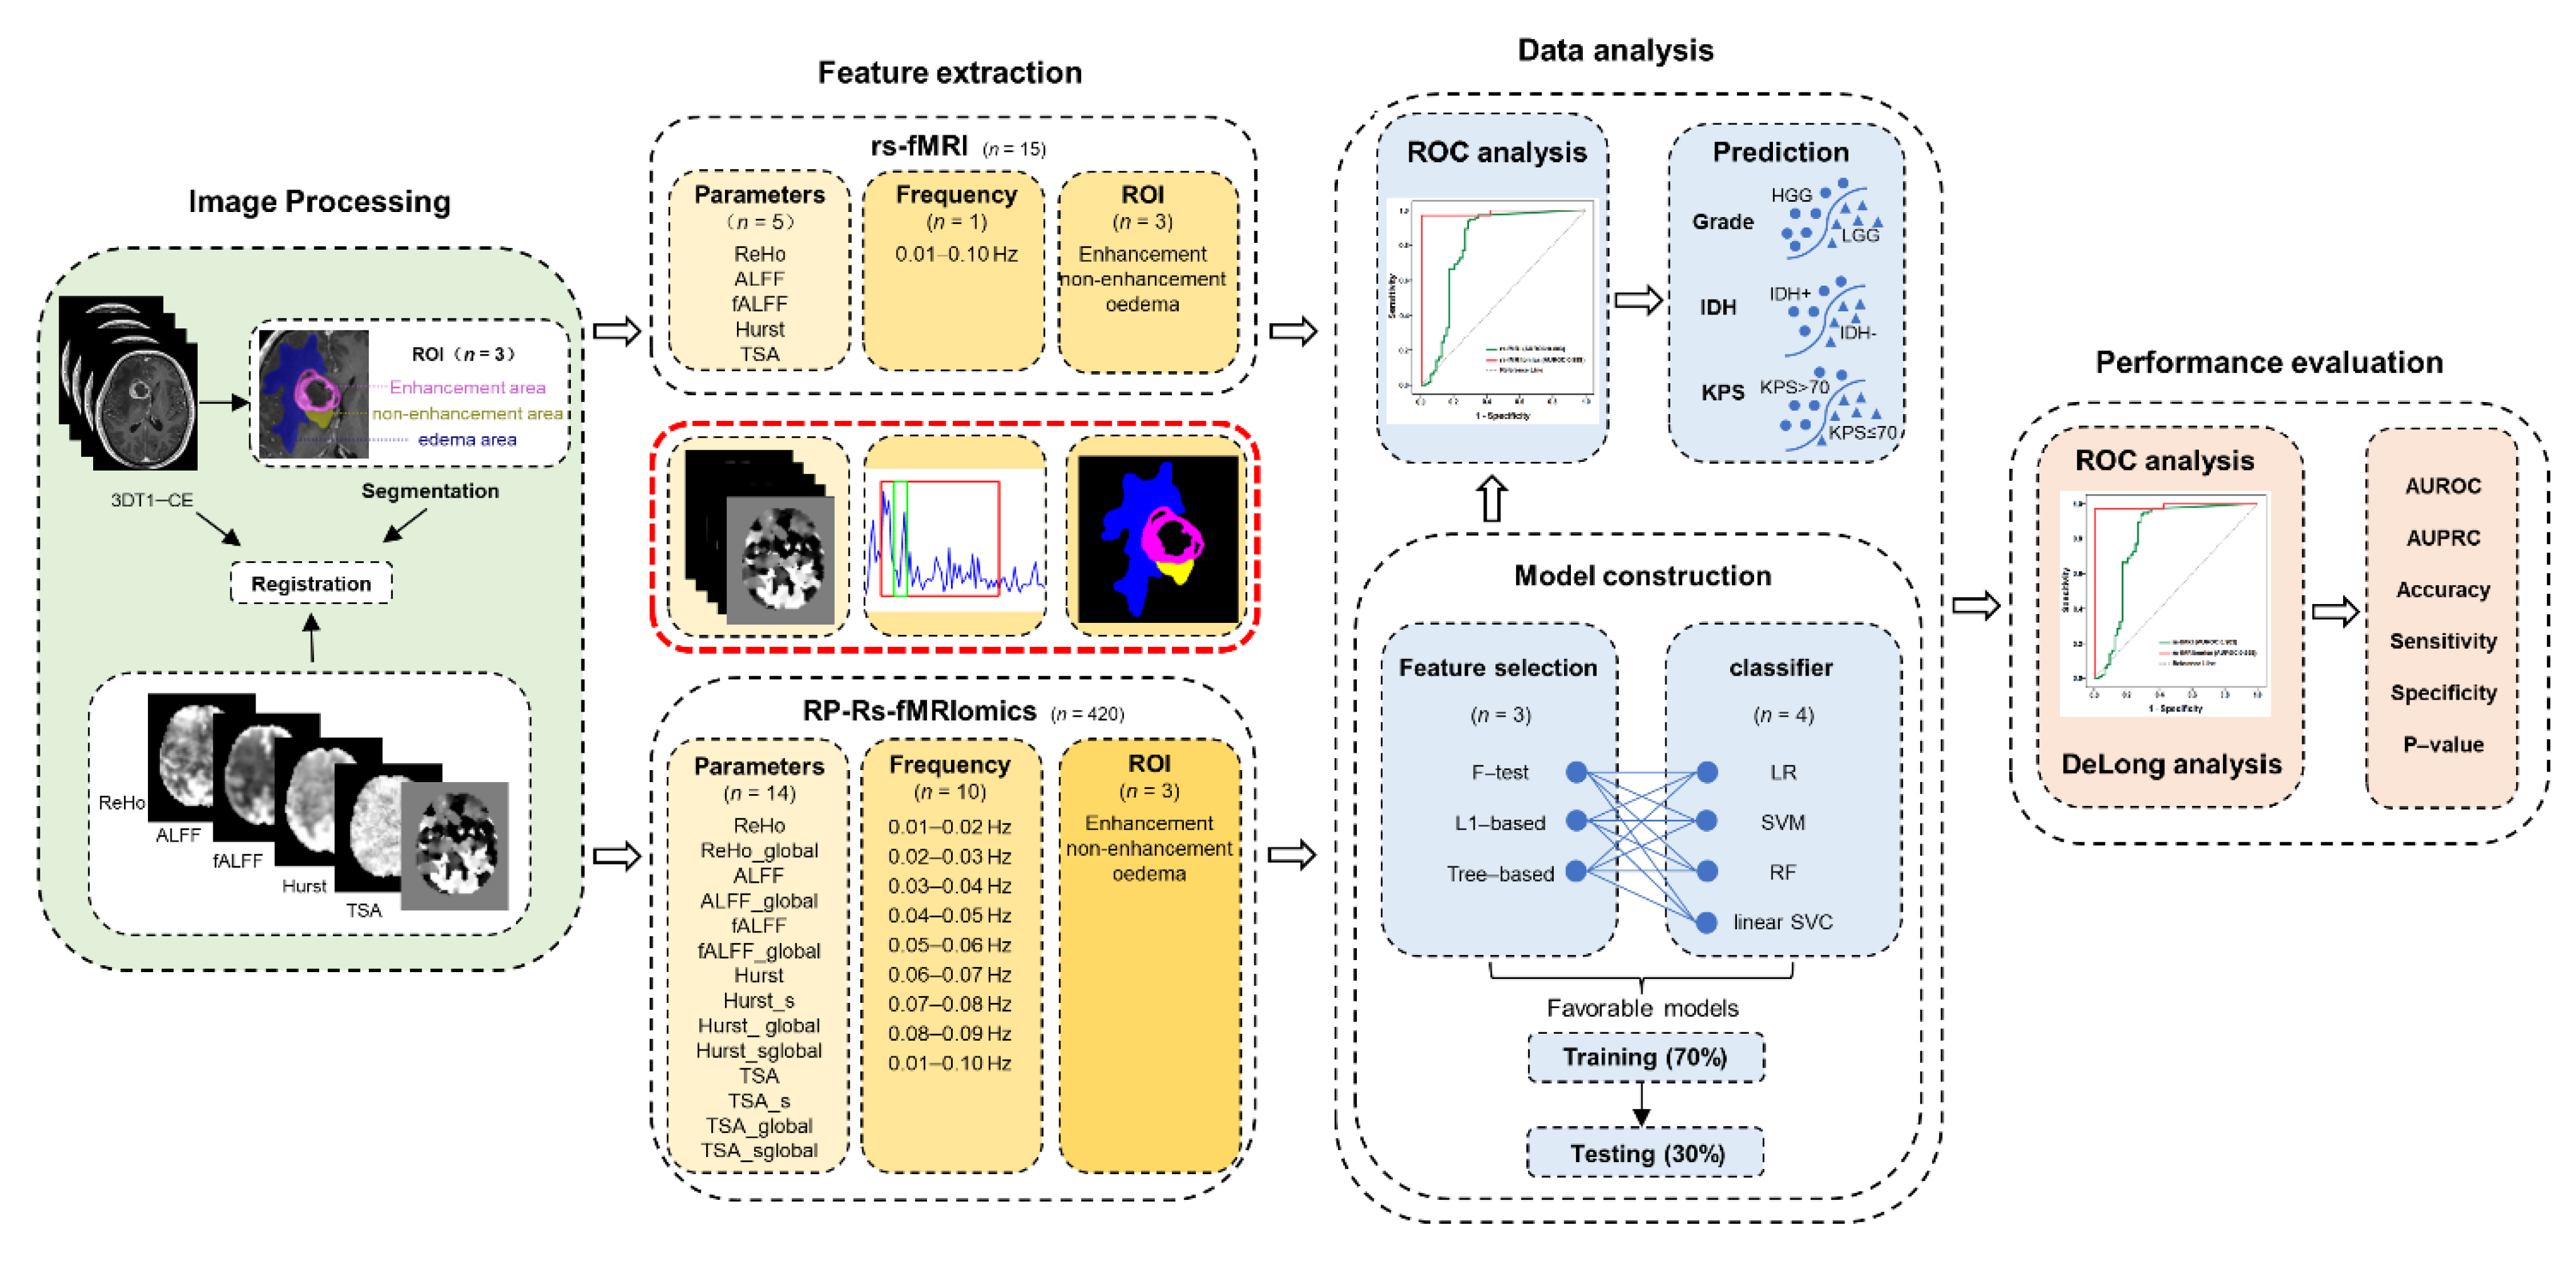
Figure 2. The whole workflow of this study. RP-Rs-fMRIomics models were constructed for predicting glioma grade, isocitrate dehydrogenase status and Karnofsky Performance Status scores, based on the features extracted through measuring 14 regional parameters of rs-fMRI in 10 specific narrow frequency bins and 3 parts of gliomas. Then, three radiomics feature selections and four classifiers were implemented. The diagnostic performances of RP-Rs-fMRIomics models were compared with conventional single-parameter fMRI analysis using Delong’s test.
Cancers 14 02818 g002
Figure 3. Heatmap depicting the differentiating power of conventional rs-fMRI parameters (rows) with the AUROC based on the three ROIs (columns) in the grading model, IDH model and survival model.
Cancers 14 02818 g003
Figure 4. Receiver operating characteristic (ROC) curves for three prediction models in rs-fMRI and in the validation cohort of RP-Rs-fMRIomics: (a) grading model; (b) IDH grade model; (c) survival model.
Cancers 14 02818 g004
Figure 5. The first row shows the top 10, 10 and 4 importance ranking of RP-Rs-fMRIomics features in the (a) grading model, (b) IDH model and (c) survival model, respectively. The second row shows the bar plots of these three models in the validation cohort. The red bars with the predictive value >0 and the purple bars with the predictive value <0 indicate the successful classification of the corresponding prediction model, and vice versa.
Cancers 14 02818 g005
Table 1. Demographic and clinical data of glioma patients.
VariablesGrading ModelIDH ModelSurvival Model
All
Patients (n = 176)
Training Set
(n = 123)
Testing Set
(n = 53)
p ValueAll
Patients (n = 150)
Training Set
(n = 105)
Testing Set
(n = 45)
p ValueAll
Patients (n = 176)
Training Set
(n = 123)
Testing Set
(n = 53)
p Value
Age (±SD), years51.11 ± 13.7451.67 ± 12.2449.83 ± 16.770.47450.65 ± 13.3752.31 ± 14.5350.44 ± 12.430.50351.11 ± 13.7450.97 ± 13.5451.45 ± 14.320.830
Gender 0.019 * 0.390 0.008 *
male966036 825527 965937
female806317 685018 806416
WHO grade 0.992 0.682 0.308
II634419 533617 634716
III-IV1137934 976928 1137637
IDH status 0.242 0.941 0.528
Mutant563818 563917 564214
Wild type947222 946628 946628
Extent of resection 0.070 0.669 0.107
gross-total905733 765224 905832
partial866620 745321 866521
KPS 0.198 0.001 * 0.619
>70392415 321517 392613
≤701379938 1189028 1379740
Abbreviations: WHO = World Health Organization, IDH = isocitrate dehydrogenase, KPS = Karnofsky Performance Status. * represents the number of p-values < 0.05.
Table 2. Prediction performance of grading, IDH and survival models.
Optimal ModelGrading ModelIDH ModelSurvival Model
ClassifierRandom ForestRandom ForestLogistic Regression
Feature SelectionF TestF TestF Test
Training setAUROC0.9991.0000.706
ACC0.9840.9910.642
AUPRC0.9871.0000.667
SEN0.9871.0000.667
SPE0.9770.9850.635
F1 score0.9870.9870.450
Testing setAUROC0.9880.9050.801
ACC0.9430.8670.698
AUPRC0.9710.8240.667
SEN0.9710.8240.667
SPE0.8950.8930.707
F1 score0.9570.8240.500
Abbreviations: AUROC = area under the receiver operating characteristics; ACC = accuracy; AUPRC = area under the precision−recall curve; SEN = sensitivity; SPE = specificity.
Publisher’s Note: MDPI stays neutral with regard to jurisdictional claims in published maps and institutional affiliations.