
Anti-Cancer Effects of YAP Inhibitor (CA3) in Combination with Sorafenib against Hepatocellular Carcinoma (HCC) in Patient-Derived Multicellular Tumor Spheroid Models (MCTS)

 , , , ,
Abstract
:Simple Summary
Abstract
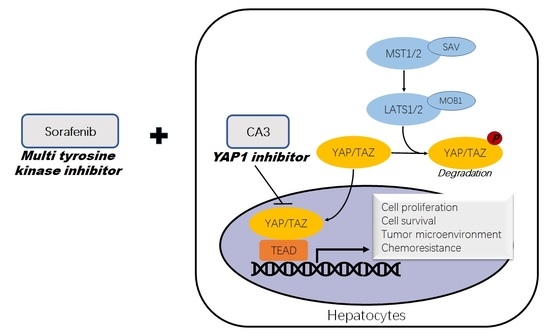
1. Introduction
2. Materials and Methods
2.1. Patients and Tissue Sample
2.2. Cell Lines and Culture Conditions
2.3. Primary Culture of HCCs
2.4. Generation of Multicellular Tumor Spheroids (MCTS)
2.5. Drug Response Assay
2.6. Protein Extraction and Western Blot Analysis
2.7. Immunohistochemistry
2.8. Immunocytochemistry
2.9. Statistical Analysis
3. Results
3.1. Clinical, Pathological Features of HCC
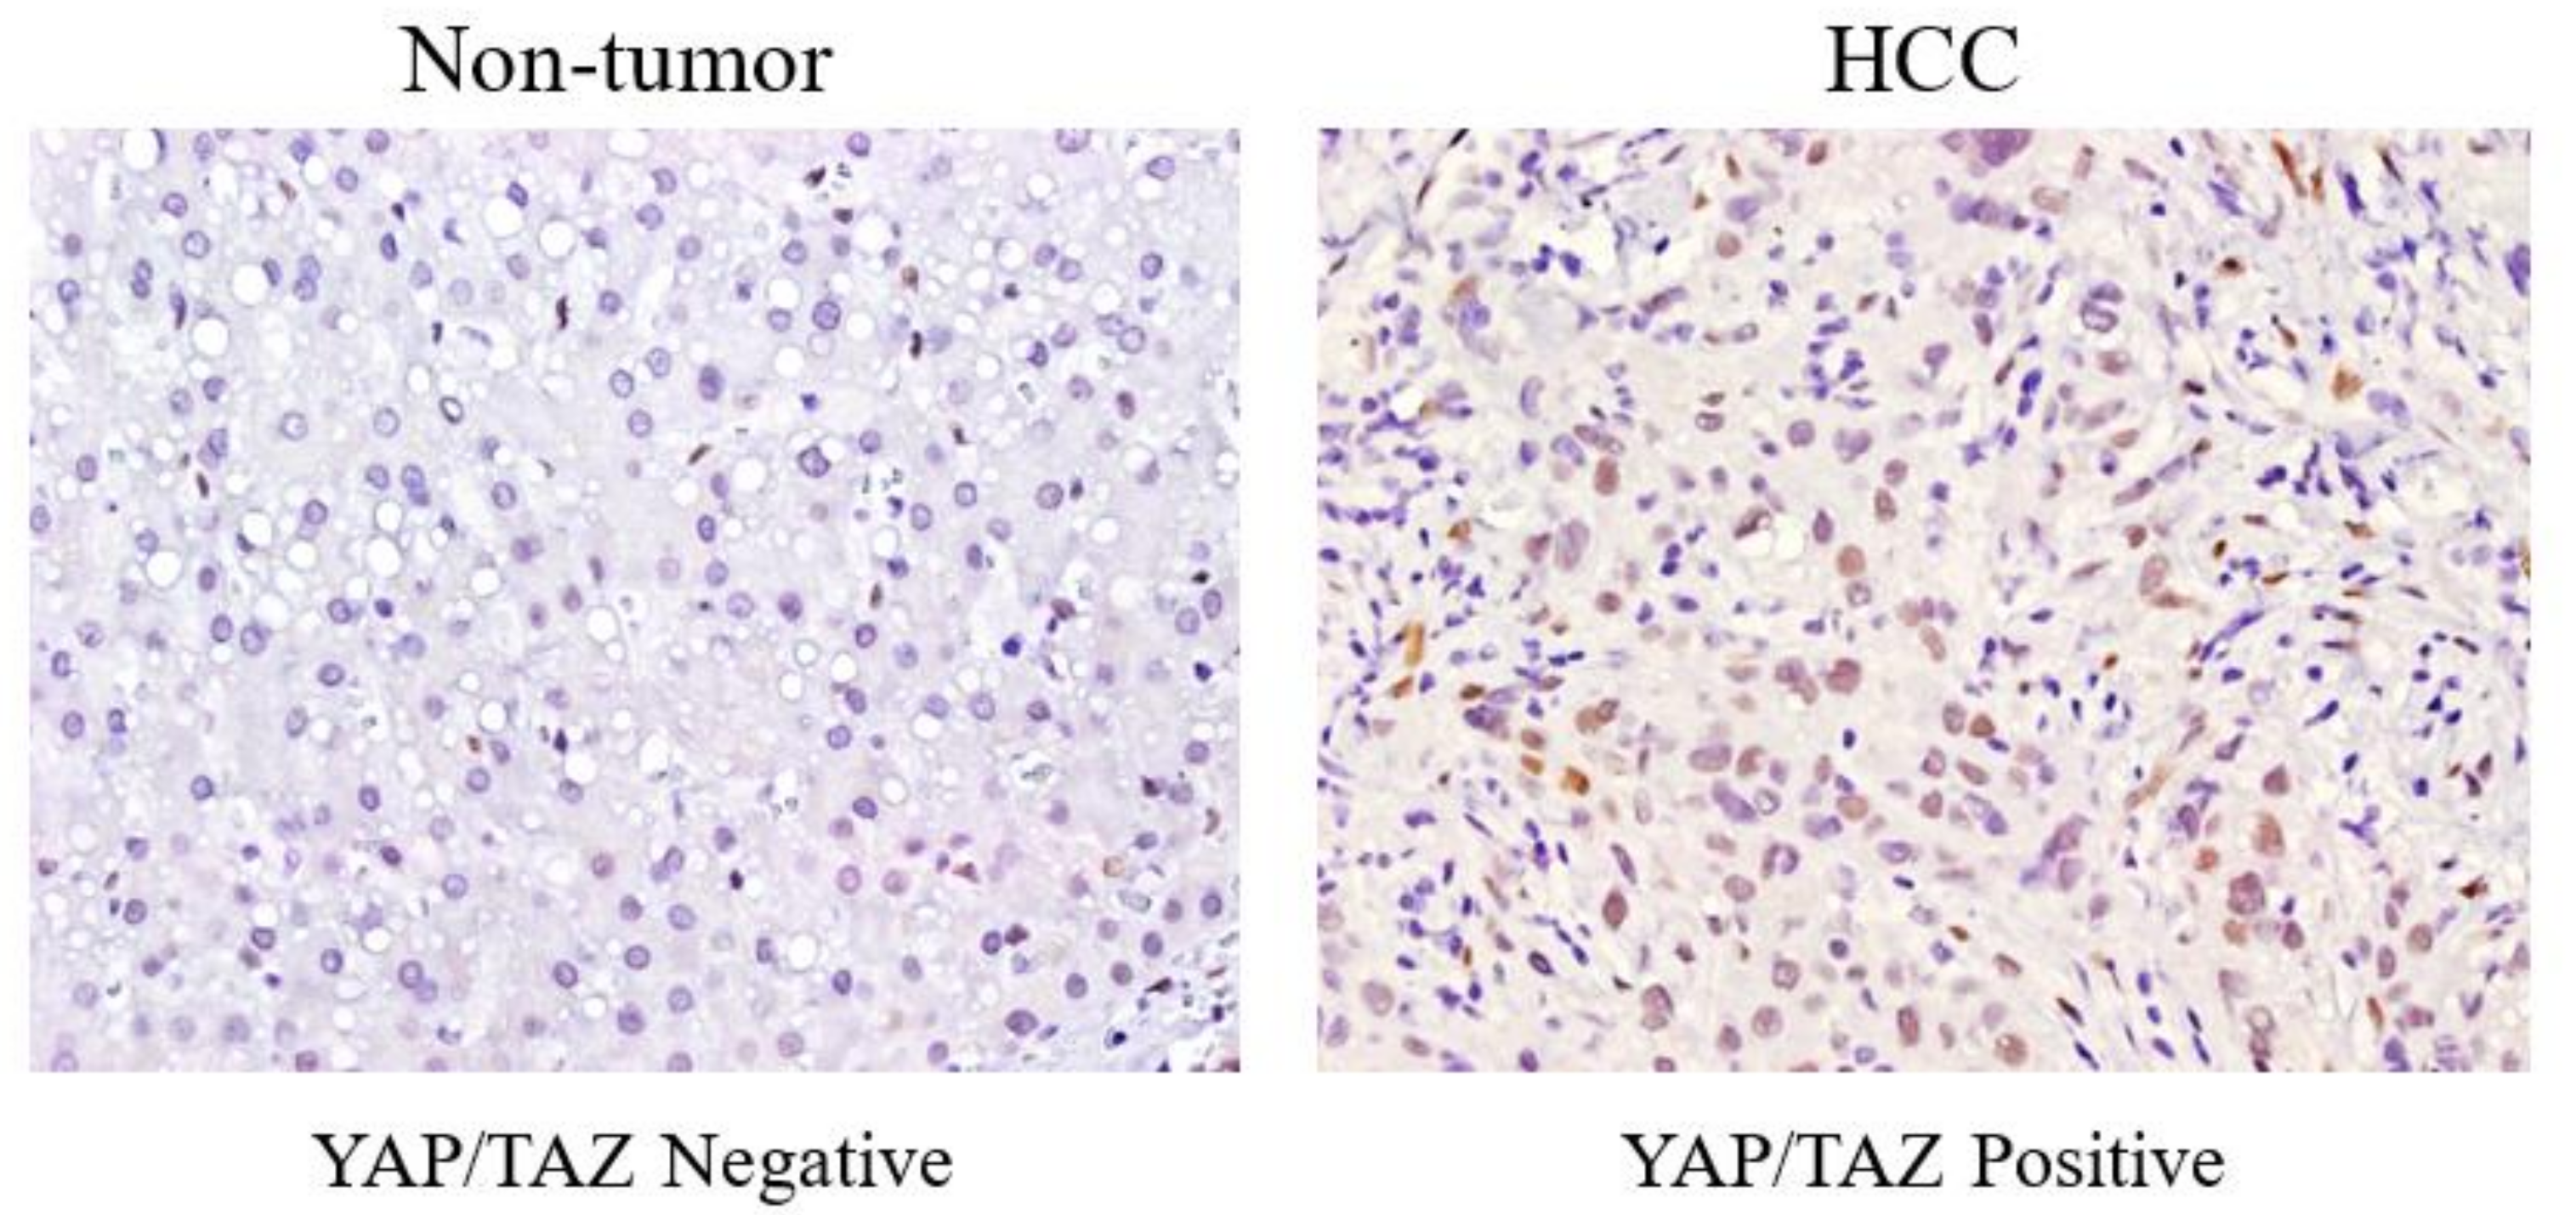
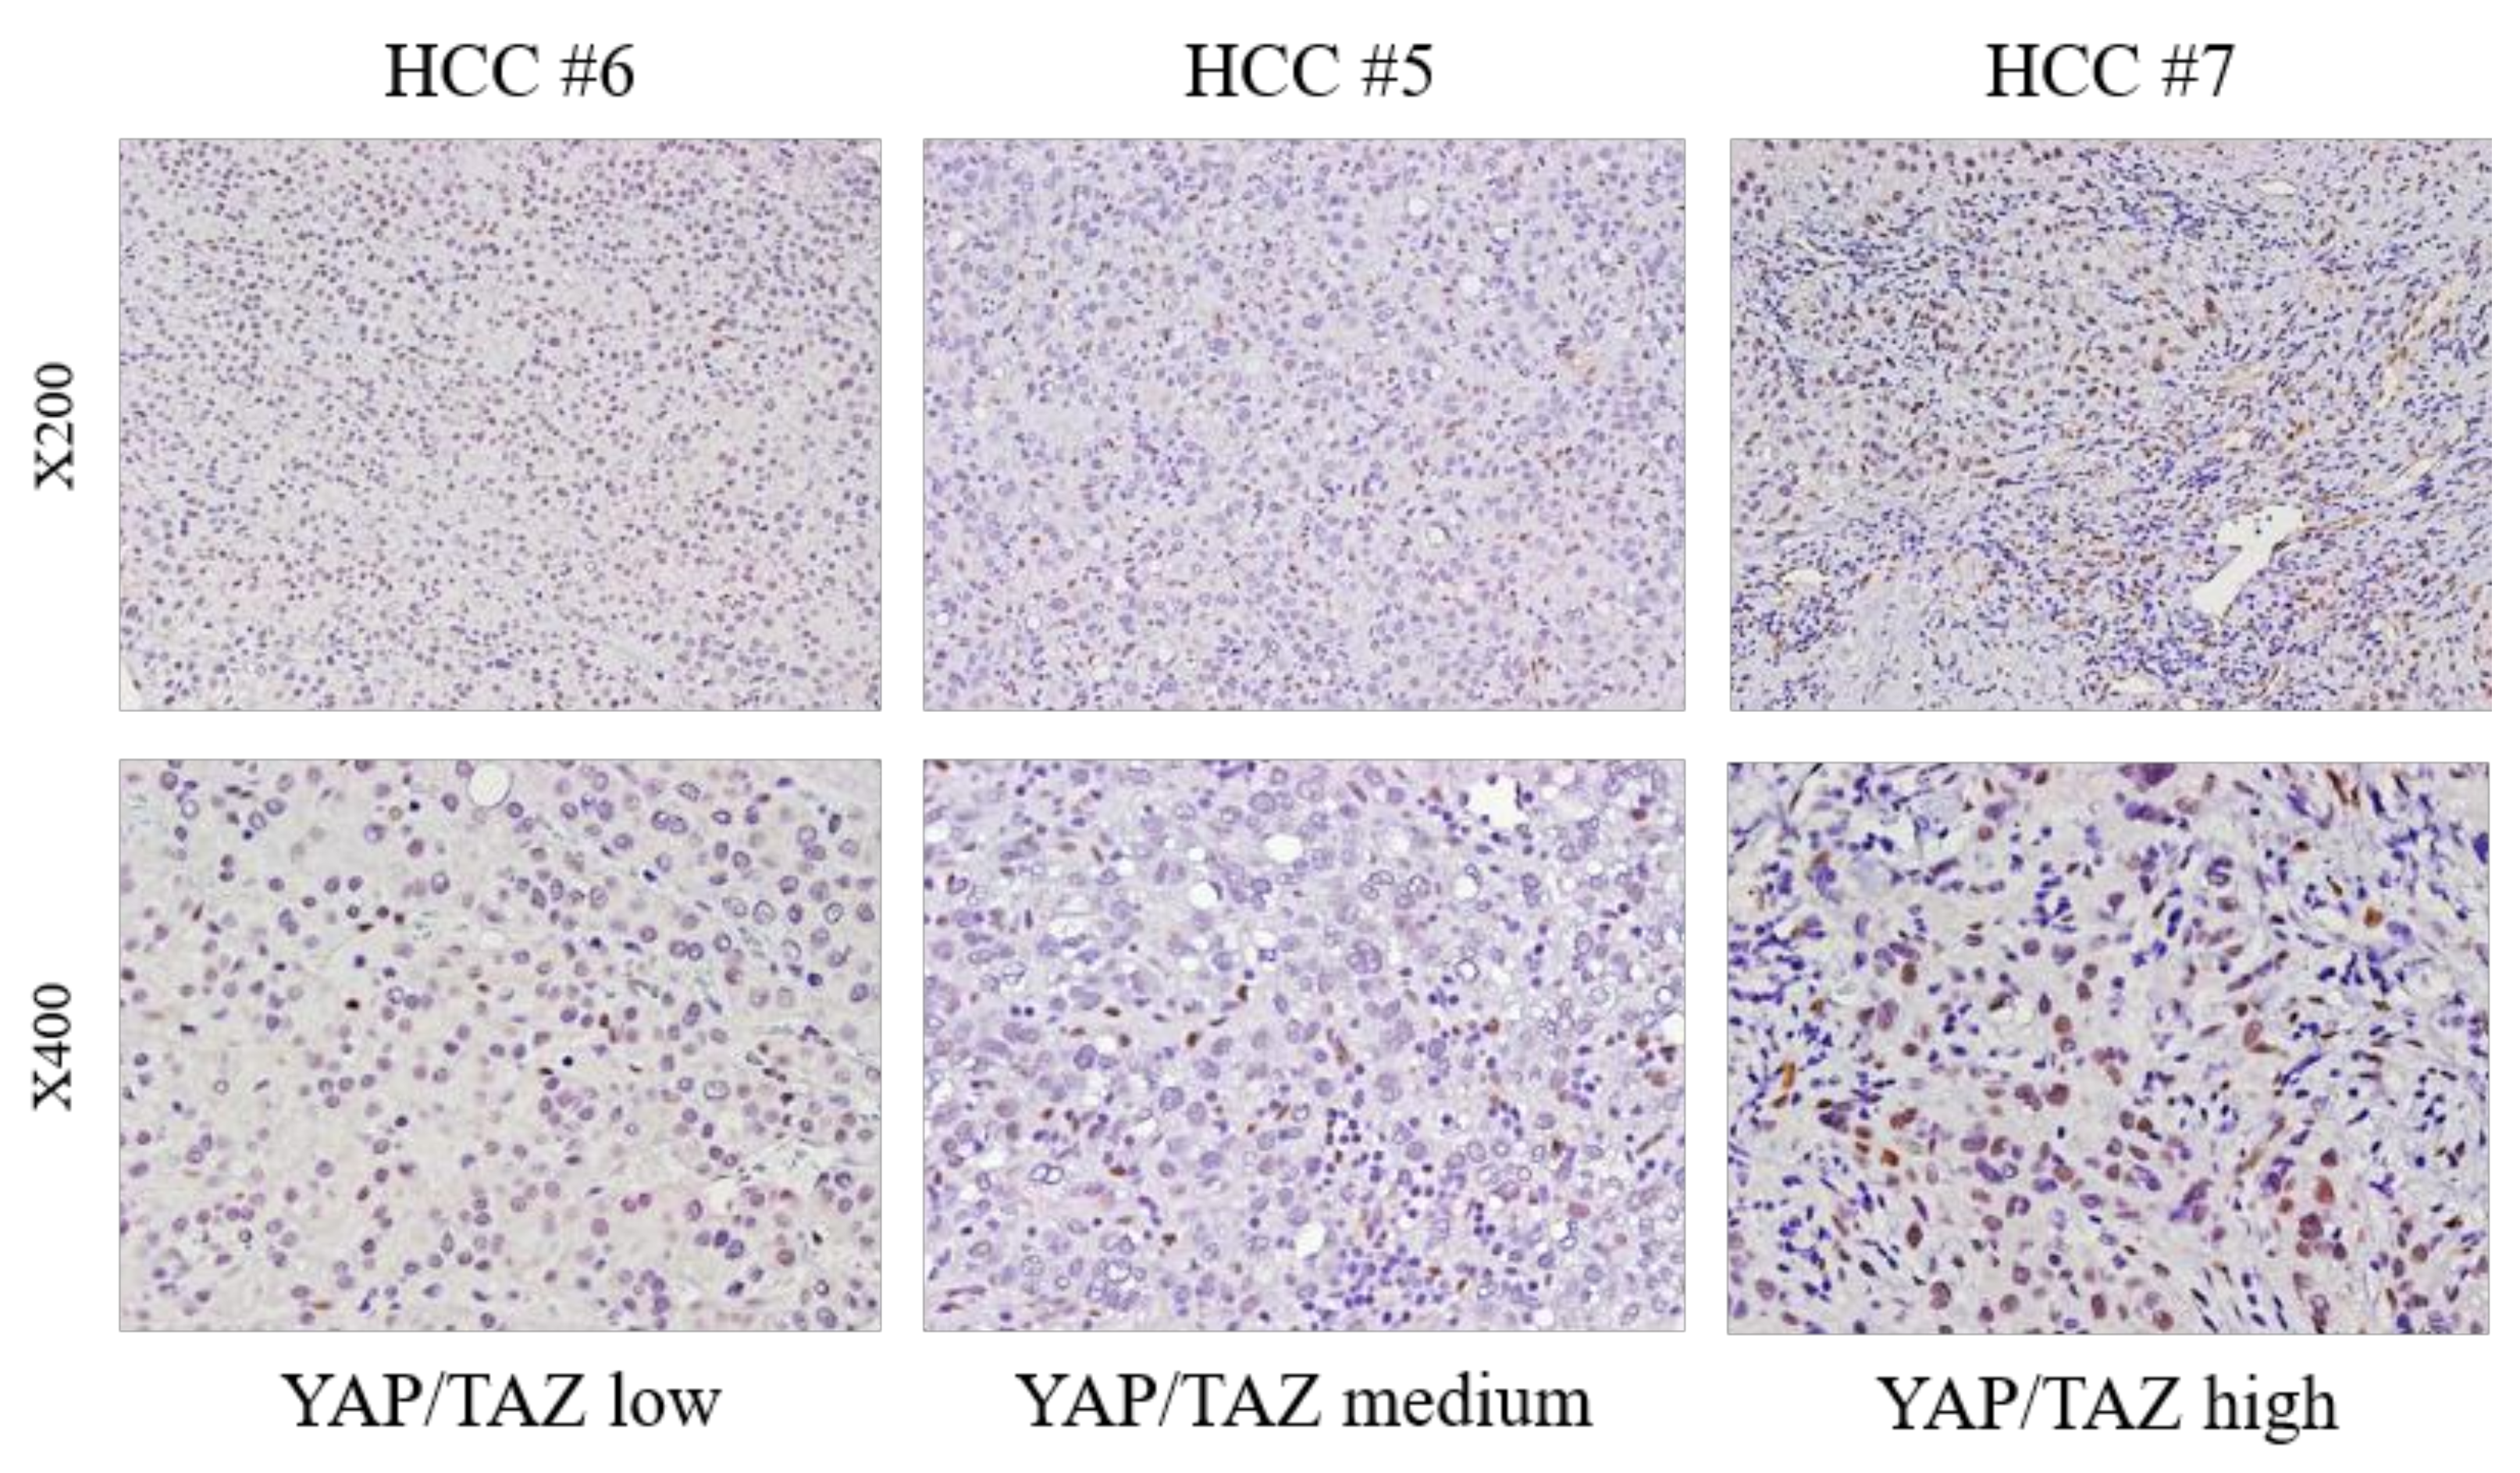
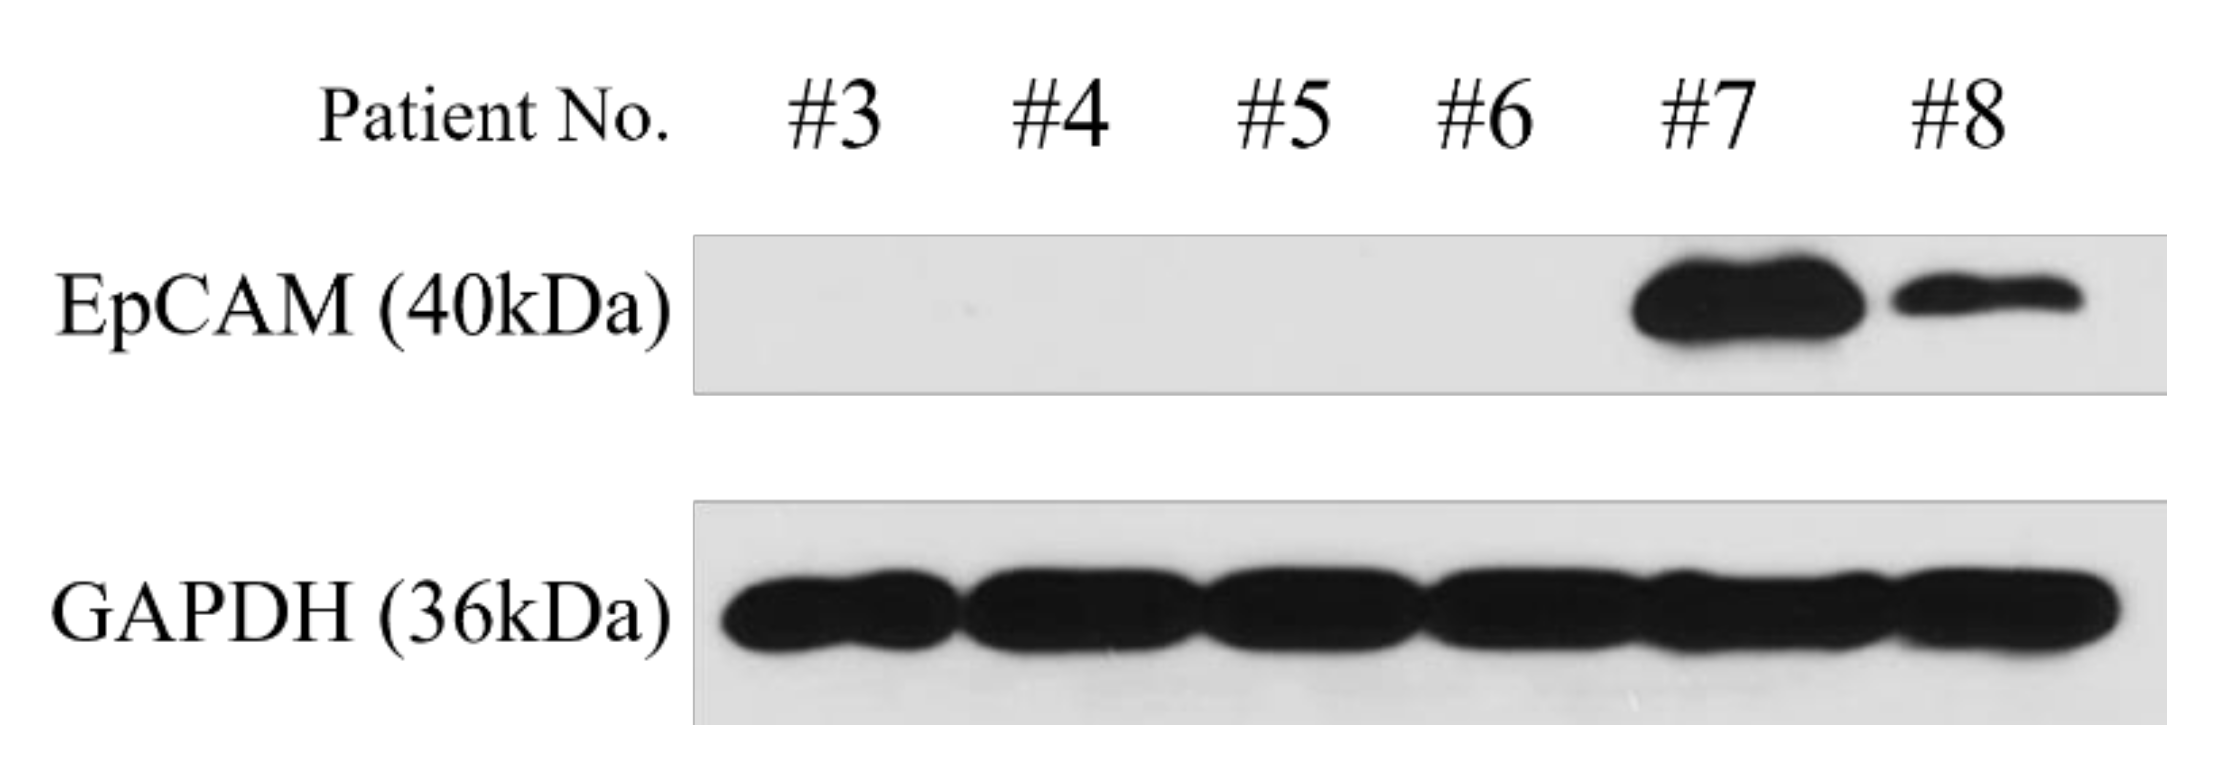
3.2. Different YAP/TAZ Expression among HCC Tissue
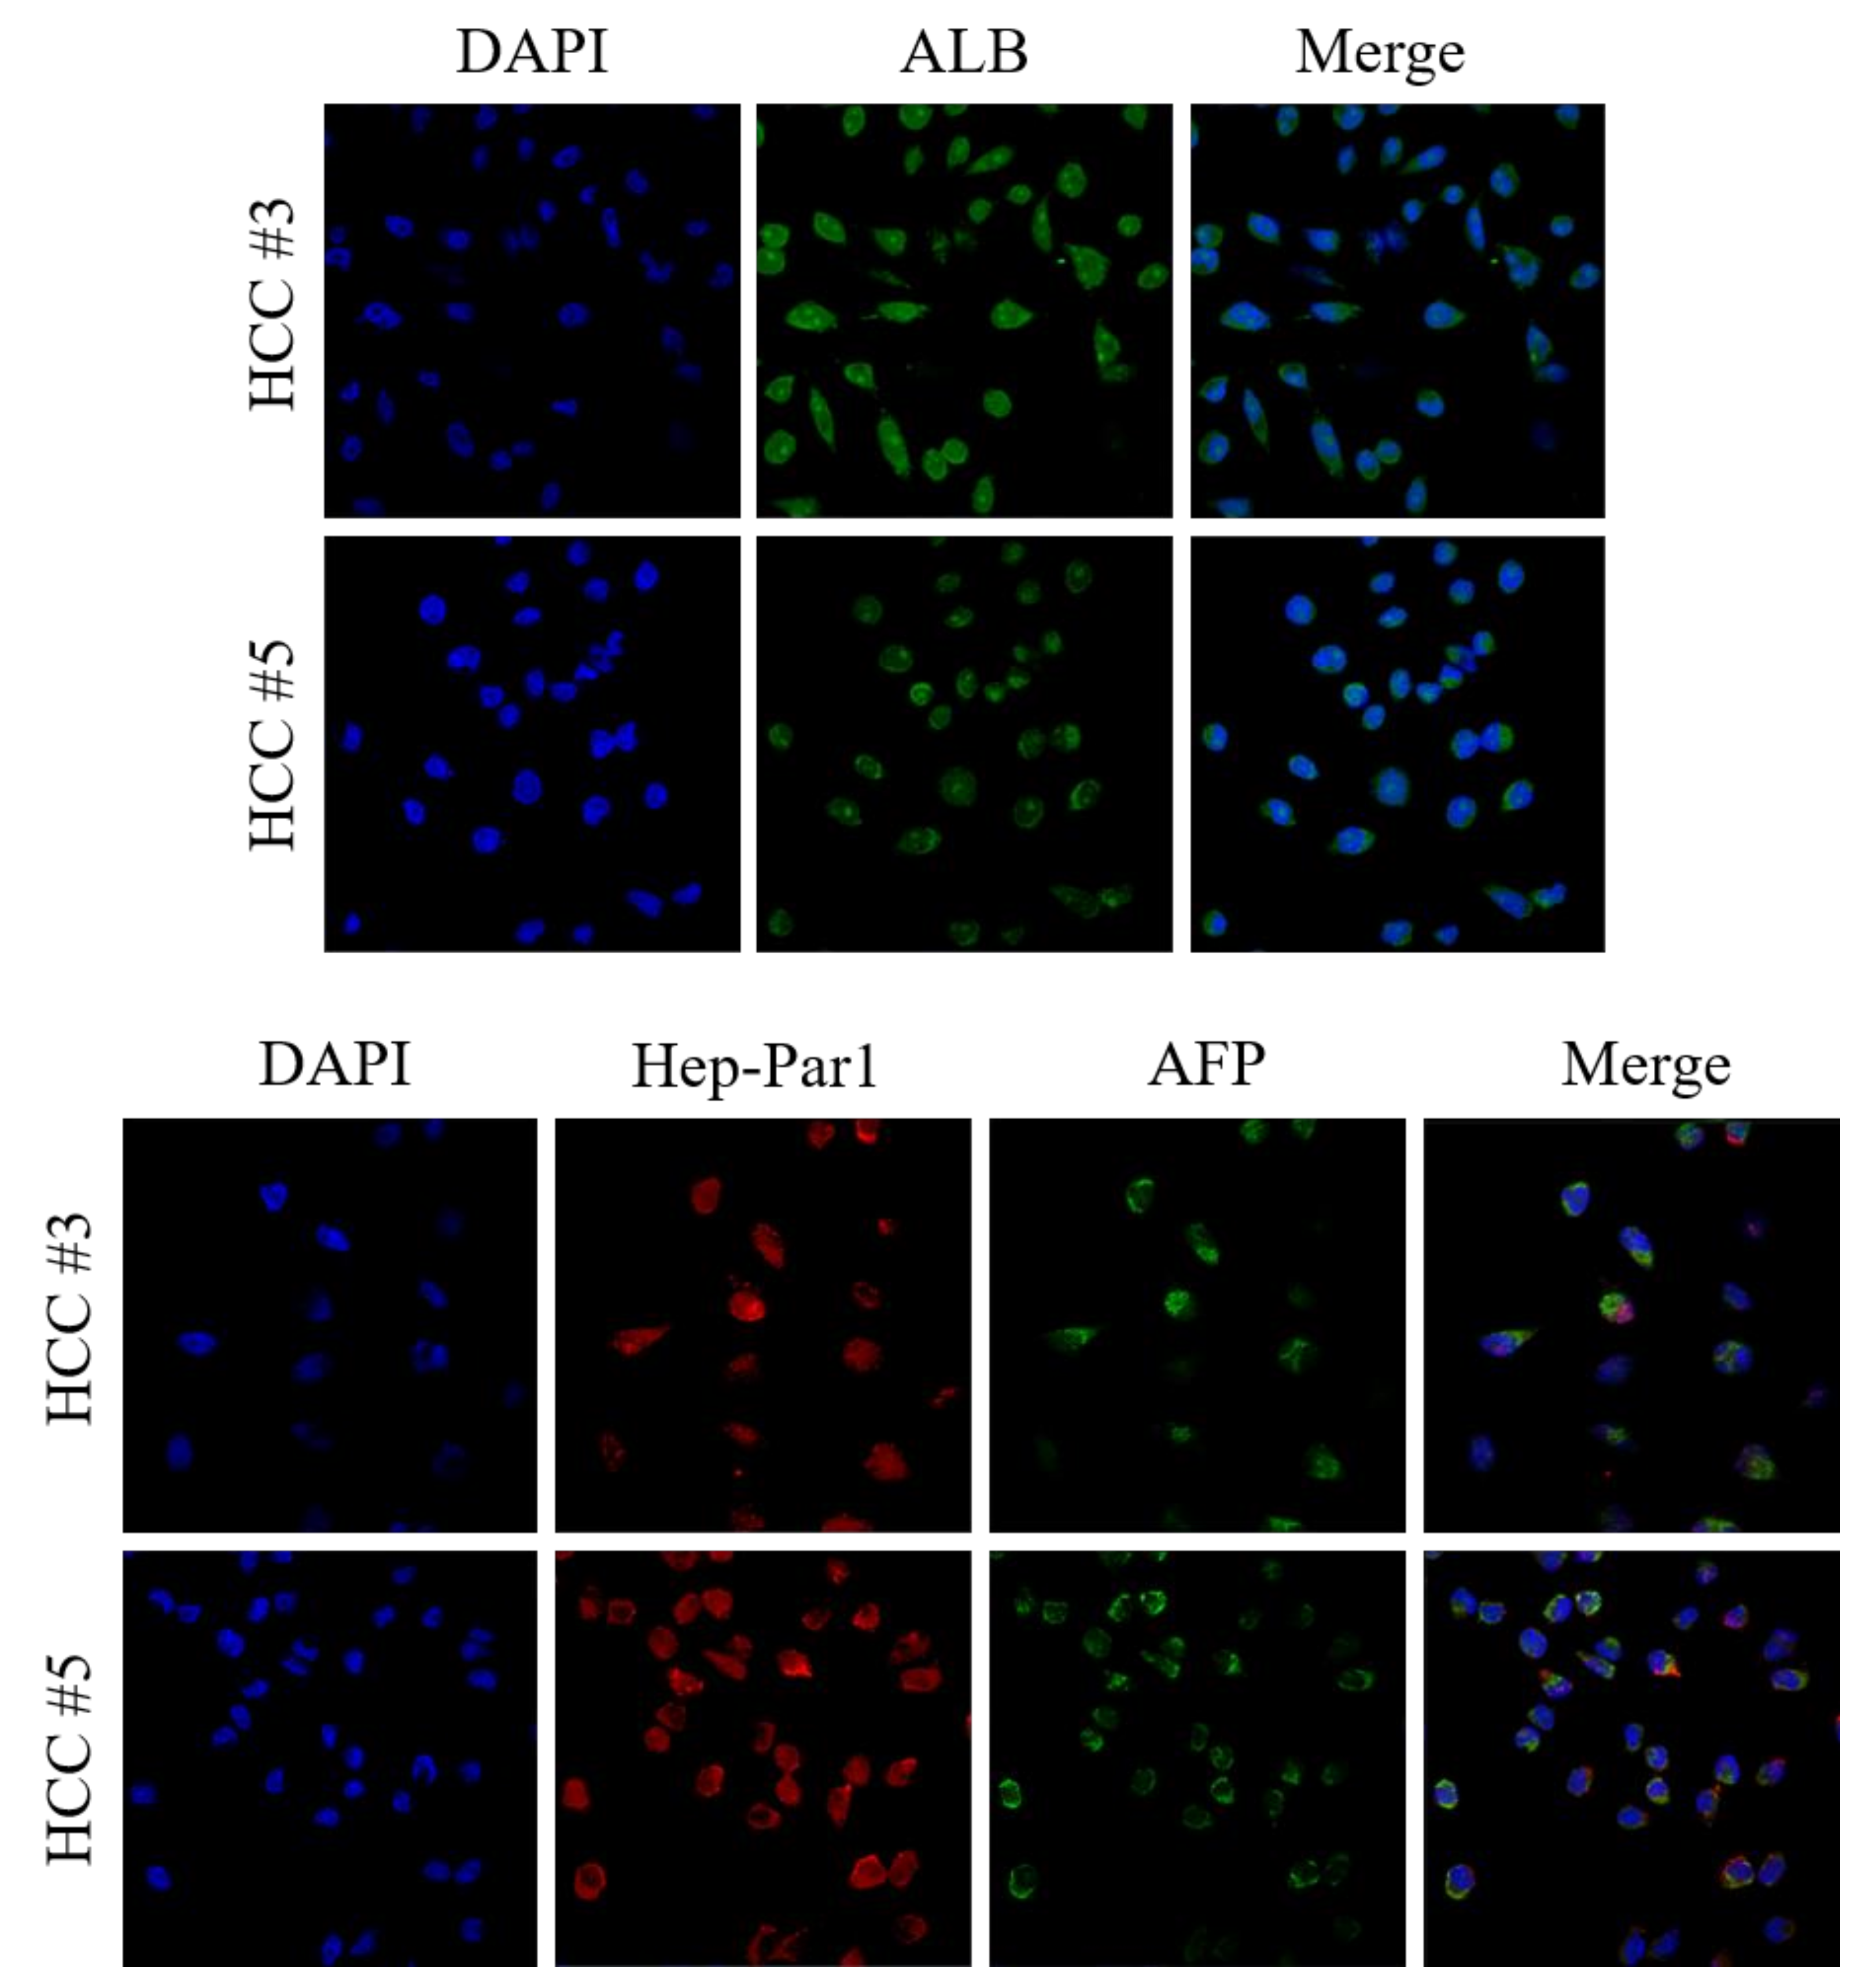
3.3. Characterization of Primary Cultured HCC Cells as Original HCC
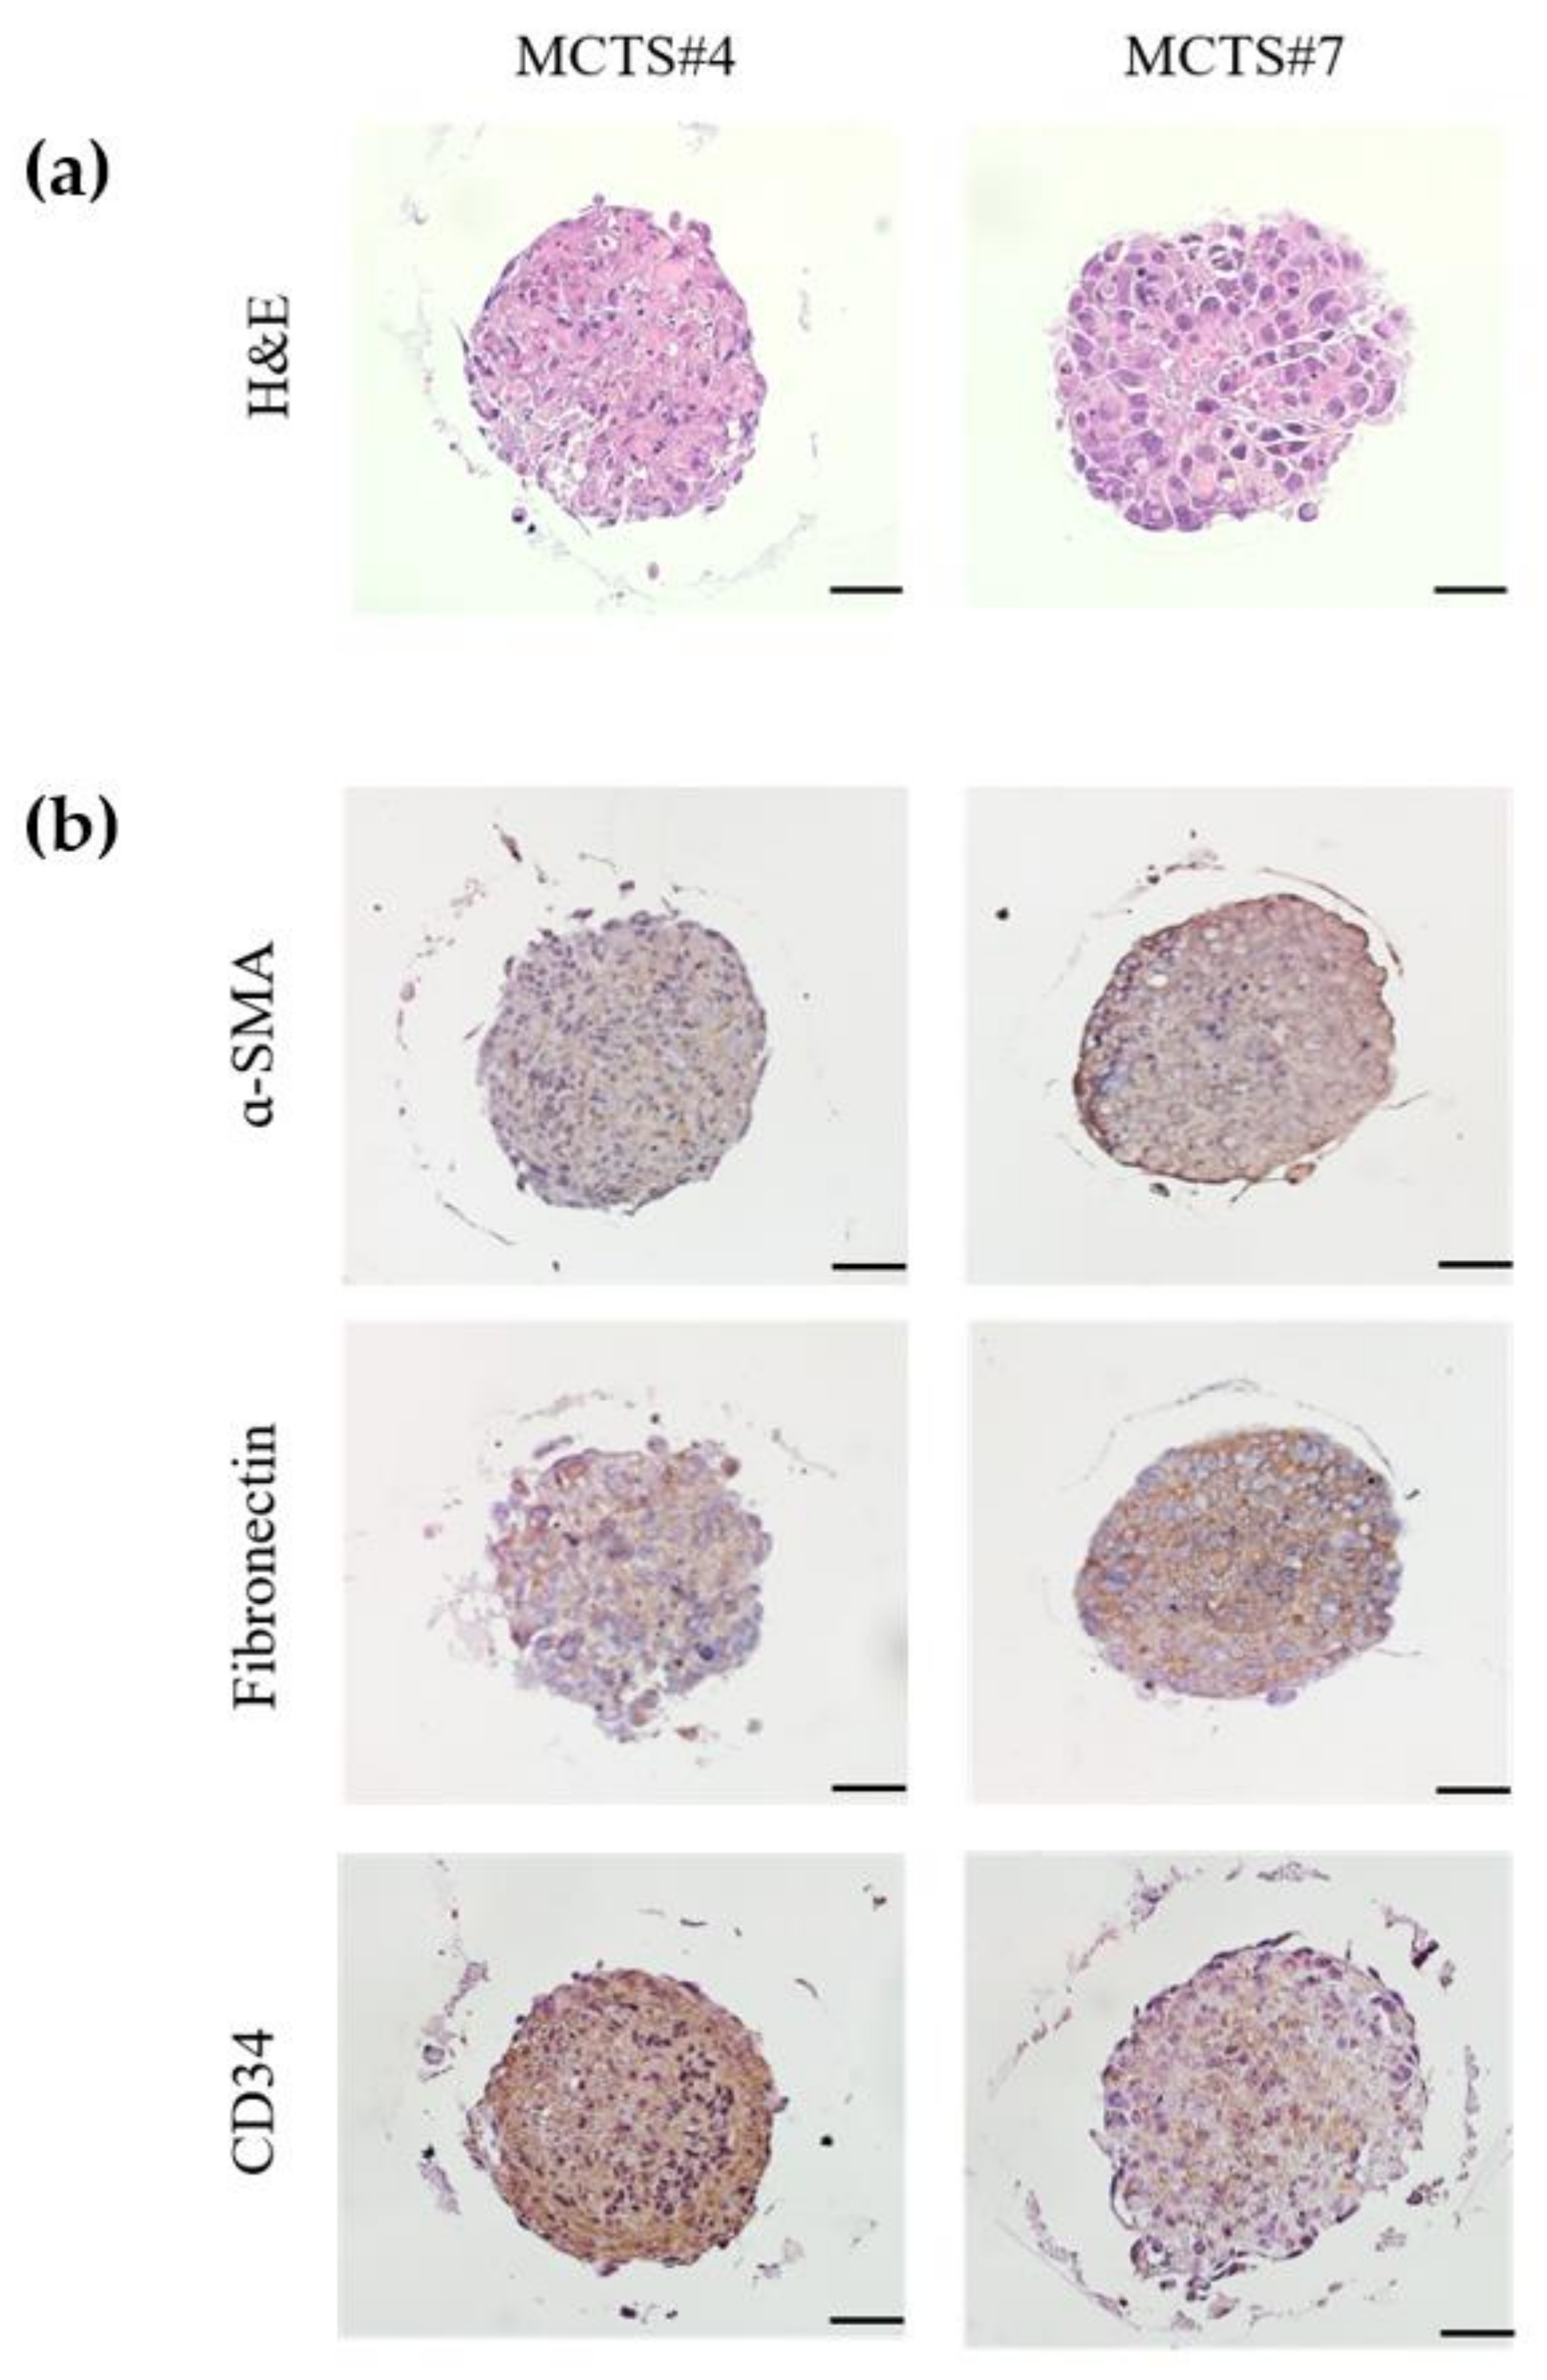
3.4. Generation of MCTS Model Using Patient Derived HCC Cell Lines
3.5. Comparison of YAP/TAZ Expression between Two Different Cultured System: Monolayer (2D) and MCTS (3D) Using Patient-Derived Primary HCC Cells
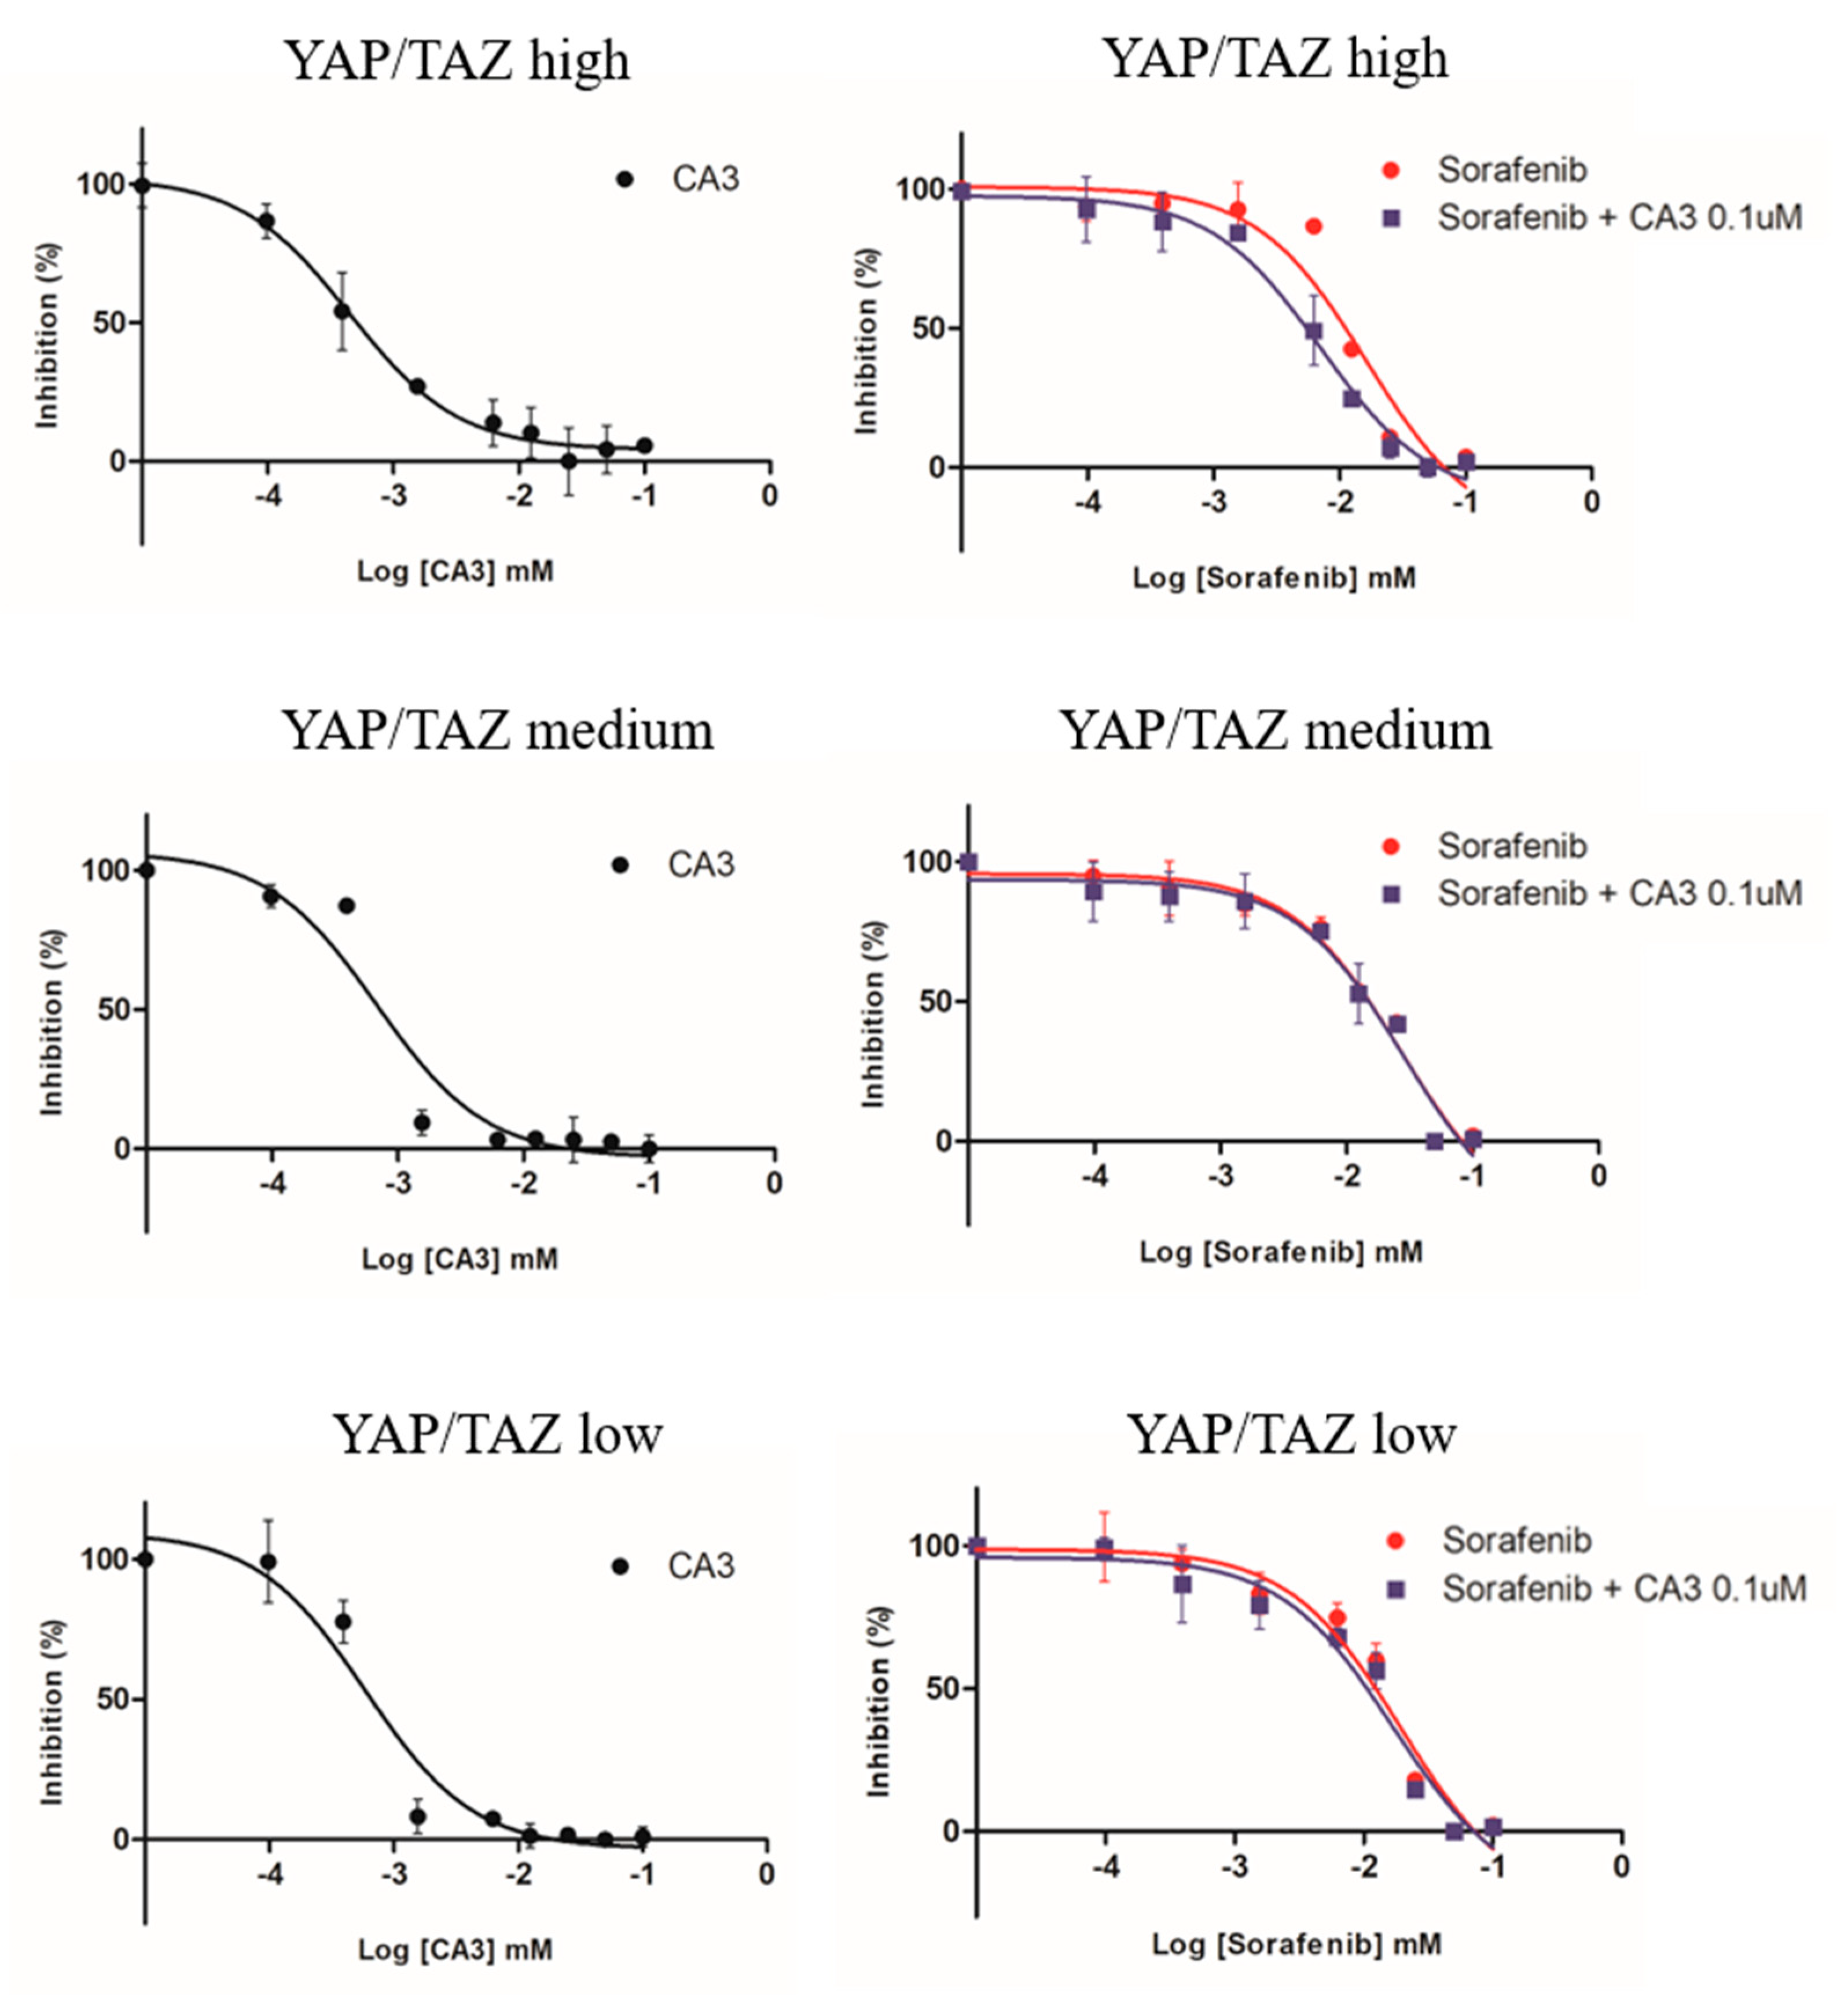
3.6. Comparison of Sensitivity to Anti-Cancer Drugs (Sorafenib, CA3, Combined Therapy) in MCTS
4. Discussion
5. Conclusions
Supplementary Materials
Author Contributions
Funding
Institutional Review Board Statement
Informed Consent Statement
Data Availability Statement
Conflicts of Interest
References
- Farazi, P.A.; DePinho, R.A. Hepatocellular carcinoma pathogenesis: From genes to environment. Nat. Rev. Cancer 2006, 6, 674–687. [Google Scholar] [CrossRef]
- Hanahan, D.; Weinberg, R.A. Hallmarks of cancer: The next generation. Cell 2011, 144, 646–674. [Google Scholar] [CrossRef] [PubMed] [Green Version]
- Bruix, J.; Sherman, M. Practice Guidelines Committee AASLD. Management of hepatocellular carcinoma. Hepatology 2005, 42, 1208–1236. [Google Scholar] [CrossRef] [PubMed]
- European Association For The Study Of The Liver, European Organisation For Research And Treatment Of Cancer. EASL-EORTC clinical practice guidelines: Management of hepatocellular carcinoma. J. Hepatol. 2012, 56, 908–943. [Google Scholar] [CrossRef] [PubMed] [Green Version]
- Roayaie, S.; Obeidat, K.; Sposito, C.; Mariani, L.; Bhoori, S.; Pellegrinelli, A.; Labow, D.; Llovet, J.; Schwartz, M.; Mazzaferro, V. Resection of hepatocellular cancer </=2 cm: Results from two Western centers. Hepatology 2013, 57, 1426–1435. [Google Scholar] [CrossRef]
- Tabrizian, P.; Jibara, G.; Shrager, B.; Schwartz, M.; Roayaie, S. Recurrence of hepatocellular cancer after resection: Patterns, treatments, and prognosis. Ann. Surg. 2015, 261, 947–955. [Google Scholar] [CrossRef]
- Pan, D. The hippo signaling pathway in development and cancer. Dev. Cell 2010, 19, 491–505. [Google Scholar] [CrossRef] [Green Version]
- Harvey, K.F.; Zhang, X.; Thomas, D.M. The Hippo pathway and human cancer. Nat. Rev. Cancer 2013, 13, 246–257. [Google Scholar] [CrossRef]
- Lee, K.P.; Lee, J.H.; Kim, T.S.; Kim, T.H.; Park, H.D.; Byun, J.S.; Kim, M.C.; Jeong, W.I.; Calvisi, D.F.; Kim, J.M.; et al. The Hippo-Salvador pathway restrains hepatic oval cell proliferation, liver size, and liver tumorigenesis. Proc. Natl. Acad. Sci. USA 2010, 107, 8248–8253. [Google Scholar] [CrossRef] [Green Version]
- Dong, J.; Feldmann, G.; Huang, J.; Wu, S.; Zhang, N.; Comerford, S.A.; Gayyed, M.F.; Anders, R.A.; Maitra, A.; Pan, D. Elucidation of a universal size-control mechanism in Drosophila and mammals. Cell 2007, 130, 1120–1133. [Google Scholar] [CrossRef] [Green Version]
- Mo, J.S.; Park, H.W.; Guan, K.L. The Hippo signaling pathway in stem cell biology and cancer. EMBO Rep. 2014, 15, 642–656. [Google Scholar] [CrossRef] [Green Version]
- Moroishi, T.; Hansen, C.G.; Guan, K.L. The emerging roles of YAP and TAZ in cancer. Nat. Rev. Cancer 2015, 15, 73–79. [Google Scholar] [CrossRef]
- Tschaharganeh, D.F.; Chen, X.; Latzko, P.; Malz, M.; Gaida, M.M.; Felix, K.; Ladu, S.; Singer, S.; Pinna, F.; Gretz, N.; et al. Yes-associated protein up-regulates Jagged-1 and activates the Notch pathway in human hepatocellular carcinoma. Gastroenterology 2013, 144, 1530–1542. [Google Scholar] [CrossRef] [PubMed] [Green Version]
- Xu, M.Z.; Yao, T.J.; Lee, N.P.; Ng, I.O.; Chan, Y.T.; Zender, L.; Lowe, S.W.; Poon, R.T.; Luk, J.M. Yes-associated protein is an independent prognostic marker in hepatocellular carcinoma. Cancer 2009, 115, 4576–4585. [Google Scholar] [CrossRef] [PubMed] [Green Version]
- Hayashi, H.; Higashi, T.; Yokoyama, N.; Kaida, T.; Sakamoto, K.; Fukushima, Y.; Ishimoto, T.; Kuroki, H.; Nitta, H.; Hashimoto, D.; et al. An Imbalance in TAZ and YAP Expression in Hepatocellular Carcinoma Confers Cancer Stem Cell-like Behaviors Contributing to Disease Progression. Cancer Res. 2015, 75, 4985–4997. [Google Scholar] [CrossRef] [Green Version]
- Shao, D.D.; Xue, W.; Krall, E.B.; Bhutkar, A.; Piccioni, F.; Wang, X.; Schinzel, A.C.; Sood, S.; Rosenbluh, J.; Kim, J.W.; et al. KRAS and YAP1 converge to regulate EMT and tumor survival. Cell 2014, 158, 171–184. [Google Scholar] [CrossRef] [Green Version]
- Zhou, Y.; Wang, Y.; Zhou, W.; Chen, T.; Wu, Q.; Chutturghoon, V.K.; Lin, B.; Geng, L.; Yang, Z.; Zhou, L.; et al. YAP promotes multi-drug resistance and inhibits autophagy-related cell death in hepatocellular carcinoma via the RAC1-ROS-mTOR pathway. Cancer Cell Int. 2019, 19, 179. [Google Scholar] [CrossRef]
- Song, S.; Xie, M.; Scott, A.W.; Jin, J.; Ma, L.; Dong, X.; Skinner, H.D.; Johnson, R.L.; Ding, S.; Ajani, J.A.; et al. A Novel YAP1 Inhibitor Targets CSC-Enriched Radiation-Resistant Cells and Exerts Strong Antitumor Activity in Esophageal Adenocarcinoma. Mol. Cancer Ther. 2018, 17, 443–454. [Google Scholar] [CrossRef] [Green Version]
- Meads, M.B.; Gatenby, R.A.; Dalton, W.S. Environment-mediated drug resistance: A major contributor to minimal residual disease. Nat. Rev. Cancer 2009, 9, 665–674. [Google Scholar] [CrossRef]
- Khawar, I.A.; Kim, J.H.; Kuh, H.J. Improving drug delivery to solid tumors: Priming the tumor microenvironment. J. Control Release 2015, 201, 78–89. [Google Scholar] [CrossRef]
- Yang, M.C.; Wang, C.J.; Liao, P.C.; Yen, C.J.; Shan, Y.S. Hepatic stellate cells secretes type I collagen to trigger epithelial mesenchymal transition of hepatoma cells. Am. J. Cancer Res. 2014, 4, 751–763. [Google Scholar] [PubMed]
- Keren-Paz, A.; Emmanuel, R.; Samuels, Y. YAP and the drug resistance highway. Nat. Genet. 2015, 47, 193–194. [Google Scholar] [CrossRef] [PubMed] [Green Version]
- Hsu, P.C.; You, B.; Yang, Y.L.; Zhang, W.Q.; Wang, Y.C.; Xu, Z.; Dai, Y.; Liu, S.; Yang, C.T.; Li, H.; et al. YAP promotes erlotinib resistance in human non-small cell lung cancer cells. Oncotarget 2016, 7, 51922–51933. [Google Scholar] [CrossRef] [PubMed] [Green Version]
- Lee, J.E.; Park, H.S.; Lee, D.; Yoo, G.; Kim, T.; Jeon, H.; Yeo, M.K.; Lee, C.S.; Moon, J.Y.; Jung, S.S.; et al. Hippo pathway effector YAP inhibition restores the sensitivity of EGFR-TKI in lung adenocarcinoma having primary or acquired EGFR-TKI resistance. Biochem. Biophys. Res. Commun. 2016, 474, 154–160. [Google Scholar] [CrossRef] [PubMed]
- Junttila, M.R.; de Sauvage, F.J. Influence of tumour micro-environment heterogeneity on therapeutic response. Nature 2013, 501, 346–354. [Google Scholar] [CrossRef]
- Wu, S.D.; Ma, Y.S.; Fang, Y.; Liu, L.L.; Fu, D.; Shen, X.Z. Role of the microenvironment in hepatocellular carcinoma development and progression. Cancer Treat. Rev. 2012, 38, 218–225. [Google Scholar] [CrossRef]
- Heindl, A.; Lan, C.; Rodrigues, D.N.; Koelble, K.; Yuan, Y. Similarity and diversity of the tumor microenvironment in multiple metastases: Critical implications for overall and progression-free survival of high-grade serous ovarian cancer. Oncotarget 2016, 7, 71123–71135. [Google Scholar] [CrossRef] [Green Version]
- Yin, C.; Evason, K.J.; Asahina, K.; Stainier, D.Y. Hepatic stellate cells in liver development, regeneration, and cancer. J. Clin. Investig. 2013, 123, 1902–1910. [Google Scholar] [CrossRef] [Green Version]
- Bai, N.; Zhang, C.; Liang, N.; Zhang, Z.; Chang, A.; Yin, J.; Li, Z.; Luo, N.; Tan, X.; Luo, N.; et al. Yes-associated protein (YAP) increases chemosensitivity of hepatocellular carcinoma cells by modulation of p53. Cancer Biol. Ther. 2013, 14, 511–520. [Google Scholar] [CrossRef] [Green Version]
- Song, Y.; Kim, S.H.; Kim, K.M.; Choi, E.K.; Kim, J.; Seo, H.R. Activated hepatic stellate cells play pivotal roles in hepatocellular carcinoma cell chemoresistance and migration in multicellular tumor spheroids. Sci. Rep. 2016, 6, 36750. [Google Scholar] [CrossRef] [Green Version]
- Dupont, S.; Morsut, L.; Aragona, M.; Enzo, E.; Giulitti, S.; Cordenonsi, M.; Zanconato, F.; Le Digabel, J.; Forcato, M.; Bicciato, S.; et al. Role of YAP/TAZ in mechanotransduction. Nature 2011, 474, 179–183. [Google Scholar] [CrossRef] [PubMed]
- Aragona, M.; Panciera, T.; Manfrin, A.; Giulitti, S.; Michielin, F.; Elvassore, N.; Dupont, S.; Piccolo, S. A mechanical checkpoint controls multicellular growth through YAP/TAZ regulation by actin-processing factors. Cell 2013, 154, 1047–1059. [Google Scholar] [CrossRef] [PubMed] [Green Version]
- Calvo, F.; Ege, N.; Grande-Garcia, A.; Hooper, S.; Jenkins, R.P.; Chaudhry, S.I.; Harrington, K.; Williamson, P.; Moeendarbary, E.; Charras, G.; et al. Mechanotransduction and YAP-dependent matrix remodelling is required for the generation and maintenance of cancer-associated fibroblasts. Nat. Cell Biol. 2013, 15, 637–646. [Google Scholar] [CrossRef] [PubMed]


| Patient No. | Age/Sex | Etiology | Cirrhosis | Major Differentiation | Worst Pathology | Tumor Size (cm) | Number of Tumor | Vascular Invasion | AFP(ng/mL) | PIVKA-II (mAU/mL) |
|---|---|---|---|---|---|---|---|---|---|---|
| #1 | 65/M | non-viral | None | Well | Moderate | 3.3 | 1 | Present | 2.5 | 42 |
| #2 | 50/M | HBV | None | Moderate | Poor | 3.2 | 1 | not present | 8.5 | 19 |
| #3 | 71/M | non-viral | Cirrhosis | Moderate | Moderate | 1.6 | 1 | not present | 4 | 31 |
| #4 | 62/F | HBV | None | Moderate | Moderate | 6.2 | 1 | not present | 2.2 | 73 |
| #5 | 78/M | HCV | Cirrhosis | Moderate | Poor | 3.7 | 1 | Present | 18.2 | 21 |
| #6 | 53/M | HBV | Cirrhosis | Moderate | Poor | 3.8 | 2 | not present | 7.4 | 49 |
| #7 | 57/M | HBV | None | Moderate | Moderate | 3.1 | 1 | Present | 1.9 | 77 |
| #8 | 59/M | HBV | Cirrhosis | Poor | Poor | 6 | 1 | Present | 31.3 | 445 |
| #9 | 69/F | HBV | Cirrhosis | Moderate | Poor | 4.4 | 1 | Present | 1.6 | 18 |
| #10 | 68/M | non-viral | None | Moderate | Moderate | 1.8 | 1 | not present | 5 | 71 |
| MCTS | CA3 | Sorafenib + CA3 0.1 μM | Sorafenib |
|---|---|---|---|
| YAP/TAZ high | 0.45 μM | 9.4 μM | 16.4 μM |
| YAP/TAZ medium | 0.46 μM | 27.4 μM | 28.7 μM |
| YAP/TAZ low | 0.38 μM | 16.7 μM | 19.4 μM |
Publisher’s Note: MDPI stays neutral with regard to jurisdictional claims in published maps and institutional affiliations. |
© 2022 by the authors. Licensee MDPI, Basel, Switzerland. This article is an open access article distributed under the terms and conditions of the Creative Commons Attribution (CC BY) license (https://creativecommons.org/licenses/by/4.0/).
Share and Cite
Han, S.; Lim, J.Y.; Cho, K.; Lee, H.W.; Park, J.Y.; Ro, S.W.; Kim, K.S.; Seo, H.R.; Kim, D.Y. Anti-Cancer Effects of YAP Inhibitor (CA3) in Combination with Sorafenib against Hepatocellular Carcinoma (HCC) in Patient-Derived Multicellular Tumor Spheroid Models (MCTS). Cancers 2022, 14, 2733. https://doi.org/10.3390/cancers14112733
Han S, Lim JY, Cho K, Lee HW, Park JY, Ro SW, Kim KS, Seo HR, Kim DY. Anti-Cancer Effects of YAP Inhibitor (CA3) in Combination with Sorafenib against Hepatocellular Carcinoma (HCC) in Patient-Derived Multicellular Tumor Spheroid Models (MCTS). Cancers. 2022; 14(11):2733. https://doi.org/10.3390/cancers14112733
Chicago/Turabian StyleHan, Sojung, Ji Yeon Lim, Kyungjoo Cho, Hye Won Lee, Jun Yong Park, Simon Weonsang Ro, Kyung Sik Kim, Haeng Ran Seo, and Do Young Kim. 2022. "Anti-Cancer Effects of YAP Inhibitor (CA3) in Combination with Sorafenib against Hepatocellular Carcinoma (HCC) in Patient-Derived Multicellular Tumor Spheroid Models (MCTS)" Cancers 14, no. 11: 2733. https://doi.org/10.3390/cancers14112733
APA StyleHan, S., Lim, J. Y., Cho, K., Lee, H. W., Park, J. Y., Ro, S. W., Kim, K. S., Seo, H. R., & Kim, D. Y. (2022). Anti-Cancer Effects of YAP Inhibitor (CA3) in Combination with Sorafenib against Hepatocellular Carcinoma (HCC) in Patient-Derived Multicellular Tumor Spheroid Models (MCTS). Cancers, 14(11), 2733. https://doi.org/10.3390/cancers14112733