
Classic Hodgkin Lymphoma Refractory for ABVD Treatment Is Characterized by Pathologically Activated Signal Transduction Pathways as Revealed by Proteomic Profiling

 ,
,  ,
,
Abstract
Simple Summary
Abstract
1. Introduction
2. Materials and Methods
2.1. Patients
2.2. Samples/Sample Preparation
2.3. Label-Free Nano Liquid Chromatography—Tandem Mass Spectrometry (LFQ nLC-MS/MS)
2.4. Data and Bioinformatic Analyses
2.5. Statistical Analysis
3. Results
3.1. Study Cohort
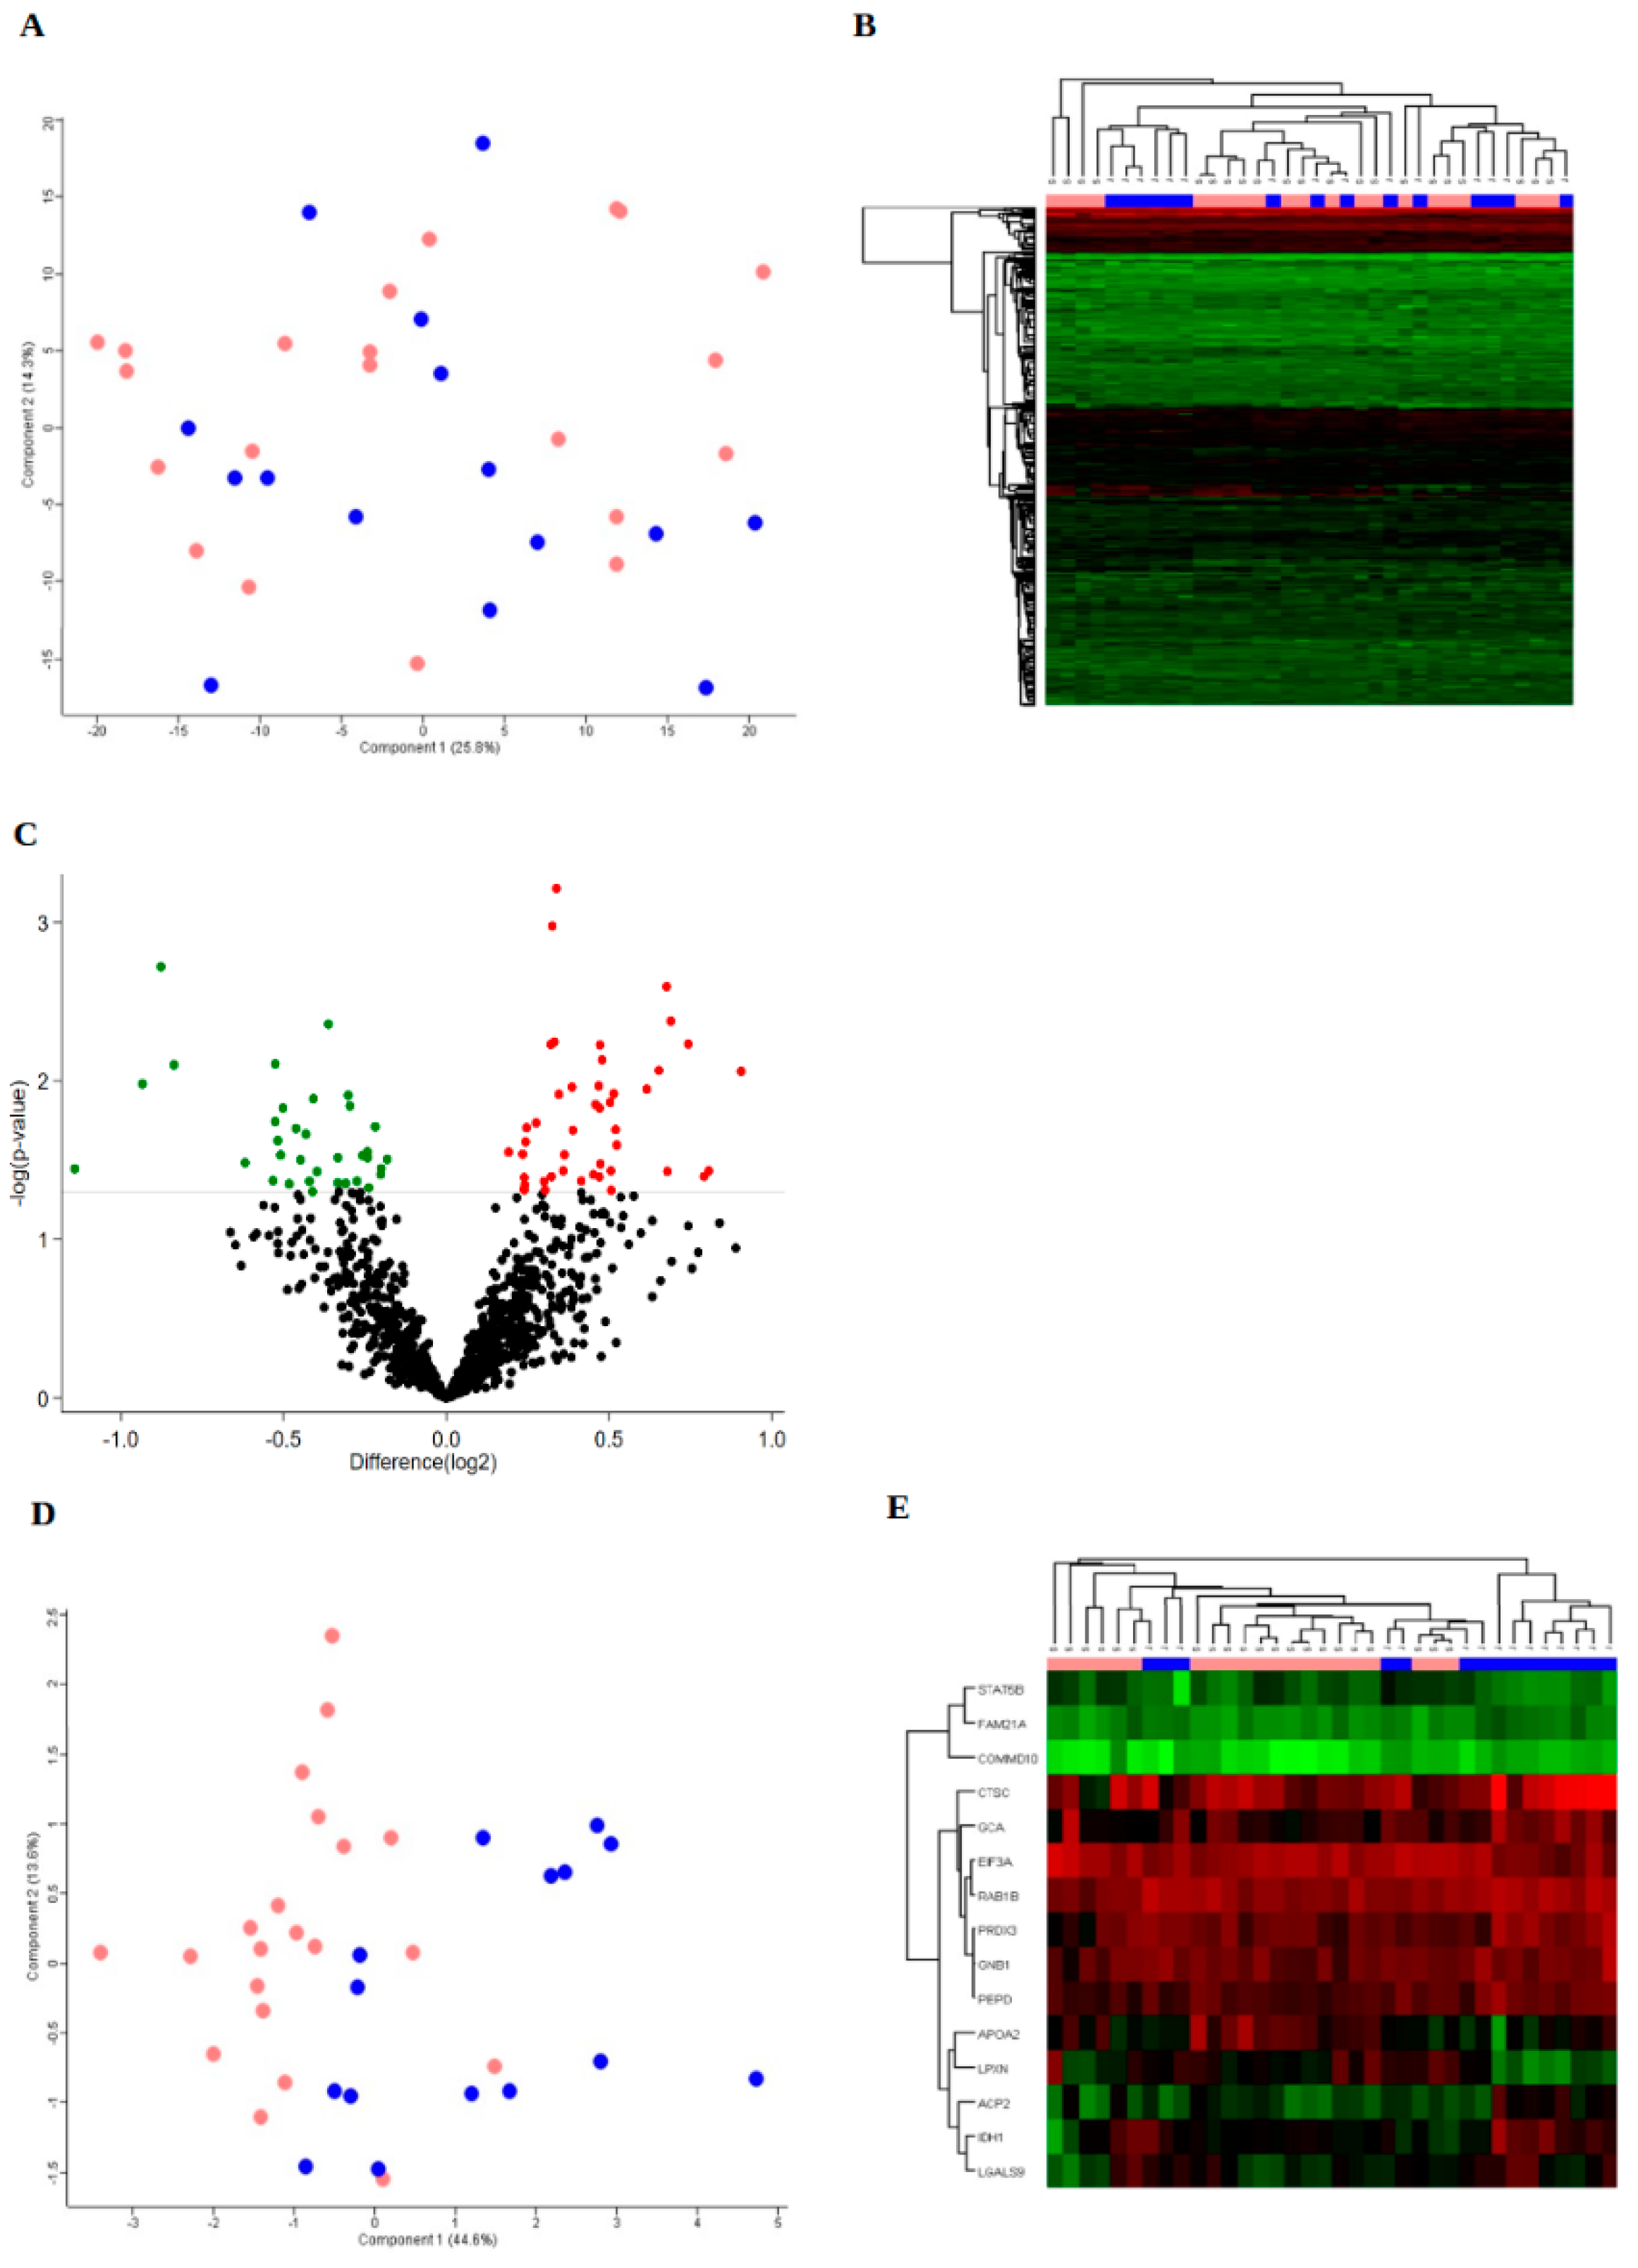
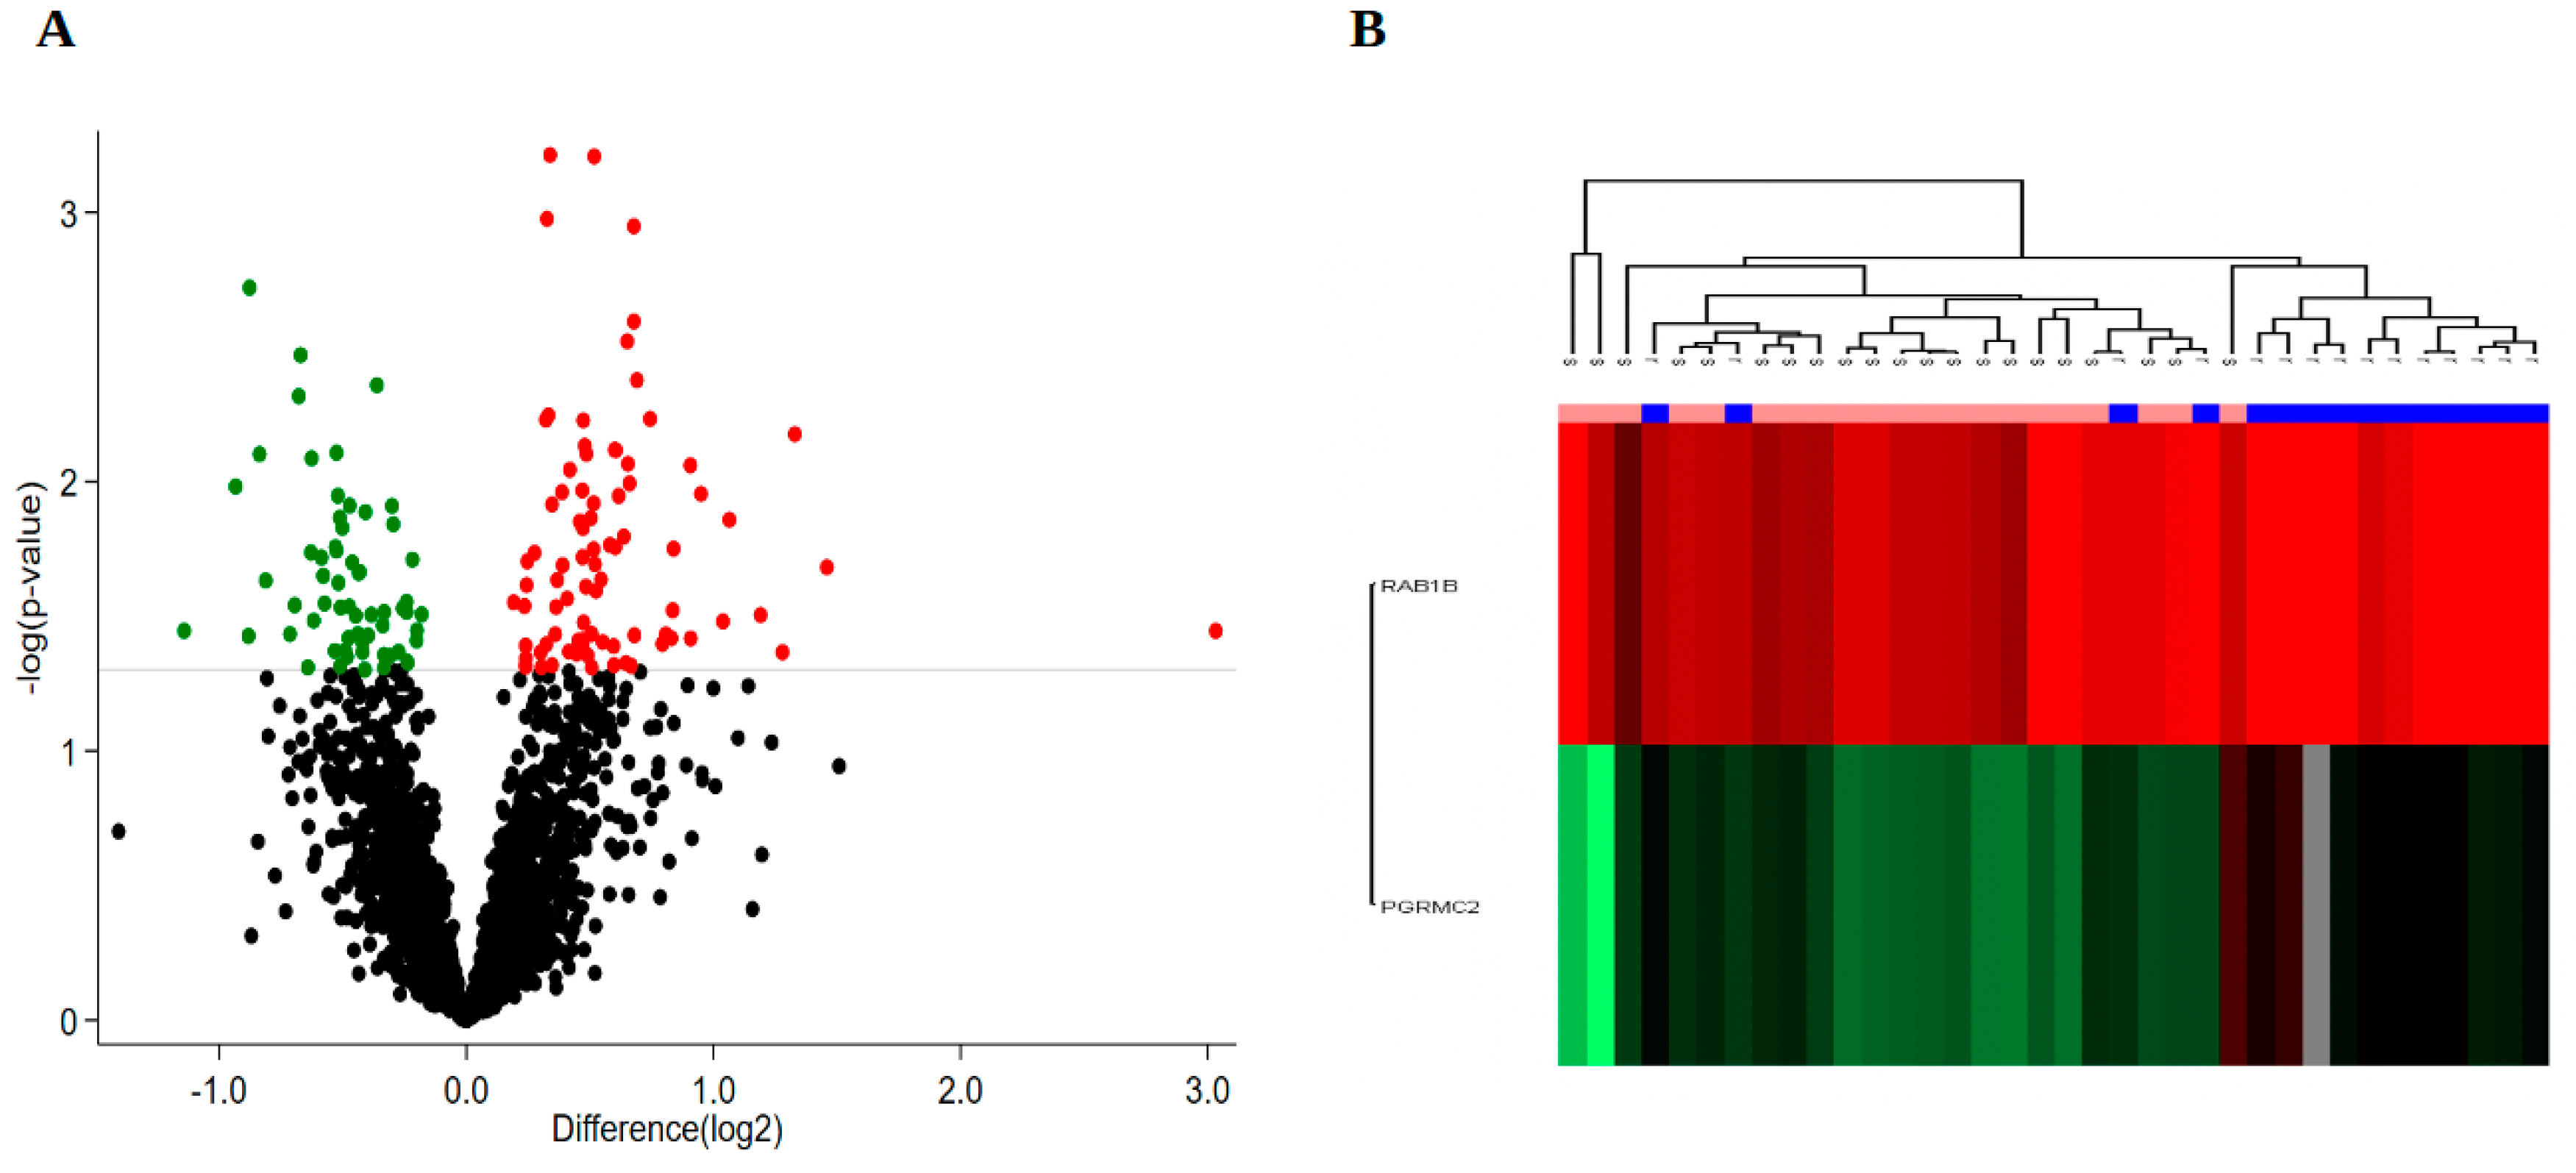
3.2. Protein Expression
3.3. Bioinformatics
4. Discussion
5. Conclusions
Supplementary Materials
Author Contributions
Funding
Institutional Review Board Statement
Informed Consent Statement
Data Availability Statement
Acknowledgments
Conflicts of Interest
References
- Swerdlow, S.H.; Campo, E.; Harris, N.L.; Jaffe, E.S.; Pileri, S.A.; Stein, H.; Thiele, J. WHO Classification of Tumours of Haematopoietic and Lymphoid Tissues, Revised, 4th ed.; IARC Press: Lyon, France, 2017. [Google Scholar]
- Brice, P.; de Kerviler, E.; Friedberg, J.W. Classical Hodgkin lymphoma. Lancet 2021, 398, 1518–1527. [Google Scholar] [CrossRef]
- Von Tresckow, B.; Kreissl, S.; Goergen, H.; Bröckelmann, P.J.; Pabst, T.; Fridrik, M.; Rummel, M.; Jung, W.; Thiemer, J.; Sasse, S.; et al. Intensive treatment strategies in advanced-stage Hodgkin’s lymphoma (HD9 and HD12): Analysis of long-term survival in two randomised trials. Lancet Haematol. 2018, 5, e462–e473. [Google Scholar] [CrossRef]
- Diehl, V.; Franklin, J.; Pfreundschuh, M.; Lathan, B.; Paulus, U.; Hasenclever, D.; Tesch, H.; Herrmann, R.; Dörken, B.; Müller-Hermelink, H.-K.; et al. Standard and Increased-Dose BEACOPP Chemotherapy Compared with COPP-ABVD for Advanced Hodgkin’s Disease. N. Engl. J. Med. 2003, 348, 2386–2395. [Google Scholar] [CrossRef] [PubMed]
- Ansell, S.M. Hodgkin lymphoma: A 2020 update on diagnosis, risk-stratification, and management. Am. J. Hematol. 2020, 95, 978–989. [Google Scholar] [CrossRef]
- Josting, A.; Rueffer, U.; Franklin, J.; Sieber, M.; Diehl, V.; Engert, A. Prognostic factors and treatment outcome in primary pro-gressive Hodgkin lymphoma: A report from the German Hodgkin Lymphoma Study Group. Blood 2000, 96, 1280–1286. Available online: http://ovidsp.ovid.com/ovidweb.cgi?T=JS&PAGE=reference&D=emed8&NEWS=N&AN=30658456 (accessed on 9 May 2017). [CrossRef] [PubMed]
- Enblad, G.; Sundstrom, C.; Glimelius, B. Infiltration of eosinophils in Hodgkin’s disease involved lymph nodes predicts prog-nosis. Hematol. Oncol. 1993, 11, 187–193. [Google Scholar] [CrossRef]
- Englund, A.; Molin, D.; Enblad, G.; Karlén, J.; Glimelius, I.; Ljungman, G.; Amini, R. The role of tumour-infiltrating eosinophils, mast cells and macrophages in Classical and Nodular Lymphocyte Predominant Hodgkin Lymphoma in children. Eur. J. Haematol. 2016, 97, 430–438. [Google Scholar] [CrossRef]
- Molin, D.; Fischer, M.; Xiang, Z.; Larsson, U.; Harvima, I.; Venge, P.; Nilsson, K.; Sundstro, C.; Enblad, G.; Nilsson, G. Mast cells ex-press functional CD30 ligand and are the predominant CD30L-positive cells in Hodgkin’s disease. Br. J. Haematol. 2001, 114, 616–623. [Google Scholar] [CrossRef]
- Andersen, M.D.; Kamper, P.; Nielsen, P.S.; Bendix, K.; Riber-Hansen, R.; Steiniche, T.; Hamilton-Dutoit, S.; Clausen, M.; d’Amore, F. Tumour-associated mast cells in classical Hodgkin’s lymphoma: Correlation with histological subtype, other tumour-infiltrating inflammatory cell subsets and outcome. Eur. J. Haematol. 2016, 96, 252–259. [Google Scholar] [CrossRef]
- Steidl, C.; Lee, T.; Shah, S.P.; Farinha, P.; Han, G.; Nayar, T.; Delaney, A.; Jones, S.; Iqbal, J.; Weisenburger, D.D.; et al. Tumor-Associated Macrophages and Survival in Classic Hodgkin’s Lymphoma. N. Engl. J. Med. 2010, 362, 875–885. [Google Scholar] [CrossRef]
- Kamper, P.; Bendix, K.; Hamilton-Dutoit, S.; Honoré, B.; Nyengaard, J.R.; D’Amore, F. Tumor-infiltrating macrophages correlate with adverse prognosis and Epstein-Barr virus status in classical Hodgkin’s lymphoma. Haematologica 2010, 96, 269–276. [Google Scholar] [CrossRef]
- Aldinucci, D.; Gloghini, A.; Pinto, A.; Filippi, R.D.; Carbone, A.; Carbone, A. The classical Hodgkin’ s lymphoma microenvironment and its role in promoting tumour growth and immune escape. J. Patol. 2010, 221, 248–263. Available online: http://www.ncbi.nlm.nih.gov/pubmed/20527019 (accessed on 16 April 2014).
- Connors, J.M.; Cozen, W.; Steidl, C.; Carbone, A.; Hoppe, R.T.; Flechtner, H.-H.; Bartlett, N.L. Hodgkin lymphoma. Nat. Rev. Dis. Prim. 2020, 6, 61. [Google Scholar] [CrossRef]
- Ma, Y.; Visser, L.; Roelofsen, H.; De Vries, M.; Diepstra, A.; Van Imhoff, G.; Van Der Wal, T.; Luinge, M.; Alvarez-Llamas, G.; Vos, H.; et al. Proteomics analysis of Hodgkin lymphoma: Identification of new players involved in the cross-talk between HRS cells and infiltrating lymphocytes. Blood 2008, 111, 2339–2346. [Google Scholar] [CrossRef]
- Wallentine, J.C.; Kim, K.K.; Seiler, C.E.; Vaughn, C.P.; Crockett, D.K.; Tripp, S.R.; Elenitoba-Johnson, K.; Lim, M. Comprehensive identification of proteins in Hodgkin lymphoma-derived Reed–Sternberg cells by LC-MS/MS. Lab. Investig. 2007, 87, 1113–1124. [Google Scholar] [CrossRef][Green Version]
- Kamper, P.; Ludvigsen, M.; Bendix, K.; Hamilton-Dutoit, S.; Rabinovich, G.A.; Møller, M.B.; Nyengaard, J.R.; Honore, B. Proteomic analysis identifies galectin-1 as a predictive biomarker for relapsed/refractory disease in classical Hodgkin lymphoma. Blood 2011, 117, 6638–6650. [Google Scholar] [CrossRef] [PubMed]
- Erichsen, R.; Lash, T.L.; Hamilton-Dutoit, S.J.; Bjerregaard, B.; Vyberg, M.; Pedersen, L. Existing data sources for clinical epidemi-ology: The Danish National Pathology Registry and Data Bank. Clin. Epidemiol. 2010, 2, 51–56. [Google Scholar] [CrossRef] [PubMed]
- Arboe, B.; Josefsson, P.; Jørgensen, J.; Haaber, J.; Jensen, P.; Poulsen, C.B.; Rønnov-Jessen, D.; Pedersen, R.S.; Pedersen, P.T.; Frederiksen, M.; et al. Danish National Lymphoma Registry. Clin. Epidemiol. 2016, 8, 577–581. [Google Scholar] [CrossRef]
- Arboe, B.; El-Galaly, T.C.; Clausen, M.R.; Munksgaard, P.S.; Stoltenberg, D.; Nygaard, M.K.; Klausen, T.W.; Christensen, J.H.; Gørløv, J.S.; Brown, P.D.N. The Danish National Lymphoma Registry: Coverage and Data Quality. PLoS ONE 2016, 11, e0157999. [Google Scholar] [CrossRef]
- Honoré, B. Proteomic Protocols for Differential Protein Expression Analyses. Methods Mol Biol. 2020, 2110, 47–58. [Google Scholar] [CrossRef] [PubMed]
- Ludvigsen, M.; Thorlacius-Ussing, L.; Vorum, H.; Moyer, M.P.; Stender, M.T.; Thorlacius-Ussing, O.; Honoré, B. Proteomic charac-terization of colorectal cancer cells versus normal-derived colon mucosa cells: Approaching identification of novel diagnos-tic protein biomarkers in colorectal cancer. Int. J. Mol. Sci. 2020, 21, 3466. [Google Scholar] [CrossRef]
- Tyanova, S.; Temu, T.; Cox, J. The MaxQuant computational platform for mass spectrometry-based shotgun proteomics. Nat. Protoc. 2016, 11, 2301–2319. [Google Scholar] [CrossRef] [PubMed]
- Tyanova, S.; Temu, T.; Sinitcyn, P.; Carlson, A.; Hein, M.Y.; Geiger, T.; Mann, M.; Cox, J. The Perseus computational platform for comprehensive analysis of (prote)omics data. Nat. Methods 2016, 13, 731–740. [Google Scholar] [CrossRef]
- Krämer, A.; Green, J.; Pollard, J., Jr.; Tugendreich, S. Causal analysis approaches in Ingenuity Pathway Analysis. Bioinformatics 2014, 30, 523–530. [Google Scholar] [CrossRef]
- Kashyap, M.; Amaya-Chanaga, C.I.; Kumar, D.; Simmons, B.; Huser, N.; Gu, Y.; Hallin, M.; Lindquist, K.; Yafawi, R.; Choi, M.Y.; et al. Targeting the CXCR4 pathway using a novel anti-CXCR4 IgG1 antibody (PF-06747143) in chronic lymphocytic leukemia. J. Hematol. Oncol. 2017, 10, 112. [Google Scholar] [CrossRef]
- Mortezaee, K. CXCL12/CXCR4 axis in the microenvironment of solid tumors: A critical mediator of metastasis. Life Sci. 2020, 249, 117534. [Google Scholar] [CrossRef] [PubMed]
- Domańska, U.M.; Kruizinga, R.C.; Nagengast, W.B.; Timmer-Bosscha, H.; Huls, G.; de Vries, E.G.; Walenkamp, A.M. A review on CXCR4/CXCL12 axis in oncology: No place to hide. Eur. J. Cancer 2013, 49, 219–230. [Google Scholar] [CrossRef] [PubMed]
- Dutton, A.; Reynolds, G.M.; Dawson, C.W.; Young, L.S.; Murray, P.G. Constitutive activation of phosphatidyl-inositide 3 kinase contributes to the survival of Hodgkin’s lymphoma cells through a mechanism involving Akt kinase and mTOR. J. Pathol. 2005, 205, 498–506. [Google Scholar] [CrossRef]
- Singh, S.; Srivastava, S.K.; Bhardwaj, A.; Owen, L.B.; Singh, A.P. CXCL12–CXCR4 signalling axis confers gemcitabine resistance to pancreatic cancer cells: A novel target for therapy. Br. J. Cancer 2010, 103, 1671–1679. [Google Scholar] [CrossRef]
- Domańska, U.; Timmer-Bosscha, H.; Nagengast, W.B.; Munnink, T.H.O.; Kruizinga, R.C.; Ananias, H.J.; Kliphuis, N.M.; Huls, G.; de Vries, E.; de Jong, I.J.; et al. CXCR4 Inhibition with AMD3100 Sensitizes Prostate Cancer to Docetaxel Chemotherapy. Neoplasia 2012, 14, 709–718. [Google Scholar] [CrossRef]
- Huynh, C.; Dingemanse, J.; zu Schwabedissen, H.E.M.; Sidharta, P.N. Relevance of the CXCR4/CXCR7-CXCL12 axis and its effect in pathophysiological conditions. Pharmacol. Res. 2020, 161, 105092. [Google Scholar] [CrossRef] [PubMed]
- Audrito, V.; Vaisitti, T.; Serra, S.; Bologna, C.; Brusa, D.; Malavasi, F.; Deaglio, S. Targeting the microenvironment in chronic lymphocytic leukemia offers novel therapeutic options. Cancer Lett. 2013, 328, 27–35. [Google Scholar] [CrossRef] [PubMed]
- Peng, S.B.; Zhang, X.; Paul, D.; Kays, L.M.; Ye, M.; Vaillancourt, P.; Dowless, M.; Stancato, L.F.; Stewart, J.; Uhlik, M.T.; et al. Inhibition of CXCR4 by LY2624587, a fully humanized anti-CXCR4 antibody induces apoptosis of hemato-logic malignancies. PLoS ONE 2016, 11, e0150585. [Google Scholar]
- Wettschureck, N.; Offermanns, S. Mammalian G Proteins and Their Cell Type Specific Functions. Physiol. Rev. 2005, 85, 1159–1204. [Google Scholar] [CrossRef]
- Oldham, W.; Hamm, H.E. Heterotrimeric G protein activation by G-protein-coupled receptors. Nat. Rev. Mol. Cell Biol. 2008, 9, 60–71. [Google Scholar] [CrossRef]
- Moreno, E.; Cavic, M.; Krivokuca, A.; Casadó, V.; Canela, E. The endocannabinoid system as a target in cancer diseases: Are we there yet? Front. Pharmacol. 2019, 10, 339. [Google Scholar] [CrossRef]
- Fraguas-Sánchez, A.I.; Martín-Sabroso, C.; Torres-Suárez, A.I. Insights into the effects of the endocannabinoid system in cancer: A review. Br. J. Pharmacol. 2018, 175, 2566–2580. [Google Scholar] [CrossRef]
- Kandouz, M. The Eph/Ephrin family in cancer metastasis: Communication at the service of invasion. Cancer Metastasis Rev. 2012, 31, 353–373. [Google Scholar] [CrossRef]
- Guzmán, M. Cannabinoids: Potential anticancer agents. Nat. Cancer 2003, 3, 745–755. [Google Scholar] [CrossRef]
- Zhang, J.; Medina-Cleghorn, D.; Bernal-Mizrachi, L.; Bracci, P.M.; Hubbard, A.; Conde, L.; Riby, J.; Nomura, D.K.; Skibola, C.F. The potential relevance of the endocannabinoid, 2-arachidonoylglycerol, in diffuse large B-cell lymphoma. Oncoscience 2016, 3, 31–41. [Google Scholar] [CrossRef][Green Version]
- Benz, A.H.; Renné, C.; Maronde, E.; Koch, M.; Grabiec, U.; Kallendrusch, S.; Rengstl, B.; Newrzela, S.; Hartmann, S.; Hansmann, M.-L.; et al. Expression and Functional Relevance of Cannabinoid Receptor 1 in Hodgkin Lymphoma. PLoS ONE 2013, 8, e81675. [Google Scholar] [CrossRef]
- Kania, A.; Klein, R. Mechanisms of ephrin-Eph signalling in development, physiology and disease. Nat. Rev. Mol. Cell Biol. 2016, 17, 240–256. [Google Scholar] [CrossRef]
- Surawska, H.; Ma, P.C.; Salgia, R. The role of ephrins and Eph receptors in cancer. Cytokine Growth Factor Rev. 2004, 15, 419–433. [Google Scholar] [CrossRef]
- Liang, L.-Y.; Patel, O.; Janes, P.W.; Murphy, J.M.; Lucet, I.S. Eph receptor signalling: From catalytic to non-catalytic functions. Oncogene 2019, 38, 6567–6584. [Google Scholar] [CrossRef] [PubMed]
- Pasquale, E.B. Eph receptors and ephrins in cancer: Bidirectional signalling and beyond. Nat. Cancer 2010, 10, 165–180. [Google Scholar] [CrossRef]
- Miao, H.; Gale, N.W.; Guo, H.; Qian, J.; Petty, A.M.; Kaspar, J.; Murphy, A.; Valenzuela, D.M.; Yancopoulos, G.D.; Hambardzumyan, D.; et al. EphA2 promotes infiltrative invasion of glioma stem cells in vivo through cross-talk with Akt and regulates stem cell properties. Oncogene 2014, 34, 558–567. [Google Scholar] [CrossRef] [PubMed]
- Lodola, A.; Giorgio, C.; Incerti, M.; Zanotti, I.; Tognolini, M. Targeting Eph/ephrin system in cancer therapy. Eur. J. Med. Chem. 2017, 142, 152–162. [Google Scholar] [CrossRef] [PubMed]
- Oricchio, E.; Nanjangud, G.; Wolfe, A.L.; Schatz, J.; Mavrakis, K.J.; Jiang, M.; Liu, X.; Bruno, J.; Heguy, A.; Olshen, A.B.; et al. The Eph-Receptor A7 Is a Soluble Tumor Suppressor for Follicular Lymphoma. Cell 2011, 147, 554–564. [Google Scholar] [CrossRef]
- Swords, R.T.; Greenberg, P.L.; Wei, A.H.; Durrant, S.; Advani, A.S.; Hertzberg, M.S.; Lewis, I.D.; Rivera, G.; Gratzinger, D.; Fan, A.C.; et al. KB004, a first in class monoclonal antibody targeting the receptor tyrosine kinase EphA3, in patients with advanced hematologic malignancies: Results from a phase 1 study. Leuk. Res. 2016, 50, 123–131. [Google Scholar] [CrossRef]


| Characteristics | All Patients (n = 36) | Refractory Group (n = 15) | Sensitive Group (n = 21) | |||
|---|---|---|---|---|---|---|
| No. of Patients | % | No. of Patients | % | No. of Patients | % | |
| Median age years (range) | 36 (15–79) | 32 (15–72) | 36 (17–79) | |||
| Sex (n = 36) | ||||||
| Male | 21 | 58.3 | 8 | 53.3 | 13 | 61.9 |
| Female | 15 | 41.7 | 7 | 46.7 | 8 | 38.1 |
| IPS (n = 35) | ||||||
| 0–3 | 29 | 82.9 | 10 | 71.4 | 19 | 90.5 |
| >3 | 6 | 17.1 | 4 | 28.6 | 2 | 9.5 |
| Histology (n = 36) | ||||||
| NS | 31 | 86.1 | 12 | 80.0 | 19 | 90.5 |
| MC | 4 | 11.1 | 2 | 13.3 | 2 | 9.5 |
| LD | 1 | 2.8 | 1 | 6.7 | 0 | 0 |
| B-Symptoms (n = 36) | ||||||
| No | 16 | 44.4 | 5 | 33.3 | 11 | 52.4 |
| Yes | 20 | 55.6 | 10 | 66.7 | 10 | 47.6 |
| Ann Arbor (n = 36) | ||||||
| I–II | 20 | 55.6 | 6 | 40.0 | 14 | 66.7 |
| III–IV | 16 | 44.4 | 9 | 60.0 | 7 | 33.3 |
| Bulk (n = 34) | ||||||
| No | 21 | 61.8 | 5 | 38.5 | 16 | 76.2 |
| Yes | 13 | 38.2 | 8 | 61.5 | 5 | 23.8 |
| Treatment modality (n = 36) | ||||||
| ABVD | 29 | 80.6 | 13 | 86.7 | 16 | 76.2 |
| ABVD/COPP | 7 | 19.4 | 2 | 13.3 | 5 | 23.8 |
| CMT (n = 21) | ||||||
| ABVD+RT | 16 | 76.2 | 7 | 100.0 | 9 | 64.3 |
| ABVD/COPP+RT | 5 | 23.8 | 0 | 0 | 5 | 35.7 |
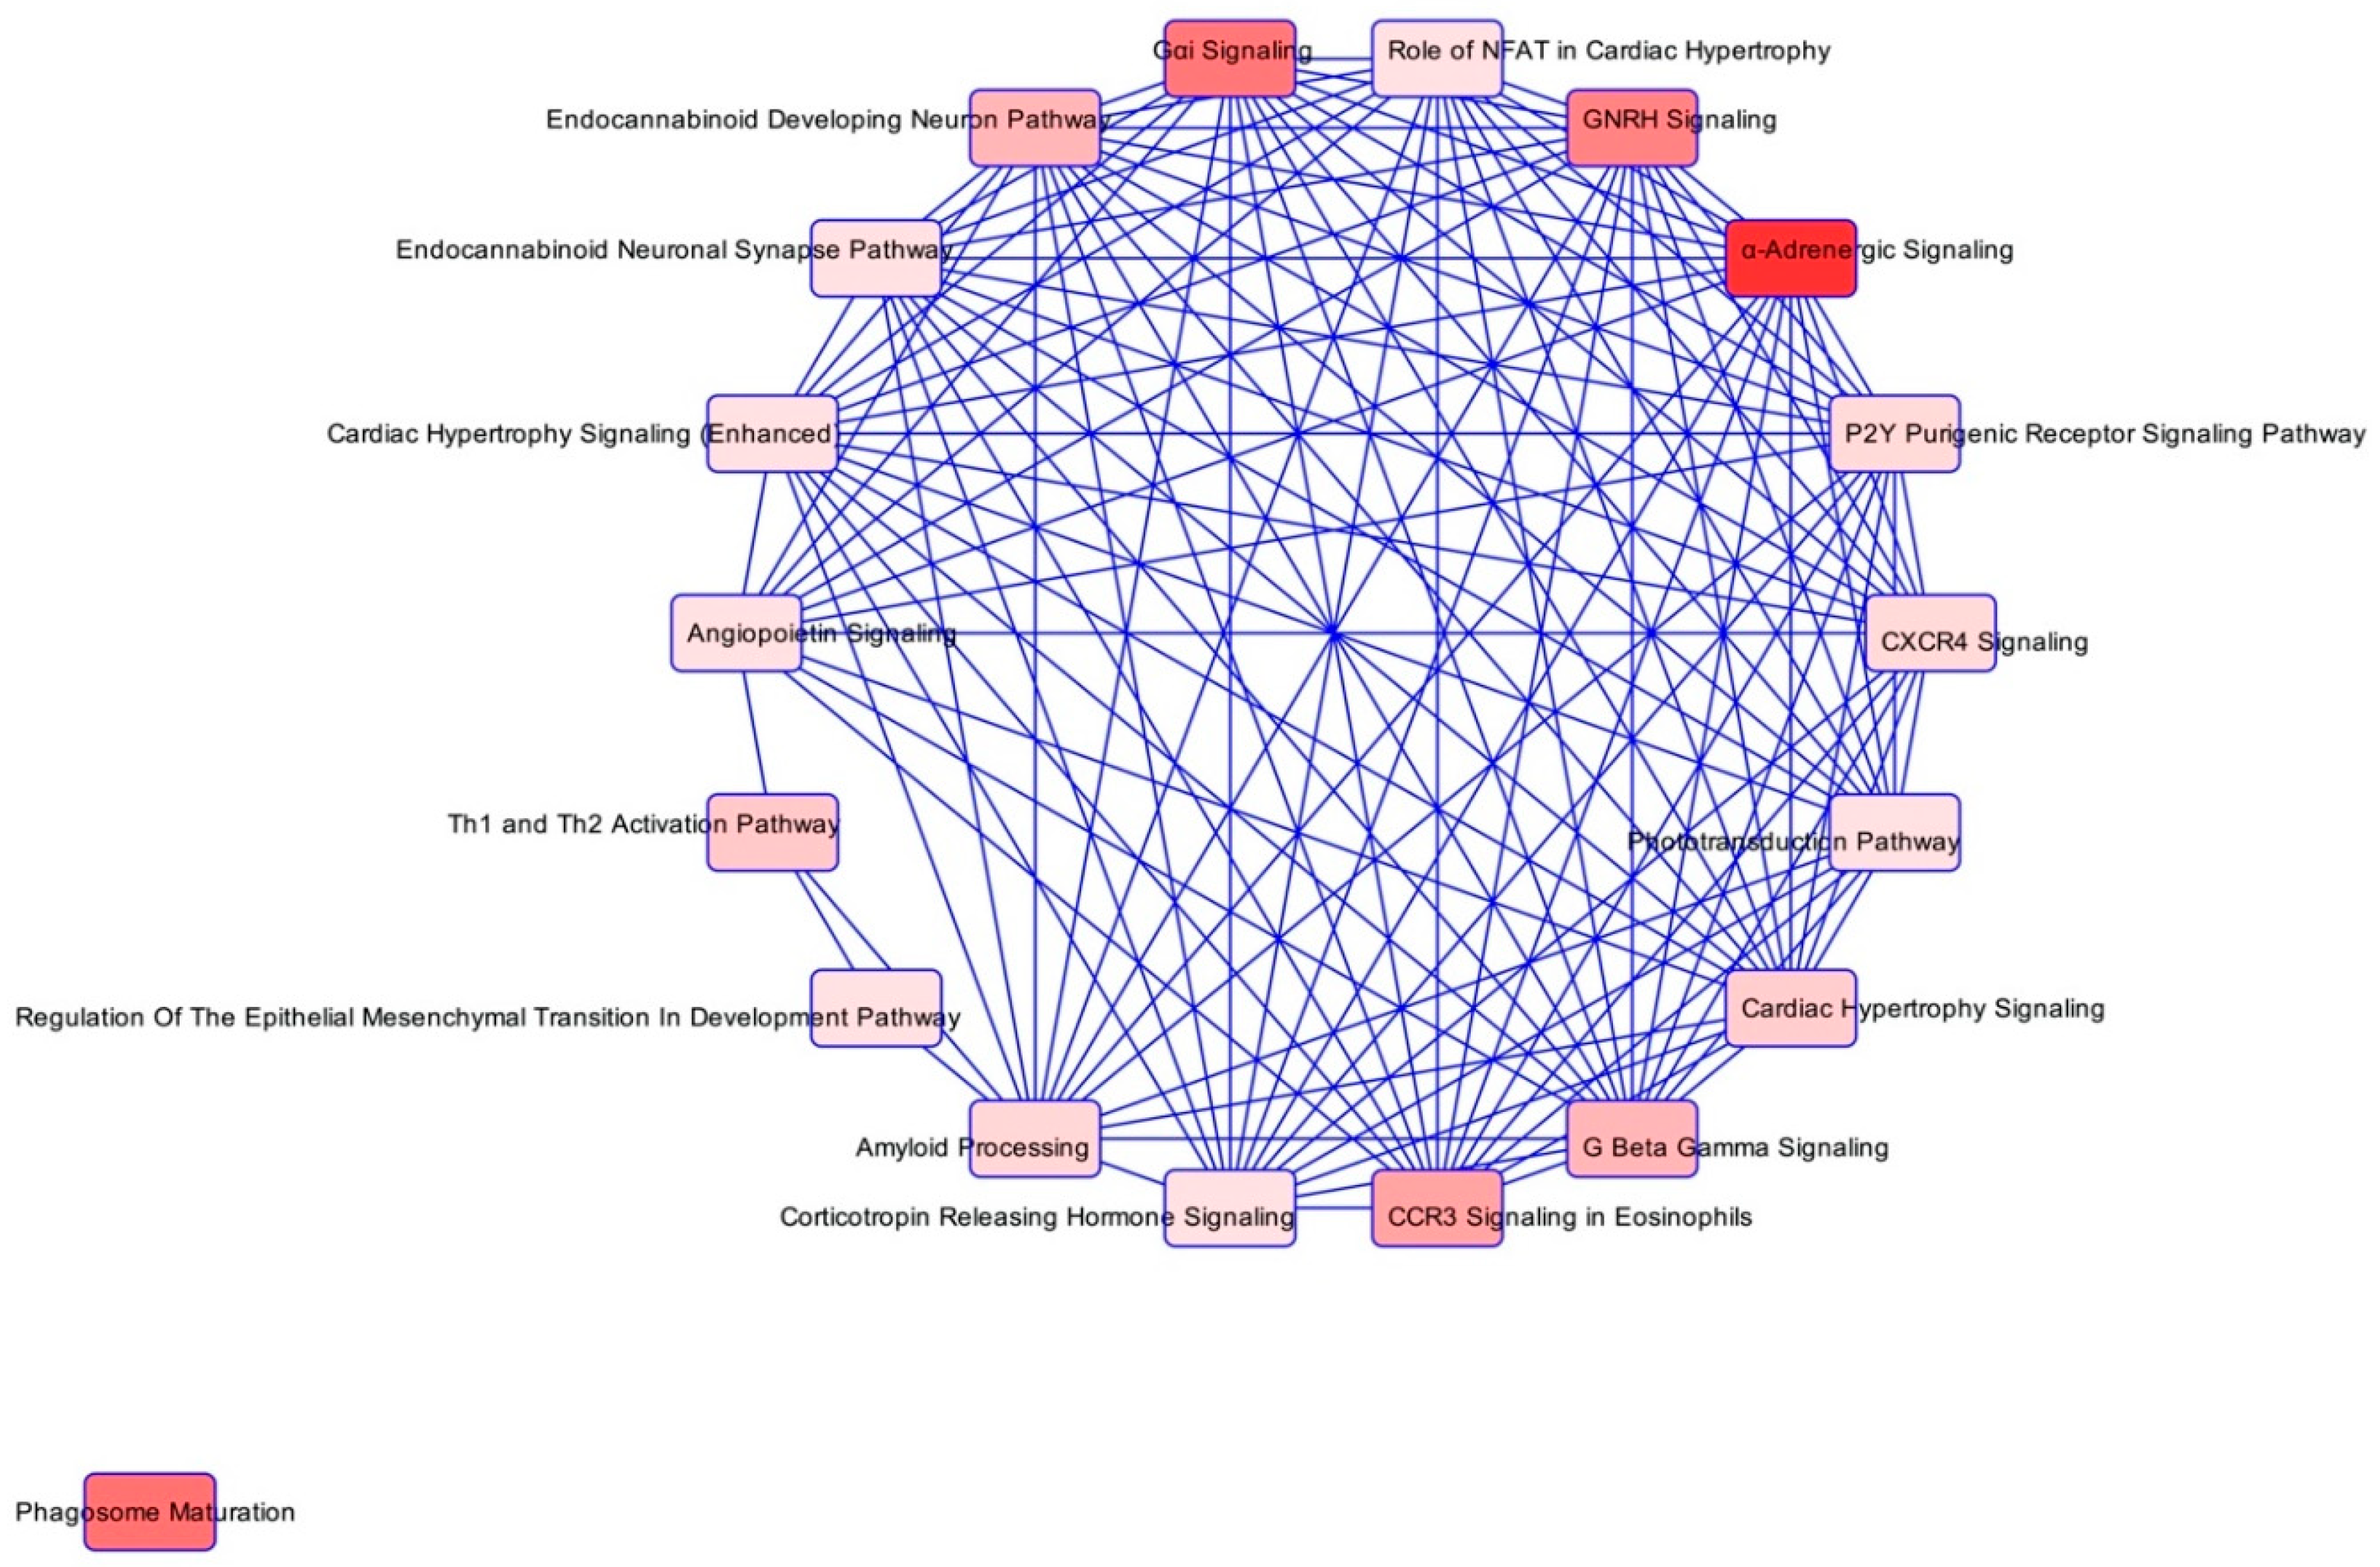
| Ingenuity Canonical Pathways | −log(p-Value) | Ratio | z-Score | Molecules |
|---|---|---|---|---|
| α-Adrenergic Signalling | 2.56 | 0.312 | GNAI2, GNB1, PRKACB, PYGB, RALB | |
| Phagosome Maturation | 1.99 | 0.184 | ATP6V1G1, CTSC, CTSZ, DYNLT1, NAPA, RAB5C, RAB7A | |
| Gαi Signalling | 1.97 | 0.286 | 2 | GNAI2, GNB1, PRKACB, RALB |
| GNRH Signalling | 1.92 | 0.227 | 1.342 | GNAI2, GNB1, PAK2, PRKACB, RALB |
| CCR3 Signalling in Eosinophils | 1.75 | 0.25 | GNAI2, GNB1, PAK2, RALB | |
| G Beta Gamma Signalling | 1.66 | 0.235 | 1 | GNAI2, GNB1, PRKACB, RALB |
| Endocannabinoid Developing Neuron Pathway | 1.66 | 0.235 | GNAI2, GNB1, PRKACB, RALB | |
| Th1 and Th2 Activation Pathway | 1.57 | 0.222 | CHD4, LGALS9, NCSTN, STAT5B | |
| Cardiac Hypertrophy Signalling | 1.54 | 0.185 | 0.447 | GNAI2, GNB1, HSPB1, PRKACB, RALB |
| Amyloid Processing | 1.5 | 0.273 | CAPN2, NCSTN, PRKACB | |
| CXCR4 Signalling | 1.49 | 0.211 | 2 | GNAI2, GNB1, PAK2, RALB |
| P2Y Purigenic Receptor Signalling Pathway | 1.49 | 0.211 | 0 | GNAI2, GNB1, PRKACB, RALB |
| Phototransduction Pathway | 1.42 | 0.4 | GNB1, PRKACB | |
| Regulation of the Epithelial Mesenchymal Transition in Development Pathway | 1.42 | 0.4 | NCSTN, S100A4 | |
| Role of NFAT in Cardiac Hypertrophy | 1.42 | 0.2 | 0 | GNAI2, GNB1, PRKACB, RALB |
| Cardiac Hypertrophy Signalling (Enhanced) | 1.41 | 0.154 | 0.816 | DIAPH1, GNAI2, GNB1, HSPB1, PRKACB, RALB |
| Angiopoietin Signalling | 1.4 | 0.25 | PAK2, RALB, STAT5B | |
| Endocannabinoid Neuronal Synapse Pathway | 1.4 | 0.25 | GNAI2, GNB1, PRKACB | |
| Corticotropin Releasing Hormone Signalling | 1.31 | 0.231 | ARPC5, GNAI2, PRKACB |
Publisher’s Note: MDPI stays neutral with regard to jurisdictional claims in published maps and institutional affiliations. |
© 2022 by the authors. Licensee MDPI, Basel, Switzerland. This article is an open access article distributed under the terms and conditions of the Creative Commons Attribution (CC BY) license (https://creativecommons.org/licenses/by/4.0/).
Share and Cite
Honoré, B.; Andersen, M.D.; Wilken, D.; Kamper, P.; d’Amore, F.; Hamilton-Dutoit, S.; Ludvigsen, M. Classic Hodgkin Lymphoma Refractory for ABVD Treatment Is Characterized by Pathologically Activated Signal Transduction Pathways as Revealed by Proteomic Profiling. Cancers 2022, 14, 247. https://doi.org/10.3390/cancers14010247
Honoré B, Andersen MD, Wilken D, Kamper P, d’Amore F, Hamilton-Dutoit S, Ludvigsen M. Classic Hodgkin Lymphoma Refractory for ABVD Treatment Is Characterized by Pathologically Activated Signal Transduction Pathways as Revealed by Proteomic Profiling. Cancers. 2022; 14(1):247. https://doi.org/10.3390/cancers14010247
Chicago/Turabian StyleHonoré, Bent, Maja Dam Andersen, Diani Wilken, Peter Kamper, Francesco d’Amore, Stephen Hamilton-Dutoit, and Maja Ludvigsen. 2022. "Classic Hodgkin Lymphoma Refractory for ABVD Treatment Is Characterized by Pathologically Activated Signal Transduction Pathways as Revealed by Proteomic Profiling" Cancers 14, no. 1: 247. https://doi.org/10.3390/cancers14010247
APA StyleHonoré, B., Andersen, M. D., Wilken, D., Kamper, P., d’Amore, F., Hamilton-Dutoit, S., & Ludvigsen, M. (2022). Classic Hodgkin Lymphoma Refractory for ABVD Treatment Is Characterized by Pathologically Activated Signal Transduction Pathways as Revealed by Proteomic Profiling. Cancers, 14(1), 247. https://doi.org/10.3390/cancers14010247