
Phosphodiesterase 4D Depletion/Inhibition Exerts Anti-Oncogenic Properties in Hepatocellular Carcinoma

 ,
,  and
and
Abstract
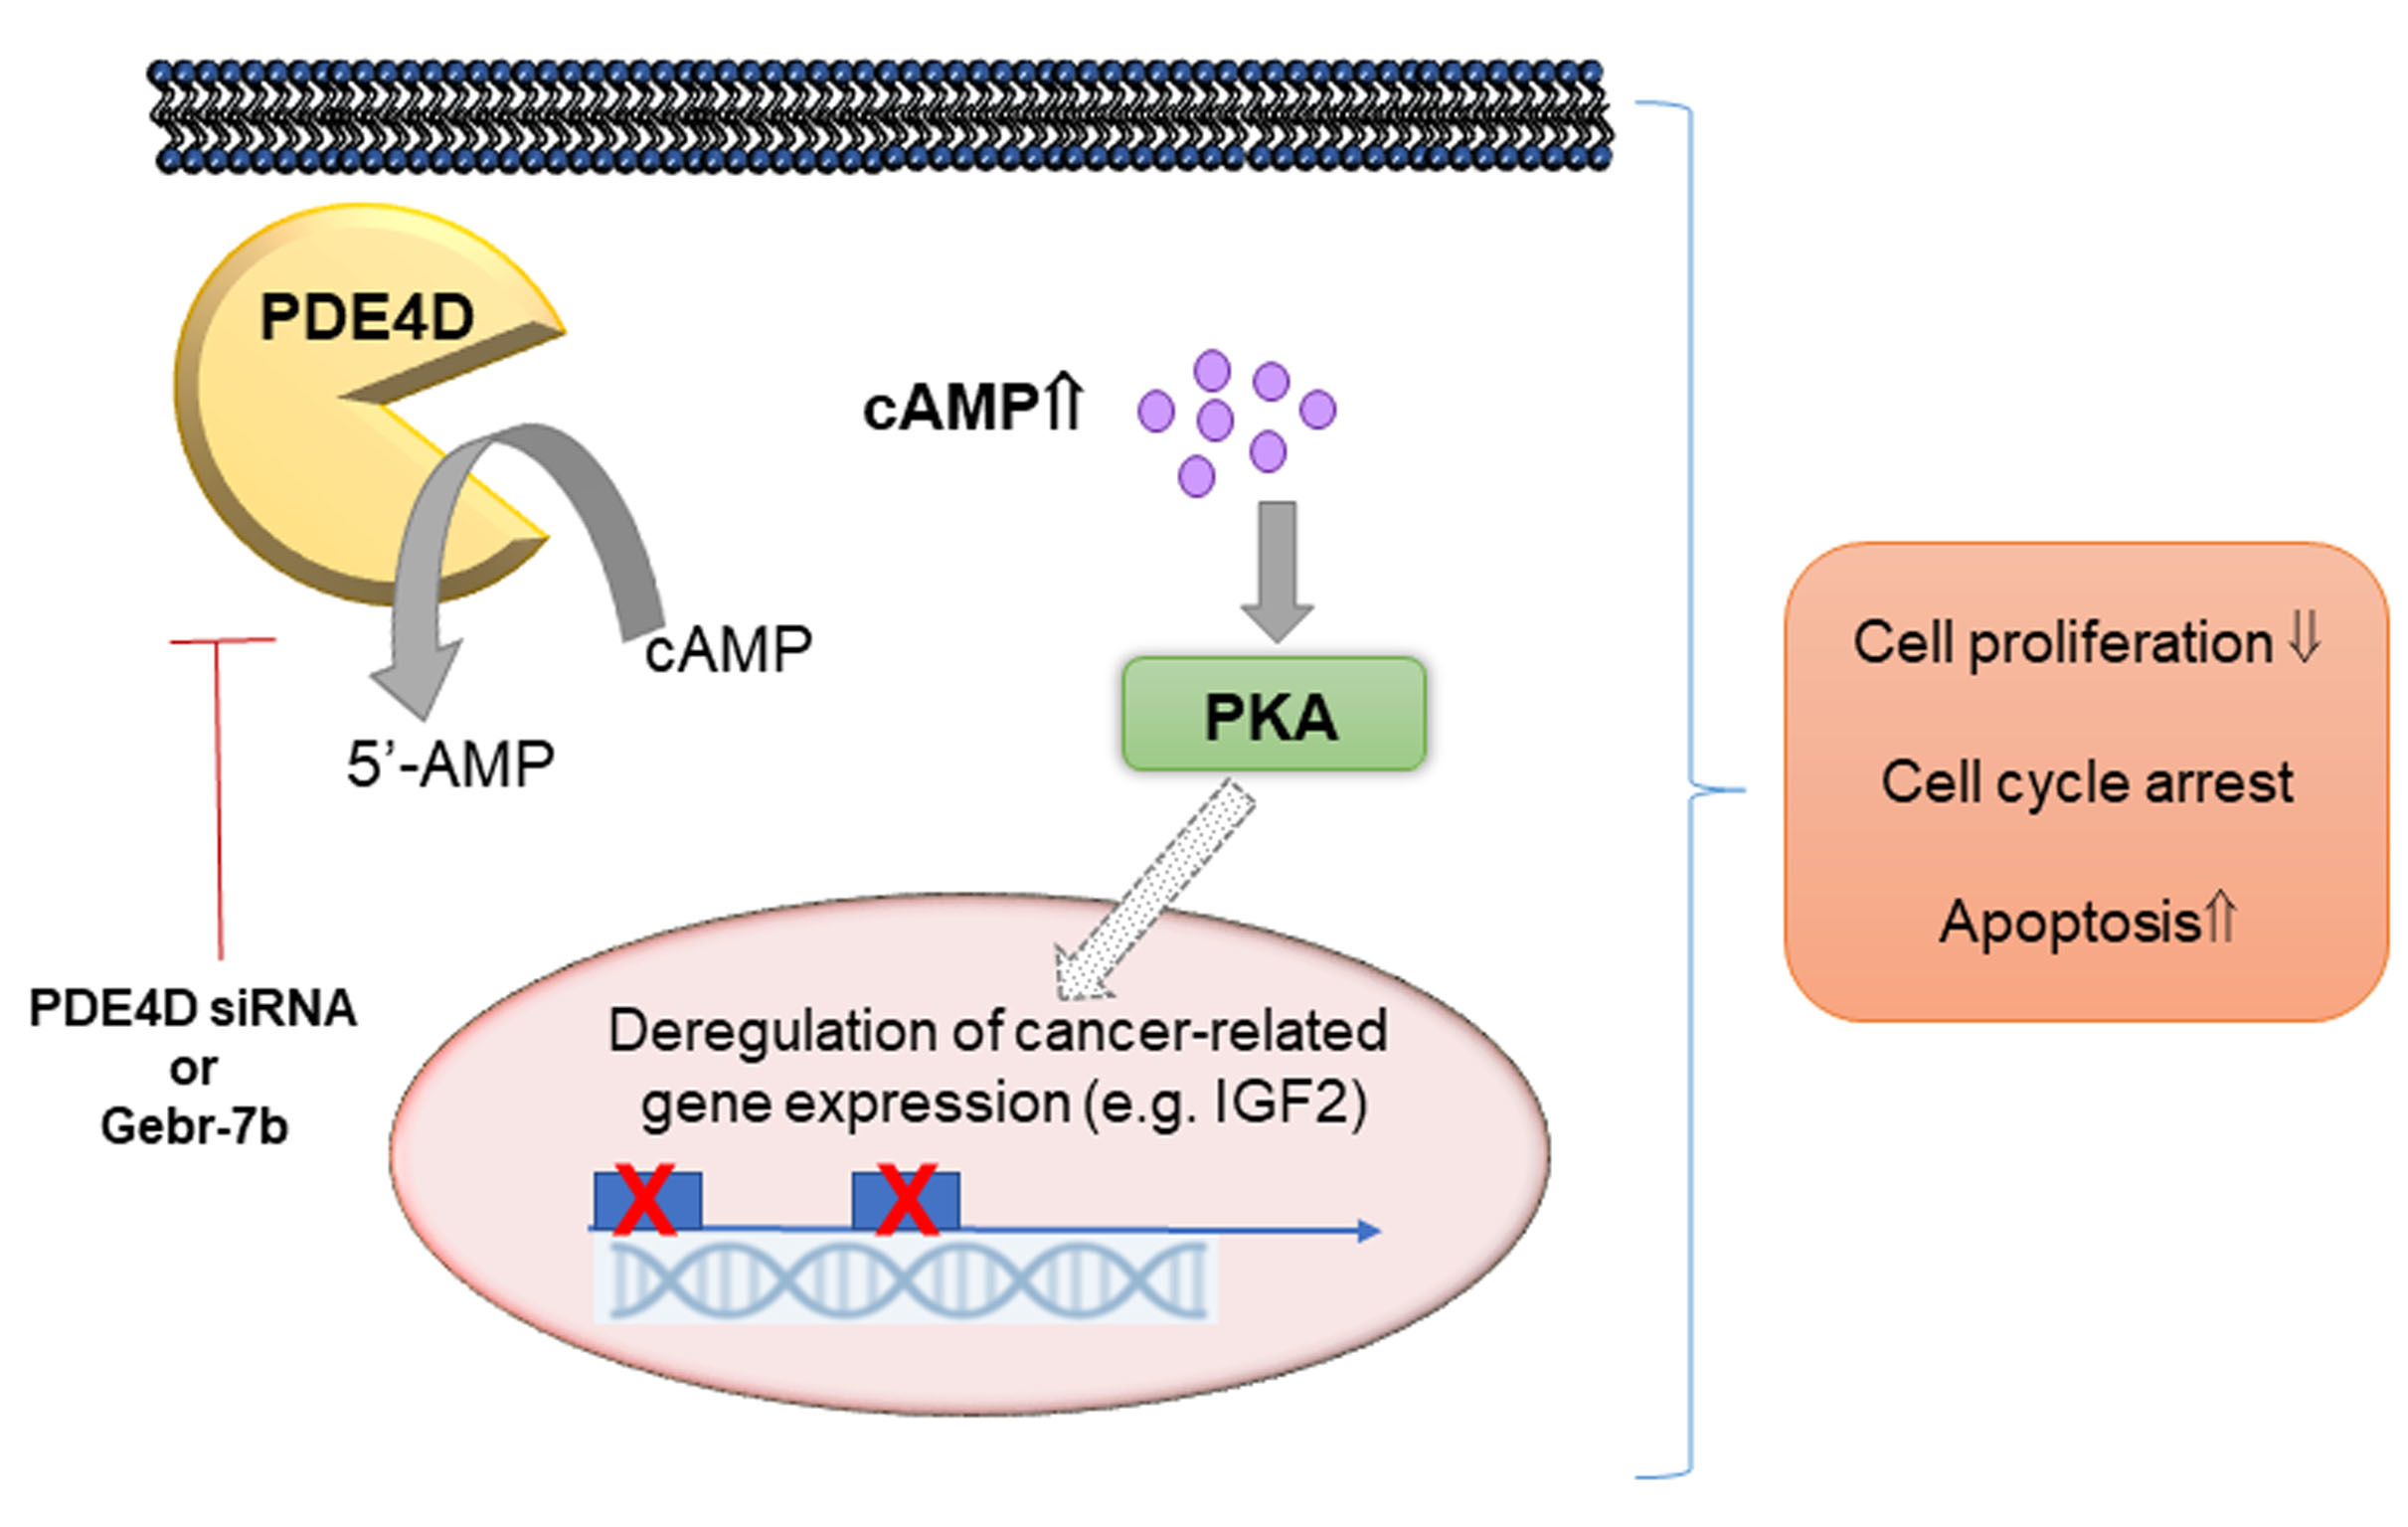
Simple Summary
Abstract

1. Introduction
2. Materials and Methods
2.1. Tissue Microarray Construction and Immunofluorescence
2.2. Gene Expression Profiling Interactive Analysis (GEPIA)
2.3. Cell Lines, Cultures and Drug Treatments
2.4. Quantitative Real-Time PCR (qRT-PCR)
2.5. Western Blotting
2.6. Cell Homogenization, PDE Activity and Cyclic AMP Level Assay
2.7. Small Interference RNA (siRNA) Transfection
2.8. DELFIA Cell Proliferation Assay
2.9. Cell Cycle and Apoptosis
2.10. Open Array
2.11. Statistics
3. Results
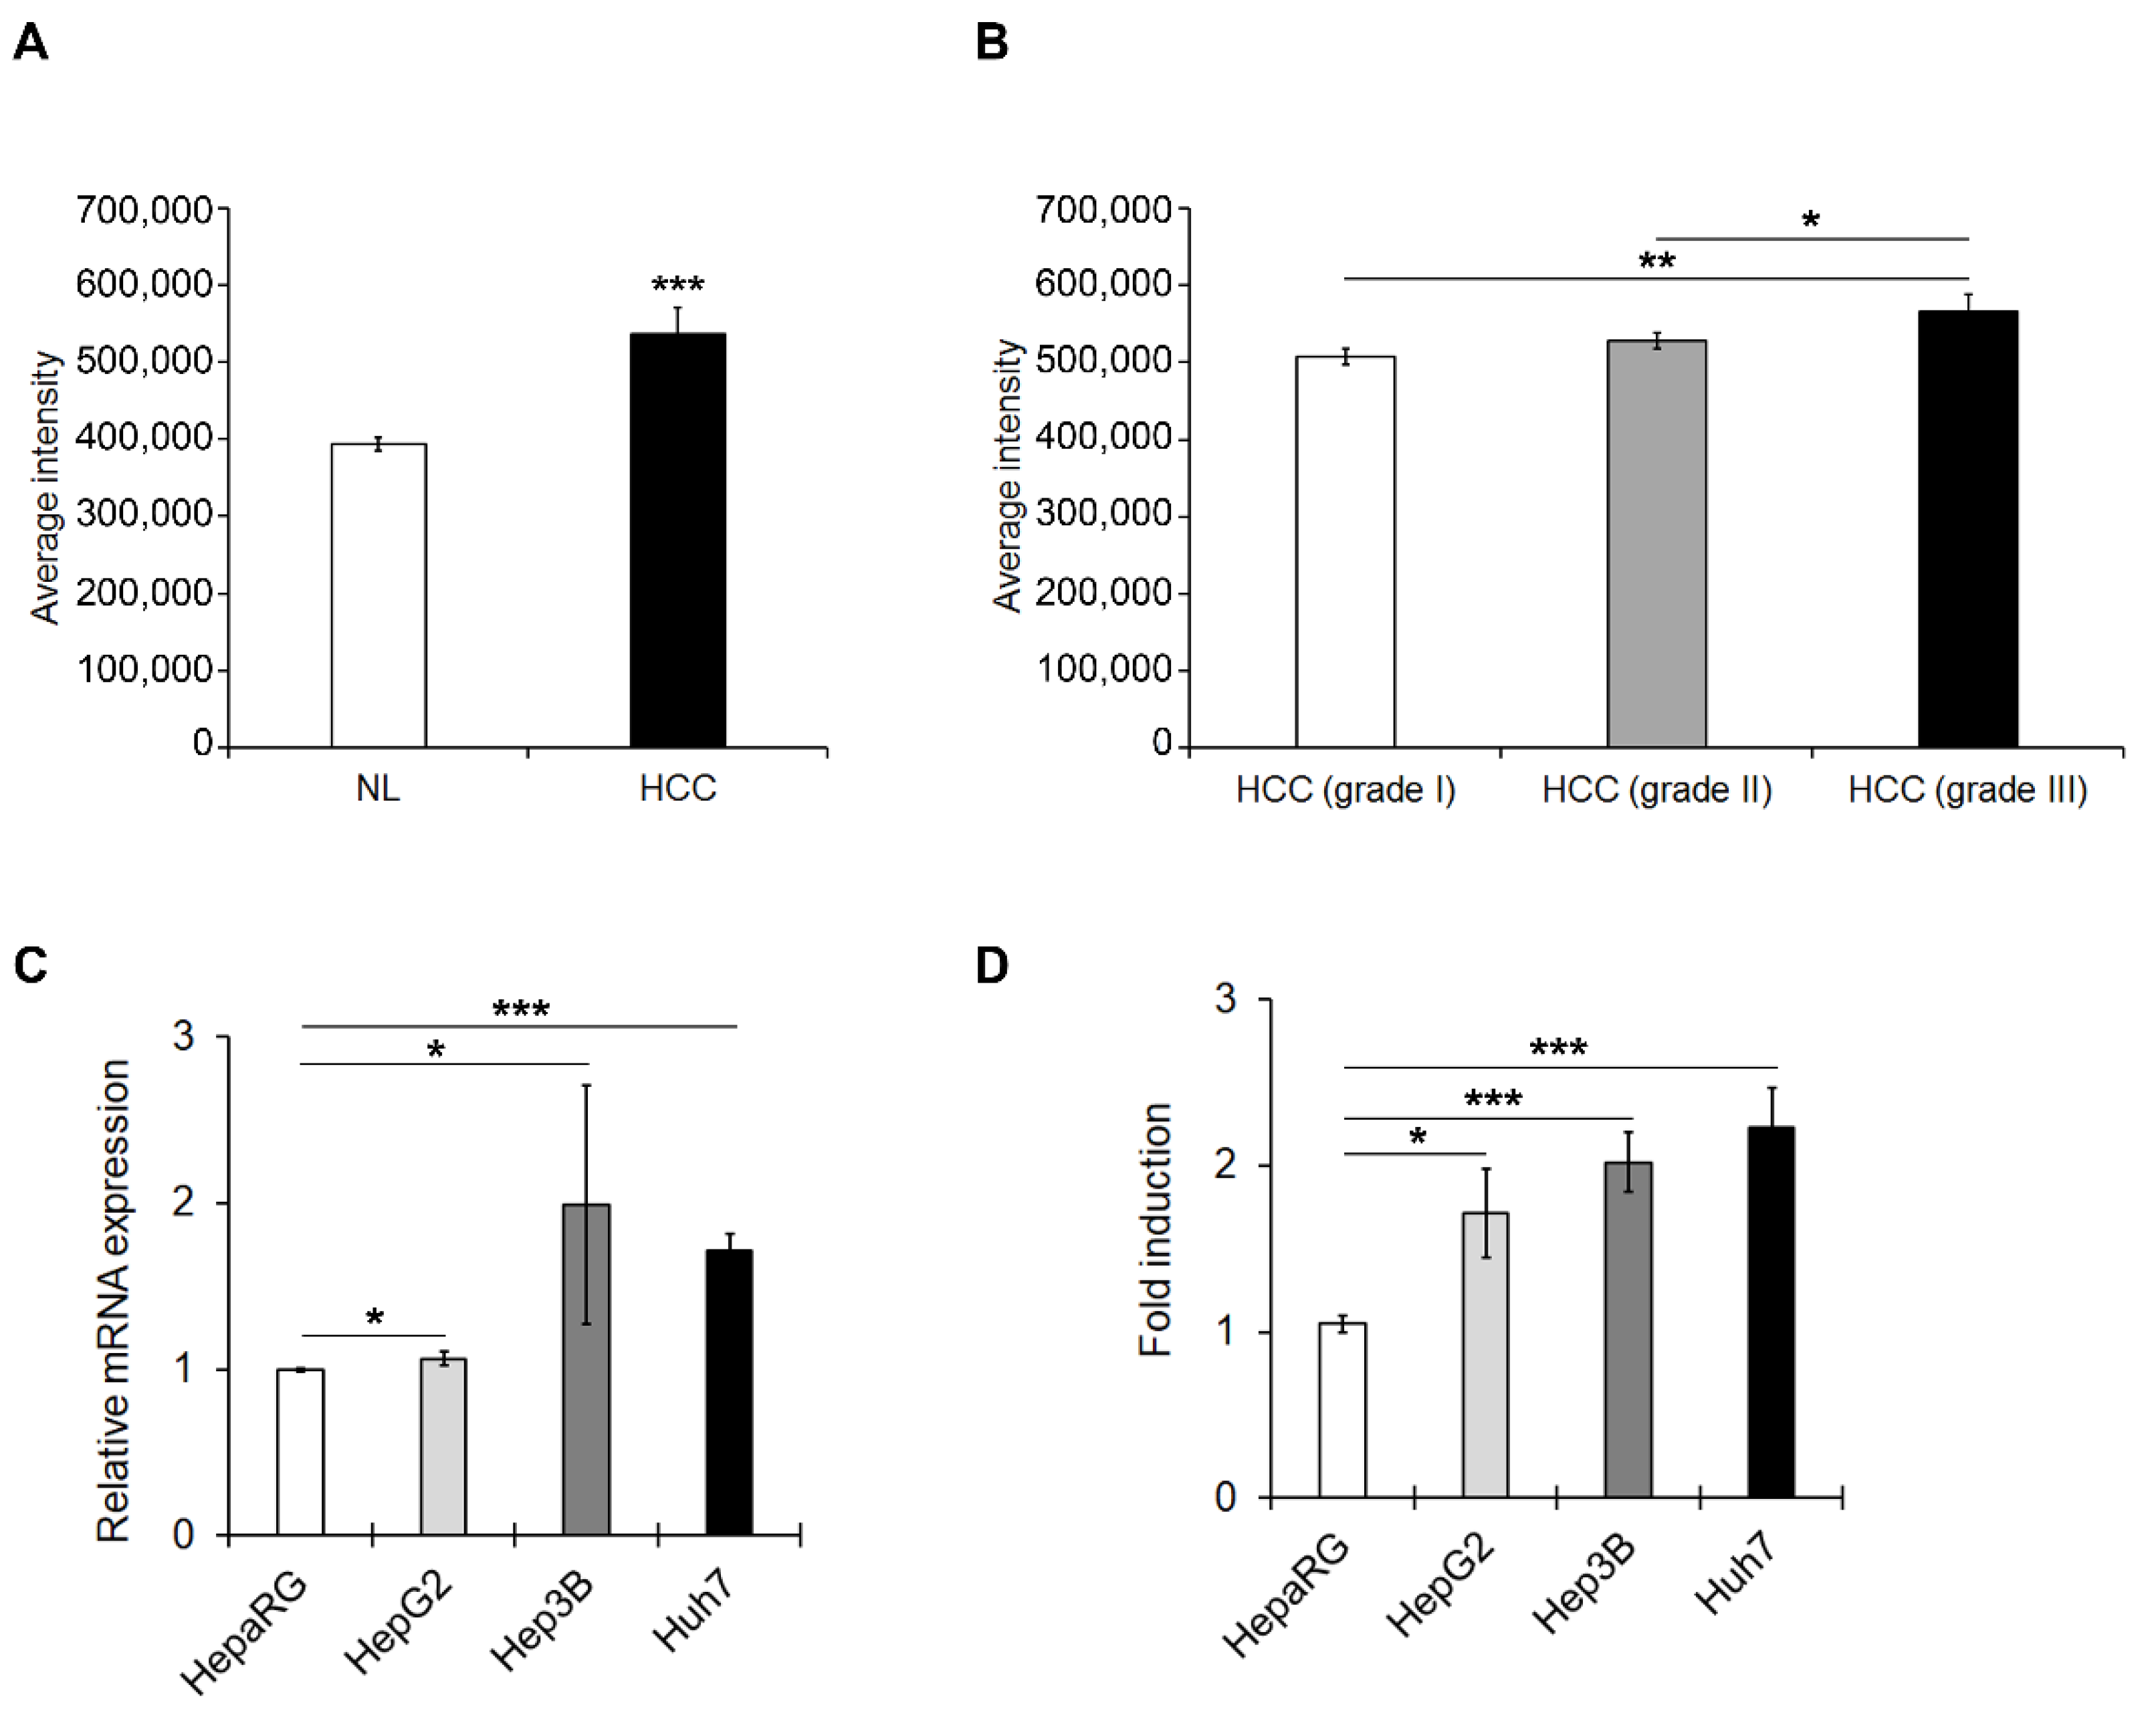
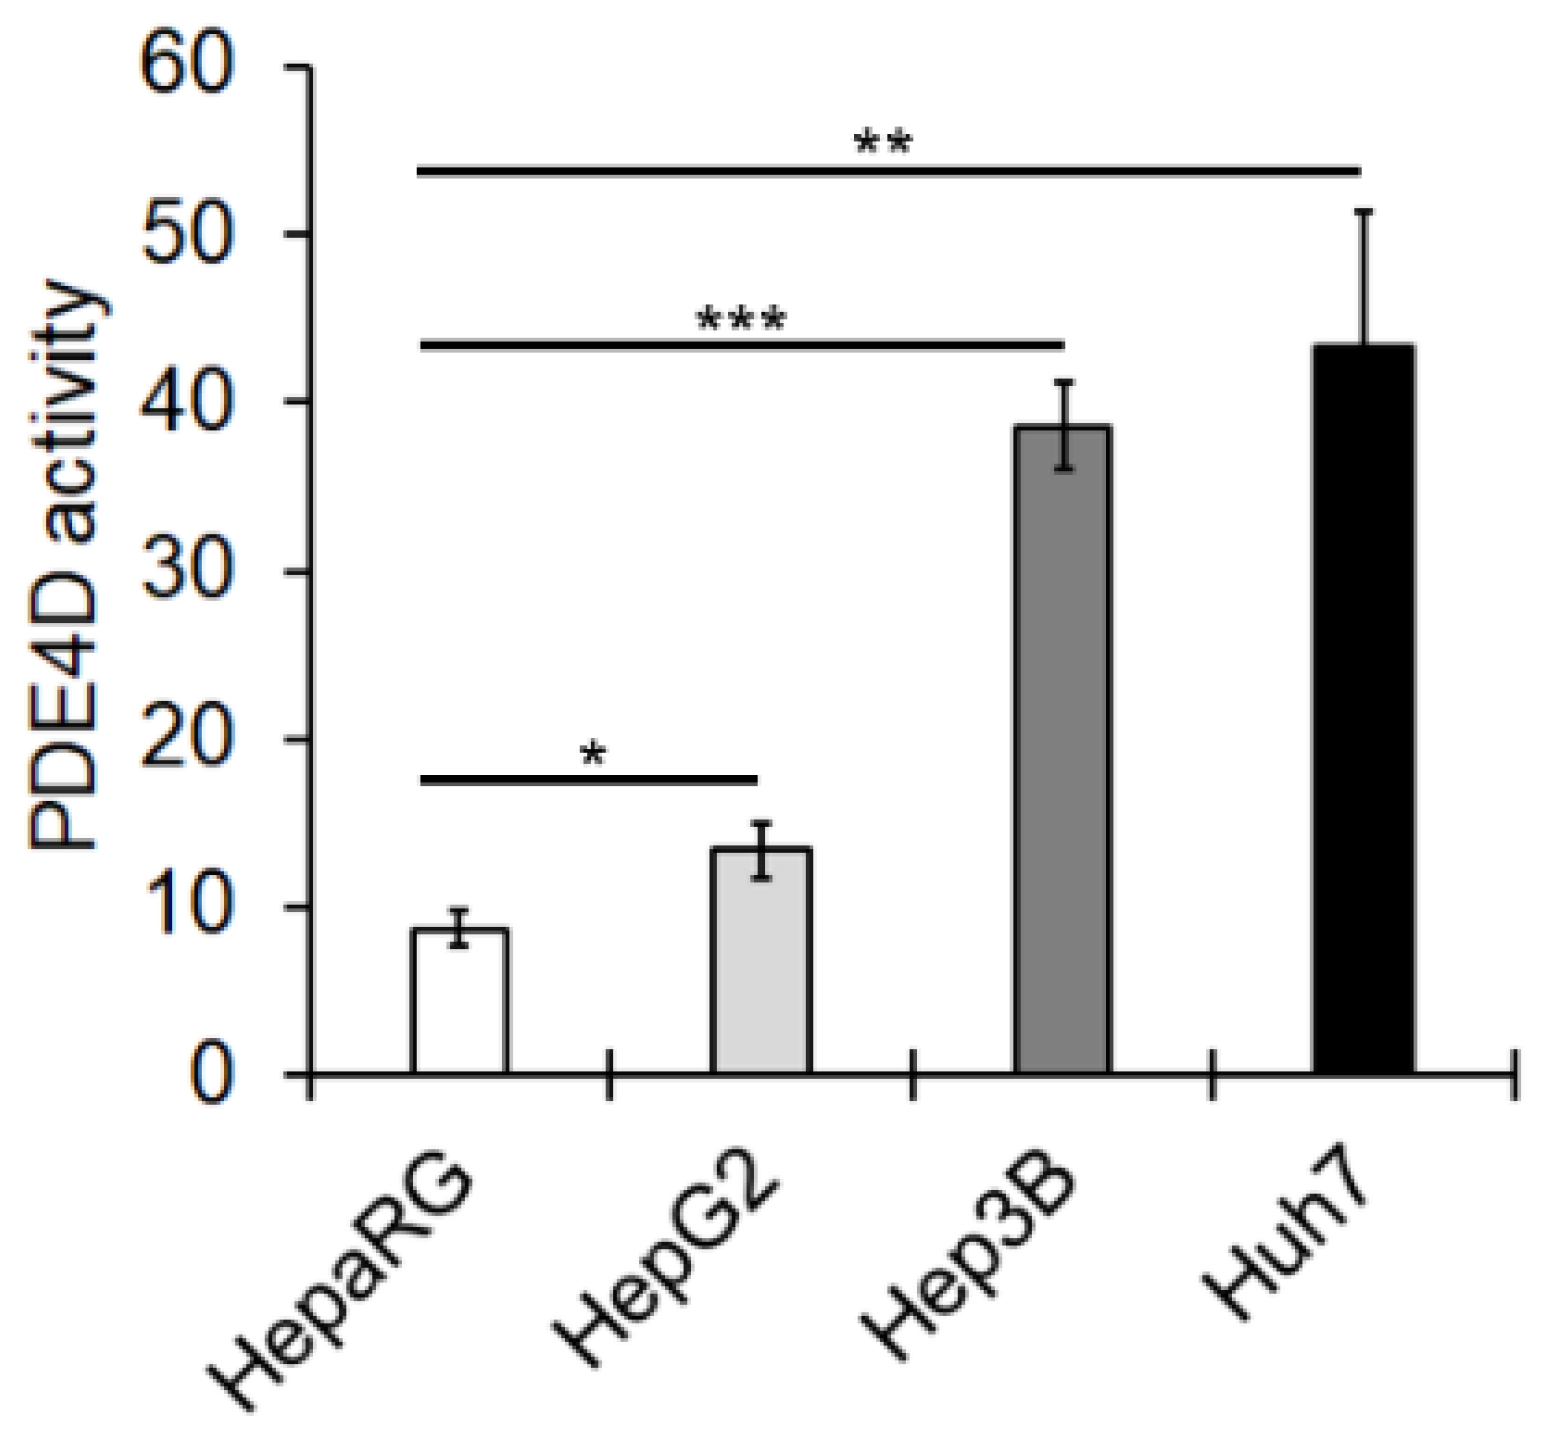
3.1. PED4D Protein/Gene Are Over-Expressed in HCC Tissues and Cell Lines
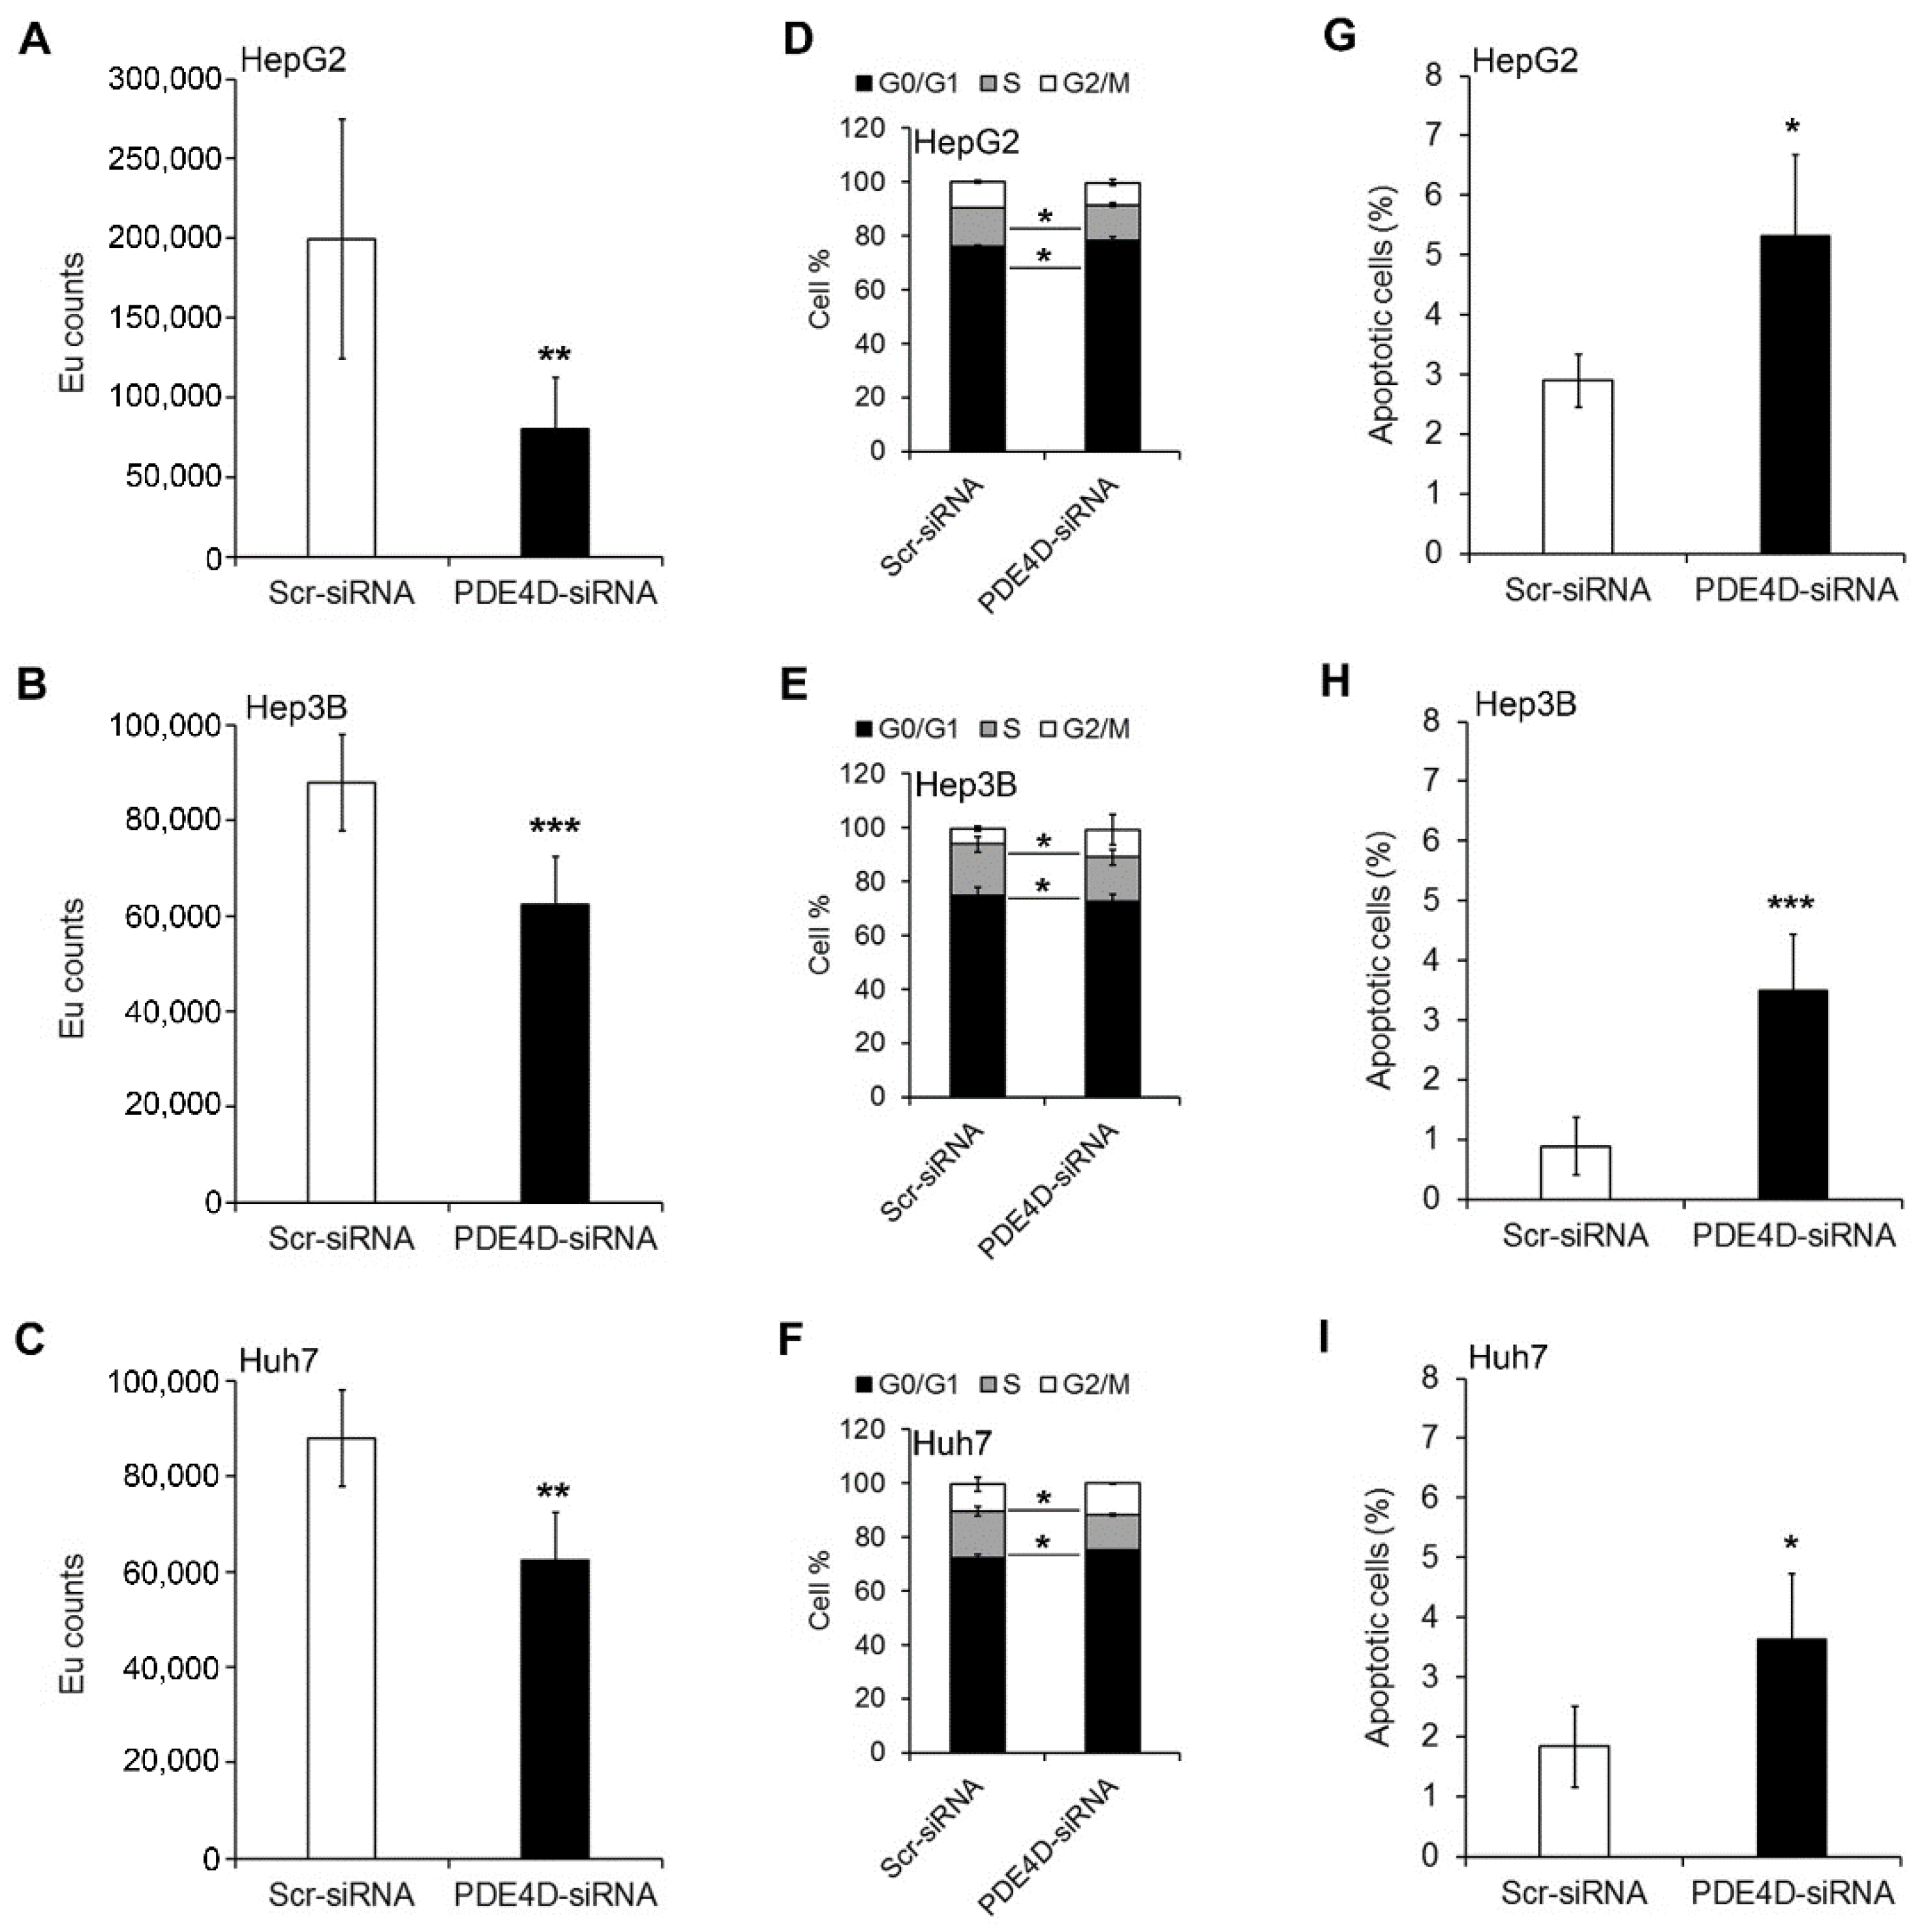
3.2. Silencing of PDE4D Affects cell Proliferation, Cell Cycle and Apoptosis of HCC Cells
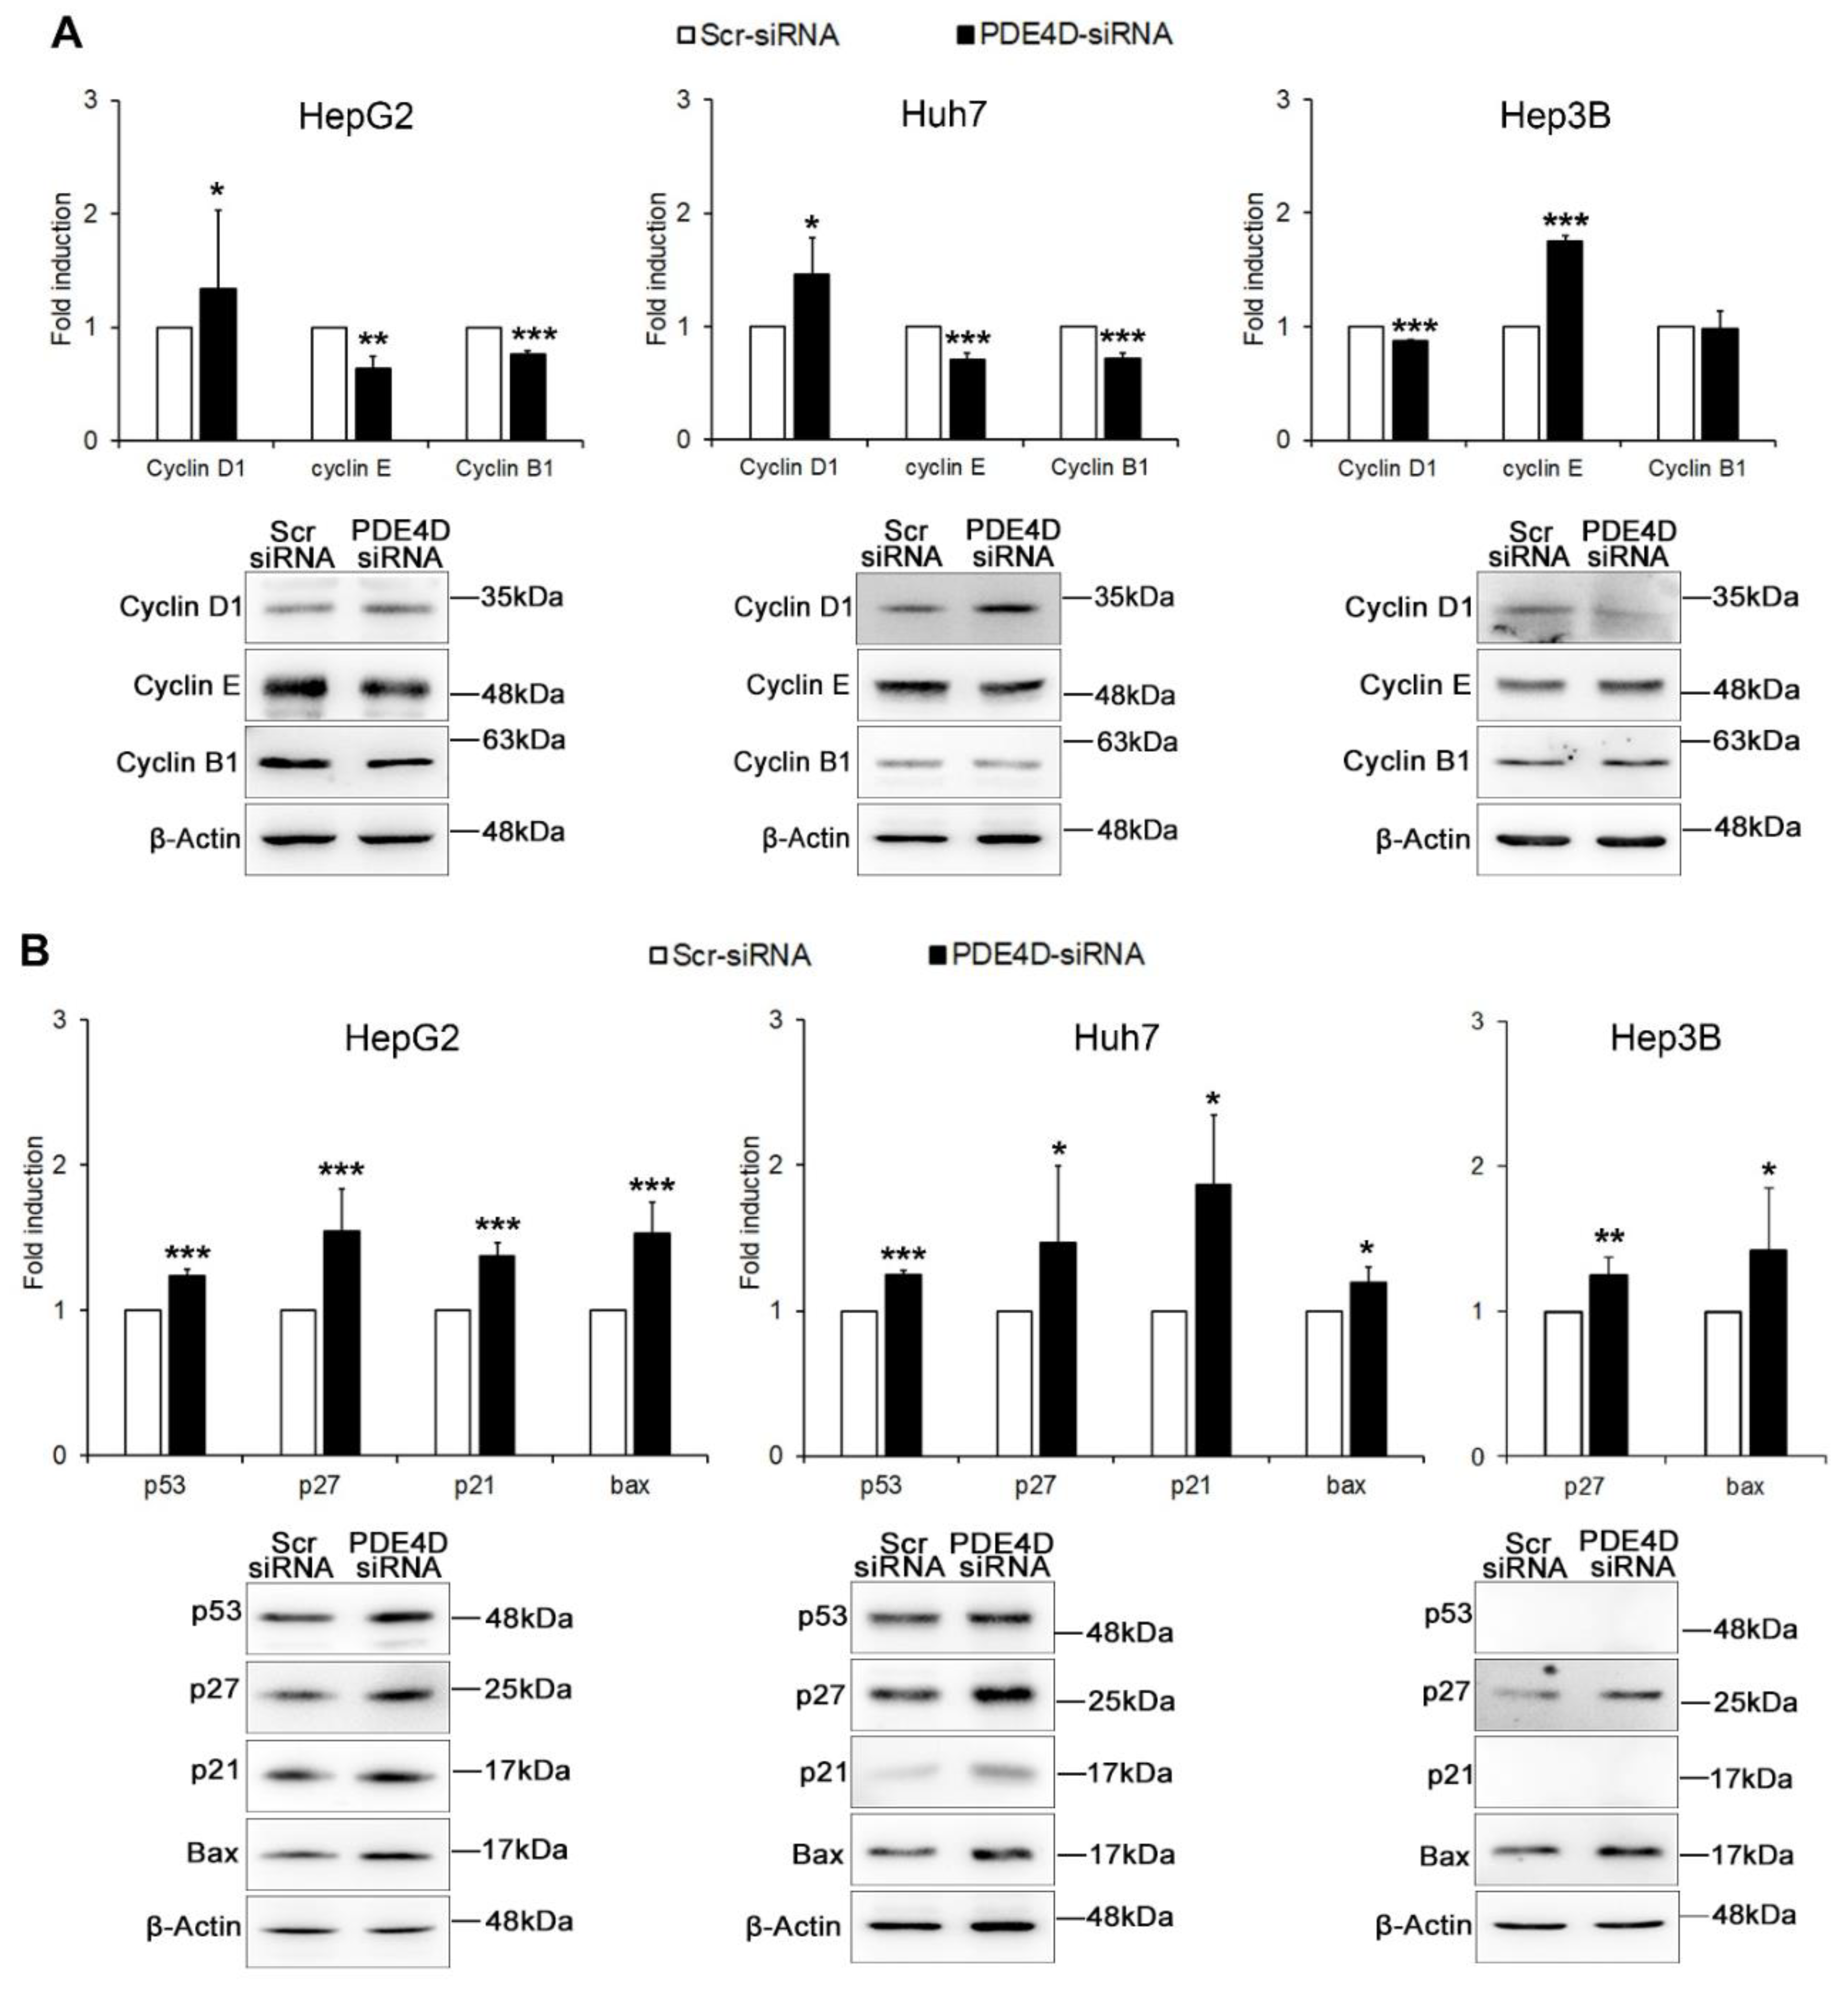
3.3. PDE4D Silencing Modulates Cancer Related Genes in HCC Cells
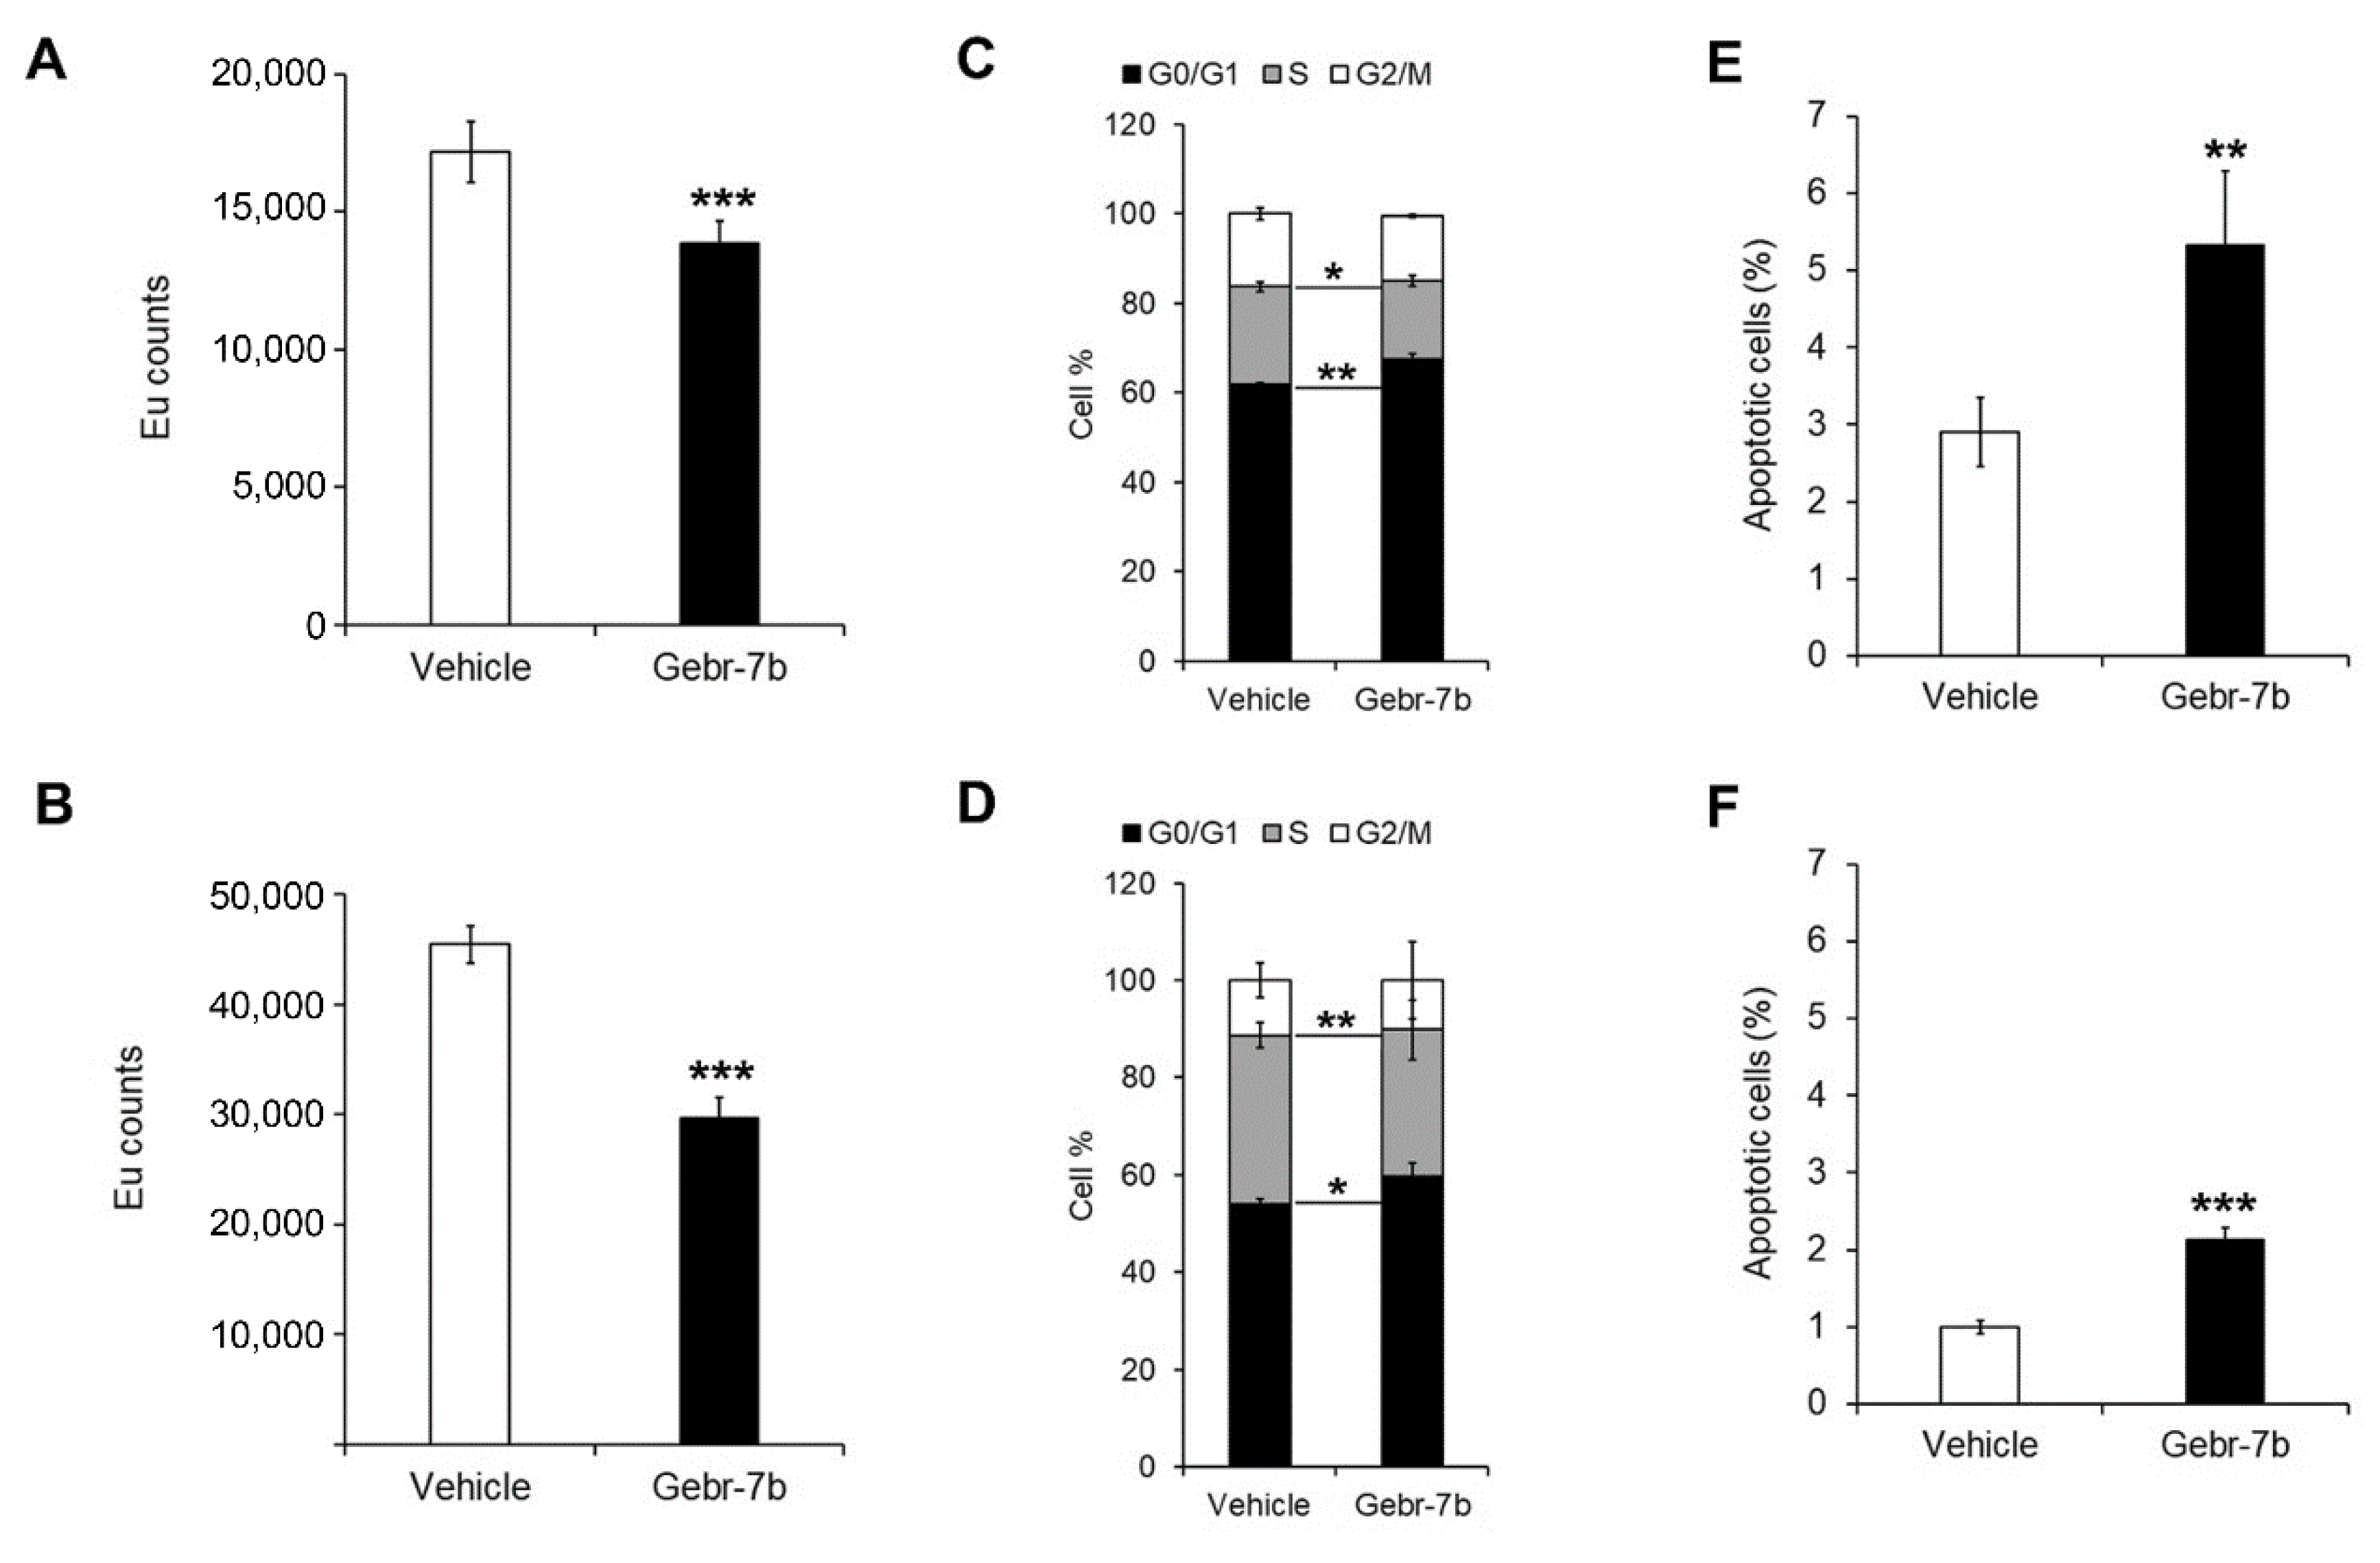
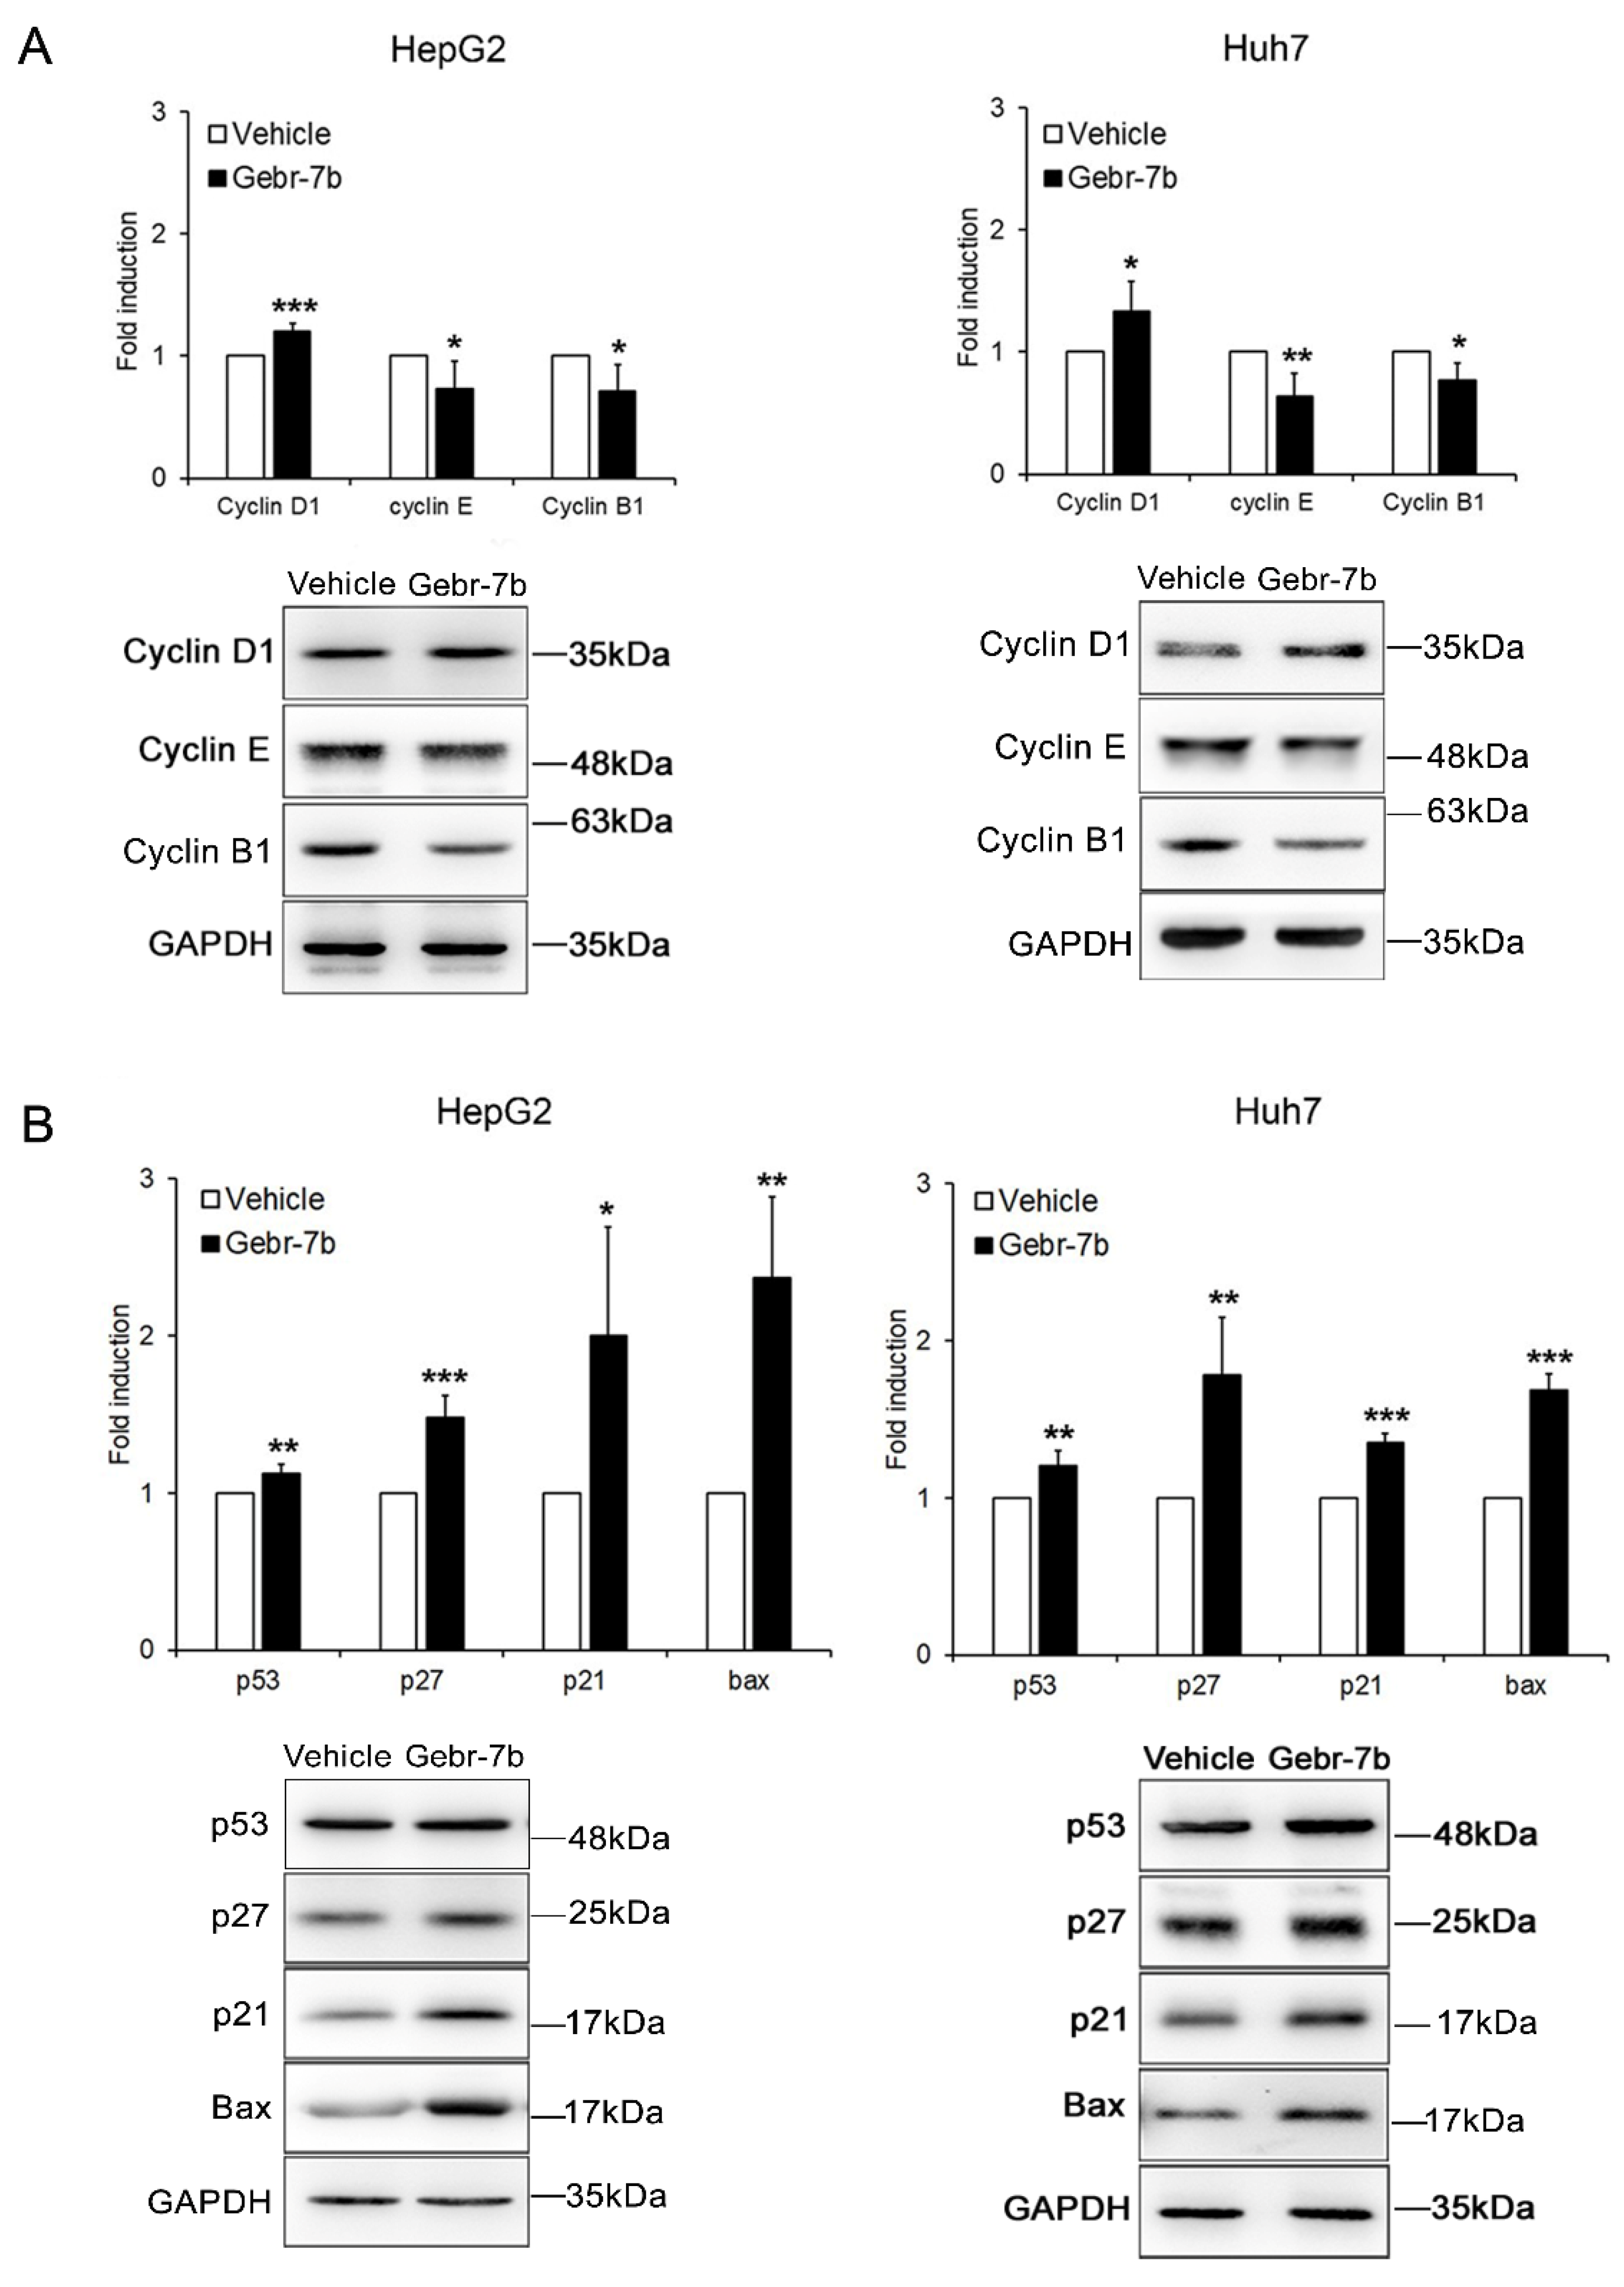
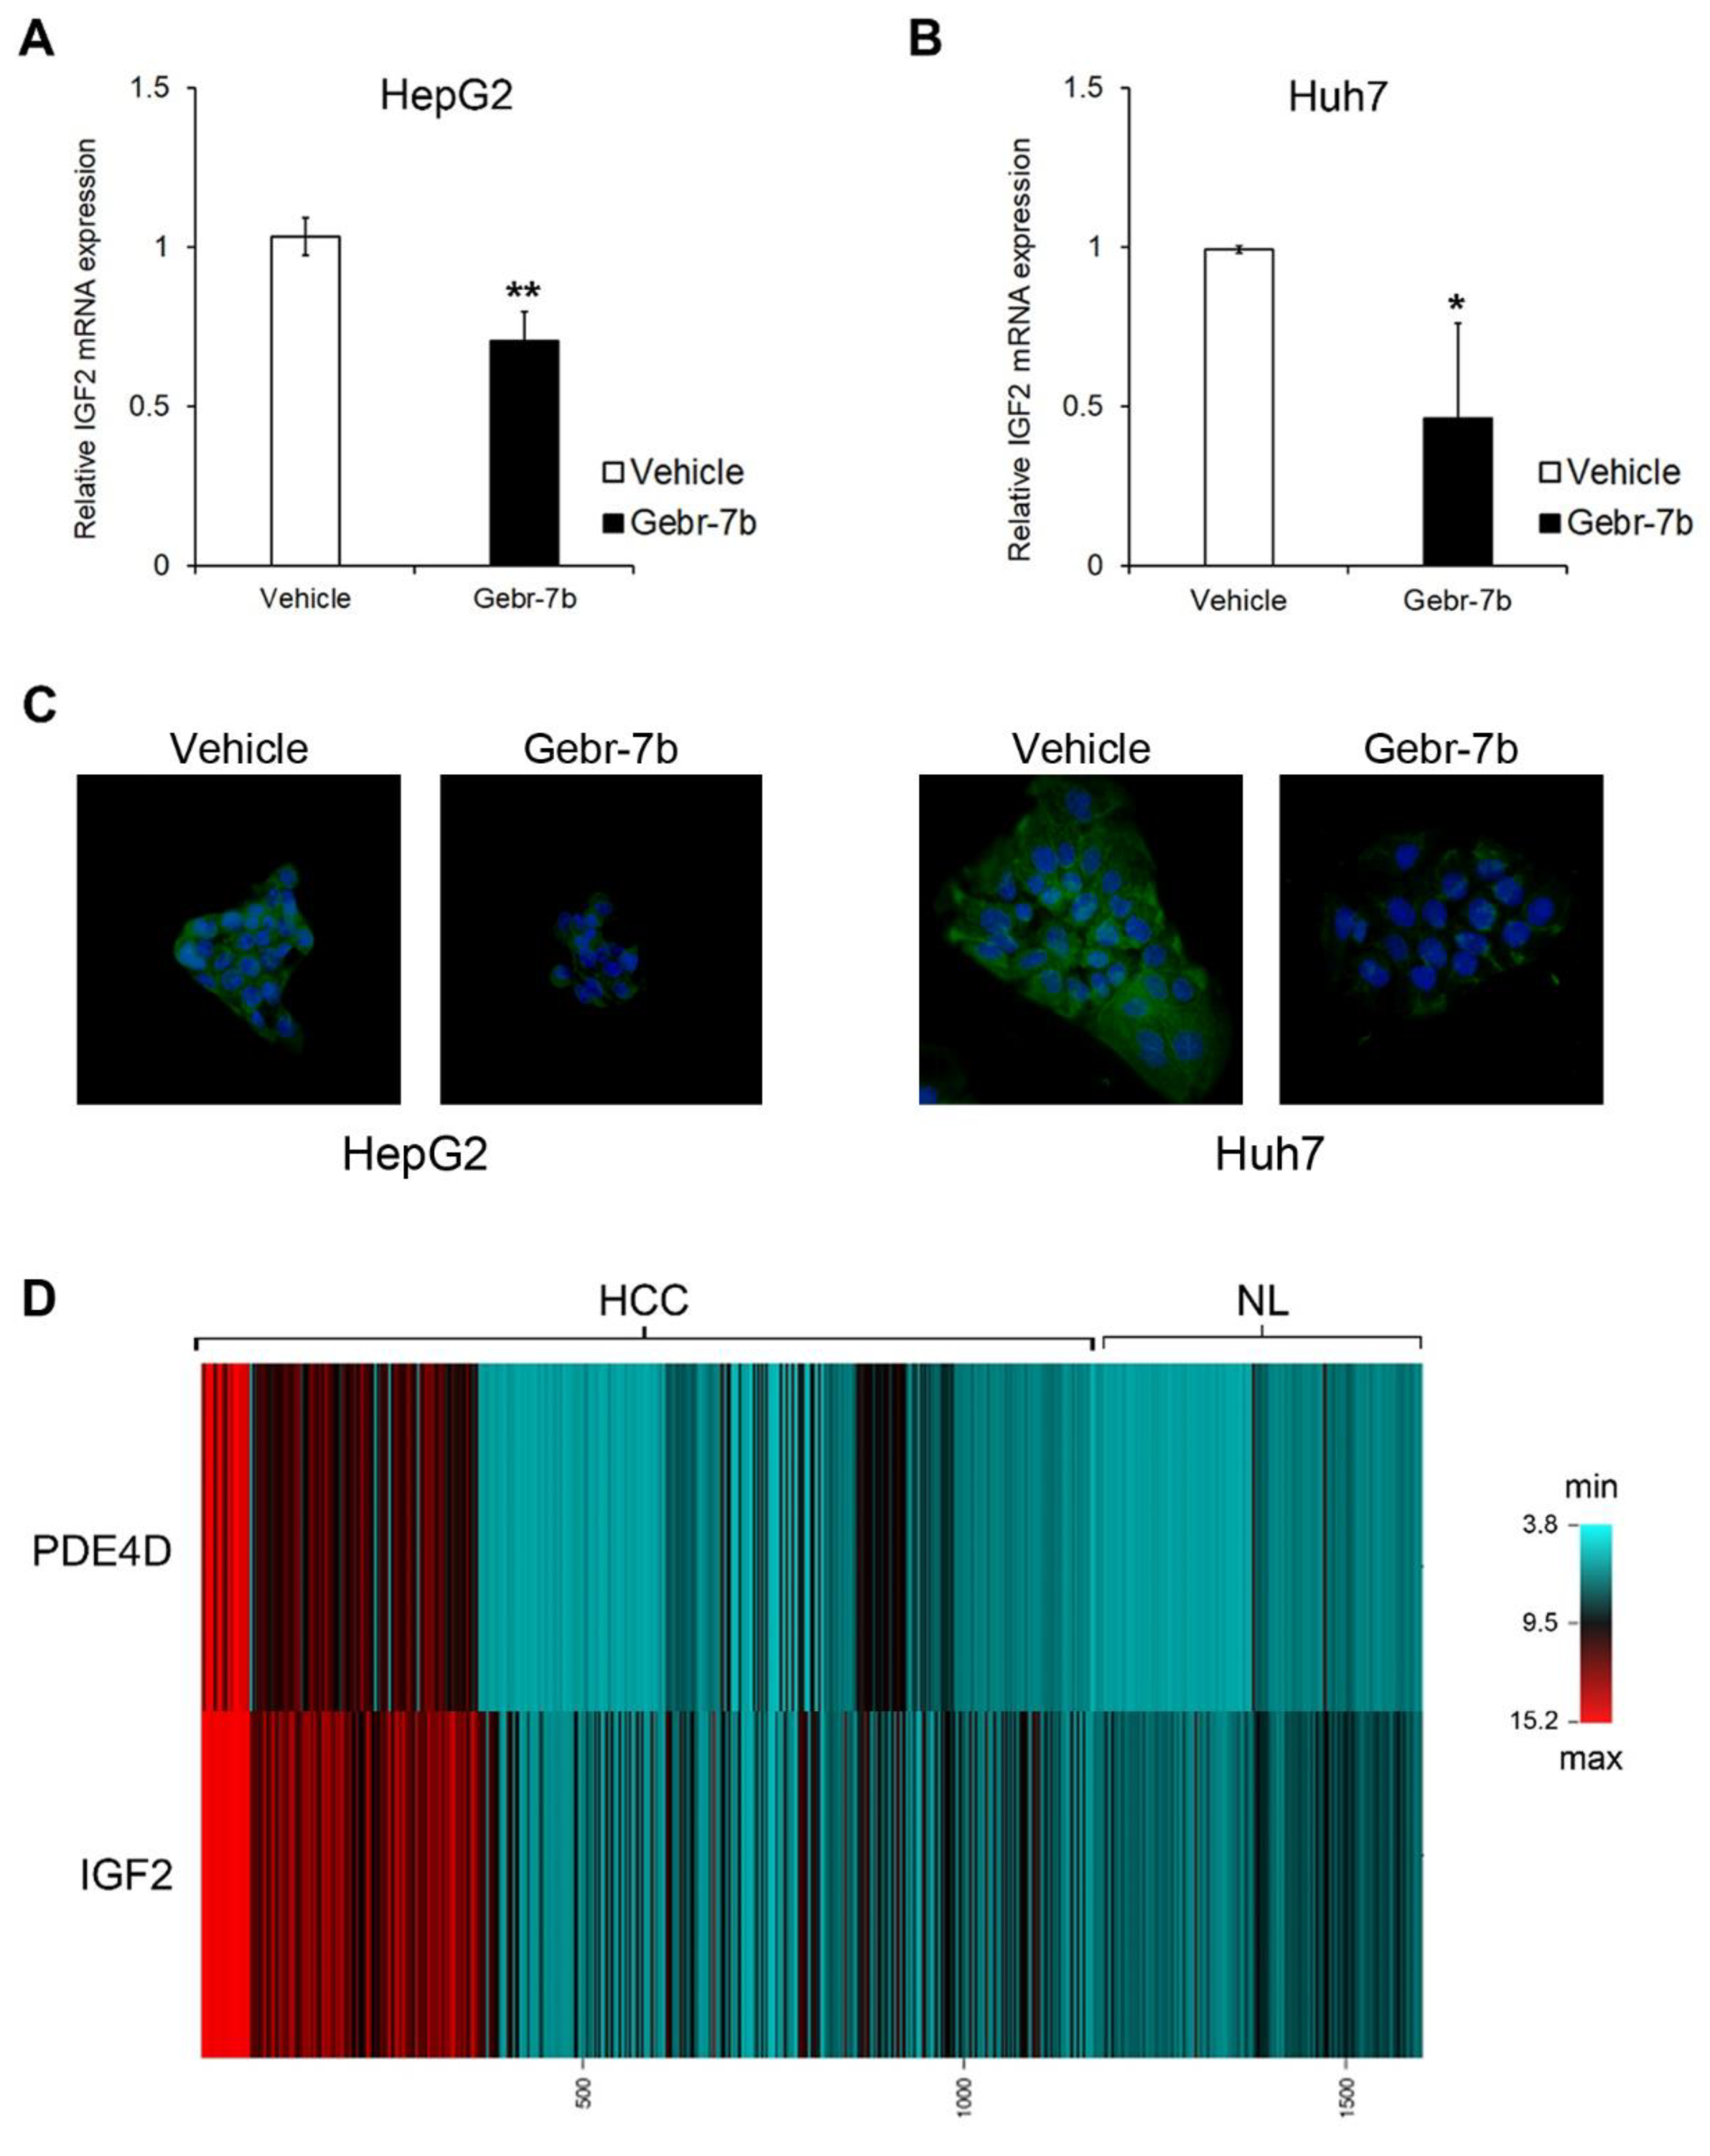
3.4. Pharmacological Inhibition of PDE4D Represses Cell Growth, Induces Apoptosis and Down-Regulates IGF2 Transcription in HCC Cells
4. Discussion
5. Conclusions
Supplementary Materials
Author Contributions
Funding
Institutional Review Board Statement
Informed Consent Statement
Data Availability Statement
Acknowledgments
Conflicts of Interest
References
- Singal, A.G.; Lampertico, P.; Nahon, P. Epidemiology and surveillance for hepatocellular carcinoma: New trends. J. Hepatol. 2020, 72, 250–261. [Google Scholar] [CrossRef] [PubMed]
- Khanna, R.; Verma, S.K. Pediatric hepatocellular carcinoma. World J. Gastroenterol. 2018, 24, 3980–3999. [Google Scholar] [CrossRef] [PubMed]
- Faivre, S.; Rimassa, L.; Finn, R.S. Molecular therapies for HCC: Looking outside the box. J. Hepatol. 2020, 72, 342–352. [Google Scholar] [CrossRef]
- Frenette, C.T. The Role of Regorafenib in Hepatocellular Carcinoma. Gastroenterol. Hepatol. 2017, 13, 122–124. [Google Scholar]
- Kudo, M.; Finn, R.S.; Qin, S.; Han, K.H.; Ikeda, K.; Piscaglia, F.; Baron, A.; Park, J.W.; Han, G.; Jassem, J.; et al. Lenvatinib versus sorafenib in first-line treatment of patients with unresectable hepatocellular carcinoma: A randomised phase 3 non-inferiority trial. Lancet 2018, 391, 1163–1173. [Google Scholar] [CrossRef]
- Llovet, J.M.; Montal, R.; Sia, D.; Finn, R.S. Molecular therapies and precision medicine for hepatocellular carcinoma. Nat. Rev. Clin. Oncol. 2018, 15, 599–616. [Google Scholar] [CrossRef] [PubMed]
- Fajardo, A.M.; Piazza, G.A.; Tinsley, H.N. The role of cyclic nucleotide signaling pathways in cancer: Targets for prevention and treatment. Cancers 2014, 6, 436–458. [Google Scholar] [CrossRef]
- Lugnier, C. Cyclic nucleotide phosphodiesterase (PDE) superfamily: A new target for the development of specific therapeutic agents. Pharmacol. Ther. 2006, 109, 366–398. [Google Scholar] [CrossRef]
- Maurice, D.H.; Ke, H.; Ahmad, F.; Wang, Y.; Chung, J.; Manganiello, V.C. Advances in targeting cyclic nucleotide phosphodiesterases. Nat. Rev. Drug Discov. 2014, 13, 290–314. [Google Scholar] [CrossRef]
- Massimi, M.; Ragusa, F.; Cardarelli, S.; Giorgi, M. Targeting cyclic AMP signalling in Hepatocellular Carcinoma. Cells 2019, 8, 1511. [Google Scholar] [CrossRef]
- Hsien Lai, S.; Zervoudakis, G.; Chou, J.; Gurney, M.E.; Quesnelle, K.M. PDE4 subtypes in cancer. Oncogene 2020, 39, 3791–3802. [Google Scholar] [CrossRef] [PubMed]
- Francis, S.H.; Blount, M.A.; Corbin, J.D. Mammalian cyclic nucleotide phosphodiesterases: Molecular mechanisms and physiological functions. Physiol. Rev. 2011, 91, 651–690. [Google Scholar] [CrossRef]
- Rodriguez, W.E.; Wahlang, B.; Wang, Y.; Zhang, J.; Vadhanam, M.V.; Joshi-Barve, S.; Bauer, P.; Cannon, R.; Ahmadi, A.R.; Sun, Z.; et al. Phosphodiesterase 4 inhibition as a therapeutic target for alcoholic Liver Disease: From bedside to bench. Hepatology 2019, 70, 1958–1971. [Google Scholar] [CrossRef] [PubMed]
- Gobejishvili, L.; Barve, S.; Breitkopf-Heinlein, K.; Li, Y.; Zhang, J.; Avila, D.V.; Dooley, S.; McClain, C.J. Rolipram attenuates bile duct ligation-induced liver injury in rats: A potential pathogenic role of PDE4. J. Pharmacol. Exp. Ther. 2013, 347, 80–90. [Google Scholar] [CrossRef] [PubMed]
- Massimi, M.; Cardarelli, S.; Galli, F.; Giardi, M.F.; Ragusa, F.; Panera, N.; Cinque, B.; Cifone, M.G.; Biagioni, S.; Giorgi, M. Increase of intracellular cyclic AMP by PDE4 inhibitors affects HepG2 cell cycle progression and survival. J. Cell. Biochem. 2017, 118, 1401–1411. [Google Scholar] [CrossRef] [PubMed]
- Peng, Y.; Li, Y.; Tian, Y.; Ao, G. PDE4a predicts poor prognosis and promotes metastasis by inducing epithelial-mesenchymal transition in hepatocellular carcinoma. J. Cancer 2018, 9, 2389–2396. [Google Scholar] [CrossRef] [PubMed]
- Tang, Z.; Li, C.; Kang, B.; Gao, G.; Li, C.; Zhang, Z. GEPIA: A web server for cancer and normal gene expression profiling and interactive analyses. Nucleic Acids Res. 2017, 45, W98–W102. [Google Scholar] [CrossRef]
- Thompson, W.J.; Appleman, M.M. Multiple cyclic nucleotide phosphodiesterase activities from rat brain. Biochemistry 1971, 10, 311–316. [Google Scholar]
- Gnani, D.; Romito, I.; Artuso, S.; Chierici, M.; De Stefanis, C.; Panera, N.; Crudele, A.; Ceccarelli, S.; Carcarino, E.; D’Oria, V.; et al. Focal adhesion kinase depletion reduces human hepatocellular carcinoma growth by repressing enhancer of zeste homolog 2. Cell Death Differ. 2017, 24, 889–902. [Google Scholar] [CrossRef]
- Thomas, H. Liver cancer: IGF2—An epigenetic oncodriver in HCC. Nat. Rev. Gastroenterol. Hepatol. 2016, 13, 625. [Google Scholar] [CrossRef]
- Kaur, H.; Bhalla, S.; Kaur, D.; Raghava, G.P. Cancer Liver: A database of liver cancer gene expression resources and biomarkers. Database 2020, 2020, baaa012. [Google Scholar] [CrossRef]
- Cao, B.; Wang, K.; Liao, J.M.; Zhou, X.; Liao, P.; Zeng, S.X.; He, M.; Chen, L.; He, Y.; Li, W.; et al. Inactivation of oncogenic cAMP-specific phosphodiesterase 4D by miR-139-5p in response to p53 activation. Elife 2016, 5, e15978. [Google Scholar] [CrossRef]
- Lin, D.C.; Xu, L.; Ding, L.W.; Sharma, A.; Liu, L.Z.; Yang, H.; Tan, P.; Vadgama, J.; Karlan, B.Y.; Lester, J.; et al. Genomic and functional characterizations of phosphodiesterase subtype 4D in human cancers. Proc. Natl. Acad. Sci. USA 2013, 110, 6109–6114. [Google Scholar] [CrossRef]
- Böttcher, R.; Dulla, K.; van Strijp, D.; Dits, N.; Verhoef, E.I.; Baillie, G.S.; van Leenders, G.J.; Houslay, M.D.; Jenster, G.; Hoffmann, R. Human PDE4D isoform composition is deregulated in primary prostate cancer and indicative for disease progression and development of distant metastases. Oncotarget 2016, 7, 70669–70684. [Google Scholar] [CrossRef]
- Liu, F.; Ma, J.; Wang, K.; Li, Z.; Jiang, Q.; Chen, H.; Li, W.; Xia, J. High expression of PDE4D correlates with poor prognosis and clinical progression in pancreaticductal adenocarcinoma. J. Cancer 2019, 10, 6252–6260. [Google Scholar] [CrossRef] [PubMed]
- Richter, W.; Jin, S.L.C.; Conti, M. Splice variants of the cyclic nucleotide phosphodiesterase PDE4D are differentially expressed and regulated in rat tissue. Biochem. J. 2005, 388, 803–811. [Google Scholar] [CrossRef] [PubMed]
- Houslay, M.D. Underpinning compartmentalised cAMP signalling through targeted cAMP breakdown. Trends Biochem. Sci. 2010, 35, 91–100. [Google Scholar] [CrossRef]
- Pullamsetti, S.S.; Banat, G.A.; Schmall, A.; Szibor, M.; Pomagruk, D.; Hänze, J.; Kolosionek, E.; Wilhelm, J.; Braun, T.; Grimminger, F.; et al. Phosphodiesterase-4 promotes proliferation and angiogenesis of lung cancer by crosstalk with HIF. Oncogene 2013, 32, 1121–1134. [Google Scholar] [CrossRef]
- Powers, G.L.; Hammer, K.D.; Domenech, M.; Frantskevich, K.; Malinowski, R.L.; Bushman, W.; Beebe, D.J.; Marker, P.C. Phosphodiesterase 4D inhibitors limit prostate cancer growth potential. Mol. Cancer Res. 2015, 13, 149–160. [Google Scholar] [CrossRef] [PubMed]
- Wittrup, A.; Lieberman, J. Knocking down disease: A progress report on siRNA therapeutics. Nat. Rev. Genet. 2015, 16, 543–552. [Google Scholar] [CrossRef] [PubMed]
- Rabe, K.F. Update on roflumilast, a phosphodiesterase 4 inhibitor for the treatment of chronic obstructive pulmonary disease. Br. J. Pharmacol. 2011, 163, 53–67. [Google Scholar] [CrossRef] [PubMed]
- Giorgi, M.; Cardarelli, S.; Ragusa, F.; Saliola, M.; Biagioni, S.; Poiana, G.; Naro, F.; Massimi, M. Phosphodiesterase inhibitors: Could they be beneficial for the treatment of COVID-19? Int. J. Mol. Sci. 2020, 21, 5338. [Google Scholar] [CrossRef]
- Giorgi, M.; Modica, A.; Pompili, A.; Pacitti, C.; Gasbarri, A. The induction of cyclic nucleotide phosphodiesterase 4 gene (PDE4D) impairs memory in a water maze task. Behav. Brain Res. 2004, 154, 99–106. [Google Scholar] [CrossRef] [PubMed]
- Bolger, G.B. The PDE4 cAMP-specific phosphodiesterases: Targets for drugs with antidepressant and memory-enhancing action. Adv. Neurobiol. 2017, 17, 63–102. [Google Scholar] [CrossRef] [PubMed]
- Ramezani, S.; Hadjighassem, M.; Vousooghi, N.; Parvaresh, M.; Arbabi, F.; Amini, N.; Joghataei, M.T. The role of Protein Kinase B signaling pathway in anti-cancer effect of rolipram on glioblastoma multiforme: An in vitro study. Basic Clin. Neurosci. 2017, 8, 325–336. [Google Scholar] [CrossRef] [PubMed]
- Bolger, G.B.; Bizzi, M.F.; Pinheiro, S.V.; Trivellin, G.; Smoot, L.; Accavitti, M.A.; Korbonits, M.; Ribeiro-Oliveira, A., Jr. cAMP-specific PDE4 phosphodiesterases and AIP in the pathogenesis of pituitary tumors. Endocr. Relat. Cancer 2016, 23, 419–431. [Google Scholar] [CrossRef]
- Delyon, J.; Servy, A.; Laugier, F.; André, J.; Ortonne, N.; Battistella, M.; Mourah, S.; Bensussan, A.; Lebbé, C.; Dumaz, N. PDE4D promotes FAK-mediated cell invasion in BRAF-mutated melanoma. Oncogene 2017, 36, 3252–3262. [Google Scholar] [CrossRef]
- Bruno, O.; Romussi, A.; Spallarossa, A.; Brullo, C.; Schenone, S.; Bondavalli, F.; Vanthuyne, N.; Roussel, C. New selective phosphodiesterase 4D inhibitors differently acting on long, short, and supershort isoforms. J. Med. Chem. 2009, 52, 6546–6557. [Google Scholar] [CrossRef]
- Mishra, R.R.; Belder, N.; Ansari, S.A.; Kayhan, M.; Bal, H.; Raza, U.; Ersan, P.G.; Tokat, U.M.; Eyüpoğlu, E.; Saatci, Ö.; et al. Reactivation of cAMP pathway by PDE4D inhibition represents a novel druggable axis for overcoming tamoxifen resistance in ER-positive breast cancer. Clin. Cancer Res. 2018, 24, 1987–2001. [Google Scholar] [CrossRef]
- Ogawa, R.; Streiff, M.B.; Bugayenko, A.; Kato, G.J. Inhibition of PDE4 phosphodiesterase activity induces growth suppression, apoptosis, glucocorticoid sensitivity, p53, and p21(WAF1/CIP1) proteins in human acute lymphoblastic leukemia cells. Blood 2002, 99, 3390–3397. [Google Scholar] [CrossRef]
- Adamek, A.; Kasprzak, A. Insulin-Like Growth Factor (IGF) system in Liver Diseases. Int. J. Mol. Sci. 2018, 19, 1308. [Google Scholar] [CrossRef] [PubMed]
- Uchida, K.; Kondo, M.; Takeda, S.; Osada, H.; Takahashi, T.; Nakao, A.; Takahashi, T. Altered transcriptional regulation of the insulin-like growth factor 2 gene in human hepatocellular carcinoma. Mol. Carcinog. 1997, 18, 193–198. [Google Scholar] [CrossRef]
- Cariani, E.; Lasserre, C.; Seurin, D.; Hamelin, B.; Kemeny, F.; Franco, D.; Czech, M.P.; Ullrich, A.; Brechot, C. Differential expression of insulin-like growth factor II mRNA in human primary liver cancers, benign liver tumors, and liver cirrhosis. Cancer Res. 1988, 48, 6844–6849. [Google Scholar]
- Martinez-Quetglas, I.; Pinyol, R.; Dauch, D.; Torrecilla, S.; Tovar, V.; Moeini, A.; Alsinet, C.; Portela, A.; Rodriguez-Carunchio, L.; Solé, M.; et al. IGF2 Is Up-regulated by Epigenetic Mechanisms in Hepatocellular Carcinomas and Is an Actionable Oncogene Product in Experimental Models. Gastroenterology 2016, 151, 1192–1205. [Google Scholar] [CrossRef] [PubMed]
- Marášek, P.; Dzijak, R.; Studenyak, I.; Fišerová, J.; Uličná, L.; Novák, P.; Hozák, P. Paxillin-dependent regulation of IGF2 and H19 gene cluster expression. J. Cell Sci. 2015, 128, 3106–3116. [Google Scholar] [CrossRef] [PubMed]
- Zhang, N.; Geng, T.; Wang, Z.; Zhang, R.; Cao, T.; Camporez, J.P.; Cai, S.Y.; Liu, Y.; Dandolo, L.; Shulman, G.I.; et al. Elevated hepatic expression of H19 long noncoding RNA contributes to diabetic hyperglycemia. JCI Insight. 2018, 3, e120304. [Google Scholar] [CrossRef]


Publisher’s Note: MDPI stays neutral with regard to jurisdictional claims in published maps and institutional affiliations. |
© 2021 by the authors. Licensee MDPI, Basel, Switzerland. This article is an open access article distributed under the terms and conditions of the Creative Commons Attribution (CC BY) license (https://creativecommons.org/licenses/by/4.0/).
Share and Cite
Ragusa, F.; Panera, N.; Cardarelli, S.; Scarsella, M.; Bianchi, M.; Biagioni, S.; Giorgi, M.; Alisi, A.; Massimi, M. Phosphodiesterase 4D Depletion/Inhibition Exerts Anti-Oncogenic Properties in Hepatocellular Carcinoma. Cancers 2021, 13, 2182. https://doi.org/10.3390/cancers13092182
Ragusa F, Panera N, Cardarelli S, Scarsella M, Bianchi M, Biagioni S, Giorgi M, Alisi A, Massimi M. Phosphodiesterase 4D Depletion/Inhibition Exerts Anti-Oncogenic Properties in Hepatocellular Carcinoma. Cancers. 2021; 13(9):2182. https://doi.org/10.3390/cancers13092182
Chicago/Turabian StyleRagusa, Federica, Nadia Panera, Silvia Cardarelli, Marco Scarsella, Marzia Bianchi, Stefano Biagioni, Mauro Giorgi, Anna Alisi, and Mara Massimi. 2021. "Phosphodiesterase 4D Depletion/Inhibition Exerts Anti-Oncogenic Properties in Hepatocellular Carcinoma" Cancers 13, no. 9: 2182. https://doi.org/10.3390/cancers13092182
APA StyleRagusa, F., Panera, N., Cardarelli, S., Scarsella, M., Bianchi, M., Biagioni, S., Giorgi, M., Alisi, A., & Massimi, M. (2021). Phosphodiesterase 4D Depletion/Inhibition Exerts Anti-Oncogenic Properties in Hepatocellular Carcinoma. Cancers, 13(9), 2182. https://doi.org/10.3390/cancers13092182