
Specific Compositions of Cannabis sativa Compounds Have Cytotoxic Activity and Inhibit Motility and Colony Formation of Human Glioblastoma Cells In Vitro


Simple Summary
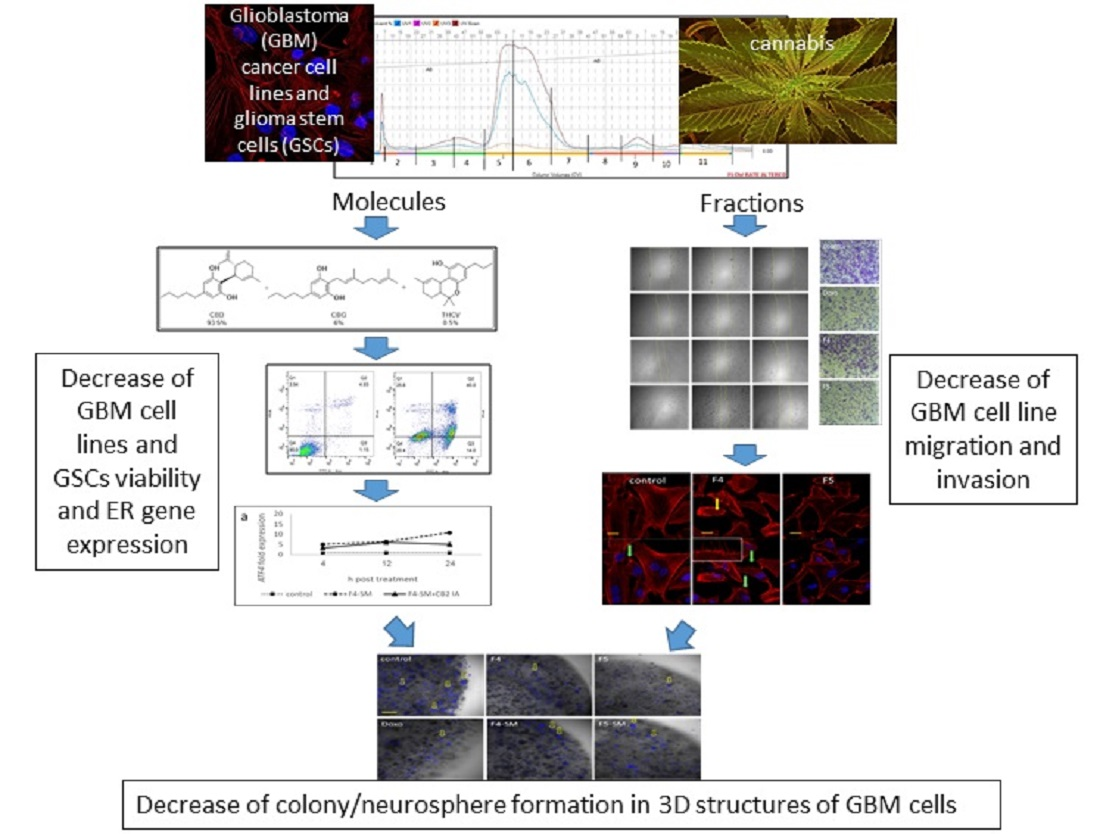
Abstract

1. Introduction
2. Materials and Methods
2.1. Plant Extraction
2.2. Extract Fractionation
2.3. Chemical Analysis
2.4. Standard/Material Preparation and Use
2.5. Cell Cultures
2.6. Cell Viability Assays
2.7. Colony Forming Assay
2.8. Scratch-Wound Assay
2.9. Transwell Assay
2.10. Cell Staining
2.11. Apoptosis Assay
2.12. Cell Cycle Analysis
2.13. Quantitative Real-Time PCR
2.14. 3D Models
2.15. Statistical Analysis
3. Results
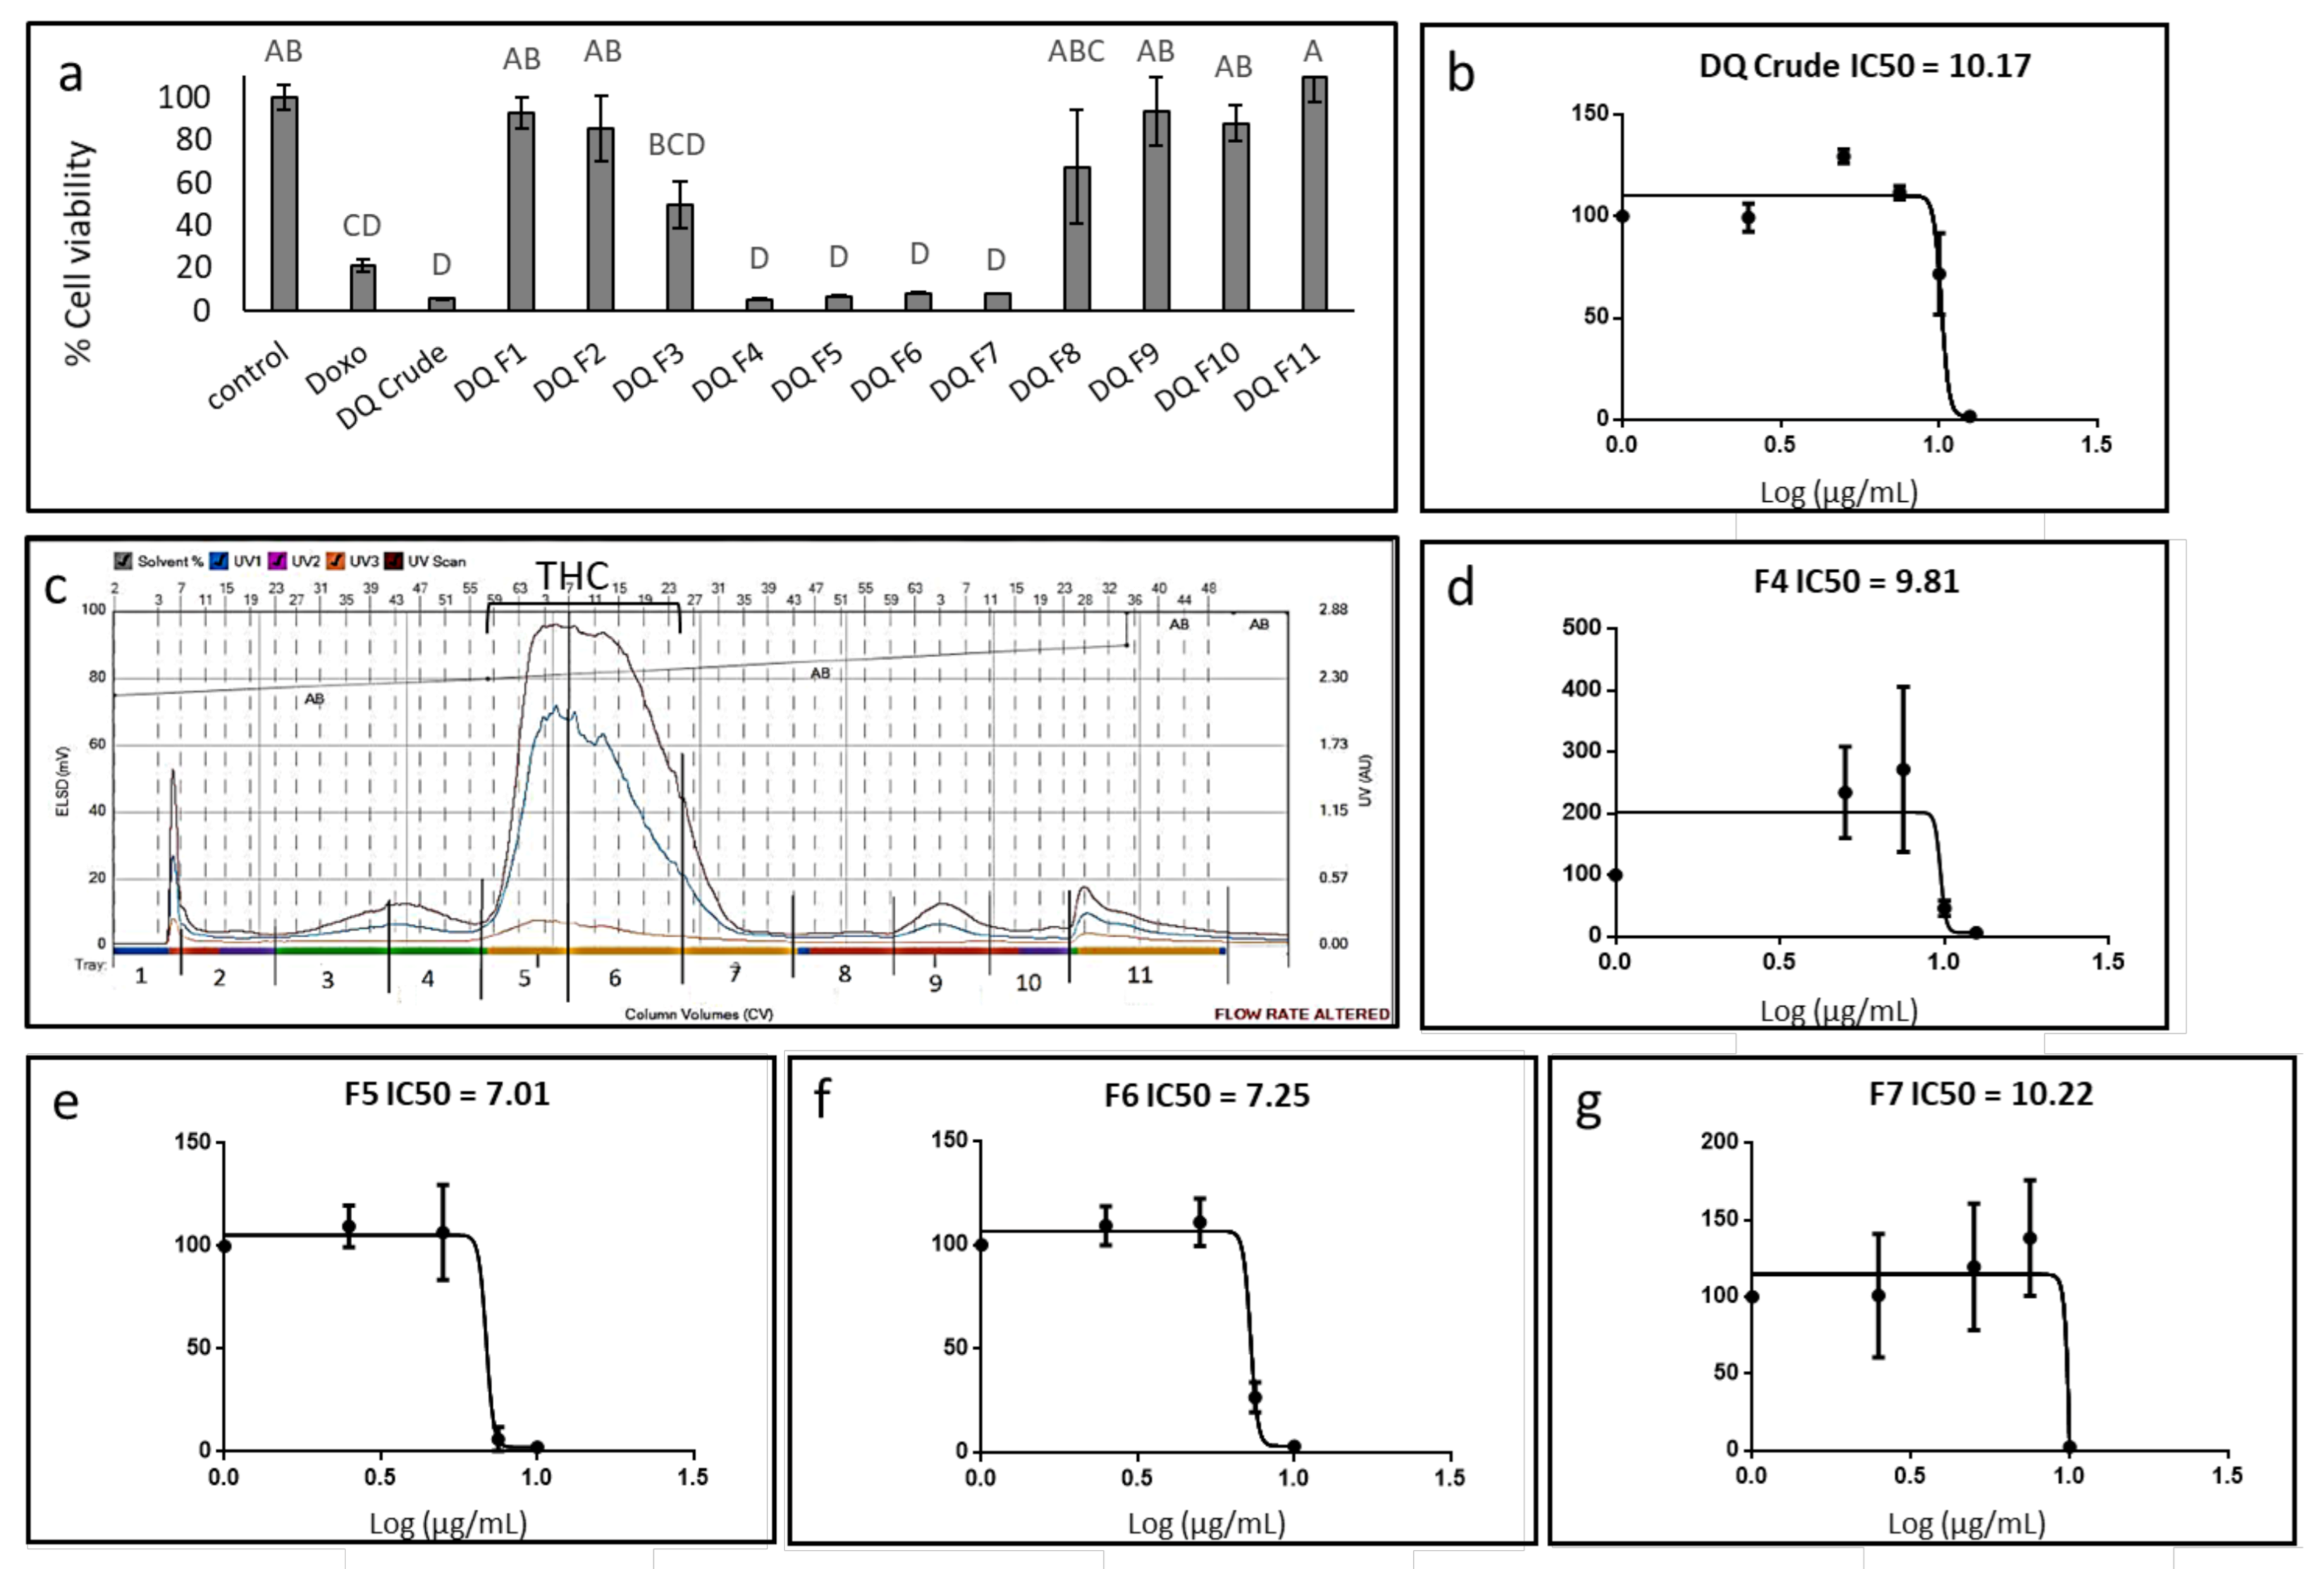
3.1. Determination of the Effect of C. sativa Extract and Fractions on A172 Cell Viability
3.2. Determination of the Chemical Composition of the Active Fractions
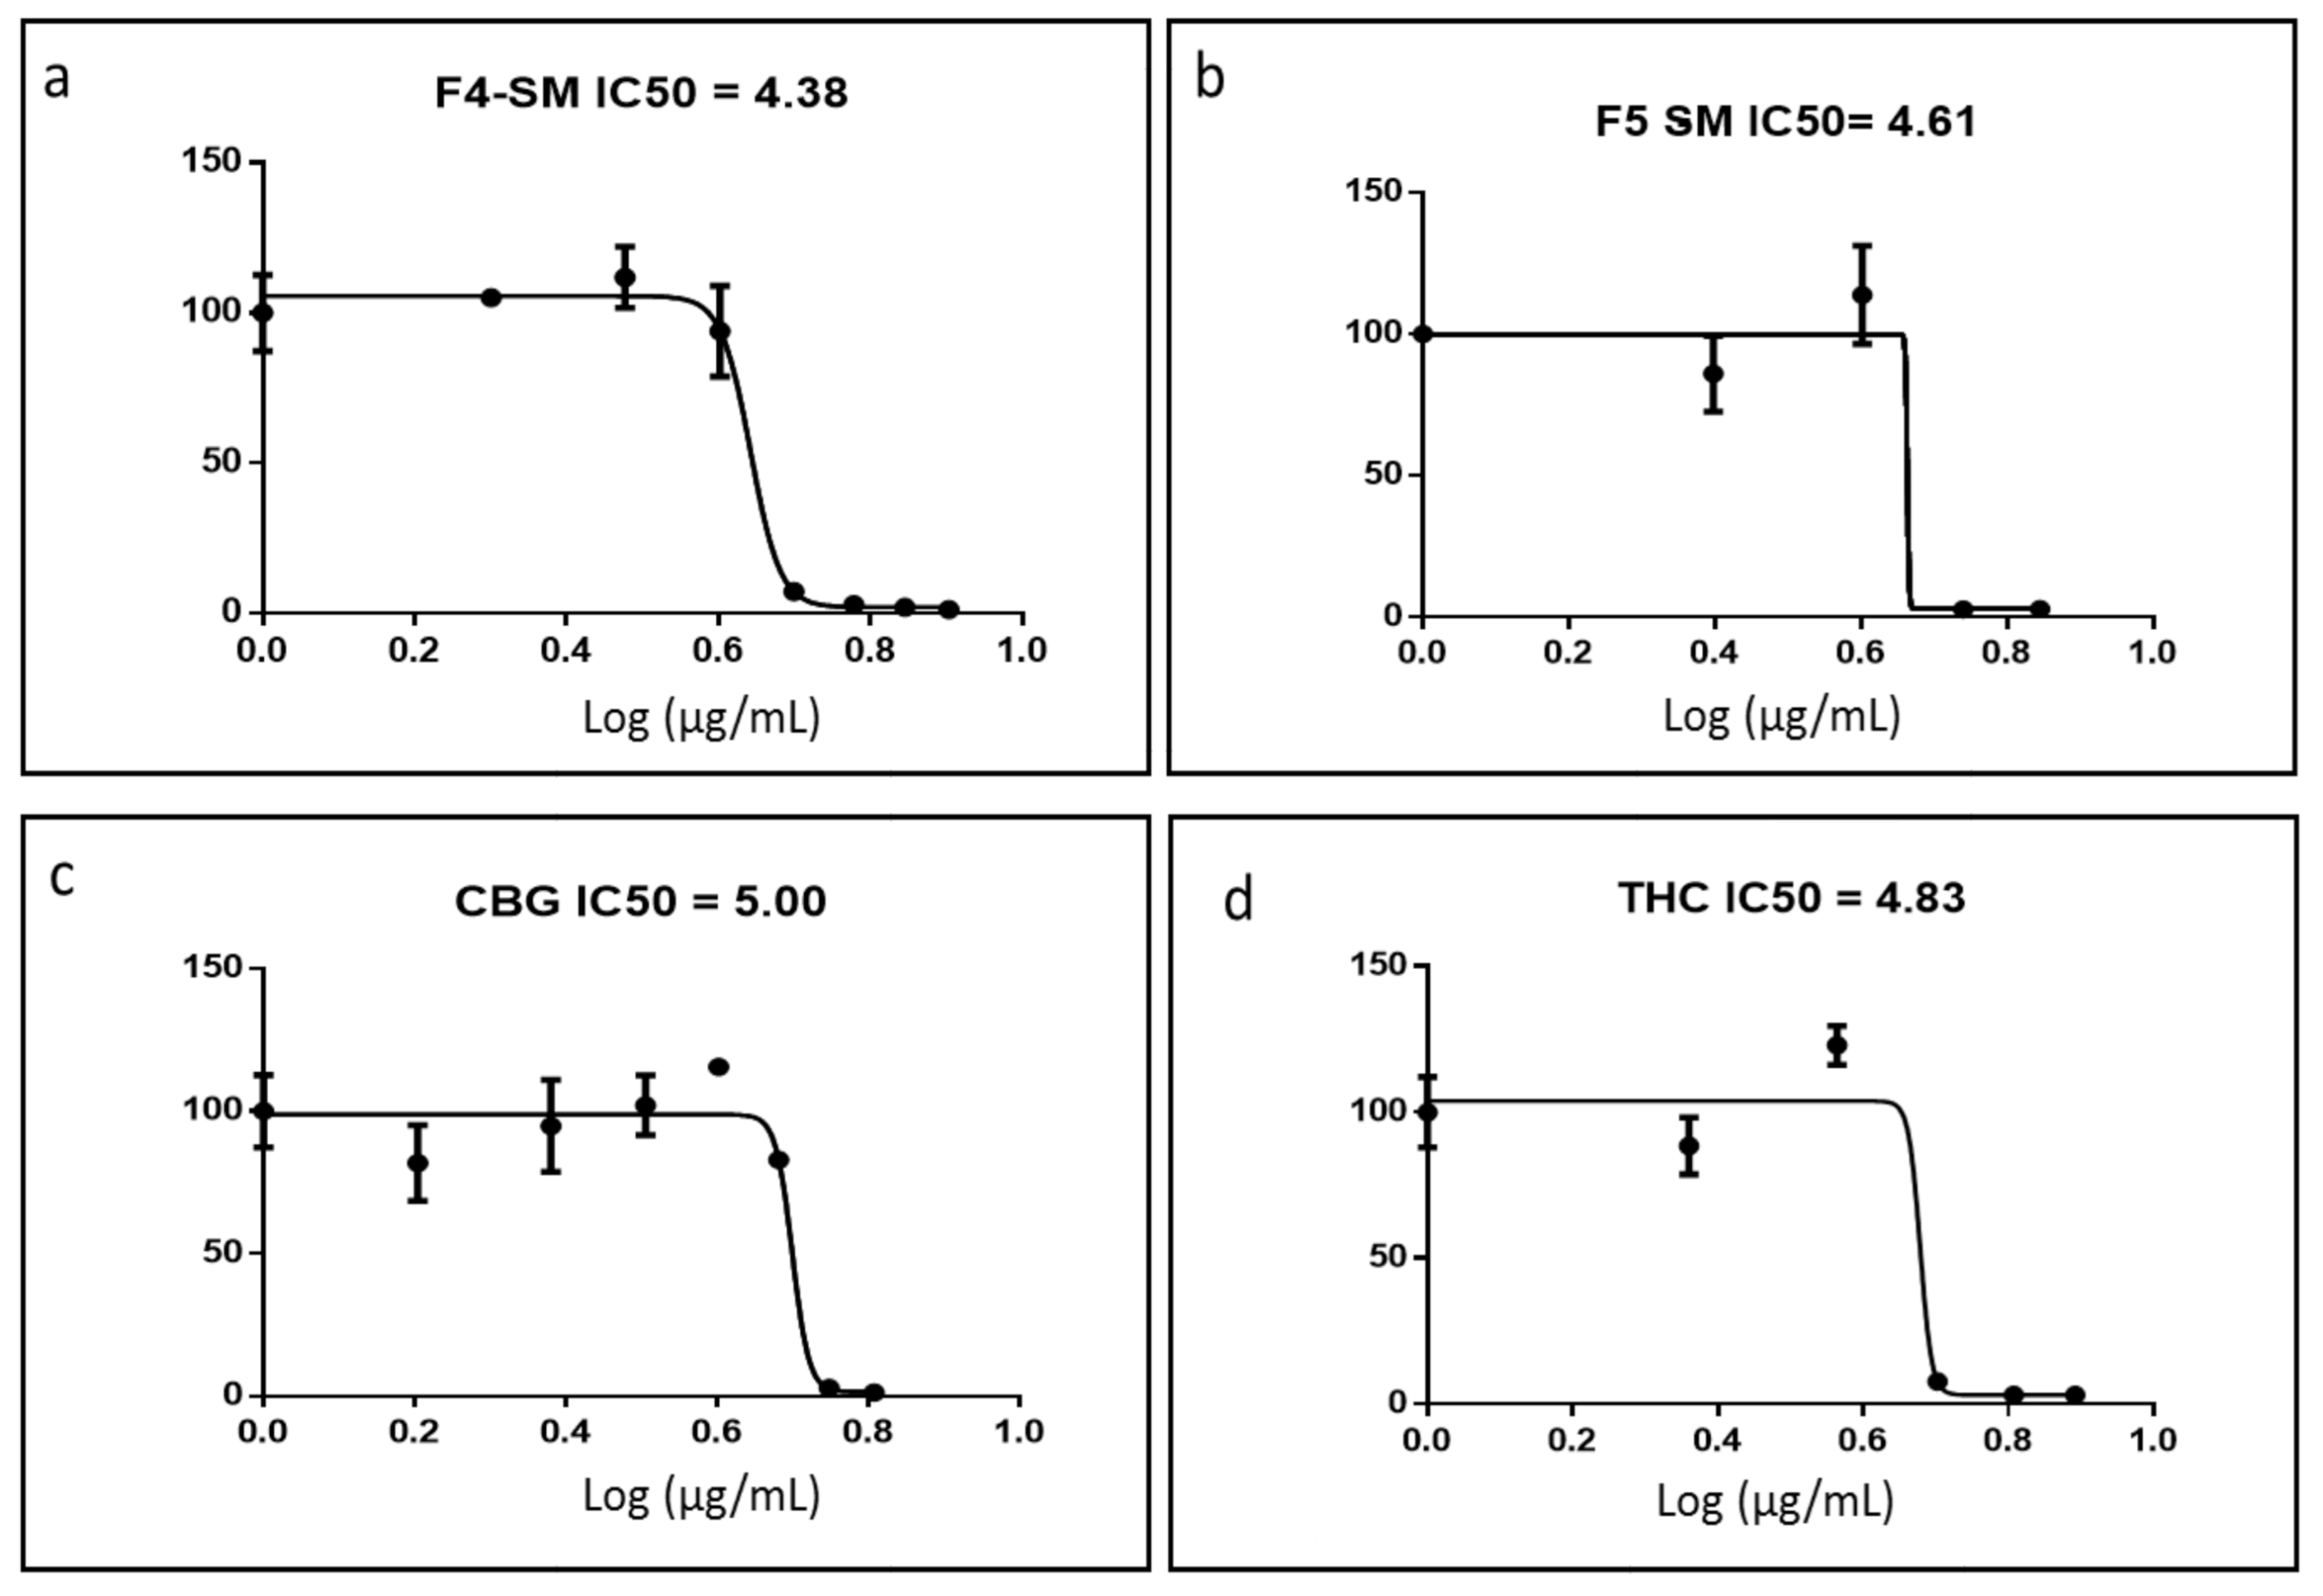
3.3. Determination of Activity of the Standard Mixes of F4 and F5
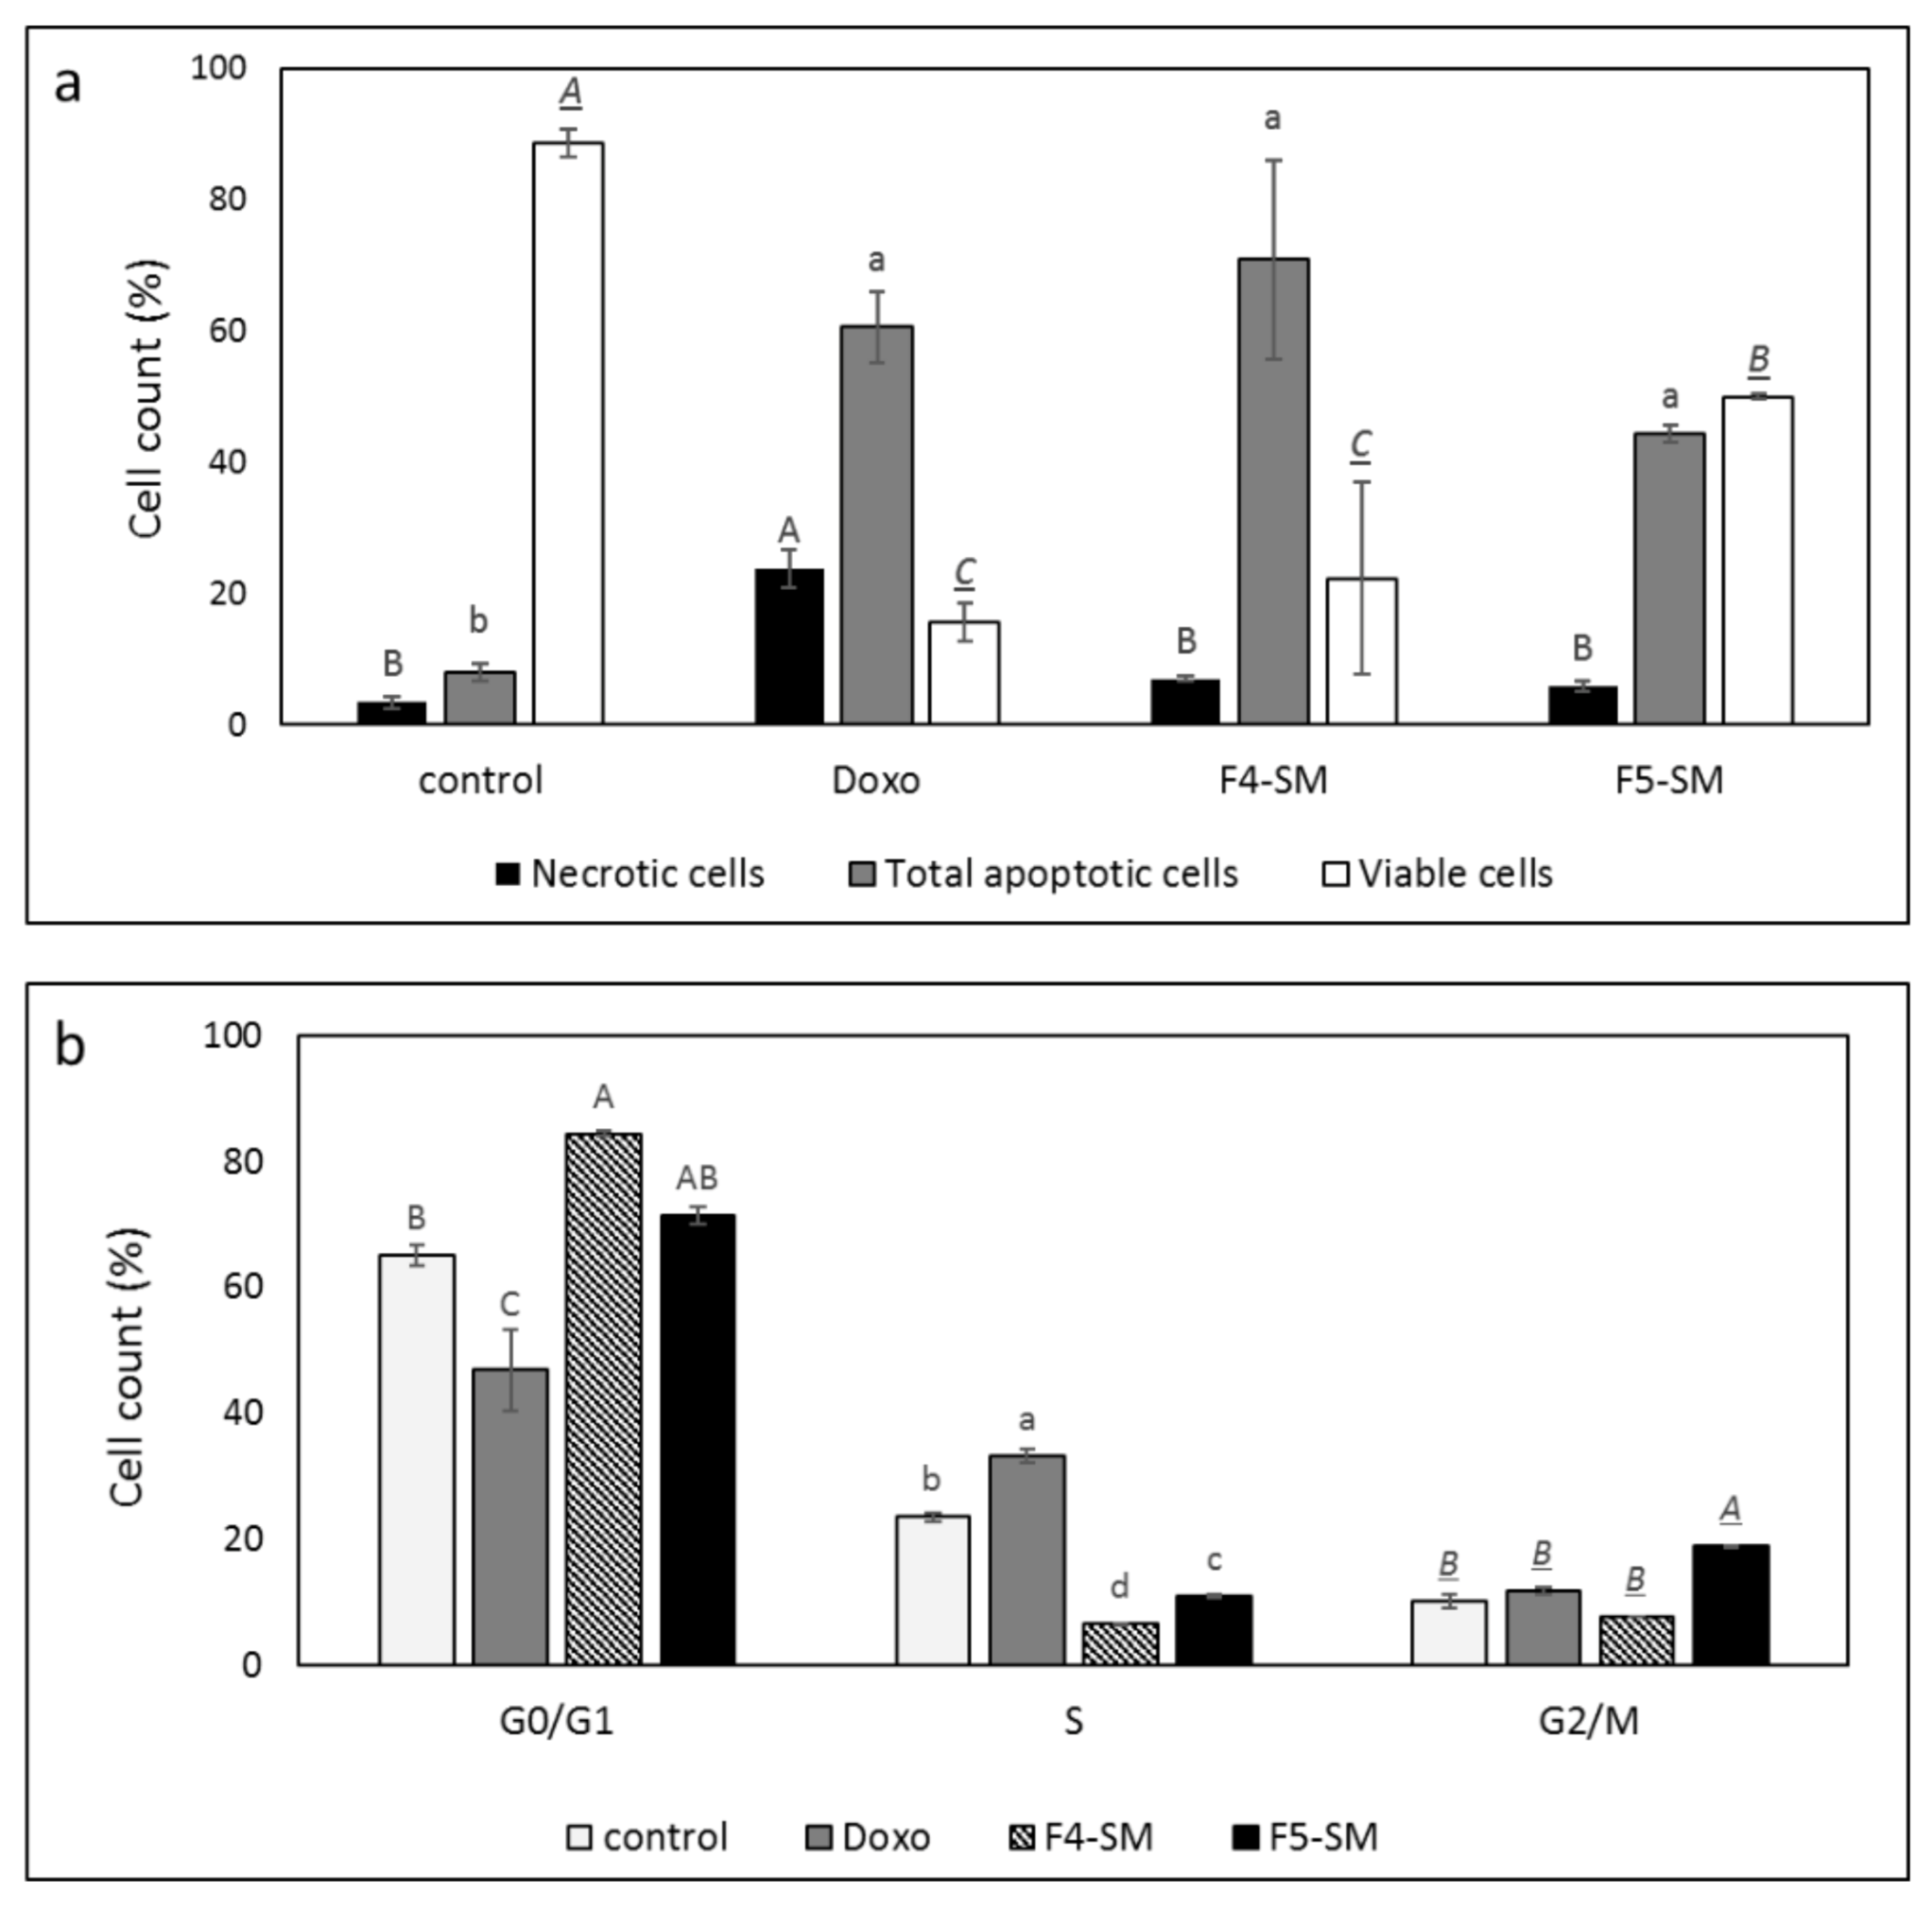
3.4. Determination of the Effect of F4-SM or F5-SM Treatments on Apoptosis
3.5. Determination of the Effect of F4-SM or F5-SM Treatments on Cell Cycle Arrest
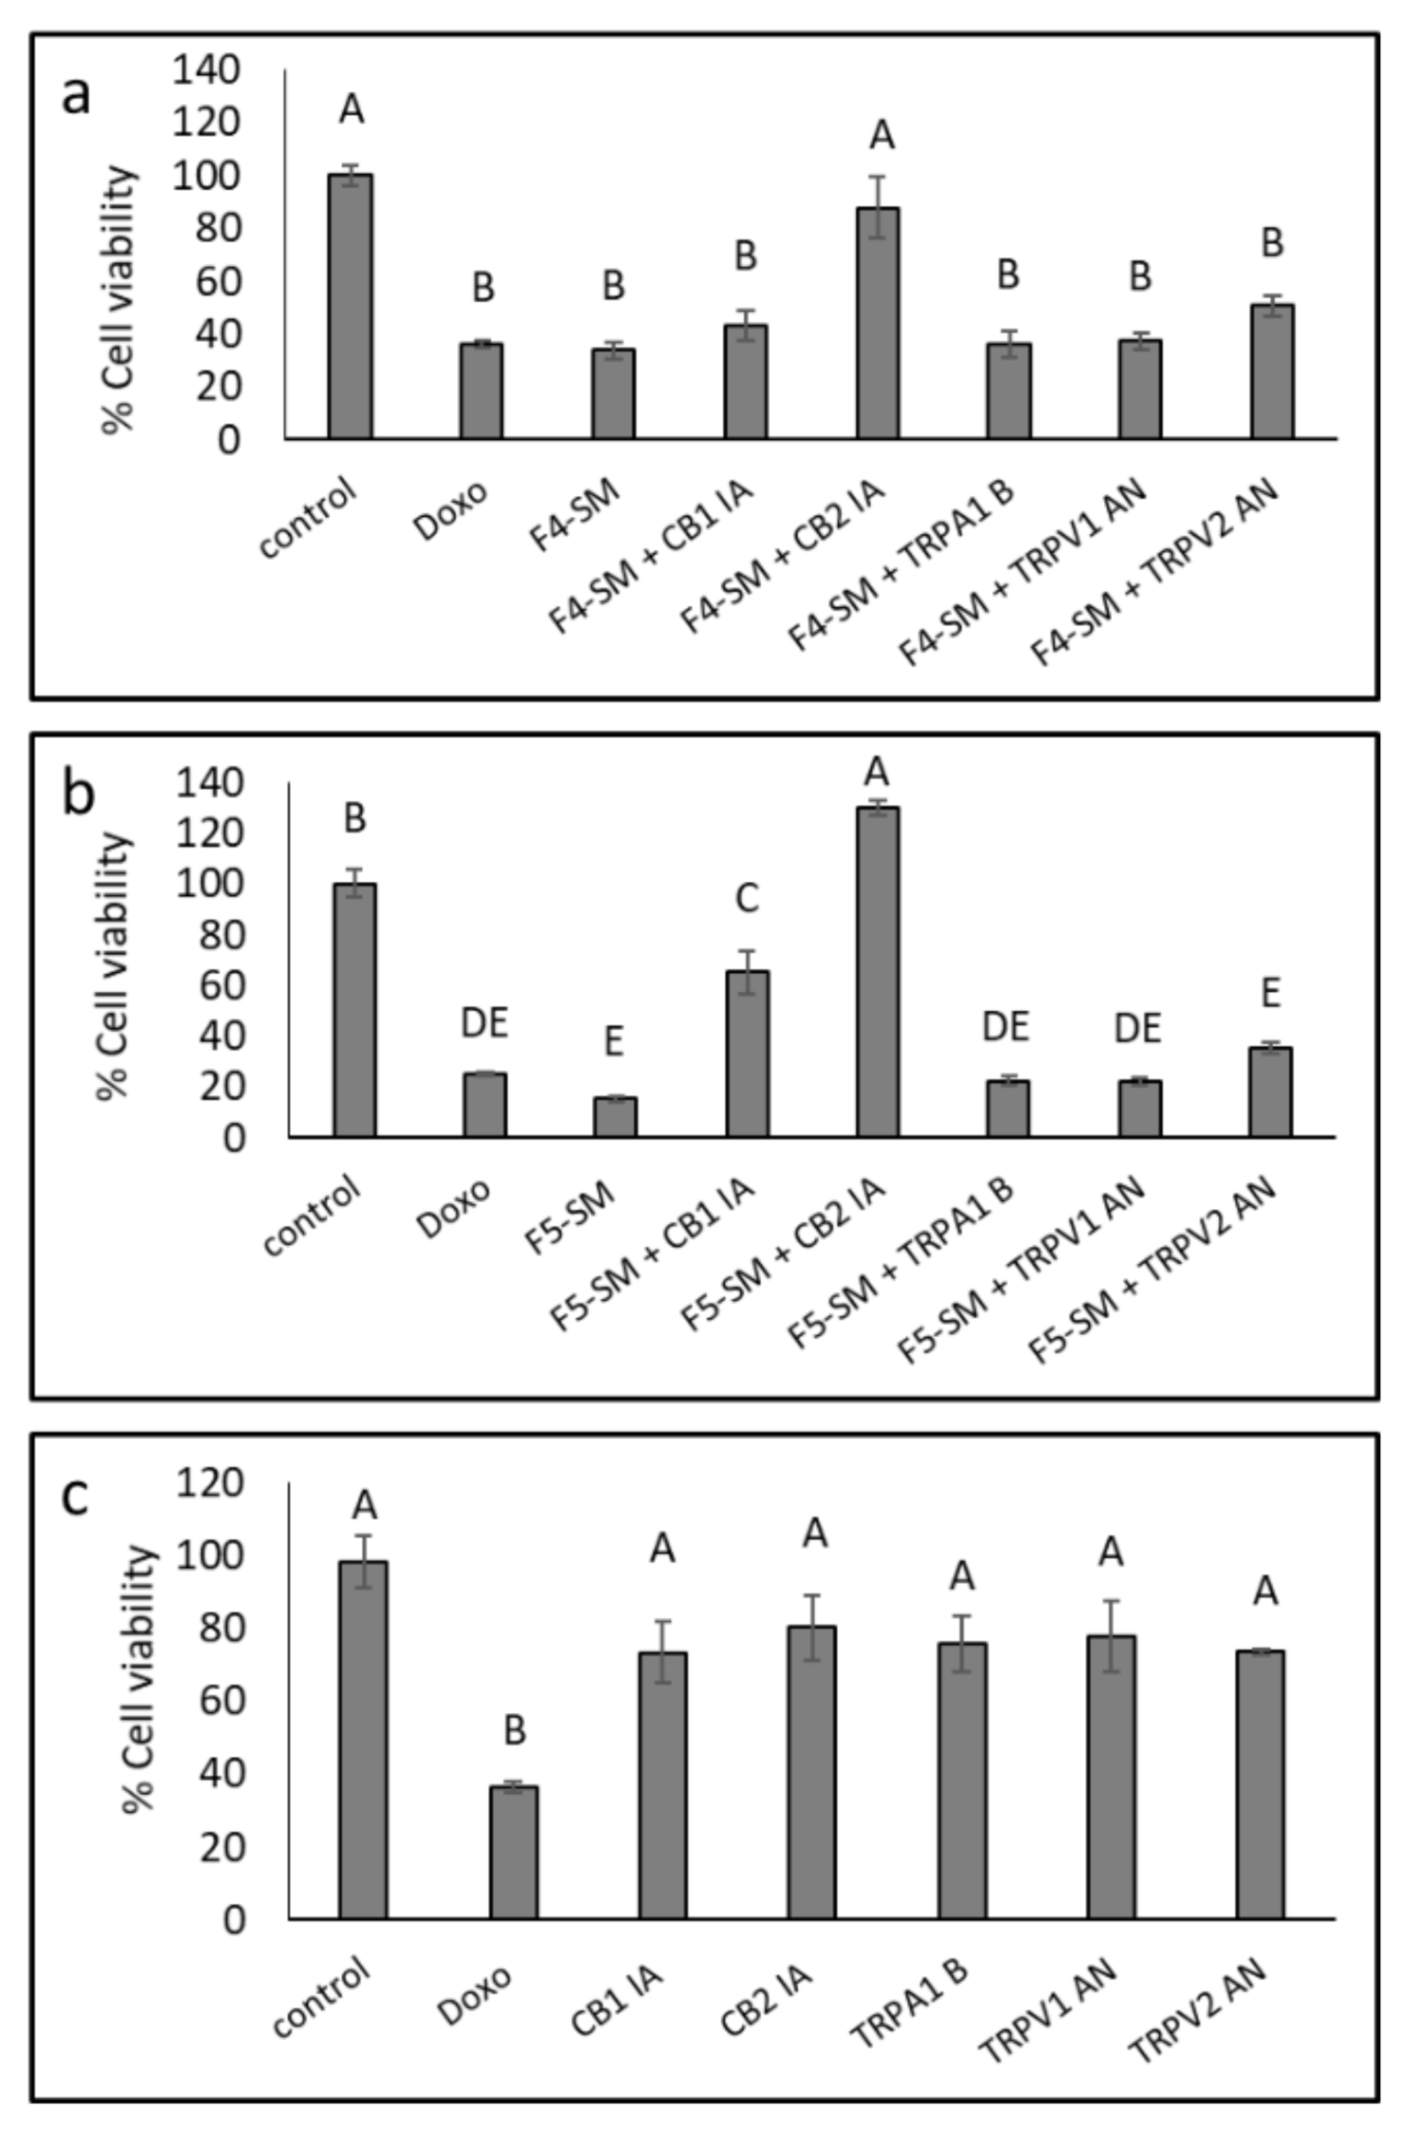
3.6. Determination of the Involvement of CB1 and CB2 Receptor Inverse Agonists, TRPA1 Receptor Blocker and TRPV1 and TRPV2 Receptors Antagonists on Cytotoxic Activity
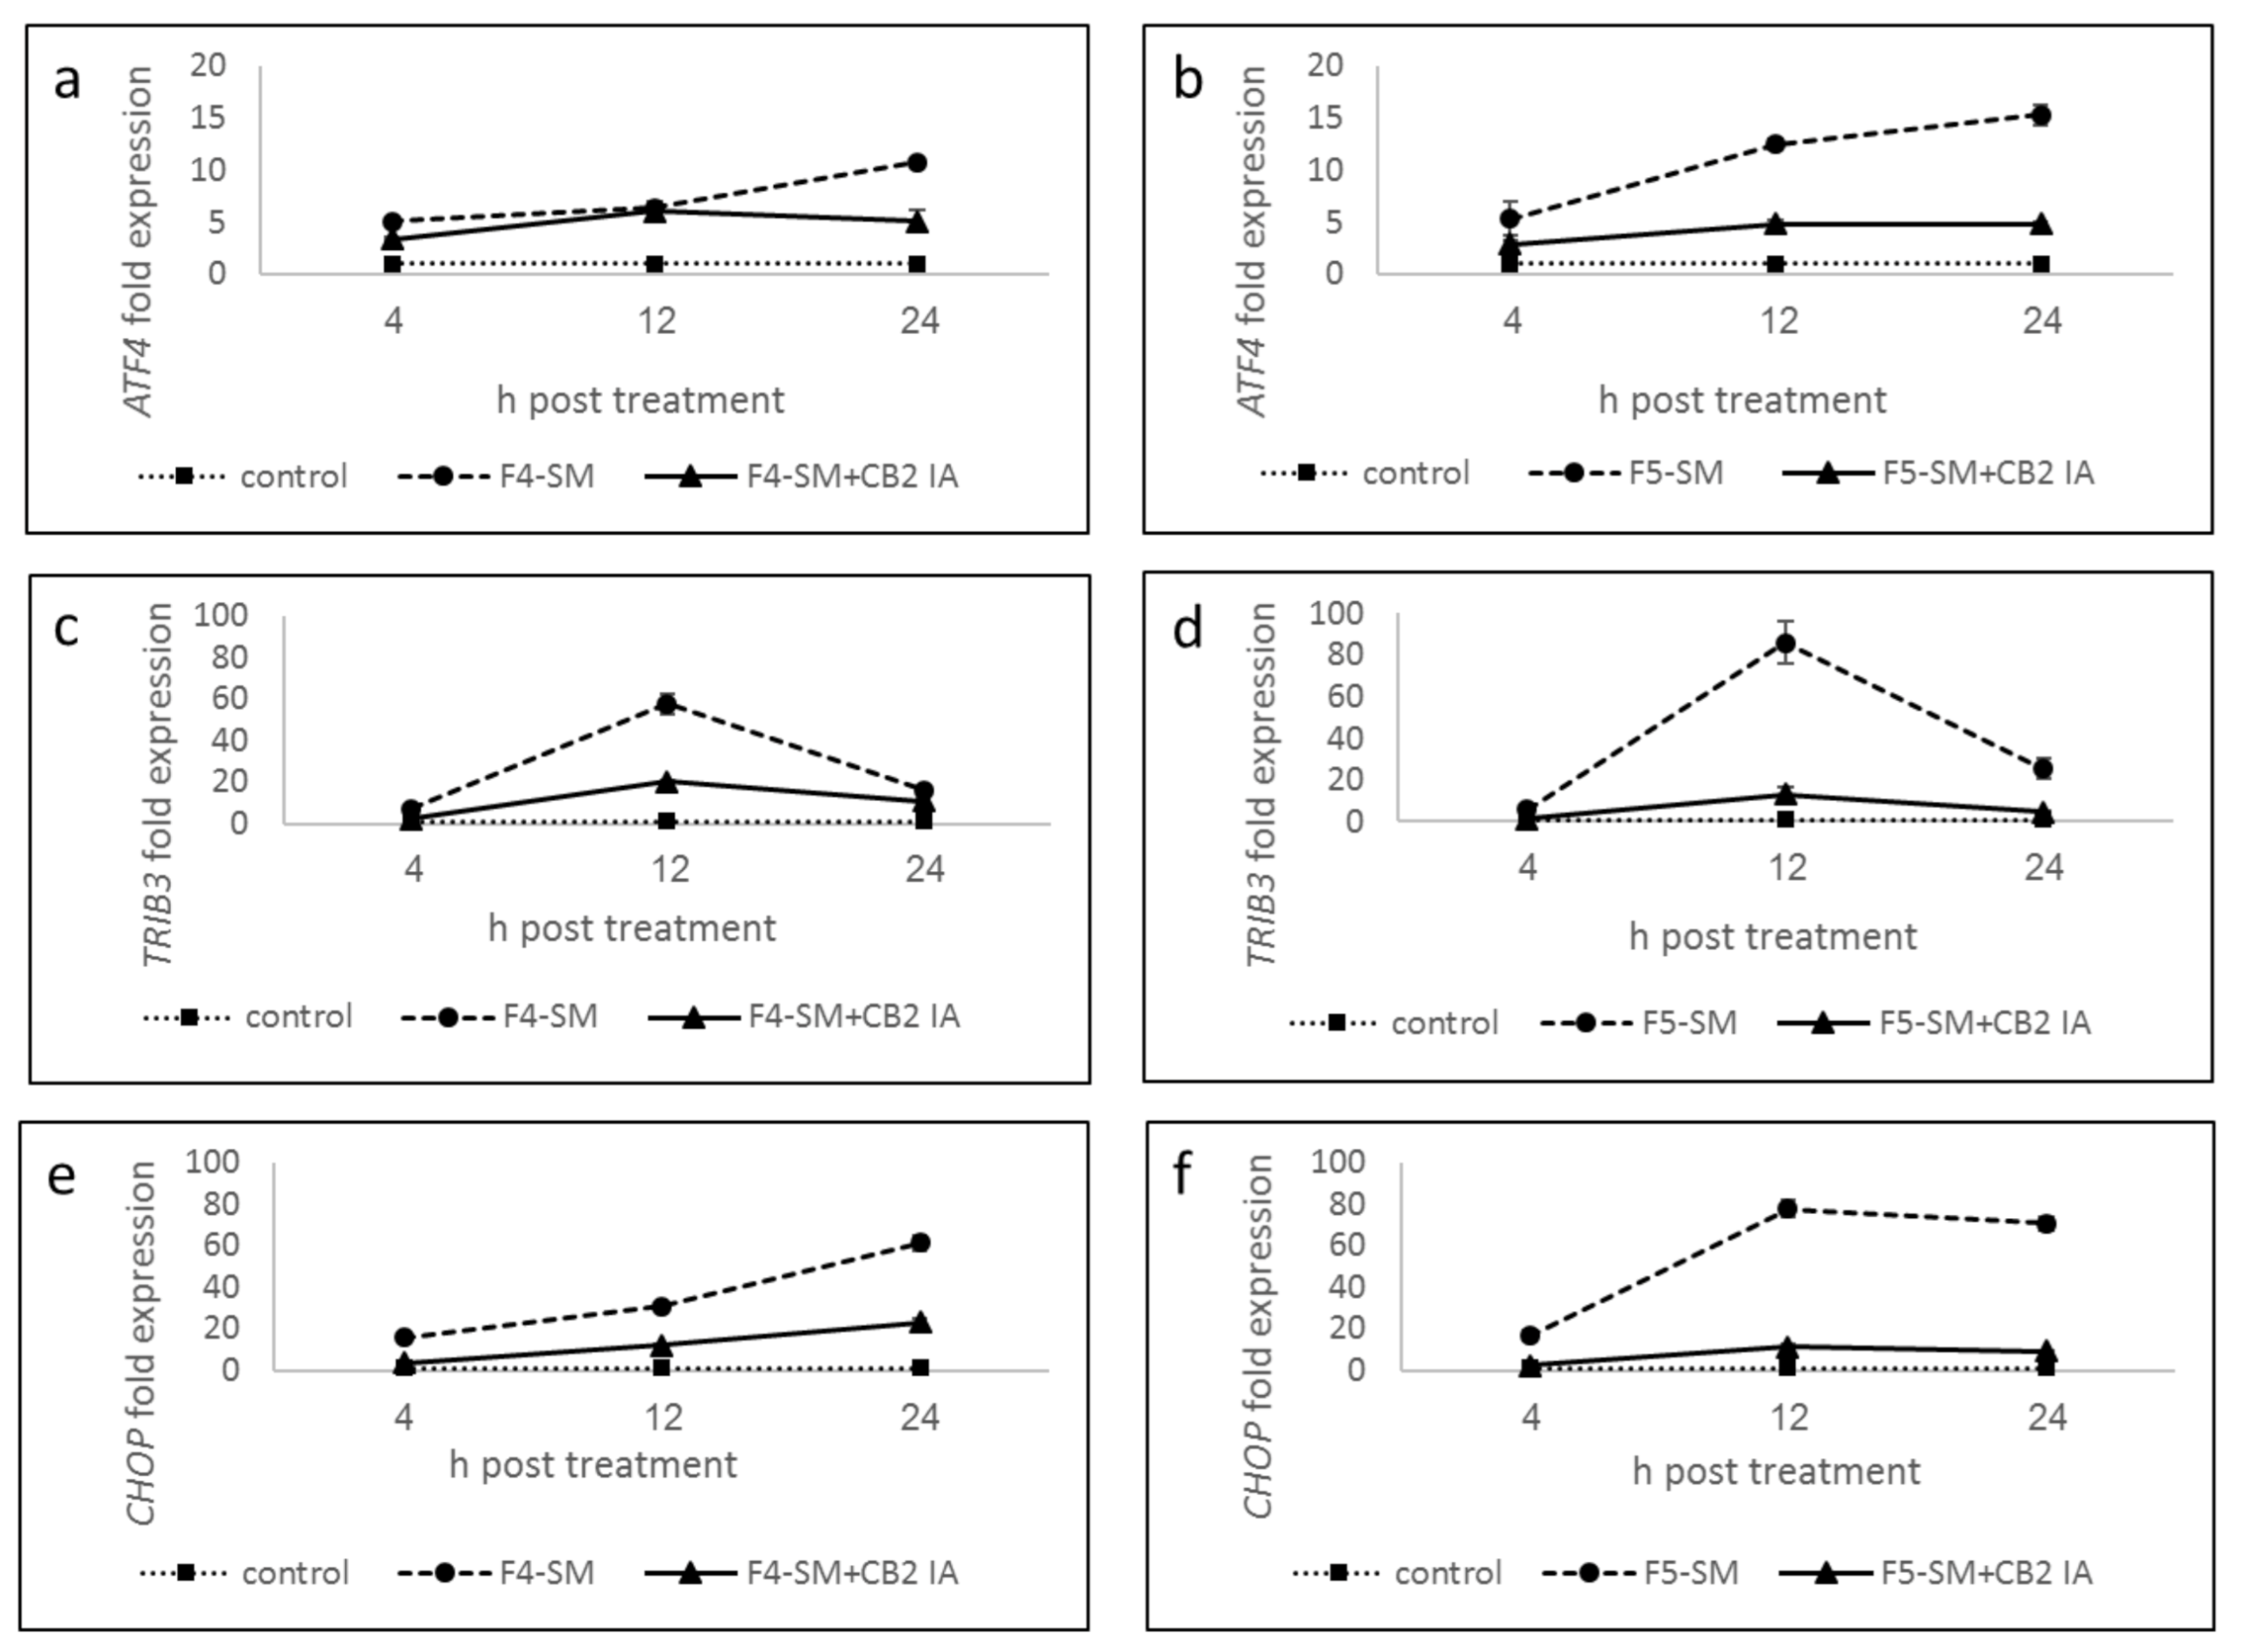
3.7. Determination of Gene Expression of ER-Stress Related Genes
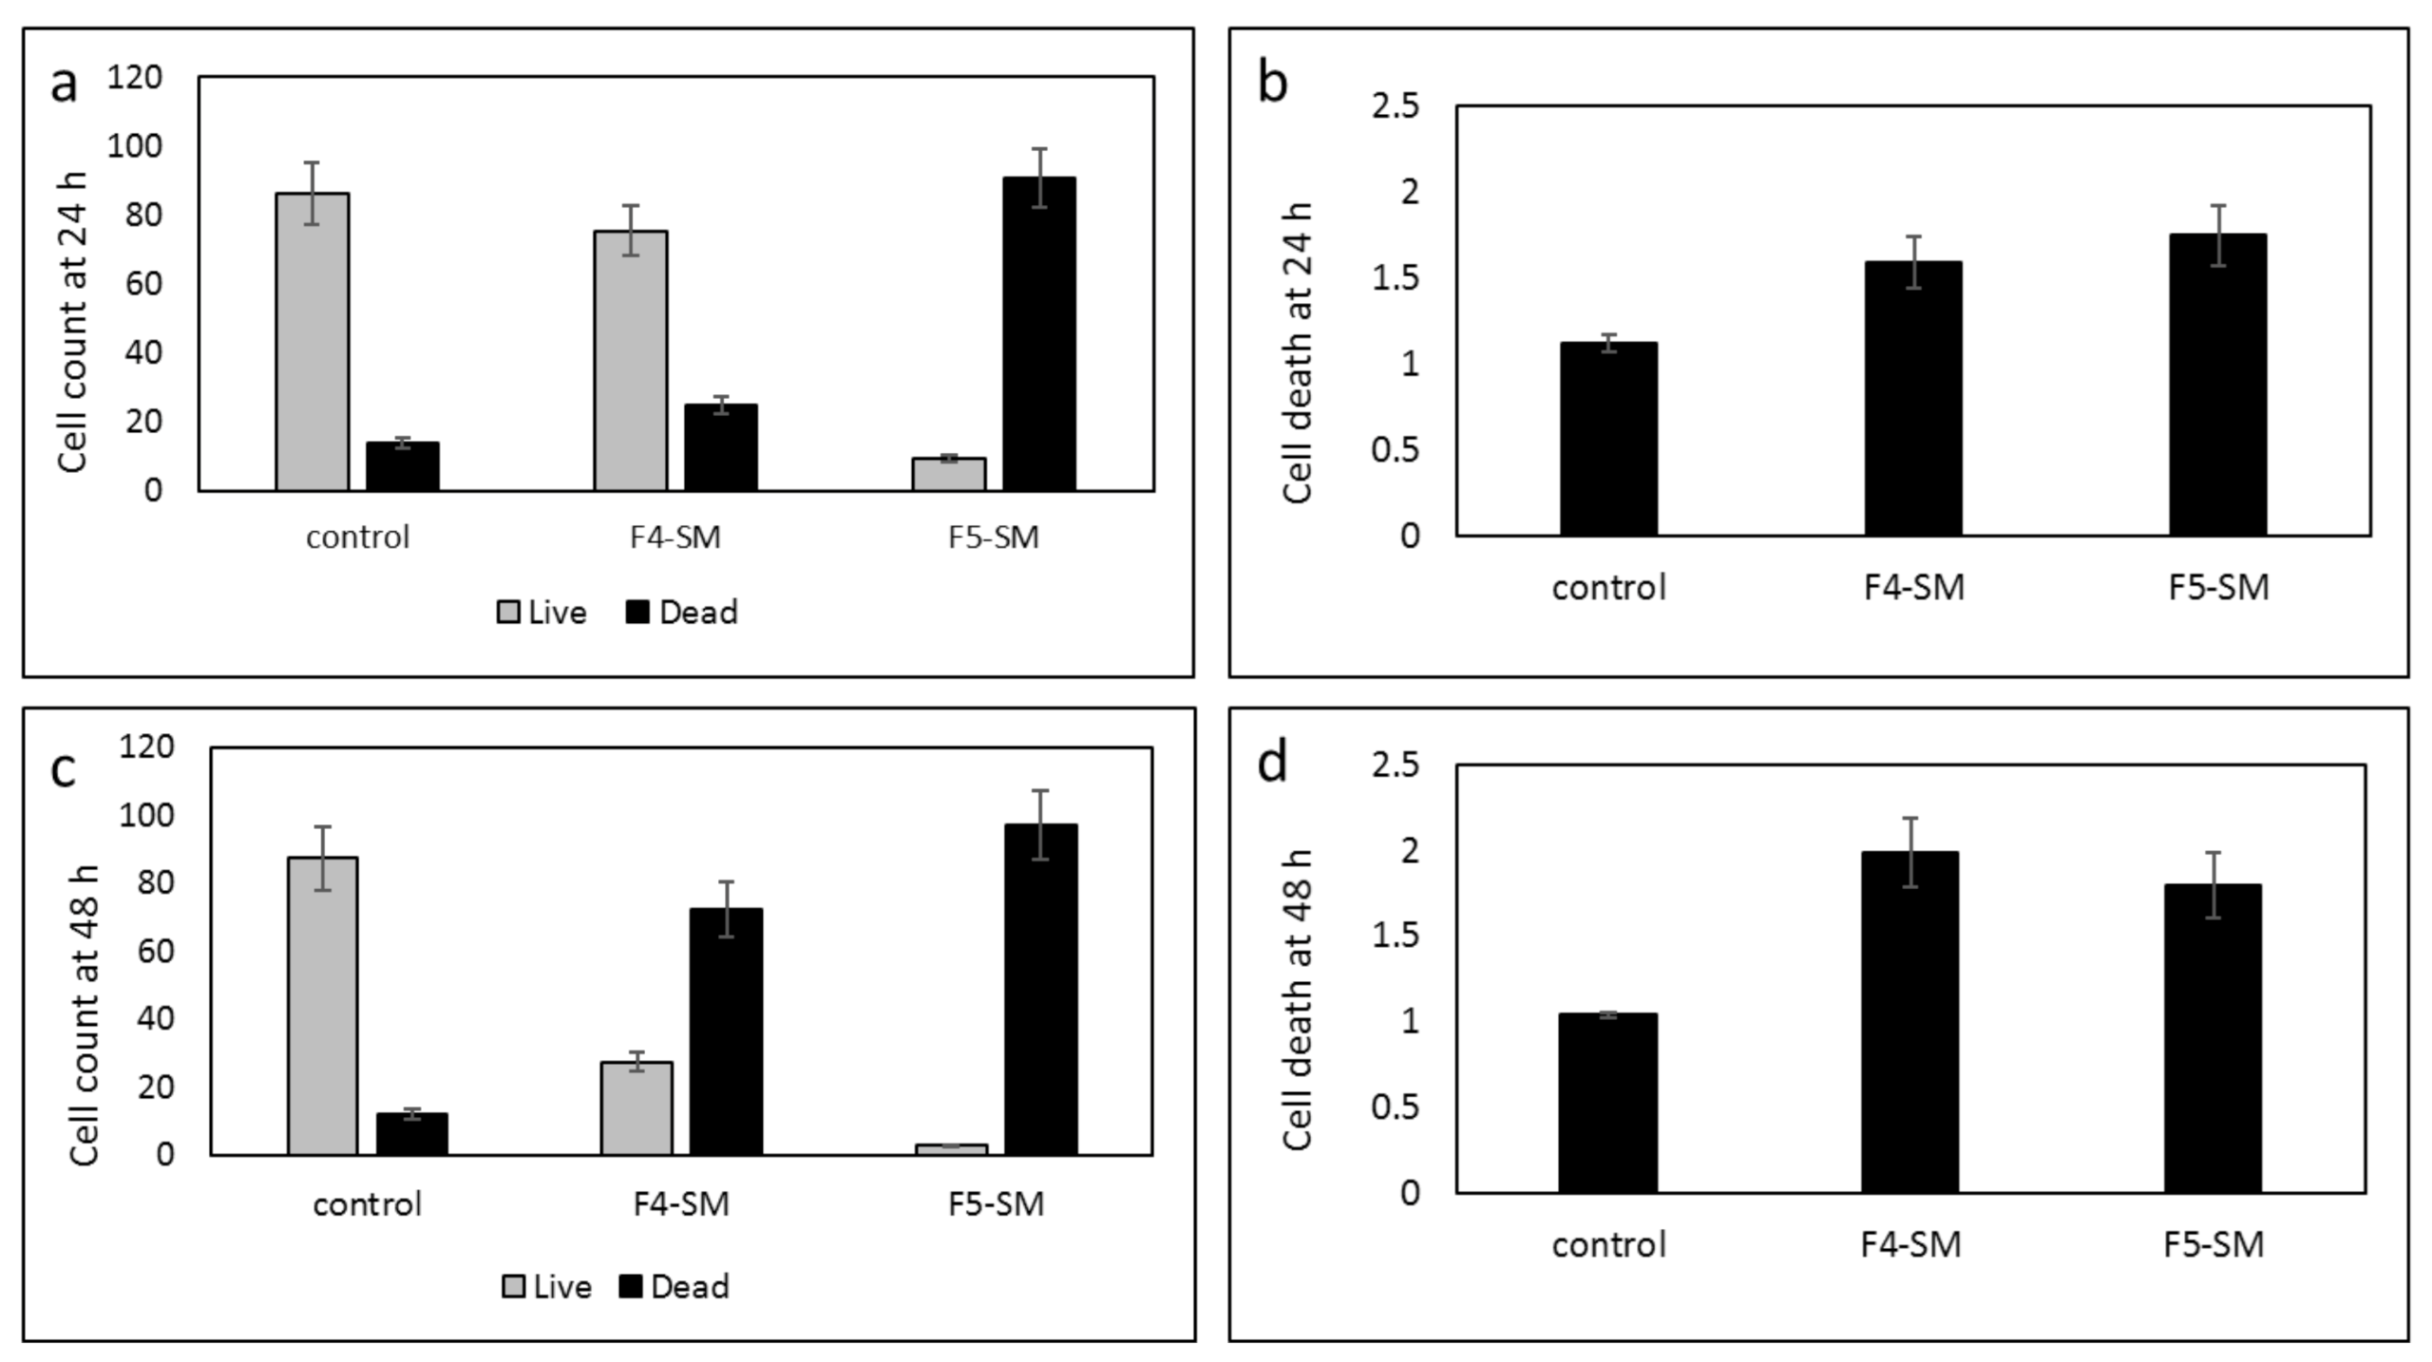
3.8. Determination of the Effect of SM Treatments on GSC Viability
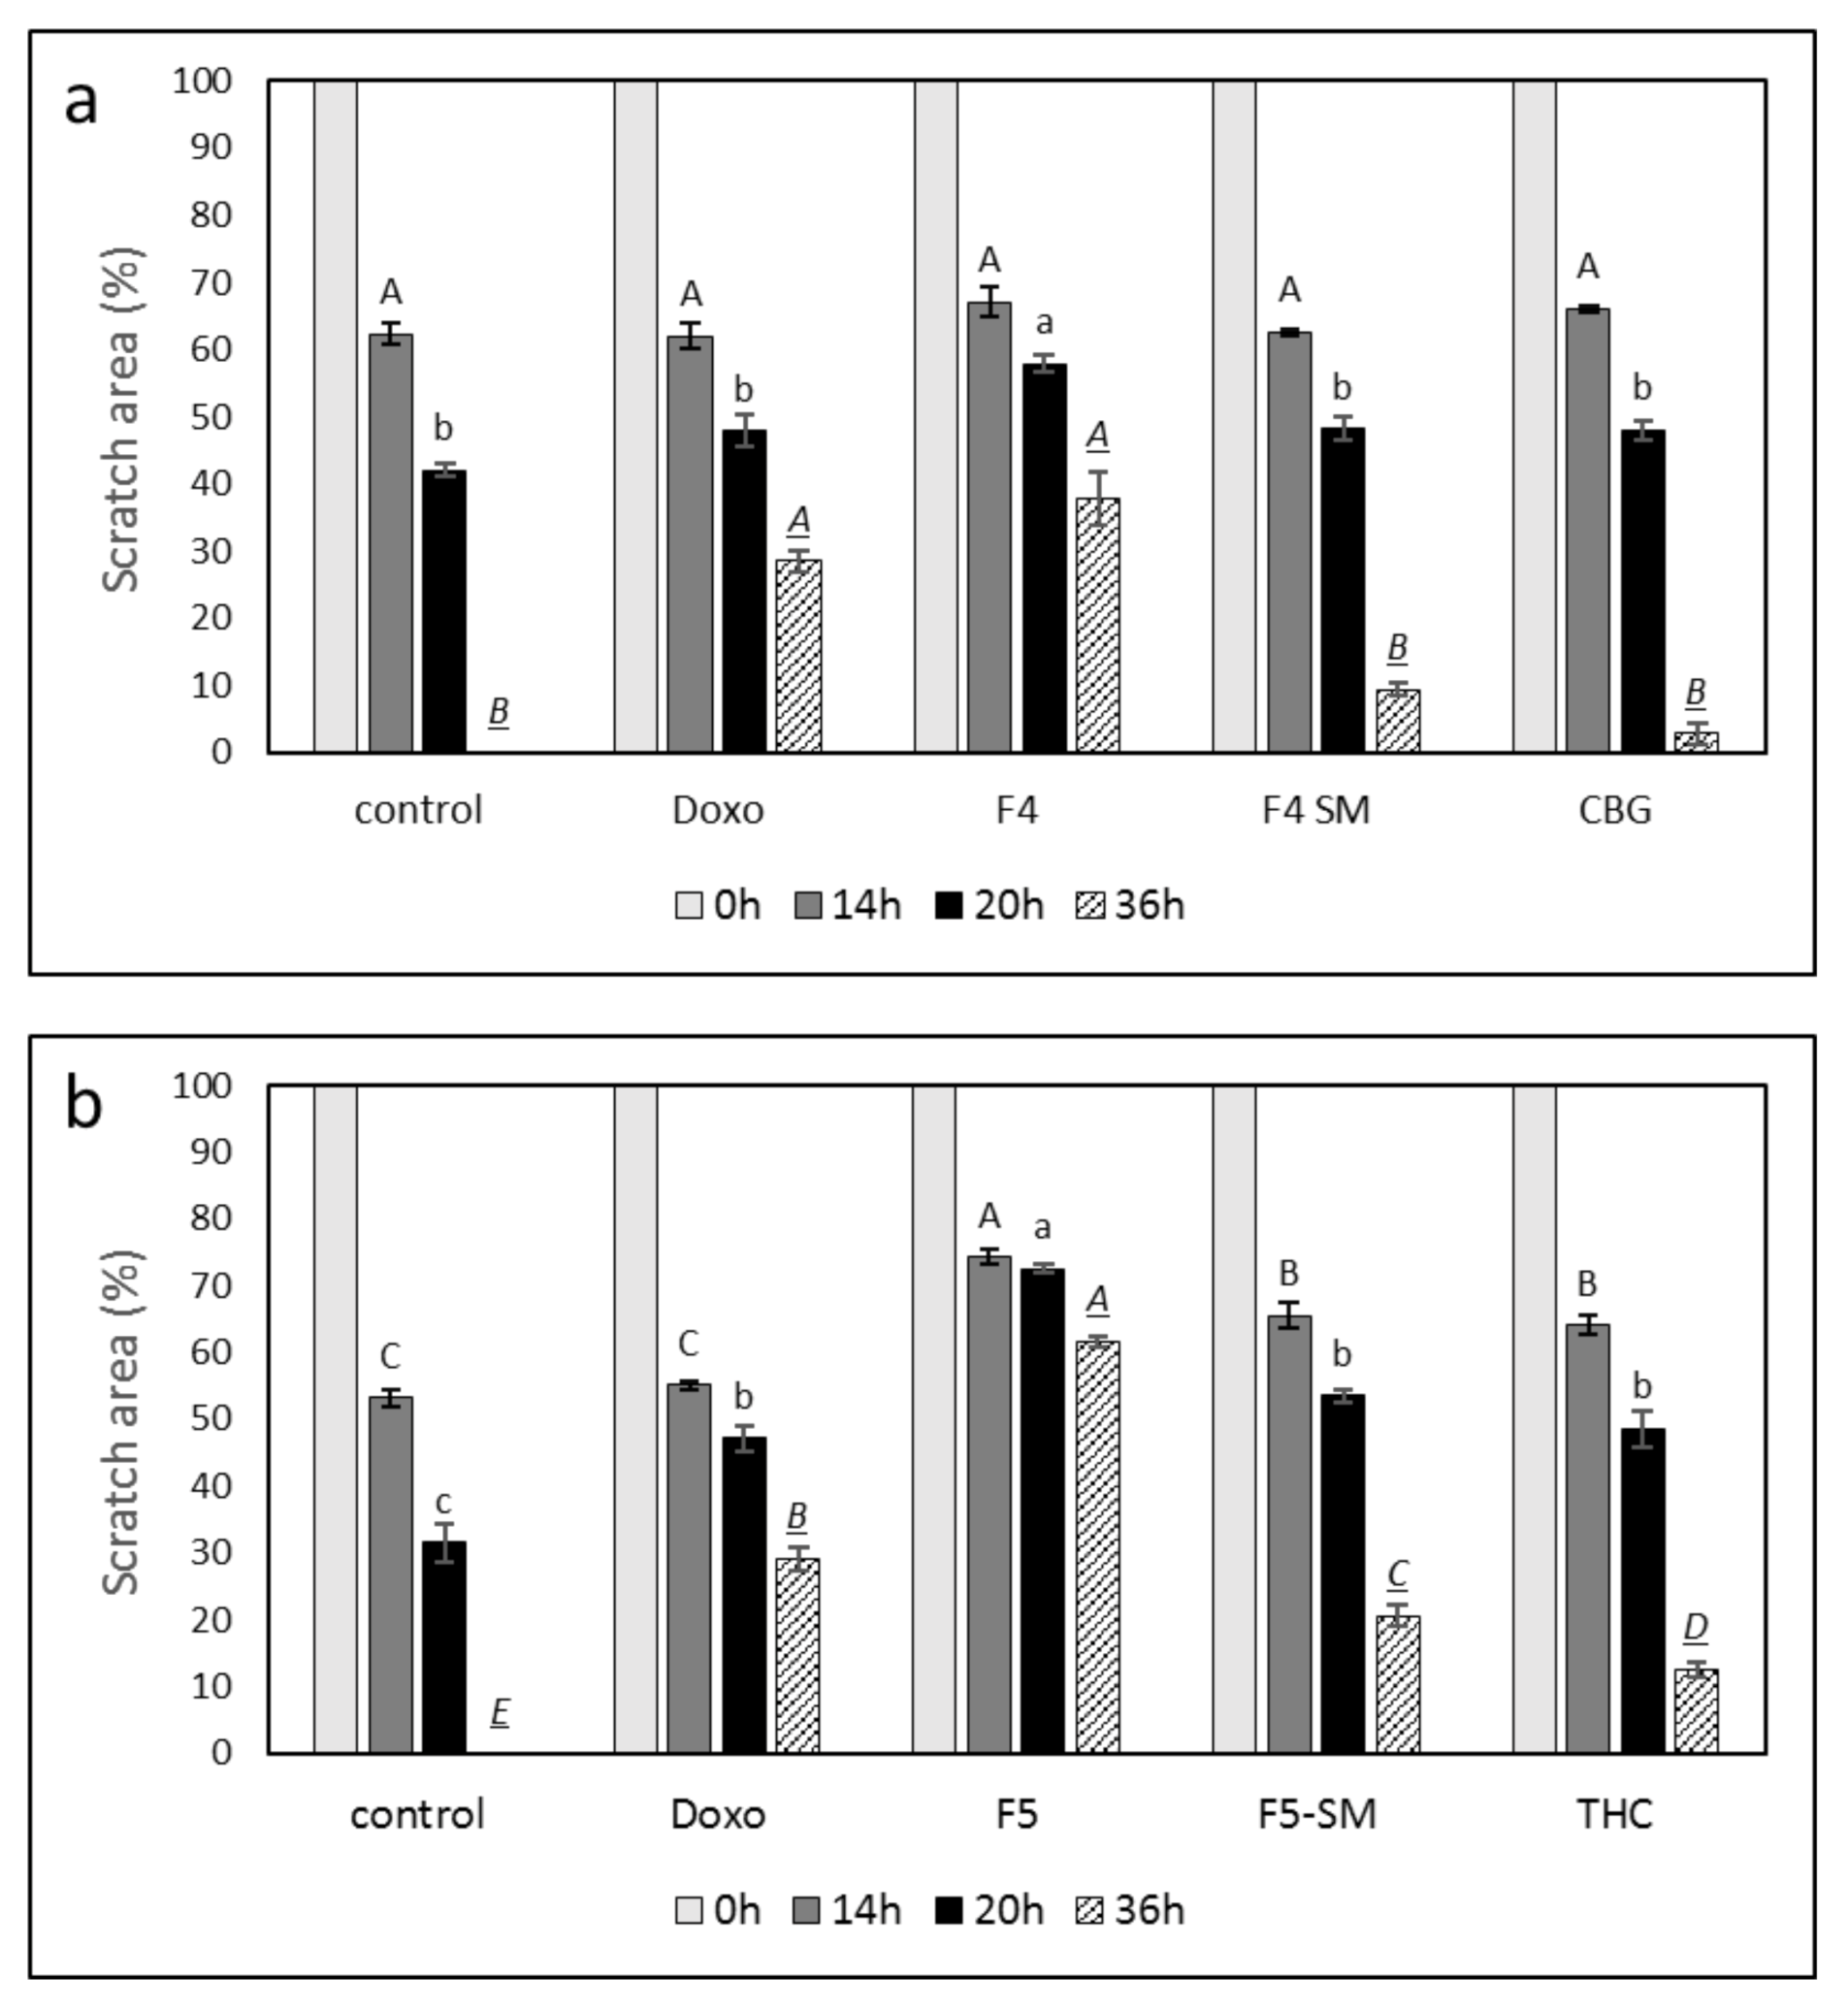
3.9. Determination of the Effect of Fraction or SM Treatments on Cell Motility
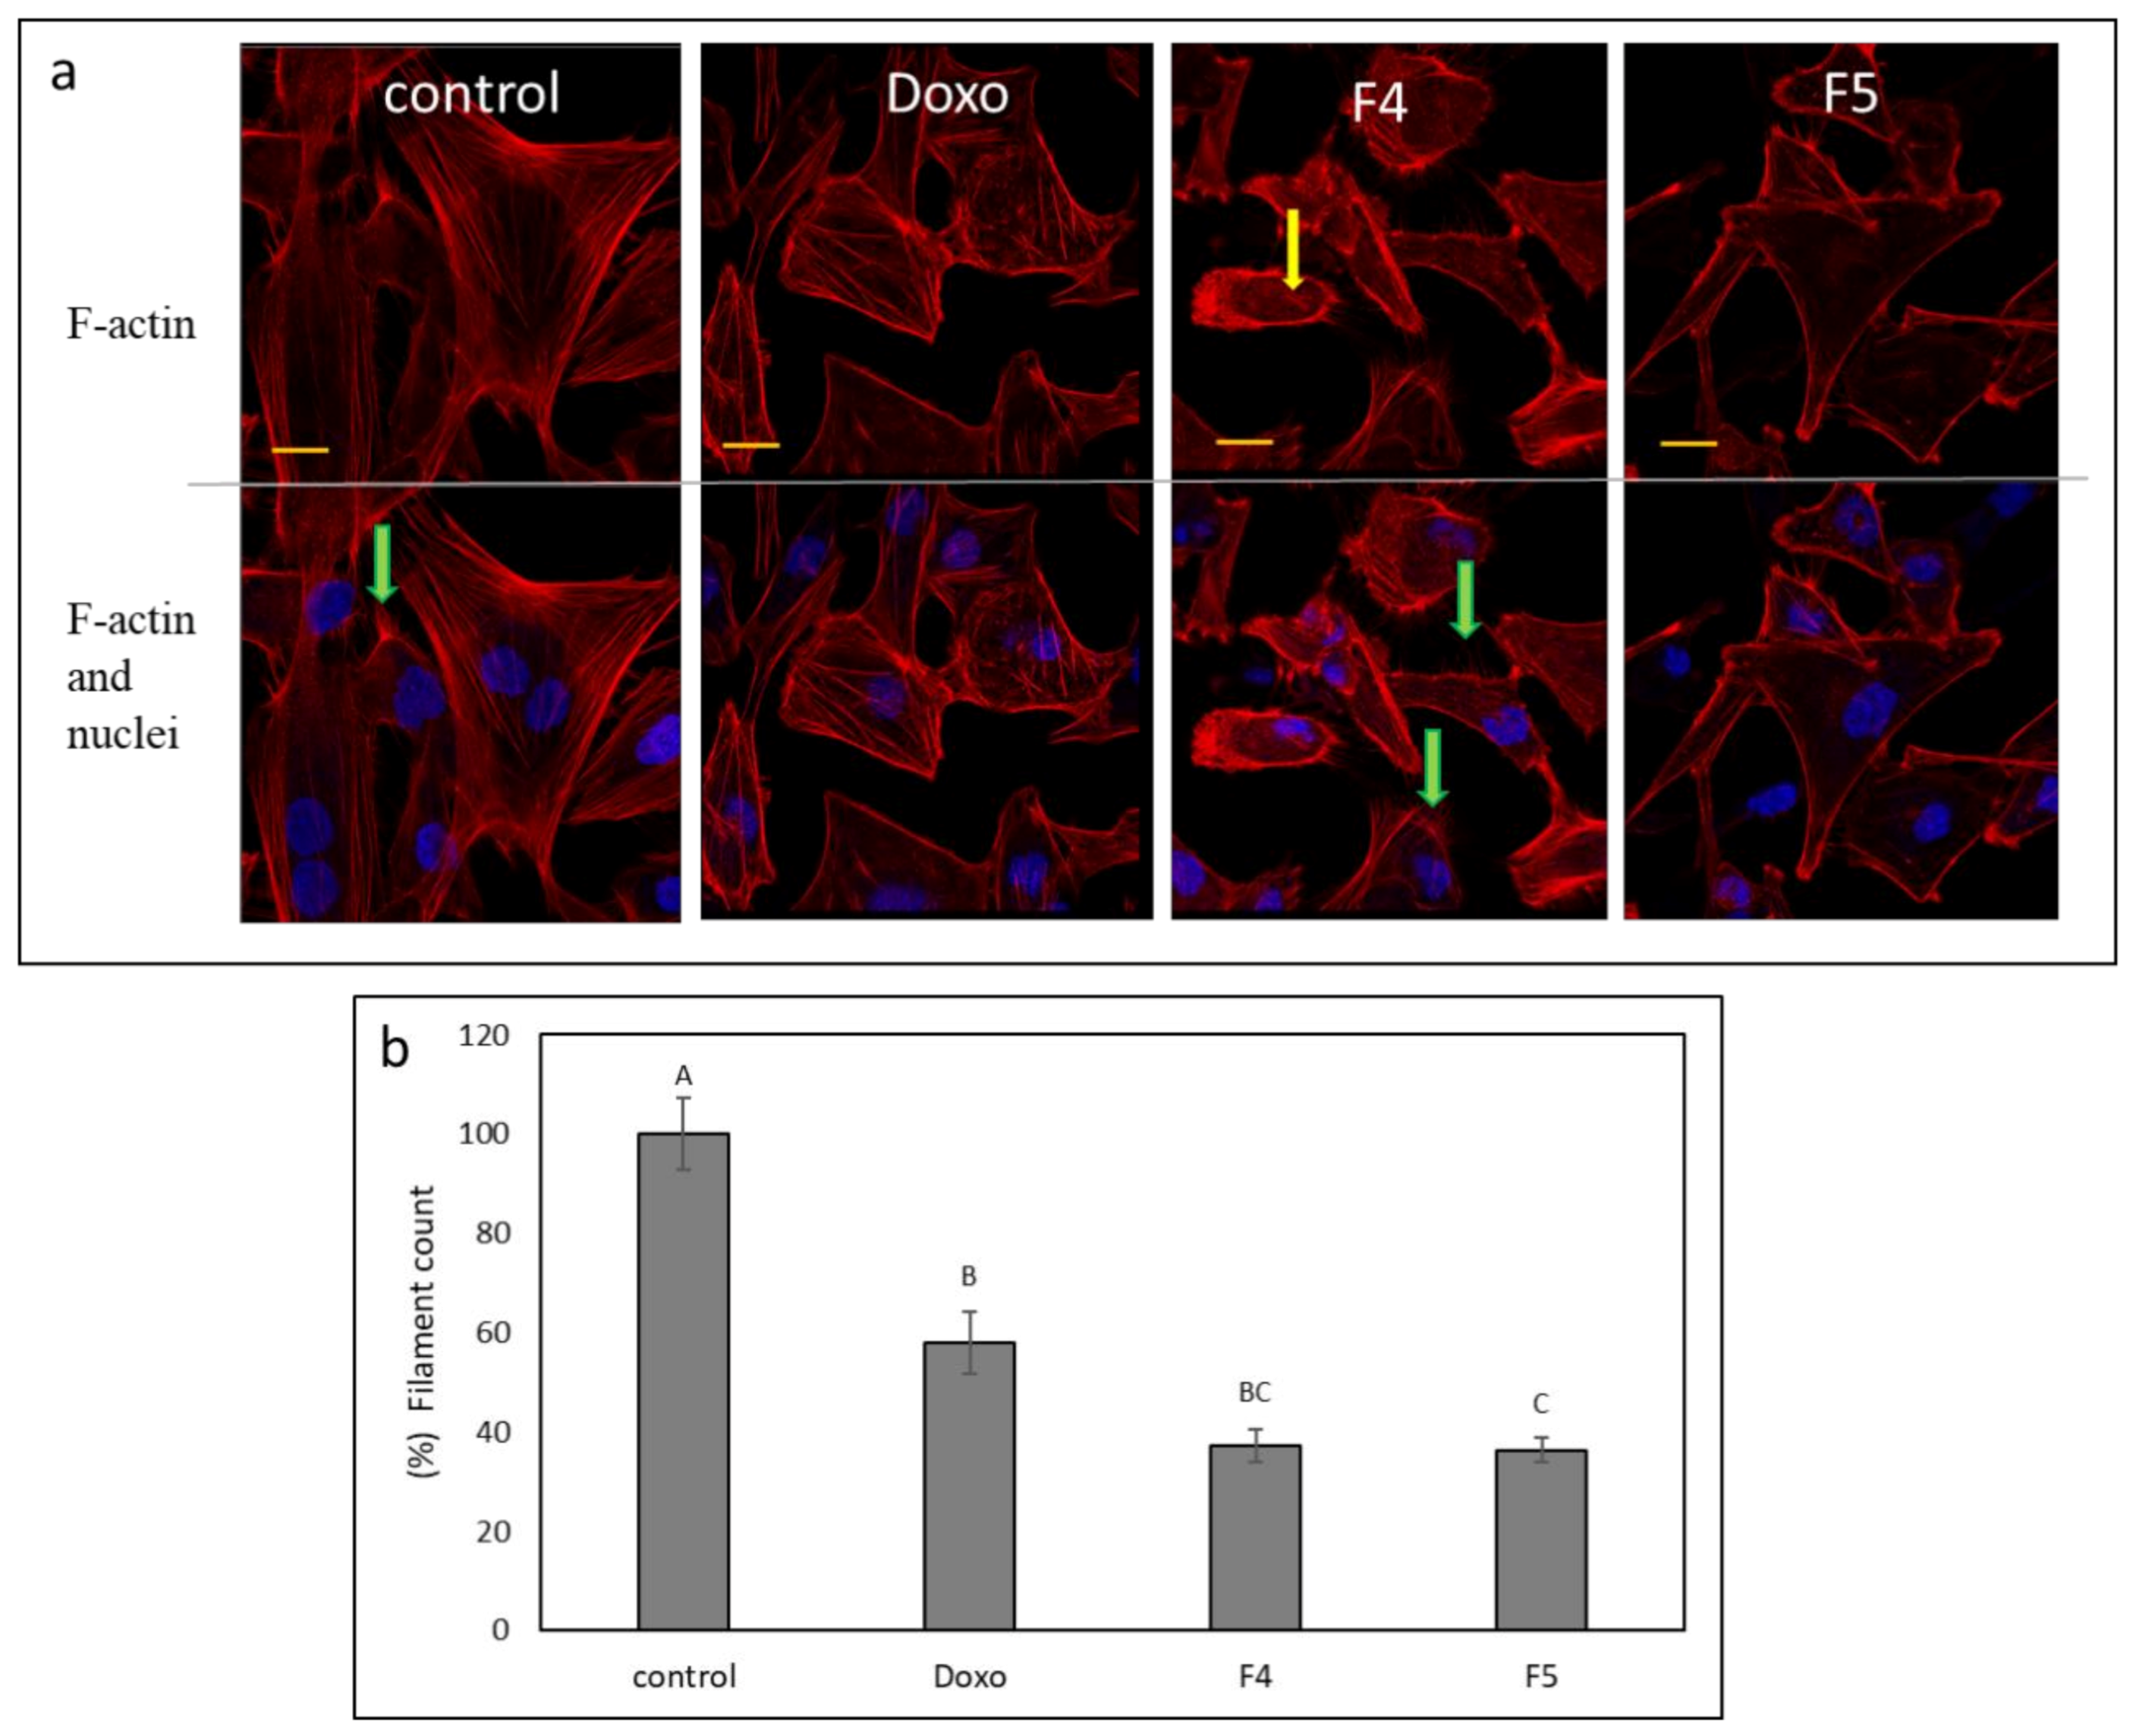
3.10. Determination of the Effect of Fractions Treatments on the Cytoskeleton in A172 Cells
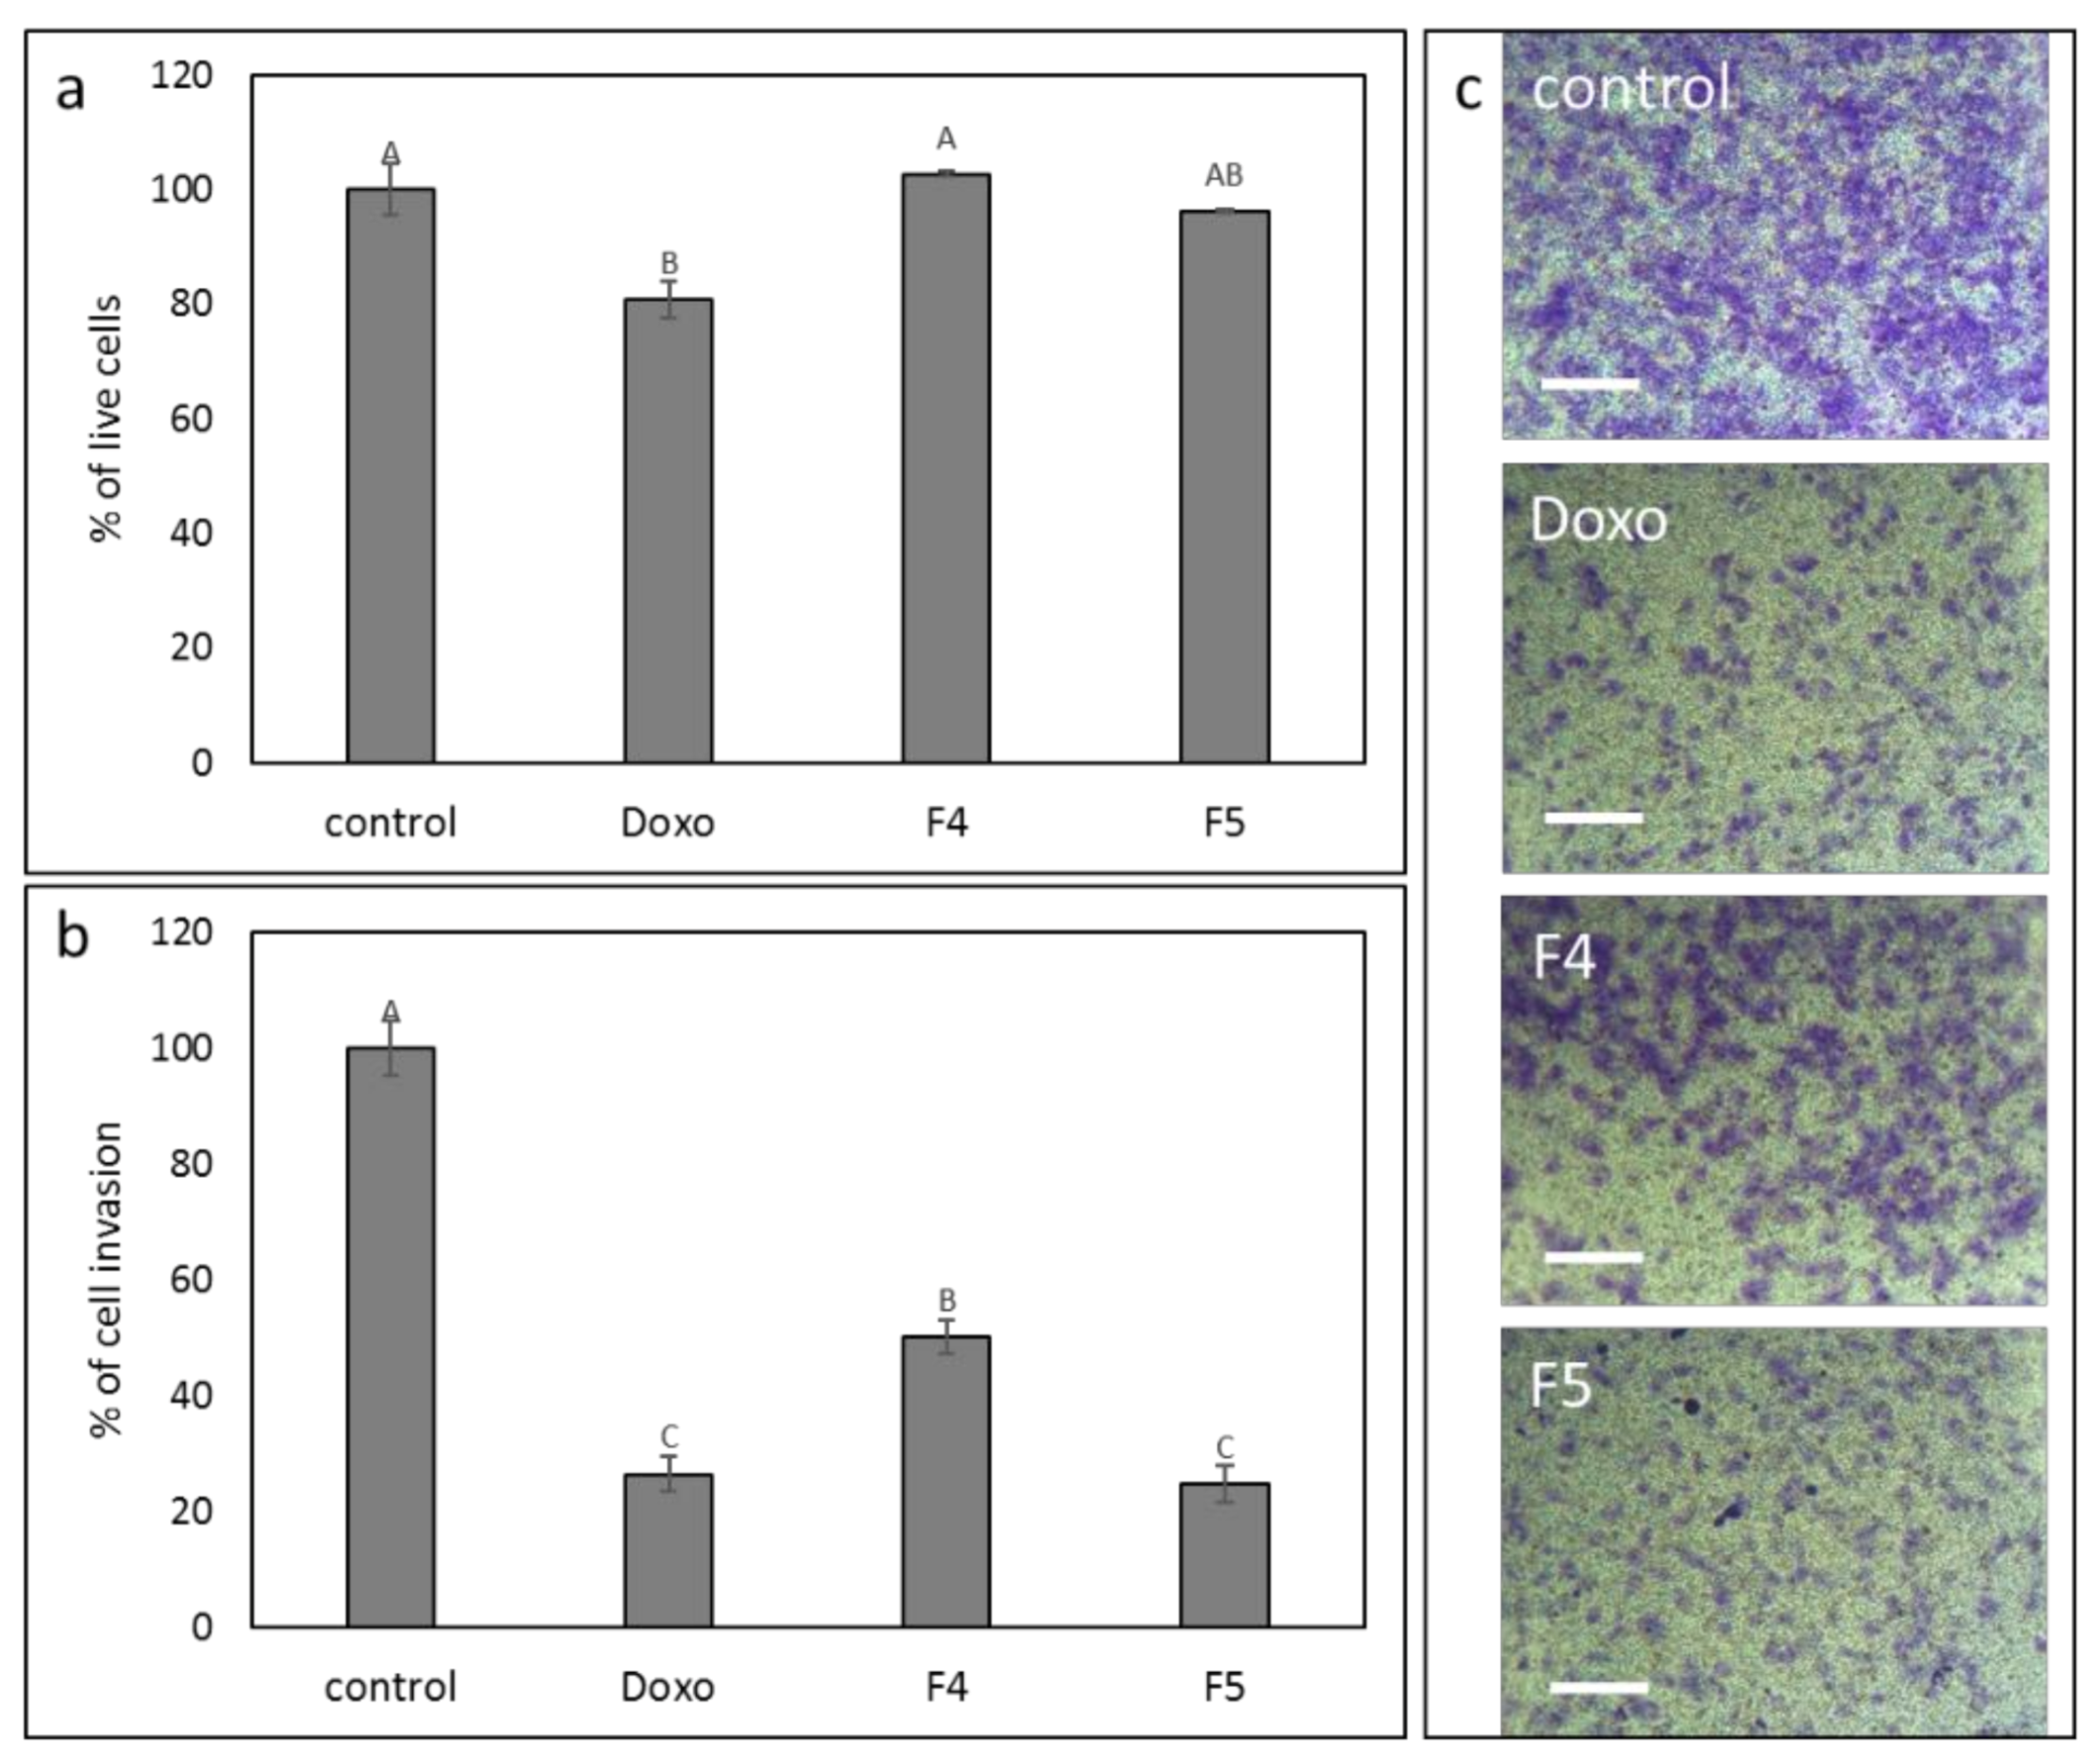
3.11. Determination of the Effect of F4 and F5 Treatments on Cell Invasion
3.12. Determination of the Effect of Fractions or SM Treatments on Colony Formation
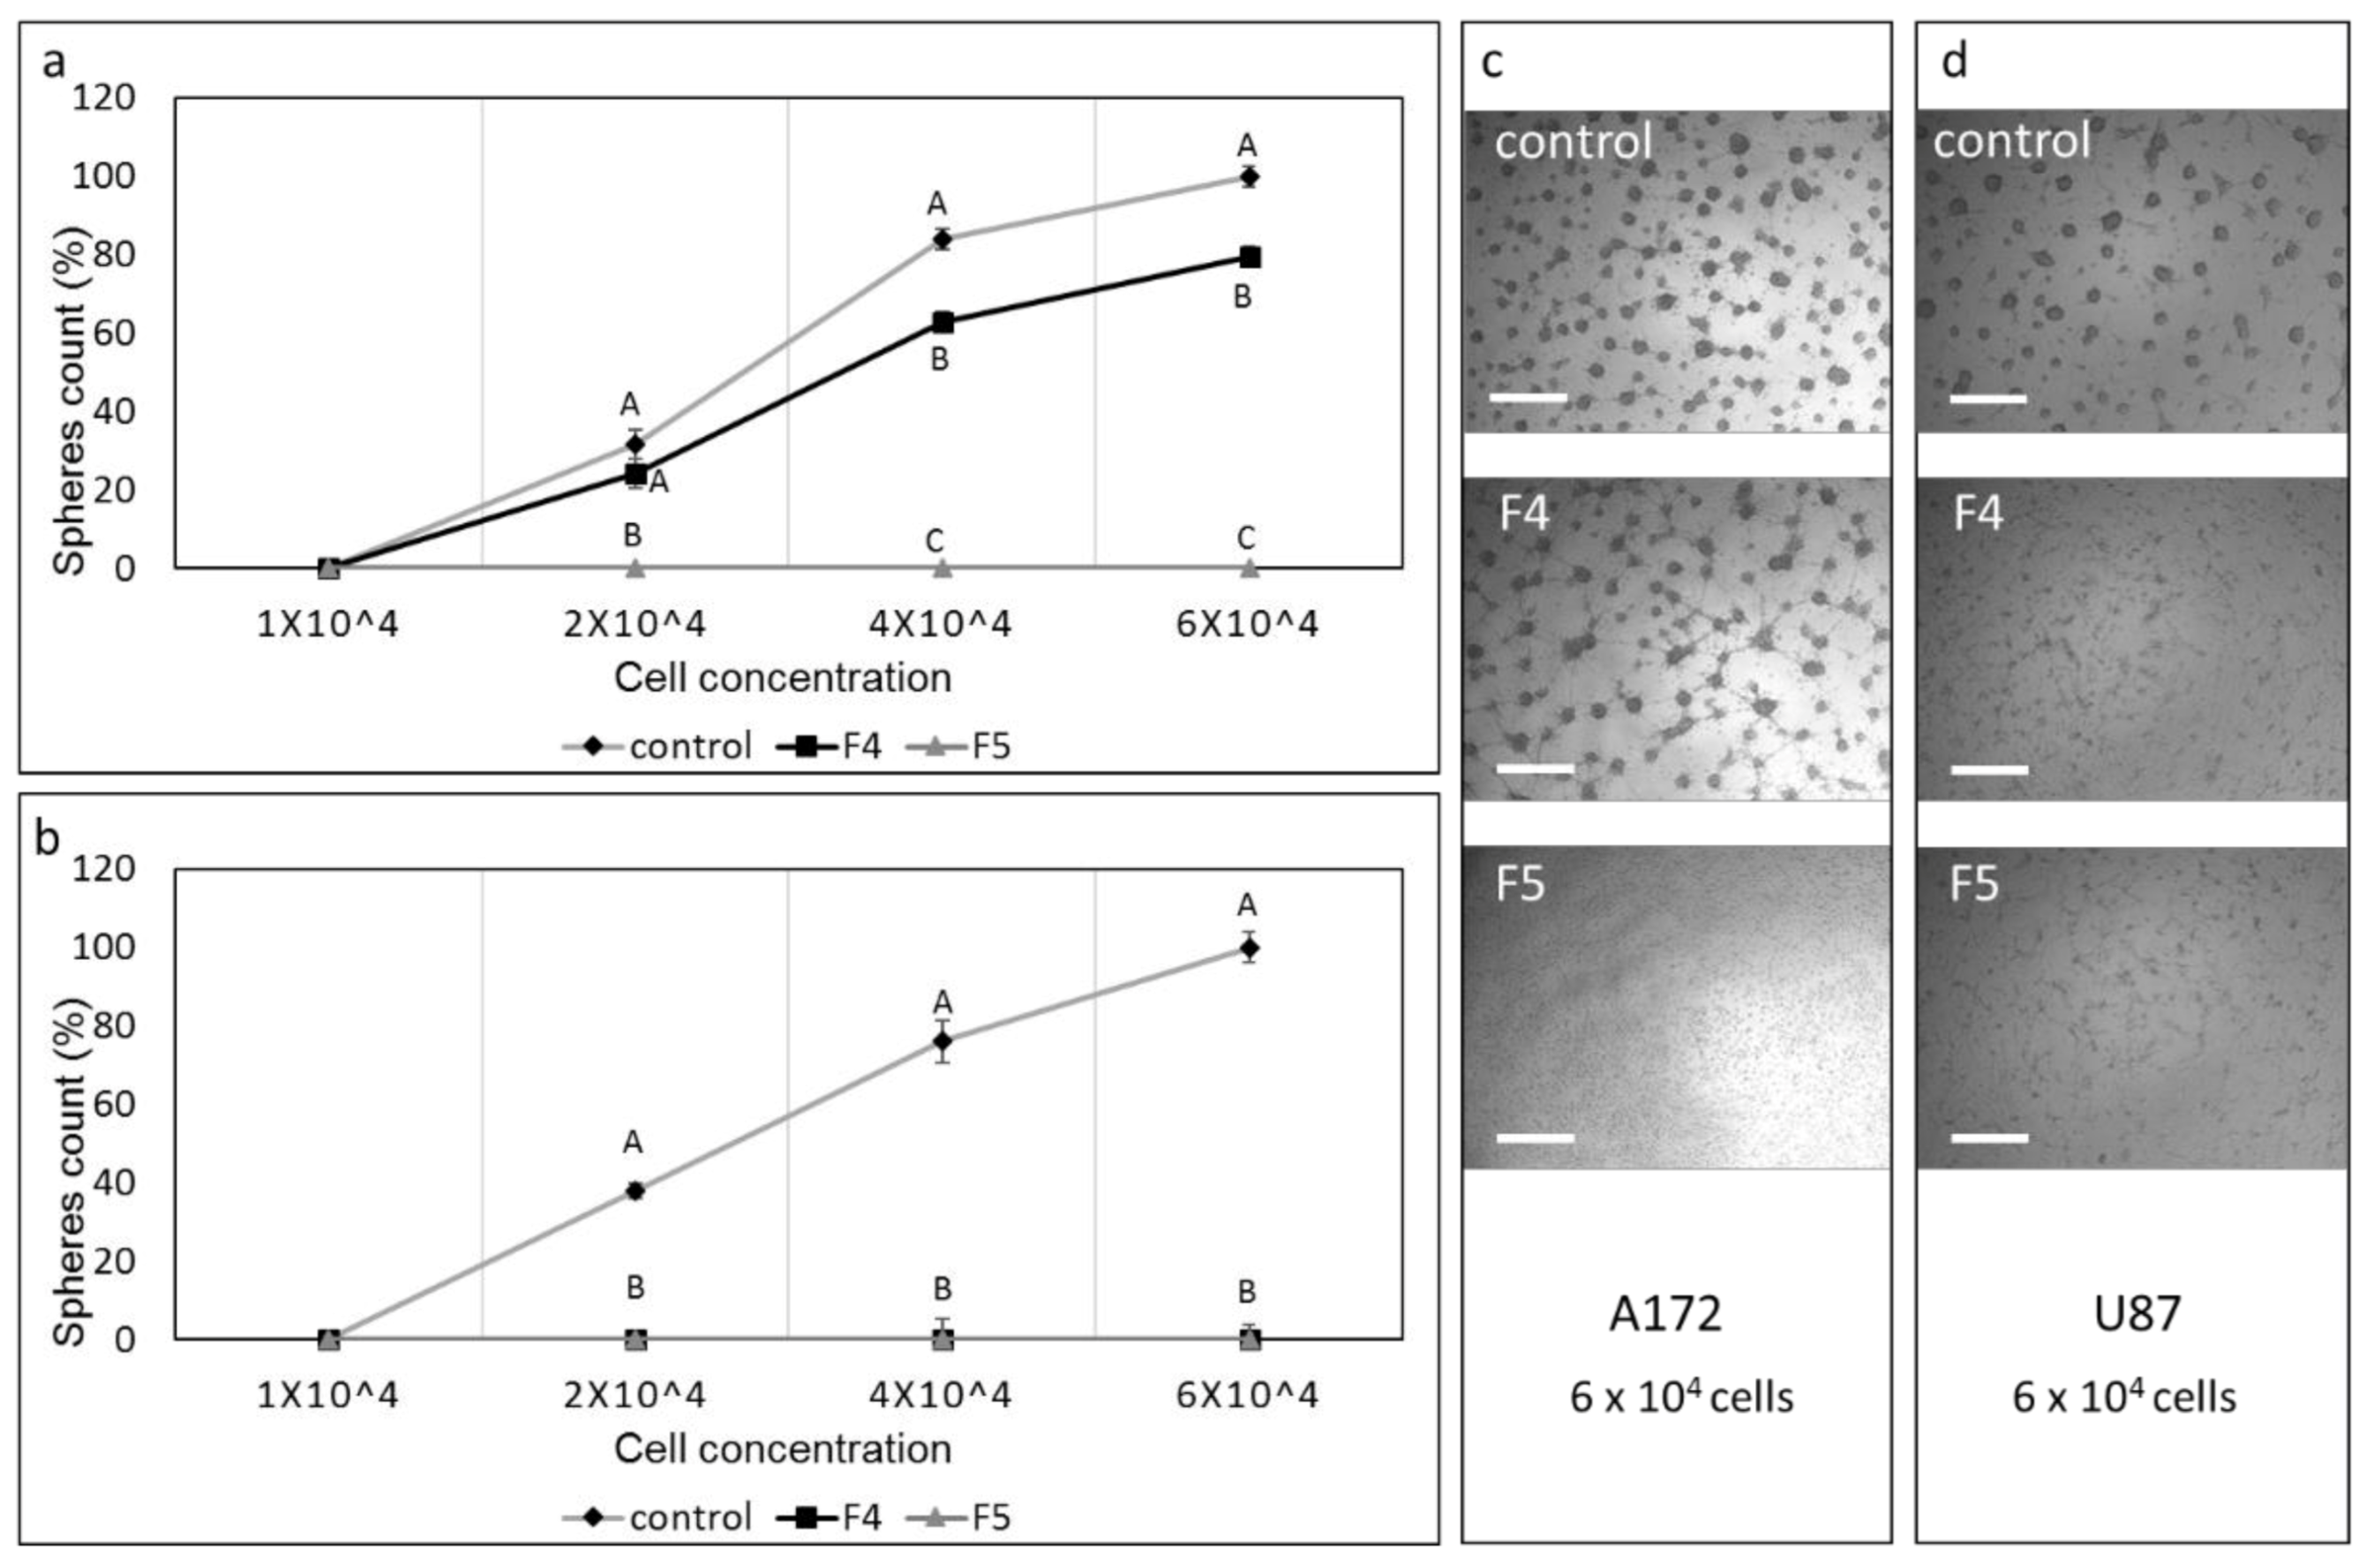
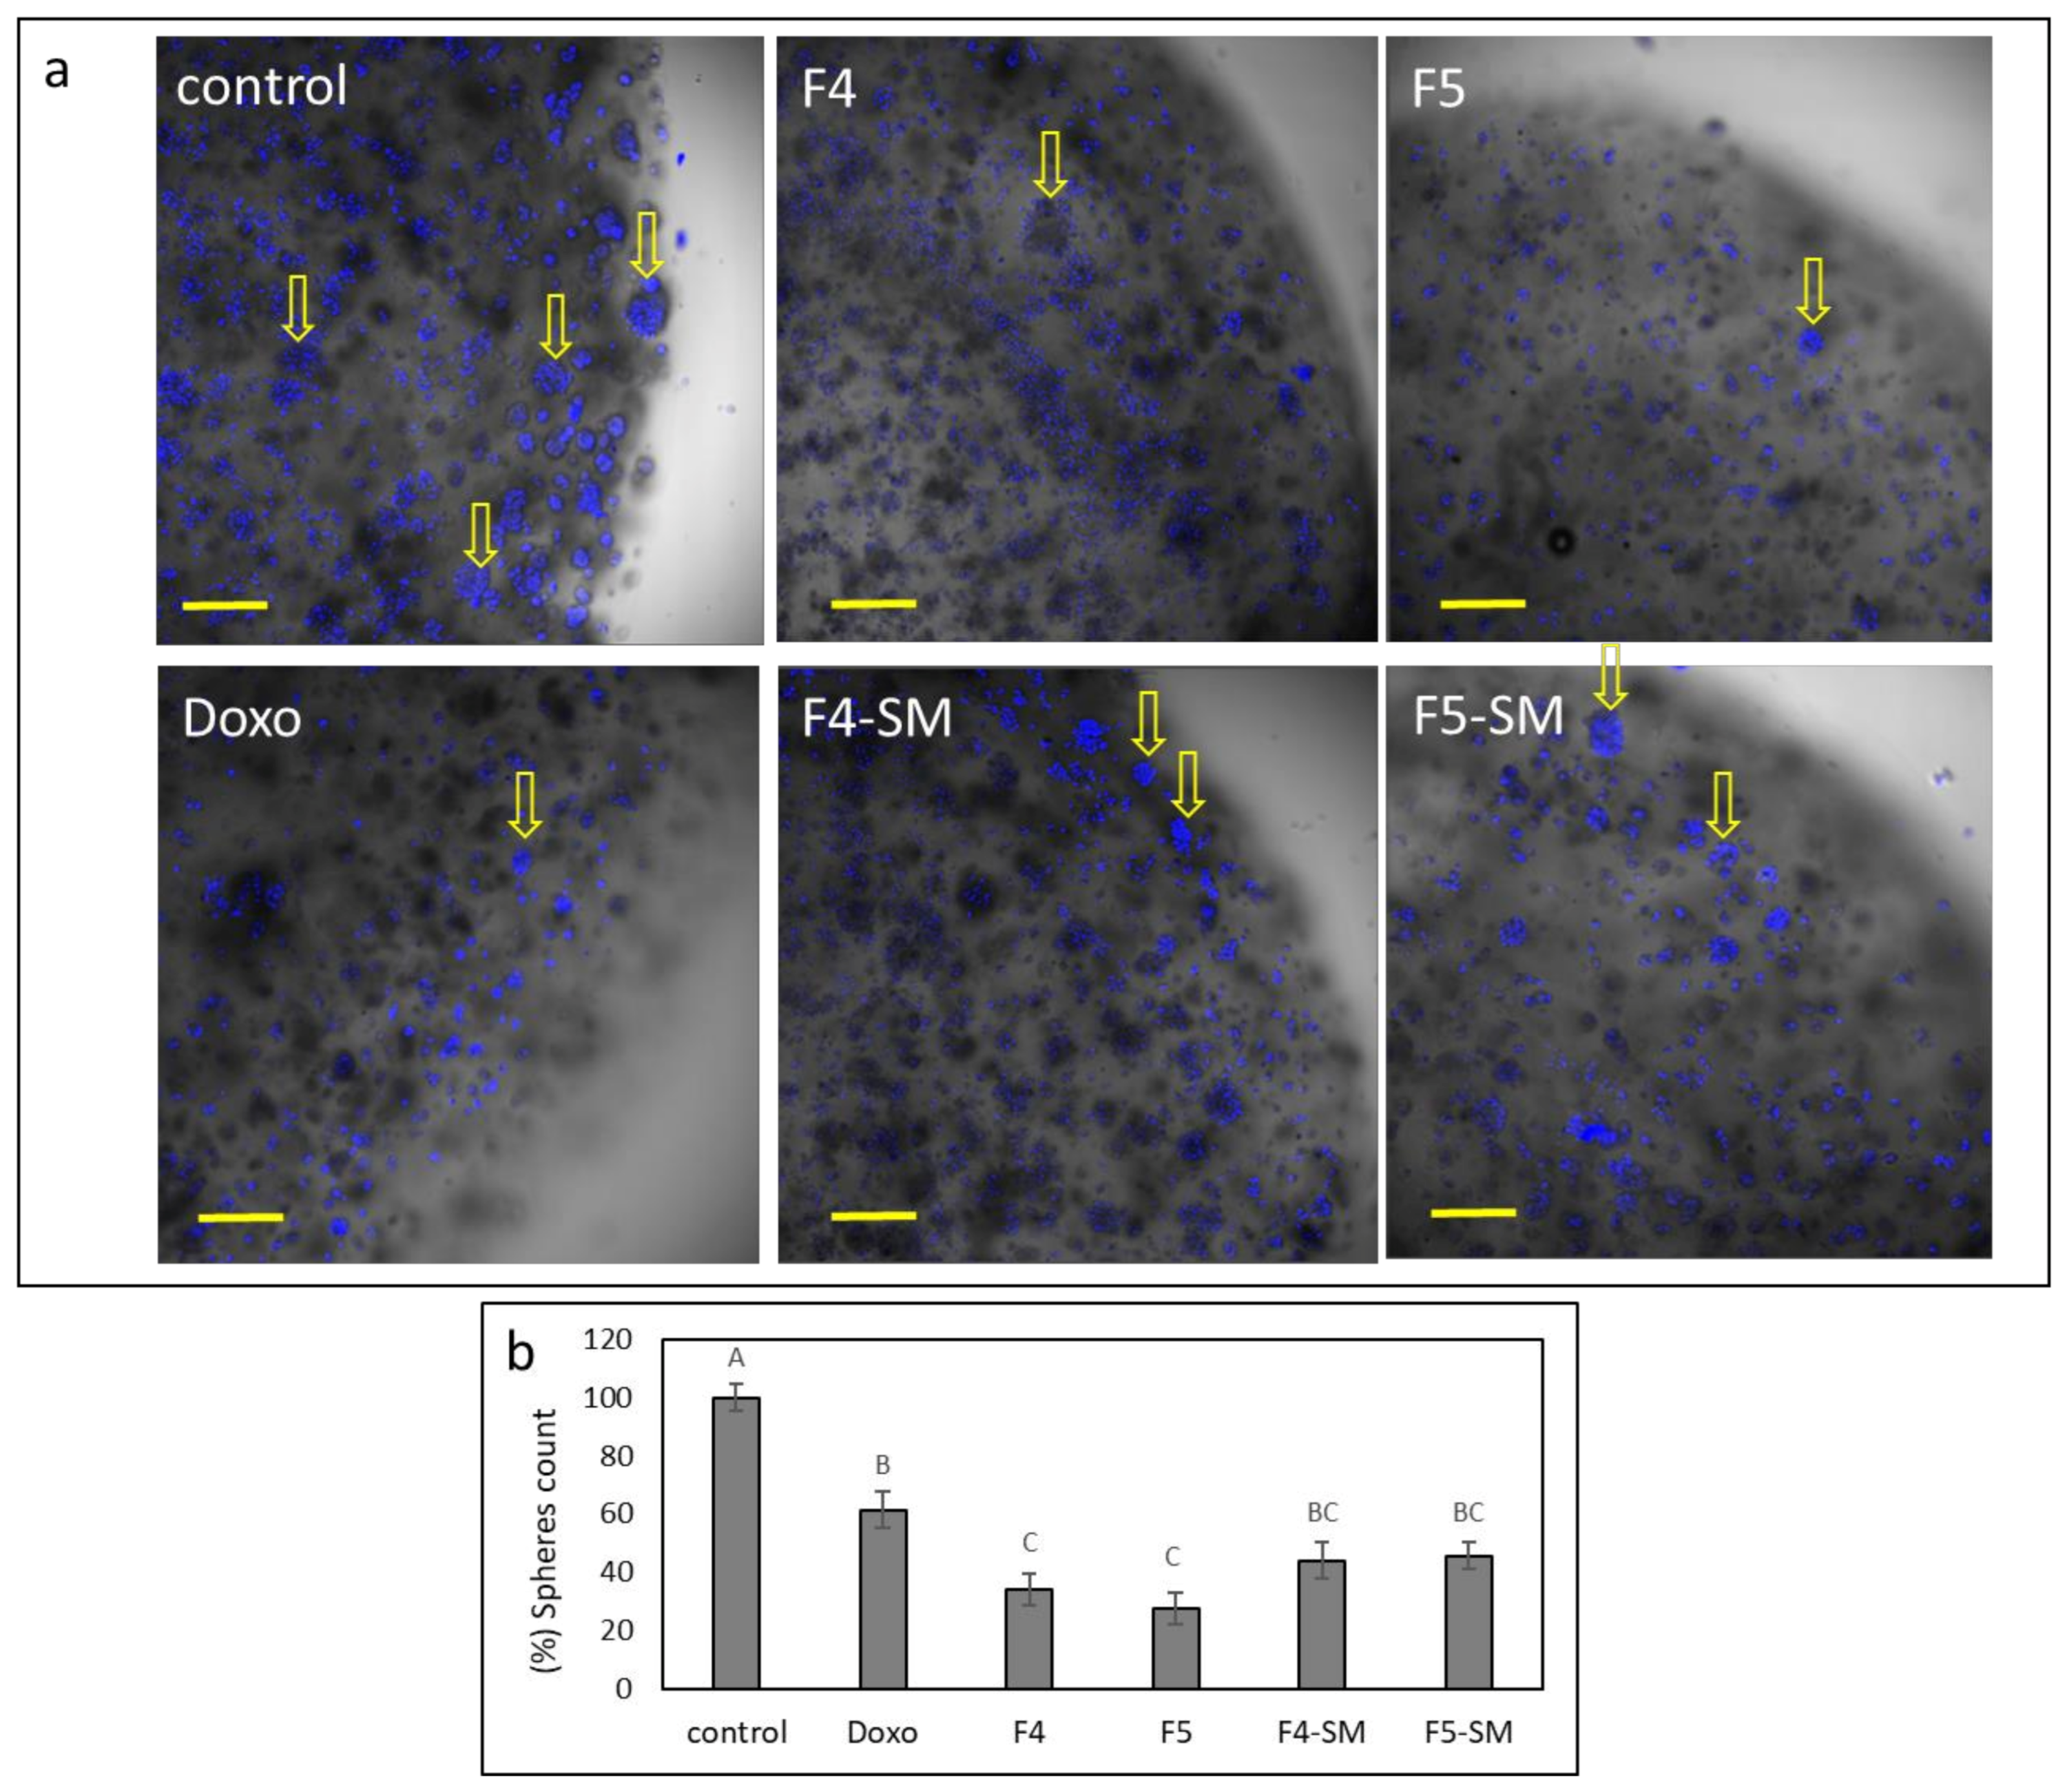
3.13. Determination of the Effect of Fractions or SM Treatments on Colony Formation in 3D Structures
4. Discussion
5. Conclusions
Supplementary Materials
Author Contributions
Funding
Institutional Review Board Statement
Informed Consent Statement
Data Availability Statement
Acknowledgments
Conflicts of Interest
References
- Louis, D.N.; Ohgaki, H.; Wiestler, O.D.; Cavenee, W.K.; Burger, P.C.; Jouvet, A.; Scheithauer, B.W.; Kleihues, P. The 2007 WHO classification of tumours of the central nervous system. Acta Neuropathol. 2007, 114, 97–109. [Google Scholar] [CrossRef] [PubMed]
- Louis, D.N.; Perry, A.; Reifenberger, G.; Von Deimling, A.; Figarella-Branger, D.; Cavenee, W.K.; Ohgaki, H.; Wiestler, O.D.; Kleihues, P.; Ellison, D.W. The 2016 World Health Organization classification of tumors of the central nervous system: A summary. Acta Neuropathol. 2016, 131, 803–820. [Google Scholar] [CrossRef] [PubMed]
- Fernandes, C.; Costa, A.; Osório, L.; Lago, R.C.; Linhares, P.; Carvalho, B.; Caeiro, C. Current standards of care in glioblastoma therapy. Exon Publ. 2017, 197–241. [Google Scholar]
- Singh, S.K.; Clarke, I.D.; Terasaki, M.; Bonn, V.E.; Hawkins, C.; Squire, J.; Dirks, P.B. Identification of a cancer stem cell in human brain tumors. Cancer Res. 2003, 63, 5821–5828. [Google Scholar]
- Lathia, J.D.; Mack, S.C.; Mulkearns-Hubert, E.E.; Valentim, C.L.; Rich, J.N. Cancer stem cells in glioblastoma. Genes Dev. 2015, 29, 1203–1217. [Google Scholar] [CrossRef]
- Perazzoli, G.; Prados, J.; Ortiz, R.; Caba, O.; Cabeza, L.; Berdasco, M.; Gónzalez, B.; Melguizo, C. Temozolomide resistance in glioblastoma cell lines: Implication of MGMT, MMR, P-glycoprotein and CD133 expression. PLoS ONE 2015, 10, e0140131. [Google Scholar] [CrossRef]
- Corroon, J.; Sexton, M.; Bradley, R. Indications and administration practices amongst medical cannabis healthcare providers: A cross-sectional survey. BMC Fam. Pract. 2019, 20, 1–12. [Google Scholar] [CrossRef]
- Hanuš, L.O.; Meyer, S.M.; Muñoz, E.; Taglialatela-Scafati, O.; Appendino, G. Phytocannabinoids: A unified critical inventory. Nat. Prod. Rep. 2016, 33, 1357–1392. [Google Scholar] [CrossRef]
- ElSohly, M.A.; Radwan, M.M.; Gul, W.; Chandra, S.; Galal, A. Phytochemistry of Cannabis sativa L. Phytocannabinoids 2017, 1–36. [Google Scholar] [CrossRef]
- Aizpurua-Olaizola, O.; Soydaner, U.; Öztürk, E.; Schibano, D.; Simsir, Y.; Navarro, P.; Etxebarria, N.; Usobiaga, A. Evolution of the cannabinoid and terpene content during the growth of Cannabis sativa plants from different chemotypes. J. Nat. Prod. 2016, 79, 324–331. [Google Scholar] [CrossRef]
- Ramer, R.; Hinz, B. Cannabinoids as anticancer drugs. In Advances in Pharmacology 80; Kendall, D., Alexander, S.P.H., Eds.; Elsevier Academic Press: Cambridge, MA, USA, 2017; pp. 397–436. [Google Scholar]
- Baram, L.; Peled, E.; Berman, P.; Yellin, B.; Besser, E.; Benami, M.; Louria-Hayon, I.; Lewitus, G.M.; Meiri, D. The heterogeneity and complexity of Cannabis extracts as antitumor agents. Oncotarget 2019, 10, 4091. [Google Scholar] [CrossRef] [PubMed]
- Velasco, G.; Sánchez, C.; Guzmán, M. Towards the use of cannabinoids as antitumour agents. Nat. Rev. Cancer 2012, 12, 436–444. [Google Scholar] [CrossRef] [PubMed]
- Ellert-Miklaszewska, A.; Ciechomska, I.A.; Kaminska, B. Cannabinoid signaling in glioma cells. Glioma Signal. 2020, 223–241. [Google Scholar] [CrossRef]
- Dumitru, C.A.; Sandalcioglu, I.E.; Karsak, M. Cannabinoids in glioblastoma therapy: New applications for old drugs. Front. Mol. Neurosci. 2018, 11, 159. [Google Scholar] [CrossRef]
- Hernández-Tiedra, S.; Fabrias, G.; Dávila, D.; Salanueva, I.J.; Casas, J.; Montes, L.R.; Anton, Z.; Garcia-Taboada, E.; Salazar-Roa, M.; Lorente, M. Dihydroceramide accumulation mediates cytotoxic autophagy of cancer cells via autolysosome destabilization. Autophagy 2016, 12, 2213–2229. [Google Scholar] [CrossRef]
- Salazar, M.; Carracedo, A.; Salanueva, Í.J.; Hernández-Tiedra, S.; Lorente, M.; Egia, A.; Vázquez, P.; Blázquez, C.; Torres, S.; García, S. Cannabinoid action induces autophagy-mediated cell death through stimulation of ER stress in human glioma cells. J. Clin. Invest. 2009, 119, 1359–1372. [Google Scholar] [CrossRef]
- Luís, Â.; Marcelino, H.; Rosa, C.; Domingues, F.; Pereira, L.; Cascalheira, J.F. The effects of cannabinoids on glioblastoma growth: A systematic review with meta-analysis of animal model studies. Eur. J. Pharmacol. 2020, 876, 173055. [Google Scholar] [CrossRef]
- Galanti, G.; Fisher, T.; Kventsel, I.; Shoham, J.; Gallily, R.; Mechoulam, R.; Lavie, G.; Amariglio, N.; Rechavi, G.; Toren, A. Δ9-Tetrahydrocannabinol inhibits cell cycle progression by downregulation of E2F1 in human glioblastoma multiforme cells. Acta Oncol. 2008, 47, 1062–1070. [Google Scholar] [CrossRef]
- Marcu, J.P.; Christian, R.T.; Lau, D.; Zielinski, A.J.; Horowitz, M.P.; Lee, J.; Pakdel, A.; Allison, J.; Limbad, C.; Moore, D.H. Cannabidiol enhances the inhibitory effects of Δ9-tetrahydrocannabinol on human glioblastoma cell proliferation and survival. Mol. Cancer Ther. 2010, 9, 180–189. [Google Scholar] [CrossRef]
- Solinas, M.; Massi, P.; Cinquina, V.; Valenti, M.; Bolognini, D.; Gariboldi, M.; Monti, E.; Rubino, T.; Parolaro, D. Cannabidiol, a non-psychoactive cannabinoid compound, inhibits proliferation and invasion in U87-MG and T98G glioma cells through a multitarget effect. PLoS ONE 2013, 8, e76918. [Google Scholar] [CrossRef] [PubMed]
- Lah, T.T.; Novak, M.; Pena Almidon, M.A.; Marinelli, O.; Žvar Baškovič, B.; Majc, B.; Mlinar, M.; Bošnjak, R.; Breznik, B.; Zomer, R. Cannabigerol is a potential therapeutic agent in a novel combined therapy for glioblastoma. Cells 2021, 10, 340. [Google Scholar] [CrossRef]
- Guzman, M.; Duarte, M.; Blazquez, C.; Ravina, J.; Rosa, M.; Galve-Roperh, I.; Sánchez, C.; Velasco, G.; González-Feria, L. A pilot clinical study of Δ 9-tetrahydrocannabinol in patients with recurrent glioblastoma multiforme. Br. J. Cancer 2006, 95, 197–203. [Google Scholar] [CrossRef]
- Torres, S.; Lorente, M.; Rodríguez-Fornés, F.; Hernández-Tiedra, S.; Salazar, M.; García-Taboada, E.; Barcia, J.; Guzmán, M.; Velasco, G. A combined preclinical therapy of cannabinoids and temozolomide against glioma. Mol. Cancer Ther. 2011, 10, 90–103. [Google Scholar] [CrossRef]
- Schultz, S.; Beyer, M. GW Pharmaceuticals Achieves Positive Results in Phase 2 Proof of Concept Study in Glioma. 2017. Available online: http://ir.gwpharm.com/static-files/cde942fe-555c-4b2f-9cc9-f34d24c7ad2 (accessed on 1 February 2021).
- Russo, E. Taming THC: Potential cannabis synergy and phytocannabinoid-terpenoid entourage effects. Br. J. Pharmacol. 2011, 163, 1344–1364. [Google Scholar] [CrossRef]
- Russo, E.B. The case for the entourage effect and conventional breeding of clinical cannabis: No “strain,” no gain. Front. Plant Sci. 2019, 9, 1969. [Google Scholar] [CrossRef]
- Koltai, H.; Namdar, D. Cannabis phytomolecule ‘entourage’: From domestication to medical use. Trends Plant Sci. 2020, 10, 976–984. [Google Scholar] [CrossRef]
- Mazuz, M.; Tiroler, A.; Moyal, L.; Hodak, E.; Nadarajan, S.; Vinayaka, A.C.; Gorovitz-Haris, B.; Lubin, I.; Drori, A.; Drori, G.; et al. Synergistic cytotoxic activity of cannabinoids from cannabis sativa against cutaneous T-cell lymphoma (CTCL) in-vitro and ex-vivo. Oncotarget 2020, 11, 1141. [Google Scholar] [CrossRef]
- Jiang, W.; Finniss, S.; Cazacu, S.; Xiang, C.; Brodie, Z.; Mikkelsen, T.; Poisson, L.; Shackelford, D.B.; Brodie, C. Repurposing phenformin for the targeting of glioma stem cells and the treatment of glioblastoma. Oncotarget 2016, 7, 56456. [Google Scholar] [CrossRef]
- Giladi, N.D.; Ziv-Av, A.; Lee, H.K.; Finniss, S.; Cazacu, S.; Xiang, C.; Ben-Asher, H.W.; Decarvalho, A.; Mikkelsen, T.; Poisson, L. RTVP-1 promotes mesenchymal transformation of glioma via a STAT-3/IL-6-dependent positive feedback loop. Oncotarget 2015, 6, 22680. [Google Scholar] [CrossRef]
- Kazimirsky, G.; Jiang, W.; Slavin, S.; Ziv-Av, A.; Brodie, C. Mesenchymal stem cells enhance the oncolytic effect of Newcastle disease virus in glioma cells and glioma stem cells via the secretion of TRAIL. Stem Cell Res. Ther. 2016, 7, 1–10. [Google Scholar] [CrossRef]
- Singec, I.; Knoth, R.; Meyer, R.P.; Maciaczyk, J.; Volk, B.; Nikkhah, G.; Frotscher, M.; Snyder, E.Y. Defining the actual sensitivity and specificity of the neurosphere assay in stem cell biology. Nat. Methods 2006, 3, 801–806. [Google Scholar] [CrossRef] [PubMed]
- Gopinath, S.; Vanamala, S.K.; Gujrati, M.; Klopfenstein, J.D.; Dinh, D.H.; Rao, J.S. Doxorubicin-mediated apoptosis in glioma cells requires NFAT3. Cell. Mol. Life Sci. 2009, 66, 3967–3978. [Google Scholar] [CrossRef] [PubMed]
- Namdar, D.; Anis, O.; Poulin, P.; Koltai, H. Chronological review and rational and future prospects of cannabis-based drug development. Molecules 2020, 25, 4821. [Google Scholar] [CrossRef] [PubMed]
- Tomko, A.M.; Whynot, E.G.; Ellis, L.D.; Dupré, D.J. Anti-cancer potential of cannabinoids, terpenes, and flavonoids present in cannabis. Cancers 2020, 12, 1985. [Google Scholar] [CrossRef]
- Hart, S.; Fischer, O.M.; Ullrich, A. Cannabinoids induce cancer cell proliferation via tumor necrosis factor α-converting enzyme (TACE/ADAM17)-mediated transactivation of the epidermal growth factor receptor. Cancer Res. 2004, 64, 1943–1950. [Google Scholar] [CrossRef]
- Vermeulen, K.; Berneman, Z.N.; Van Bockstaele, D.R. Cell cycle and apoptosis. Cell Prolif. 2003, 36, 165–175. [Google Scholar] [CrossRef]
- Iurlaro, R.; Muñoz-Pinedo, C. Cell death induced by endoplasmic reticulum stress. FEBS J. 2016, 283, 2640–2652. [Google Scholar] [CrossRef]
- Han, J.; Back, S.H.; Hur, J.; Lin, Y.-H.; Gildersleeve, R.; Shan, J.; Yuan, C.L.; Krokowski, D.; Wang, S.; Hatzoglou, M. ER-stress-induced transcriptional regulation increases protein synthesis leading to cell death. Nat. Cell Biol. 2013, 15, 481–490. [Google Scholar] [CrossRef]
- Fang, N.; Zhang, W.; Xu, S.; Lin, H.; Wang, Z.; Liu, H.; Fang, Q.; Li, C.; Peng, L.; Lou, J. TRIB3 alters endoplasmic reticulum stress-induced β-cell apoptosis via the NF-κB pathway. Metabolism 2014, 63, 822–830. [Google Scholar] [CrossRef]
- Salazar, M.; Carracedo, A.; Salanueva, Í.J.; Hernández-Tiedra, S.; Egia, A.; Lorente, M.; Vázquez, P.; Torres, S.; Iovanna, J.L.; Guzmán, M. TRB3 links ER stress to autophagy in cannabinoid antitumoral action. Autophagy 2009, 5, 1048–1049. [Google Scholar] [CrossRef]
- Ohoka, N.; Yoshii, S.; Hattori, T.; Onozaki, K.; Hayashi, H. TRB3, a novel ER stress-inducible gene, is induced via ATF4–CHOP pathway and is involved in cell death. EMBO J. 2005, 24, 1243–1255. [Google Scholar] [CrossRef]
- Borrelli, F.; Pagano, E.; Romano, B.; Panzera, S.; Maiello, F.; Coppola, D.; De Petrocellis, L.; Buono, L.; Orlando, P.; Izzo, A.A. Colon carcinogenesis is inhibited by the TRPM8 antagonist cannabigerol, a Cannabis-derived non-psychotropic cannabinoid. Carcinogenesis 2014, 35, 2787–2797. [Google Scholar] [CrossRef]
- Izzo, A.A.; Borrelli, F.; Capasso, R.; Di Marzo, V.; Mechoulam, R. Non-psychotropic plant cannabinoids: New therapeutic opportunities from an ancient herb. Trends Pharmacol. Sci. 2009, 30, 515–527. [Google Scholar] [CrossRef]
- New, D.C.; Wong, Y.H. BML-190 and AM251 act as inverse agonists at the human cannabinoid CB2 receptor: Signalling via cAMP and inositol phosphates. FEBS Lett. 2003, 536, 157–160. [Google Scholar] [CrossRef]
- Olson, M.F.; Sahai, E. The actin cytoskeleton in cancer cell motility. Clin. Exp. Metastasis 2009, 26, 273. [Google Scholar] [CrossRef]
- Memmel, S.; Sisario, D.; Zöller, C.; Fiedler, V.; Katzer, A.; Heiden, R.; Becker, N.; Eing, L.; Ferreira, F.L.; Zimmermann, H. Migration pattern, actin cytoskeleton organization and response to PI3K-, mTOR-, and Hsp90-inhibition of glioblastoma cells with different invasive capacities. Oncotarget 2017, 8, 45298. [Google Scholar] [CrossRef] [PubMed]
- Jacquemet, G.; Hamidi, H.; Ivaska, J. Filopodia in cell adhesion, 3D migration and cancer cell invasion. Curr. Opin. Cell Biol. 2015, 36, 23–31. [Google Scholar] [CrossRef]
- Lukas, R.V.; Wainwright, D.A.; Ladomersky, E.; Sachdev, S.; Sonabend, A.M.; Stupp, R. Newly diagnosed glioblastoma: A review on clinical management. Oncology 2019, 33, 91. [Google Scholar]
- Bush, N.A.O.; Chang, S.M.; Berger, M.S. Current and future strategies for treatment of glioma. Neurosurg. Rev. 2017, 40, 1–14. [Google Scholar] [CrossRef]
- Yuan, X.; Curtin, J.; Xiong, Y.; Liu, G.; Waschsmann-Hogiu, S.; Farkas, D.L.; Black, K.L.; John, S.Y. Isolation of cancer stem cells from adult glioblastoma multiforme. Oncogene 2004, 23, 9392–9400. [Google Scholar] [CrossRef]
- Hong, X.; Chedid, K.; Kalkanis, S.N. Glioblastoma cell line-derived spheres in serum-containing medium versus serum-free medium: A comparison of cancer stem cell properties. Int. J. Oncol. 2012, 41, 1693–1700. [Google Scholar] [CrossRef] [PubMed]
- Kataoka, J.M.R.; Patel, D.J.; Grdina, Y. Cytoprotection by WR-1065, the active form of amifostine, is independent of p53 status in human malignant glioma cell lines. Int. J. Radiat. Biol. 2000, 76, 633–639. [Google Scholar] [CrossRef] [PubMed]
- Altinoz, M.A.; Ucal, Y.; Yilmaz, M.C.; Kiris, İ.; Ozisik, O.; Sezerman, U.; Ozpinar, A.; Elmaci, İ. Progesterone at high doses reduces the growth of U87 and A172 glioblastoma cells: Proteomic changes regarding metabolism and immunity. Cancer Med. 2020, 9, 5767–5780. [Google Scholar] [CrossRef] [PubMed]
- Gallaher, J.A.; Massey, S.C.; Hawkins-Daarud, A.; Noticewala, S.S.; Rockne, R.C.; Johnston, S.K.; Gonzalez-Cuyar, L.; Juliano, J.; Gil, O.; Swanson, K.R. From cells to tissue: How cell scale heterogeneity impacts glioblastoma growth and treatment response. PLoS Comput. Biol. 2020, 16, e1007672. [Google Scholar] [CrossRef]


| Fraction/Compound | CBC | CBD | CBDV | CBDVA | CBG | CBGA | CBN | THC | THCA | THCV |
|---|---|---|---|---|---|---|---|---|---|---|
| Crude | 5.0 | 0.1 | <0.1 | <0.1 | 4.0 | 0.1 | 1.8 | 87.4 | 0.5 | 1.0 |
| F4 | - | 5.8 | - | - | 80.3 | - | 2.8 | - | - | 11 |
| F5 | - | - | - | - | 3.7 | - | 4.6 | 91.7 | - | - |
| F6 | - | - | - | - | 2.2 | - | 0.9 | 96.9 | - | - |
| F7 | 23.5 | - | 1.8 | 0.9 | 1.3 | - | 1.9 | 68.9 | 1.7 | - |
| Treatment | CB2 Receptor (CNR2) Relative Expression |
|---|---|
| F4-SM | 2.32 ± 0.49 |
| F5-SM | 0.47 ± 0.09 |
Publisher’s Note: MDPI stays neutral with regard to jurisdictional claims in published maps and institutional affiliations. |
© 2021 by the authors. Licensee MDPI, Basel, Switzerland. This article is an open access article distributed under the terms and conditions of the Creative Commons Attribution (CC BY) license (https://creativecommons.org/licenses/by/4.0/).
Share and Cite
Peeri, H.; Shalev, N.; Vinayaka, A.C.; Nizar, R.; Kazimirsky, G.; Namdar, D.; Anil, S.M.; Belausov, E.; Brodie, C.; Koltai, H. Specific Compositions of Cannabis sativa Compounds Have Cytotoxic Activity and Inhibit Motility and Colony Formation of Human Glioblastoma Cells In Vitro. Cancers 2021, 13, 1720. https://doi.org/10.3390/cancers13071720
Peeri H, Shalev N, Vinayaka AC, Nizar R, Kazimirsky G, Namdar D, Anil SM, Belausov E, Brodie C, Koltai H. Specific Compositions of Cannabis sativa Compounds Have Cytotoxic Activity and Inhibit Motility and Colony Formation of Human Glioblastoma Cells In Vitro. Cancers. 2021; 13(7):1720. https://doi.org/10.3390/cancers13071720
Chicago/Turabian StylePeeri, Hadar, Nurit Shalev, Ajjampura C. Vinayaka, Rephael Nizar, Gila Kazimirsky, Dvora Namdar, Seegehalli M. Anil, Eduard Belausov, Chaya Brodie, and Hinanit Koltai. 2021. "Specific Compositions of Cannabis sativa Compounds Have Cytotoxic Activity and Inhibit Motility and Colony Formation of Human Glioblastoma Cells In Vitro" Cancers 13, no. 7: 1720. https://doi.org/10.3390/cancers13071720
APA StylePeeri, H., Shalev, N., Vinayaka, A. C., Nizar, R., Kazimirsky, G., Namdar, D., Anil, S. M., Belausov, E., Brodie, C., & Koltai, H. (2021). Specific Compositions of Cannabis sativa Compounds Have Cytotoxic Activity and Inhibit Motility and Colony Formation of Human Glioblastoma Cells In Vitro. Cancers, 13(7), 1720. https://doi.org/10.3390/cancers13071720