
Integrated Metabolomics and Transcriptomics Analysis of Monolayer and Neurospheres from Established Glioblastoma Cell Lines

 , , , , ,
  , and
, and 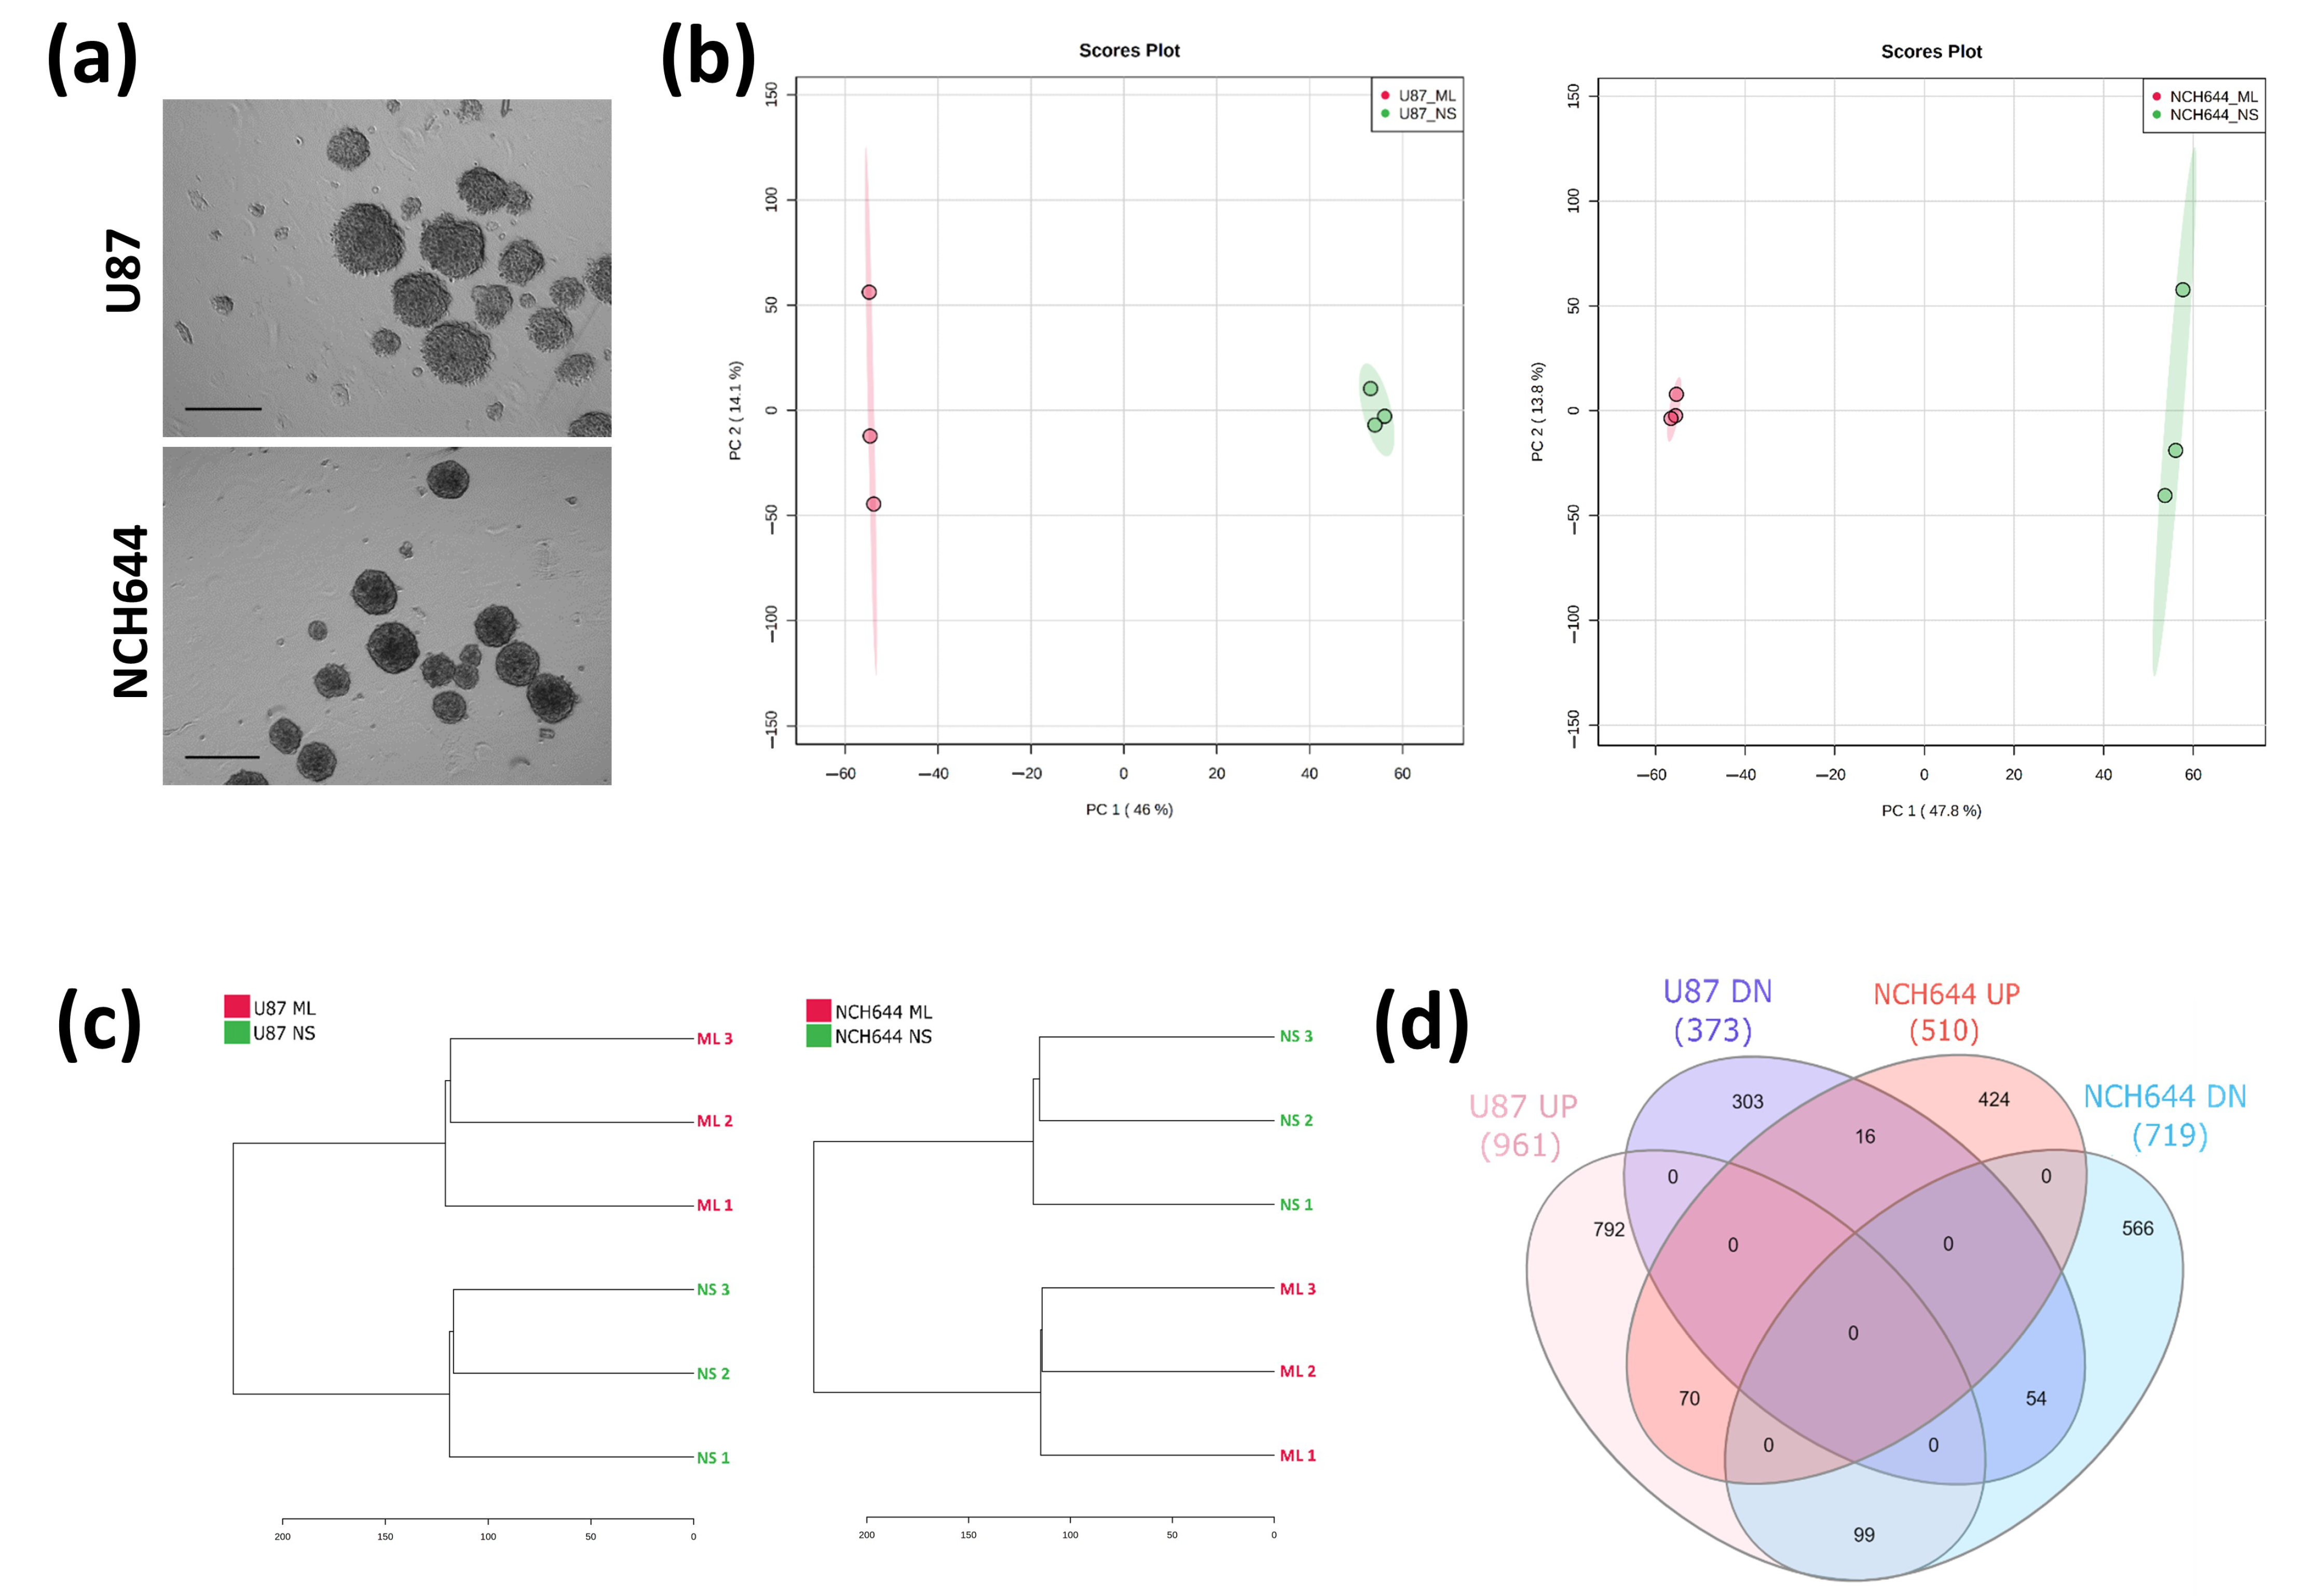
Abstract
Simple Summary
Abstract
1. Introduction
2. Results
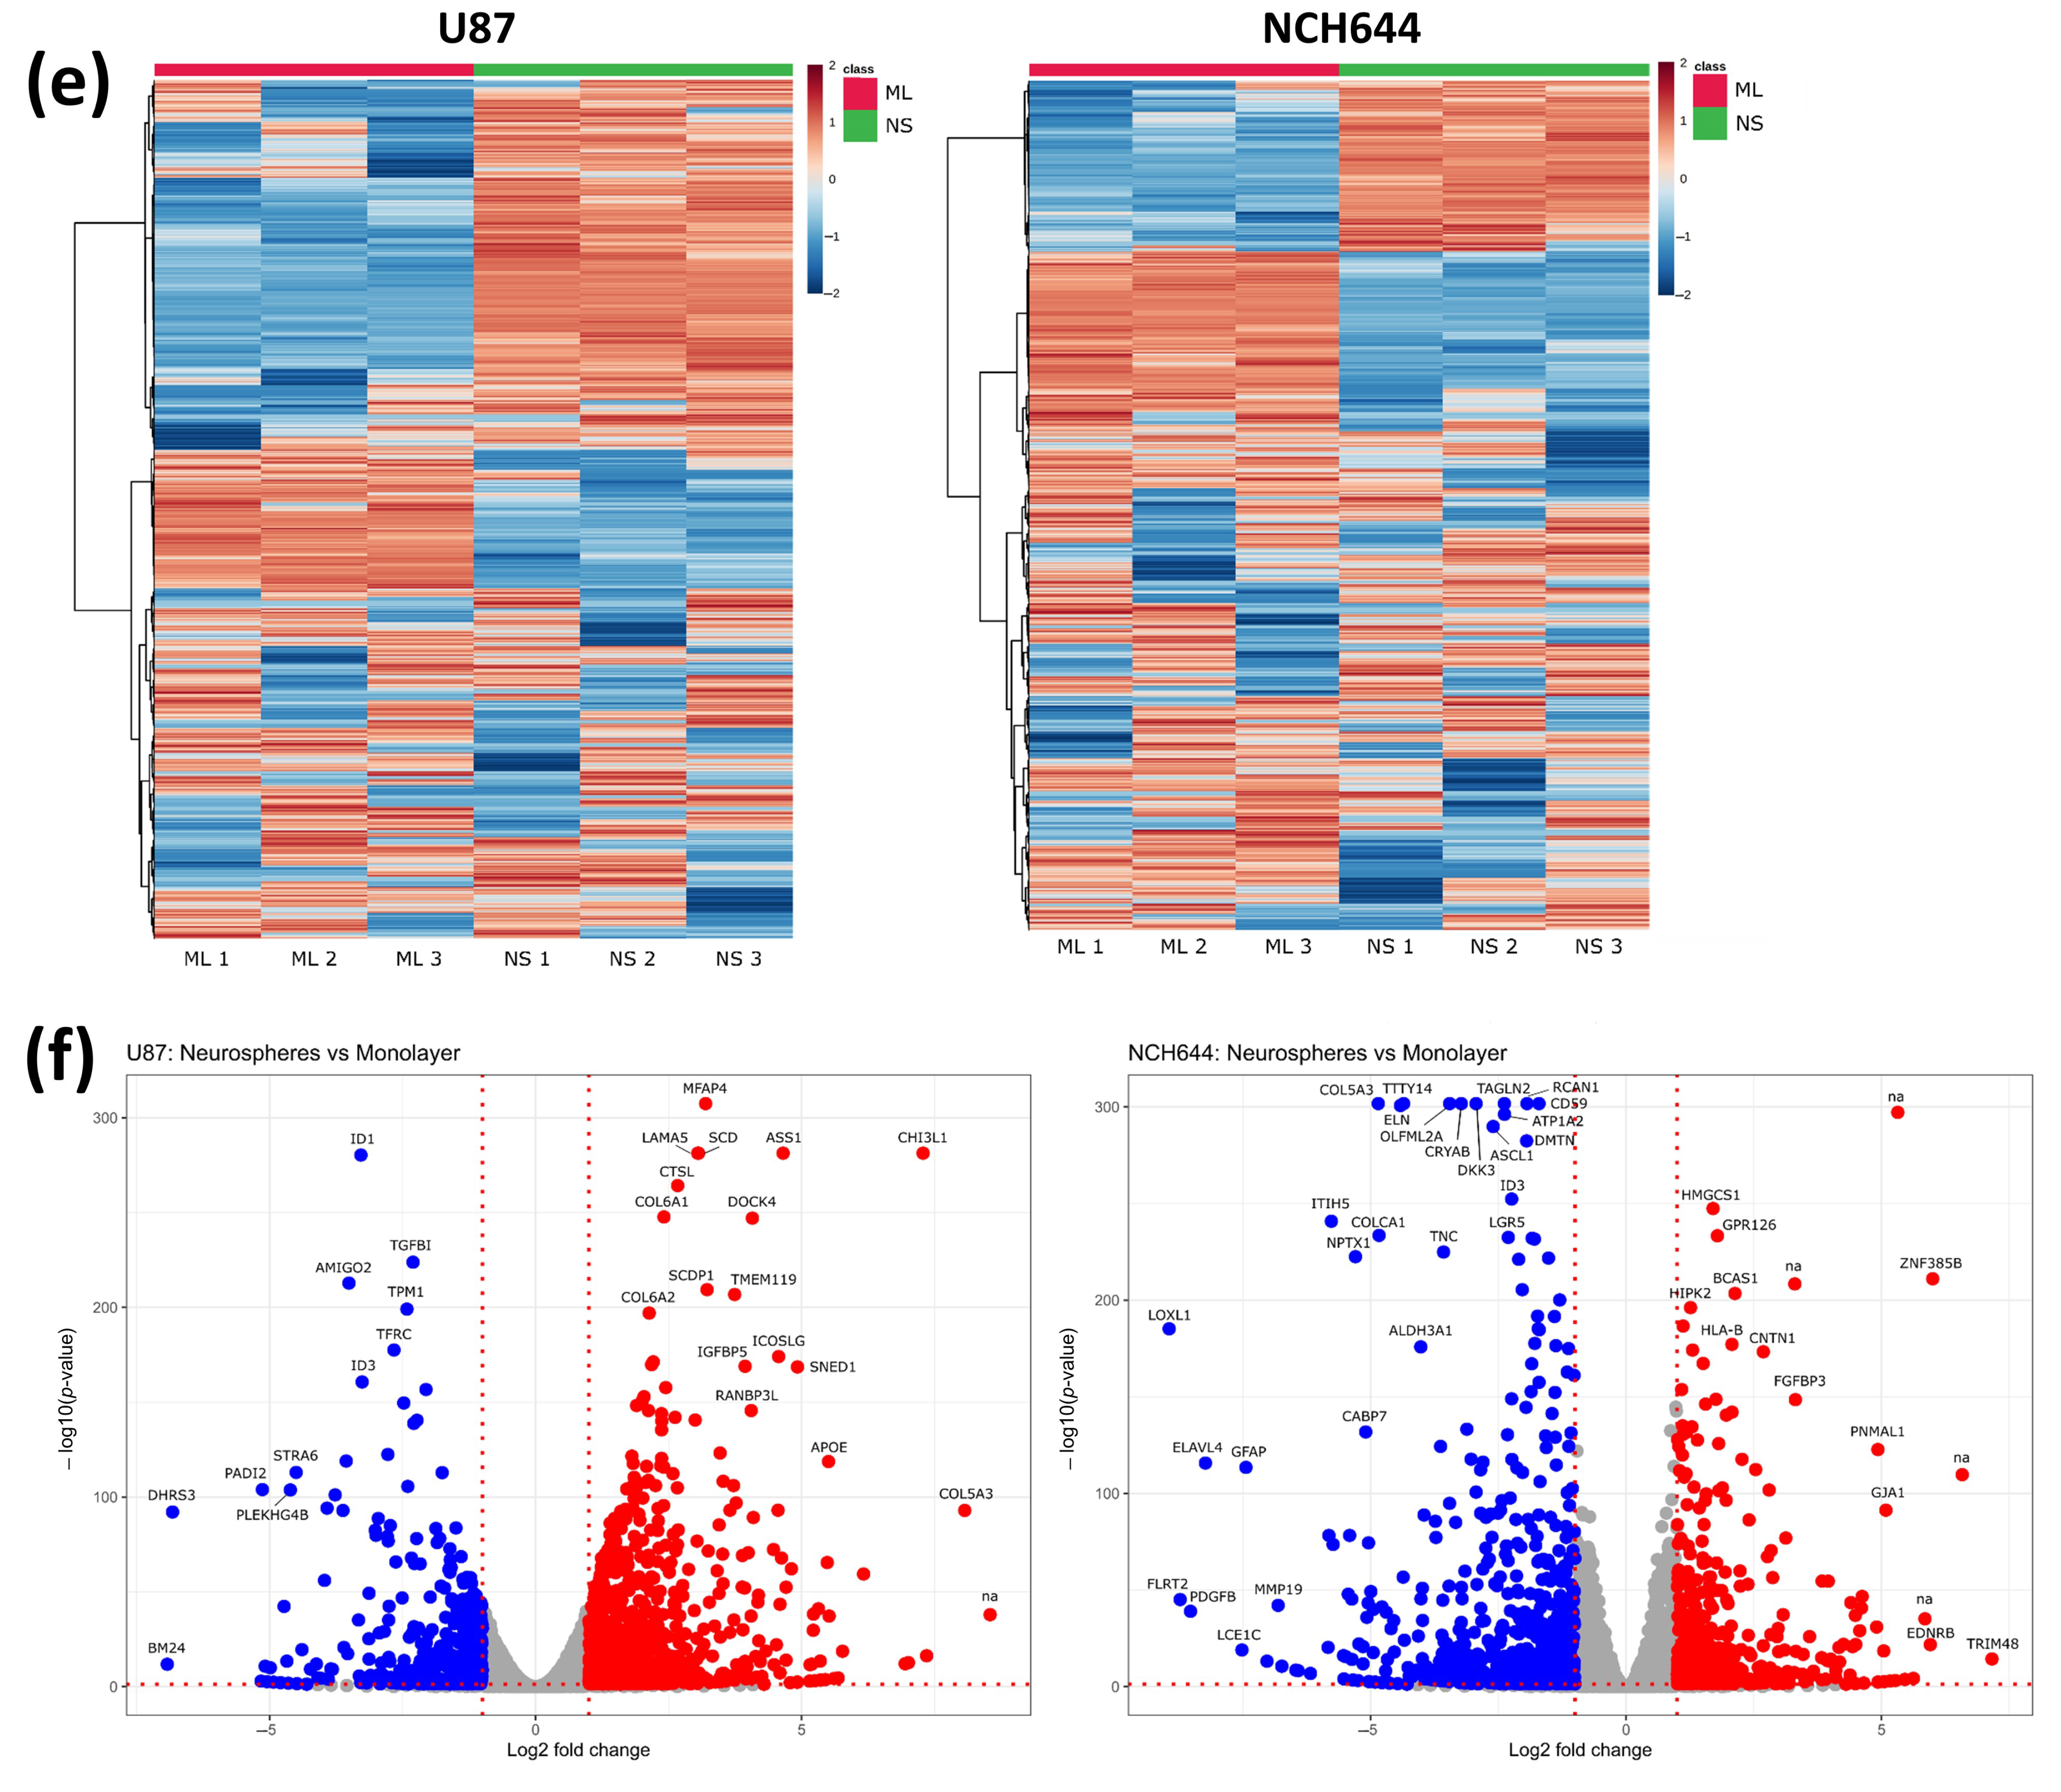
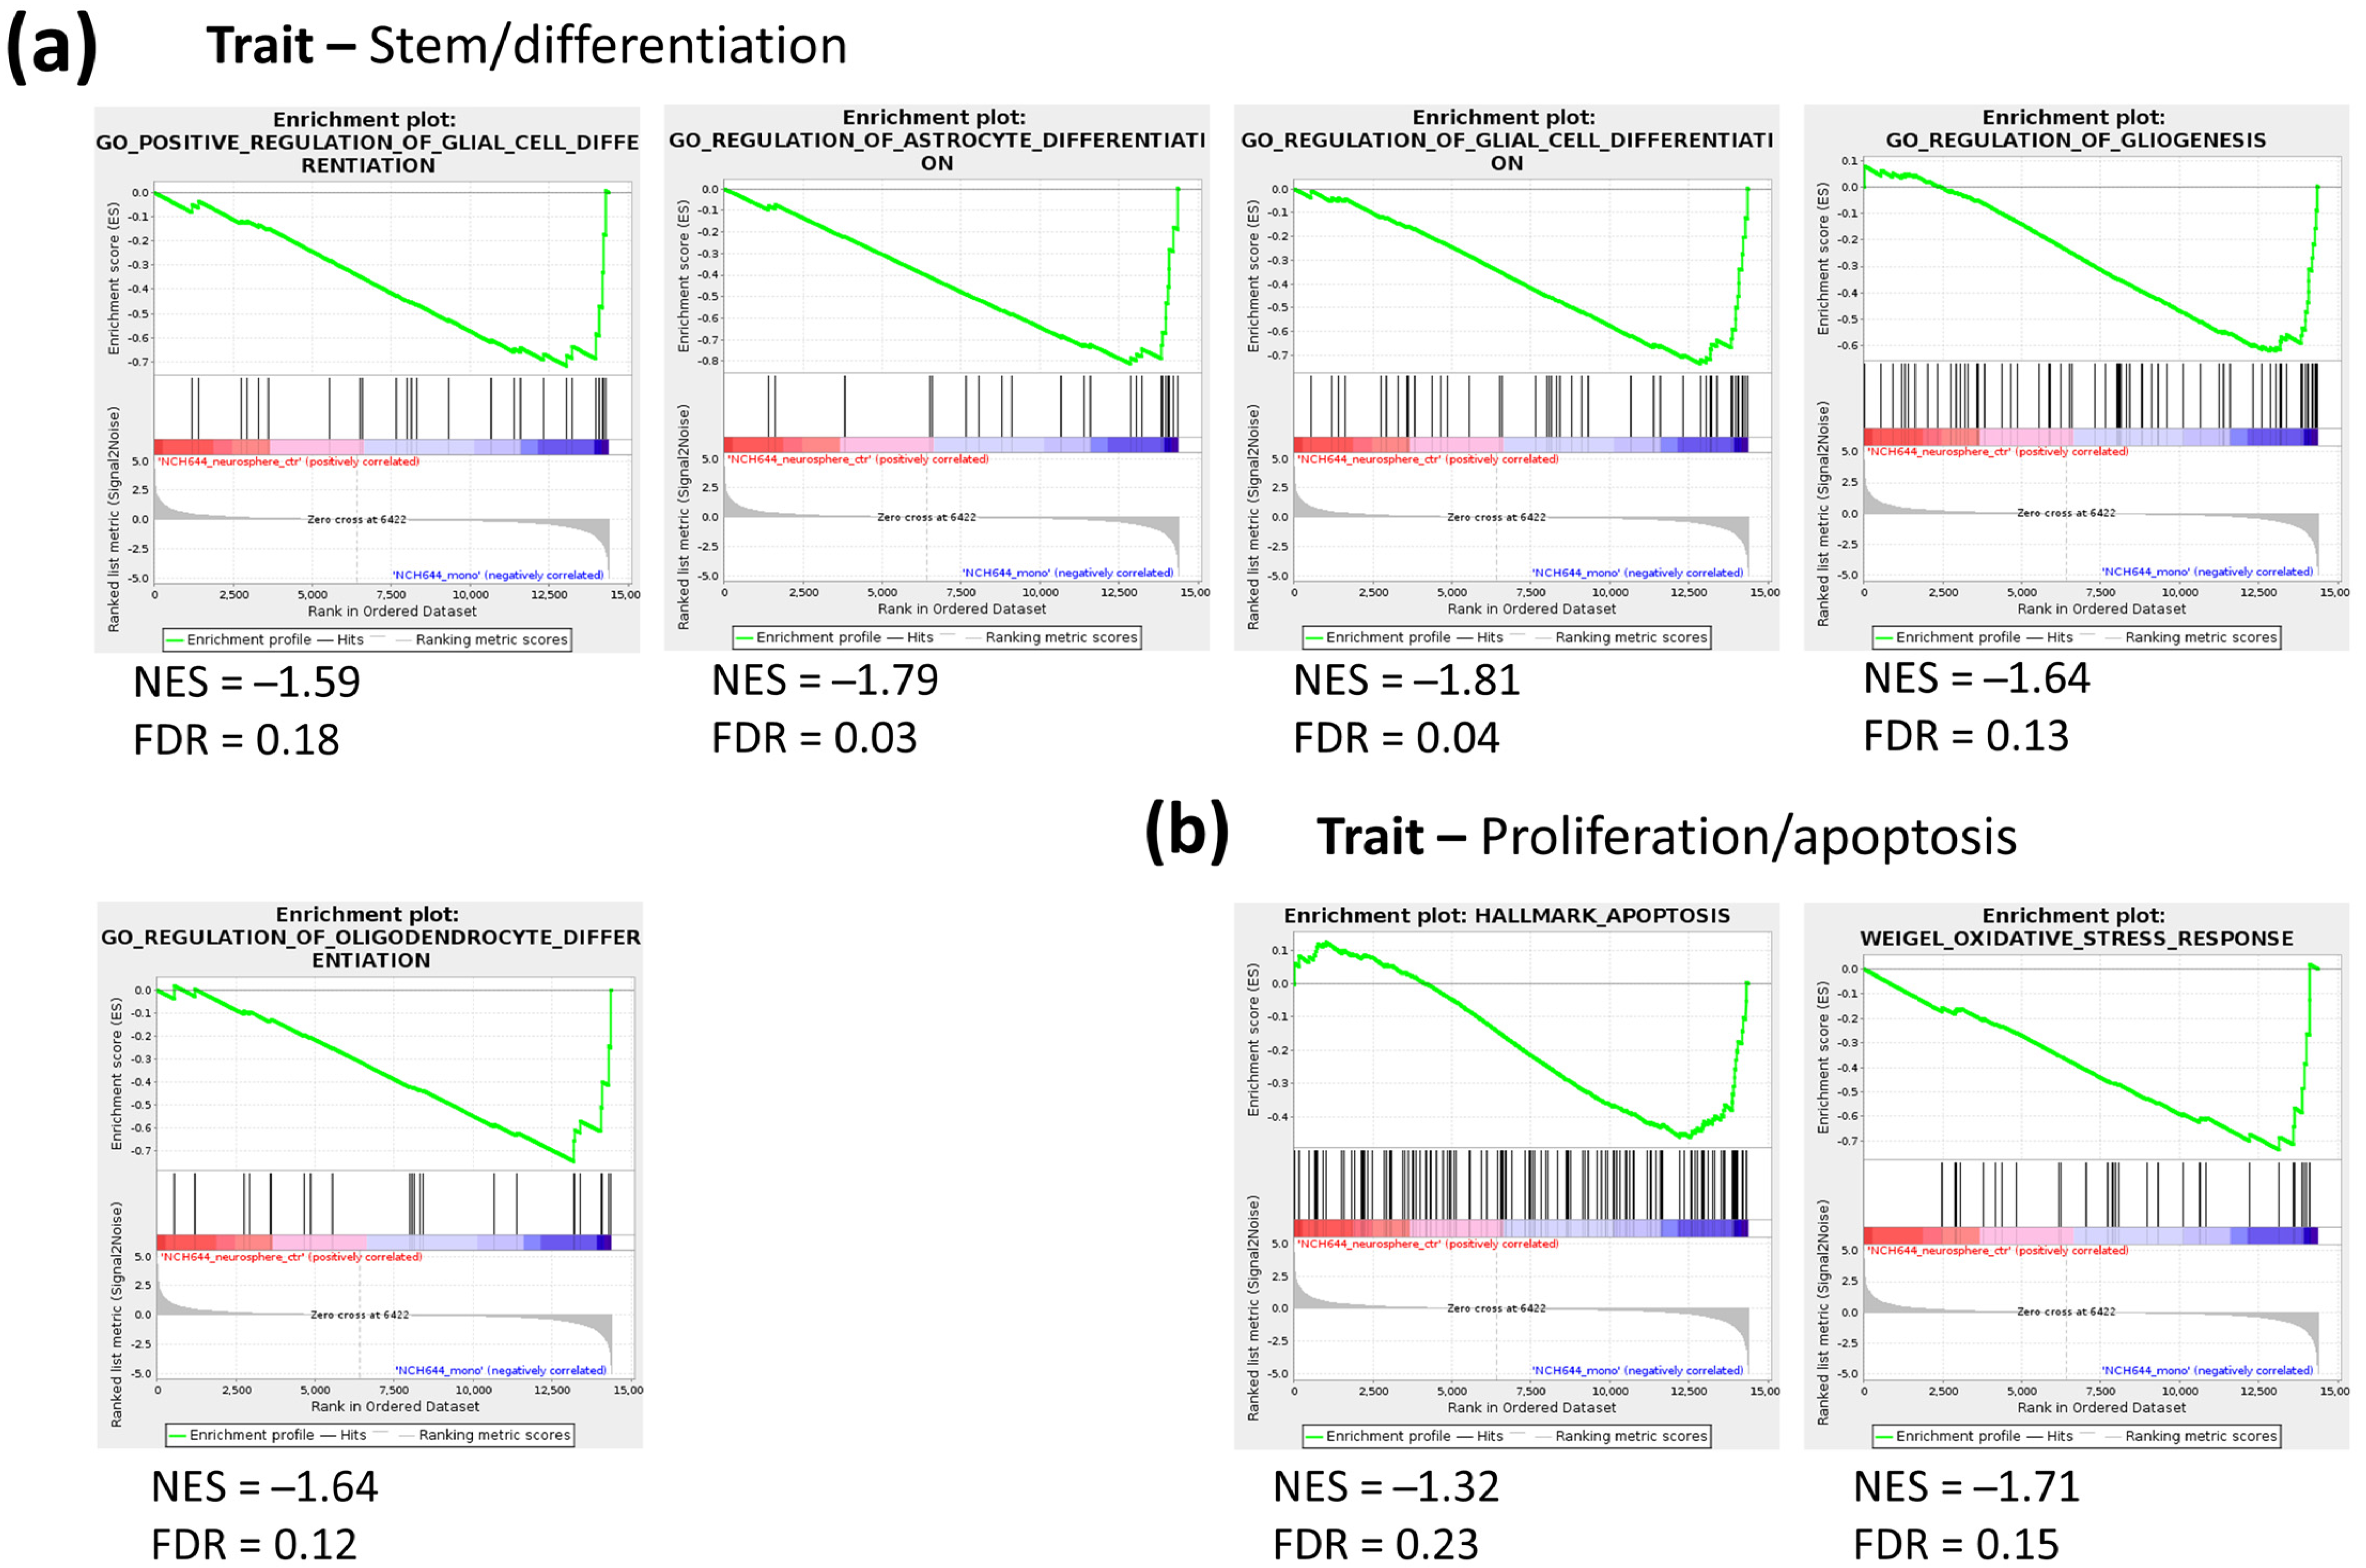
2.1. Transcriptomic Profile of Monolayer and Neurospheres
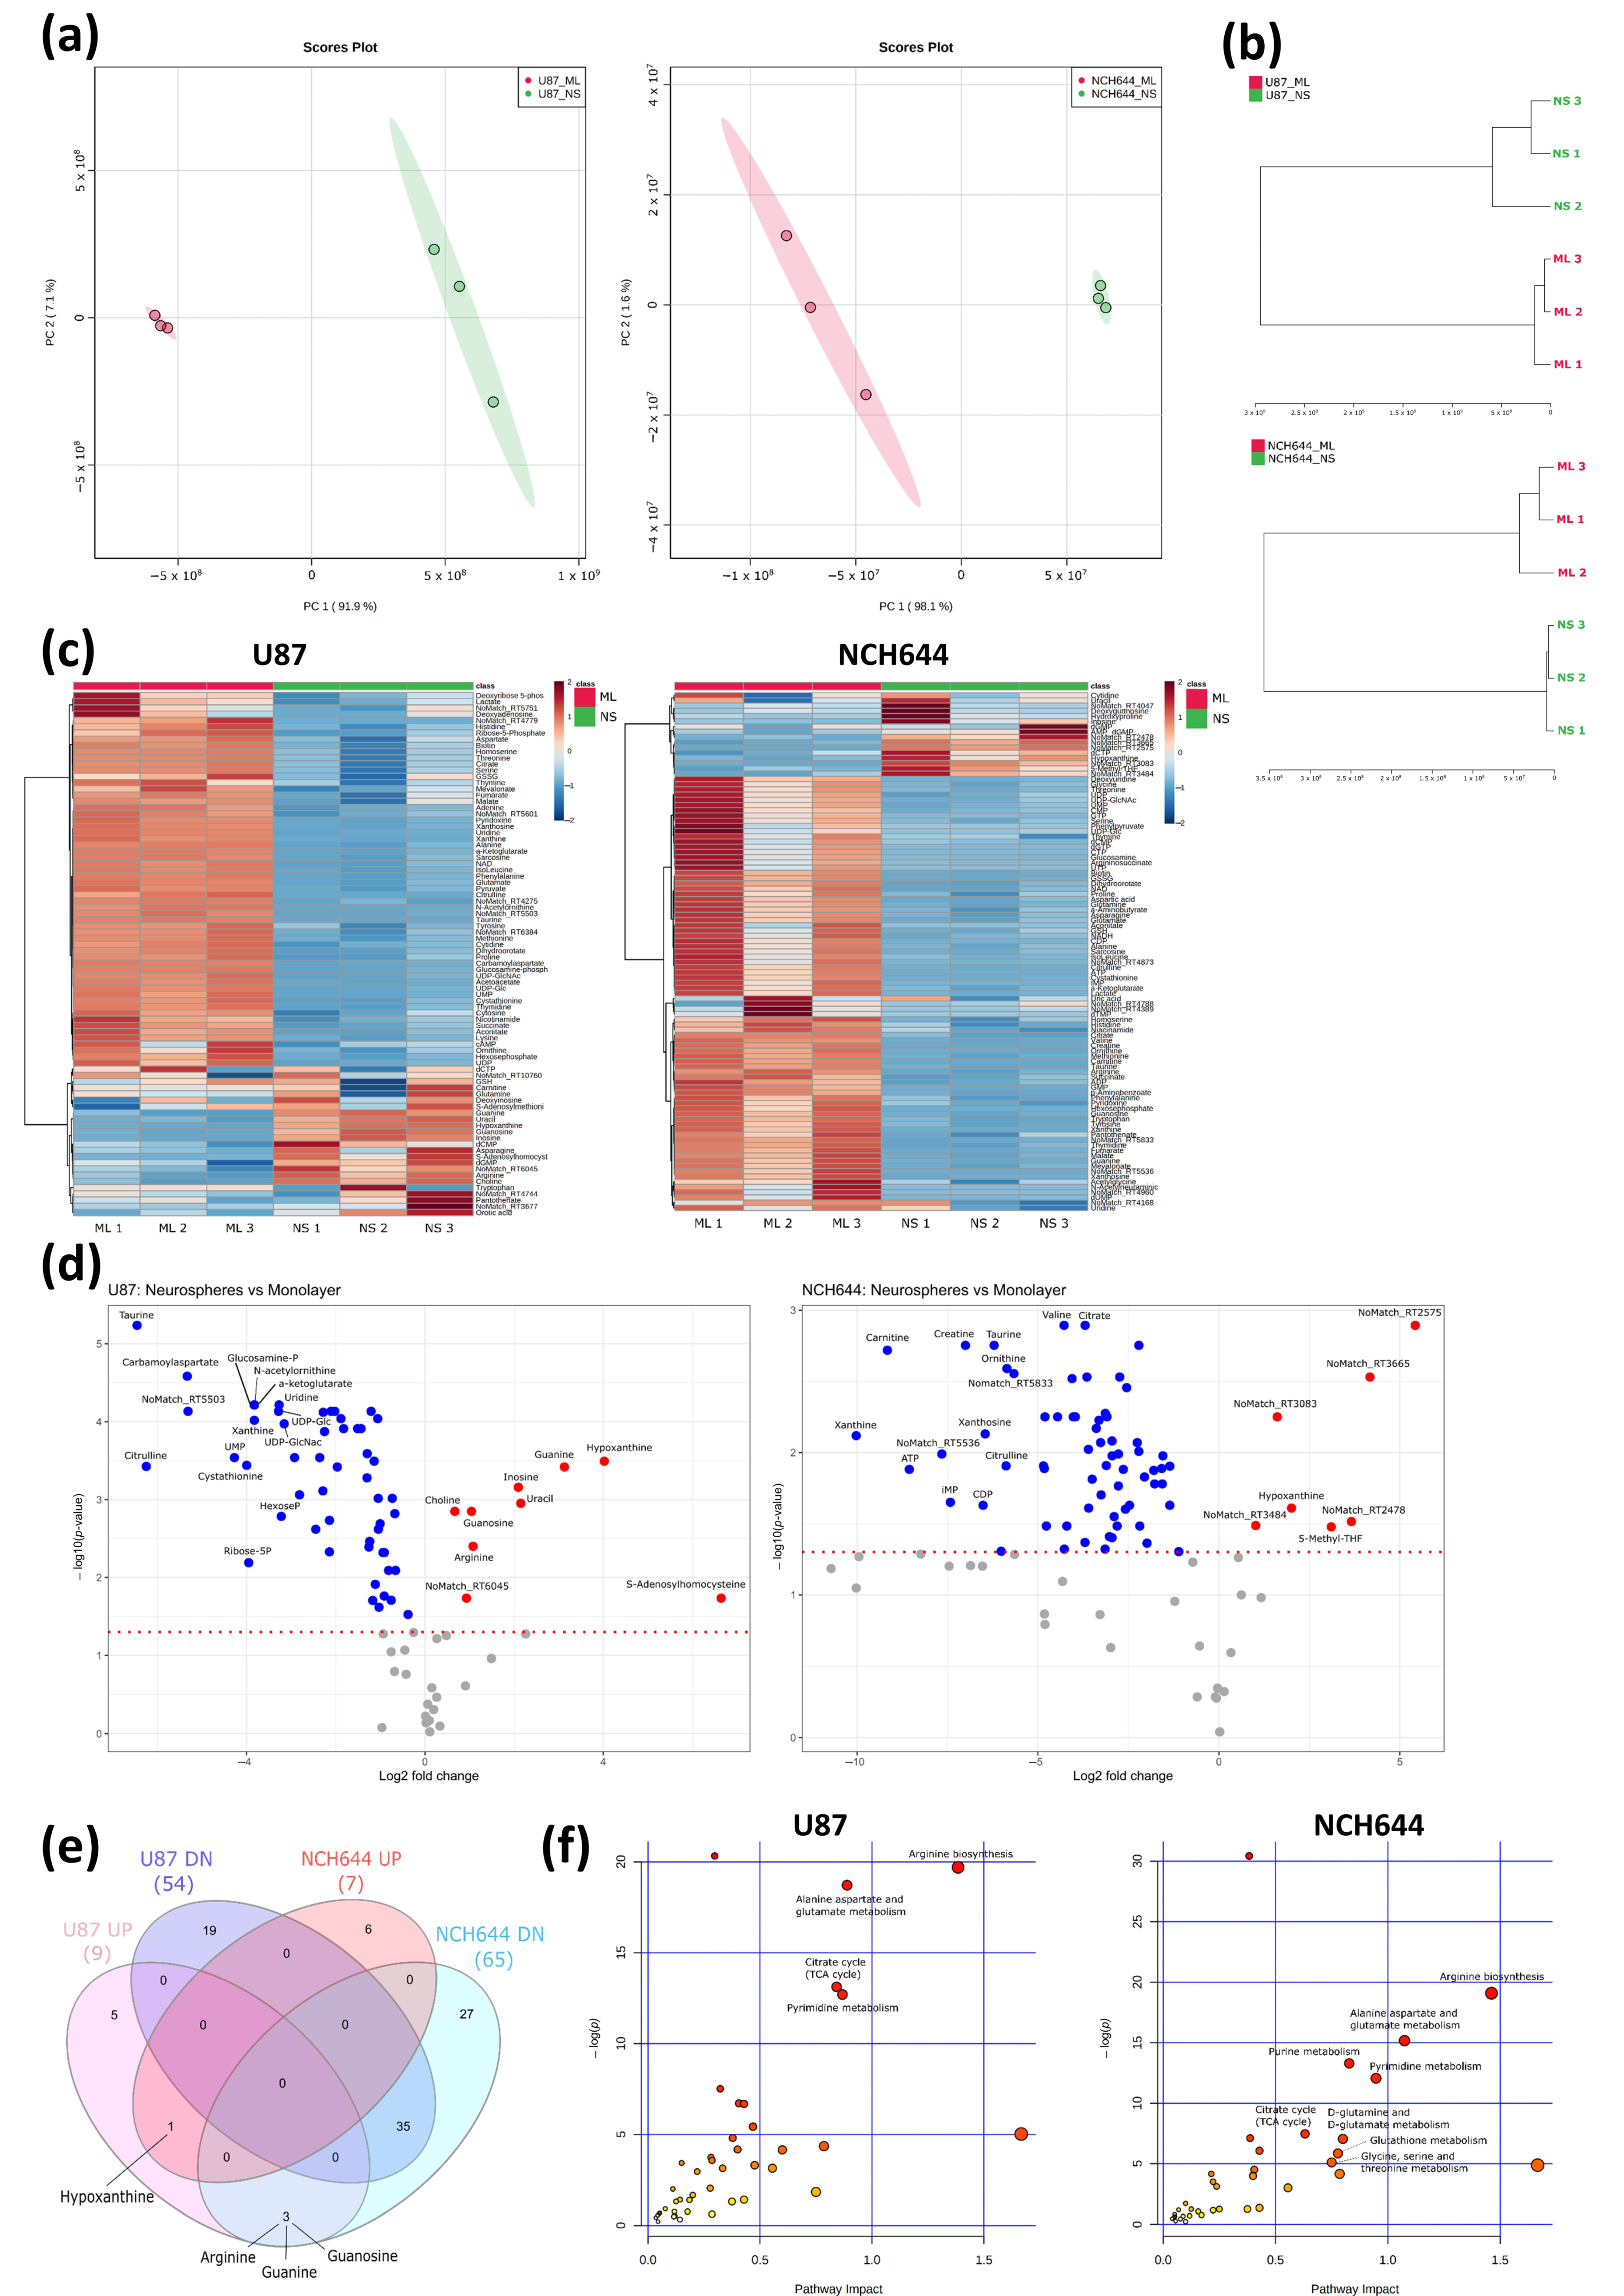
2.2. Metabolic Profile of Monolayer and Neurospheres
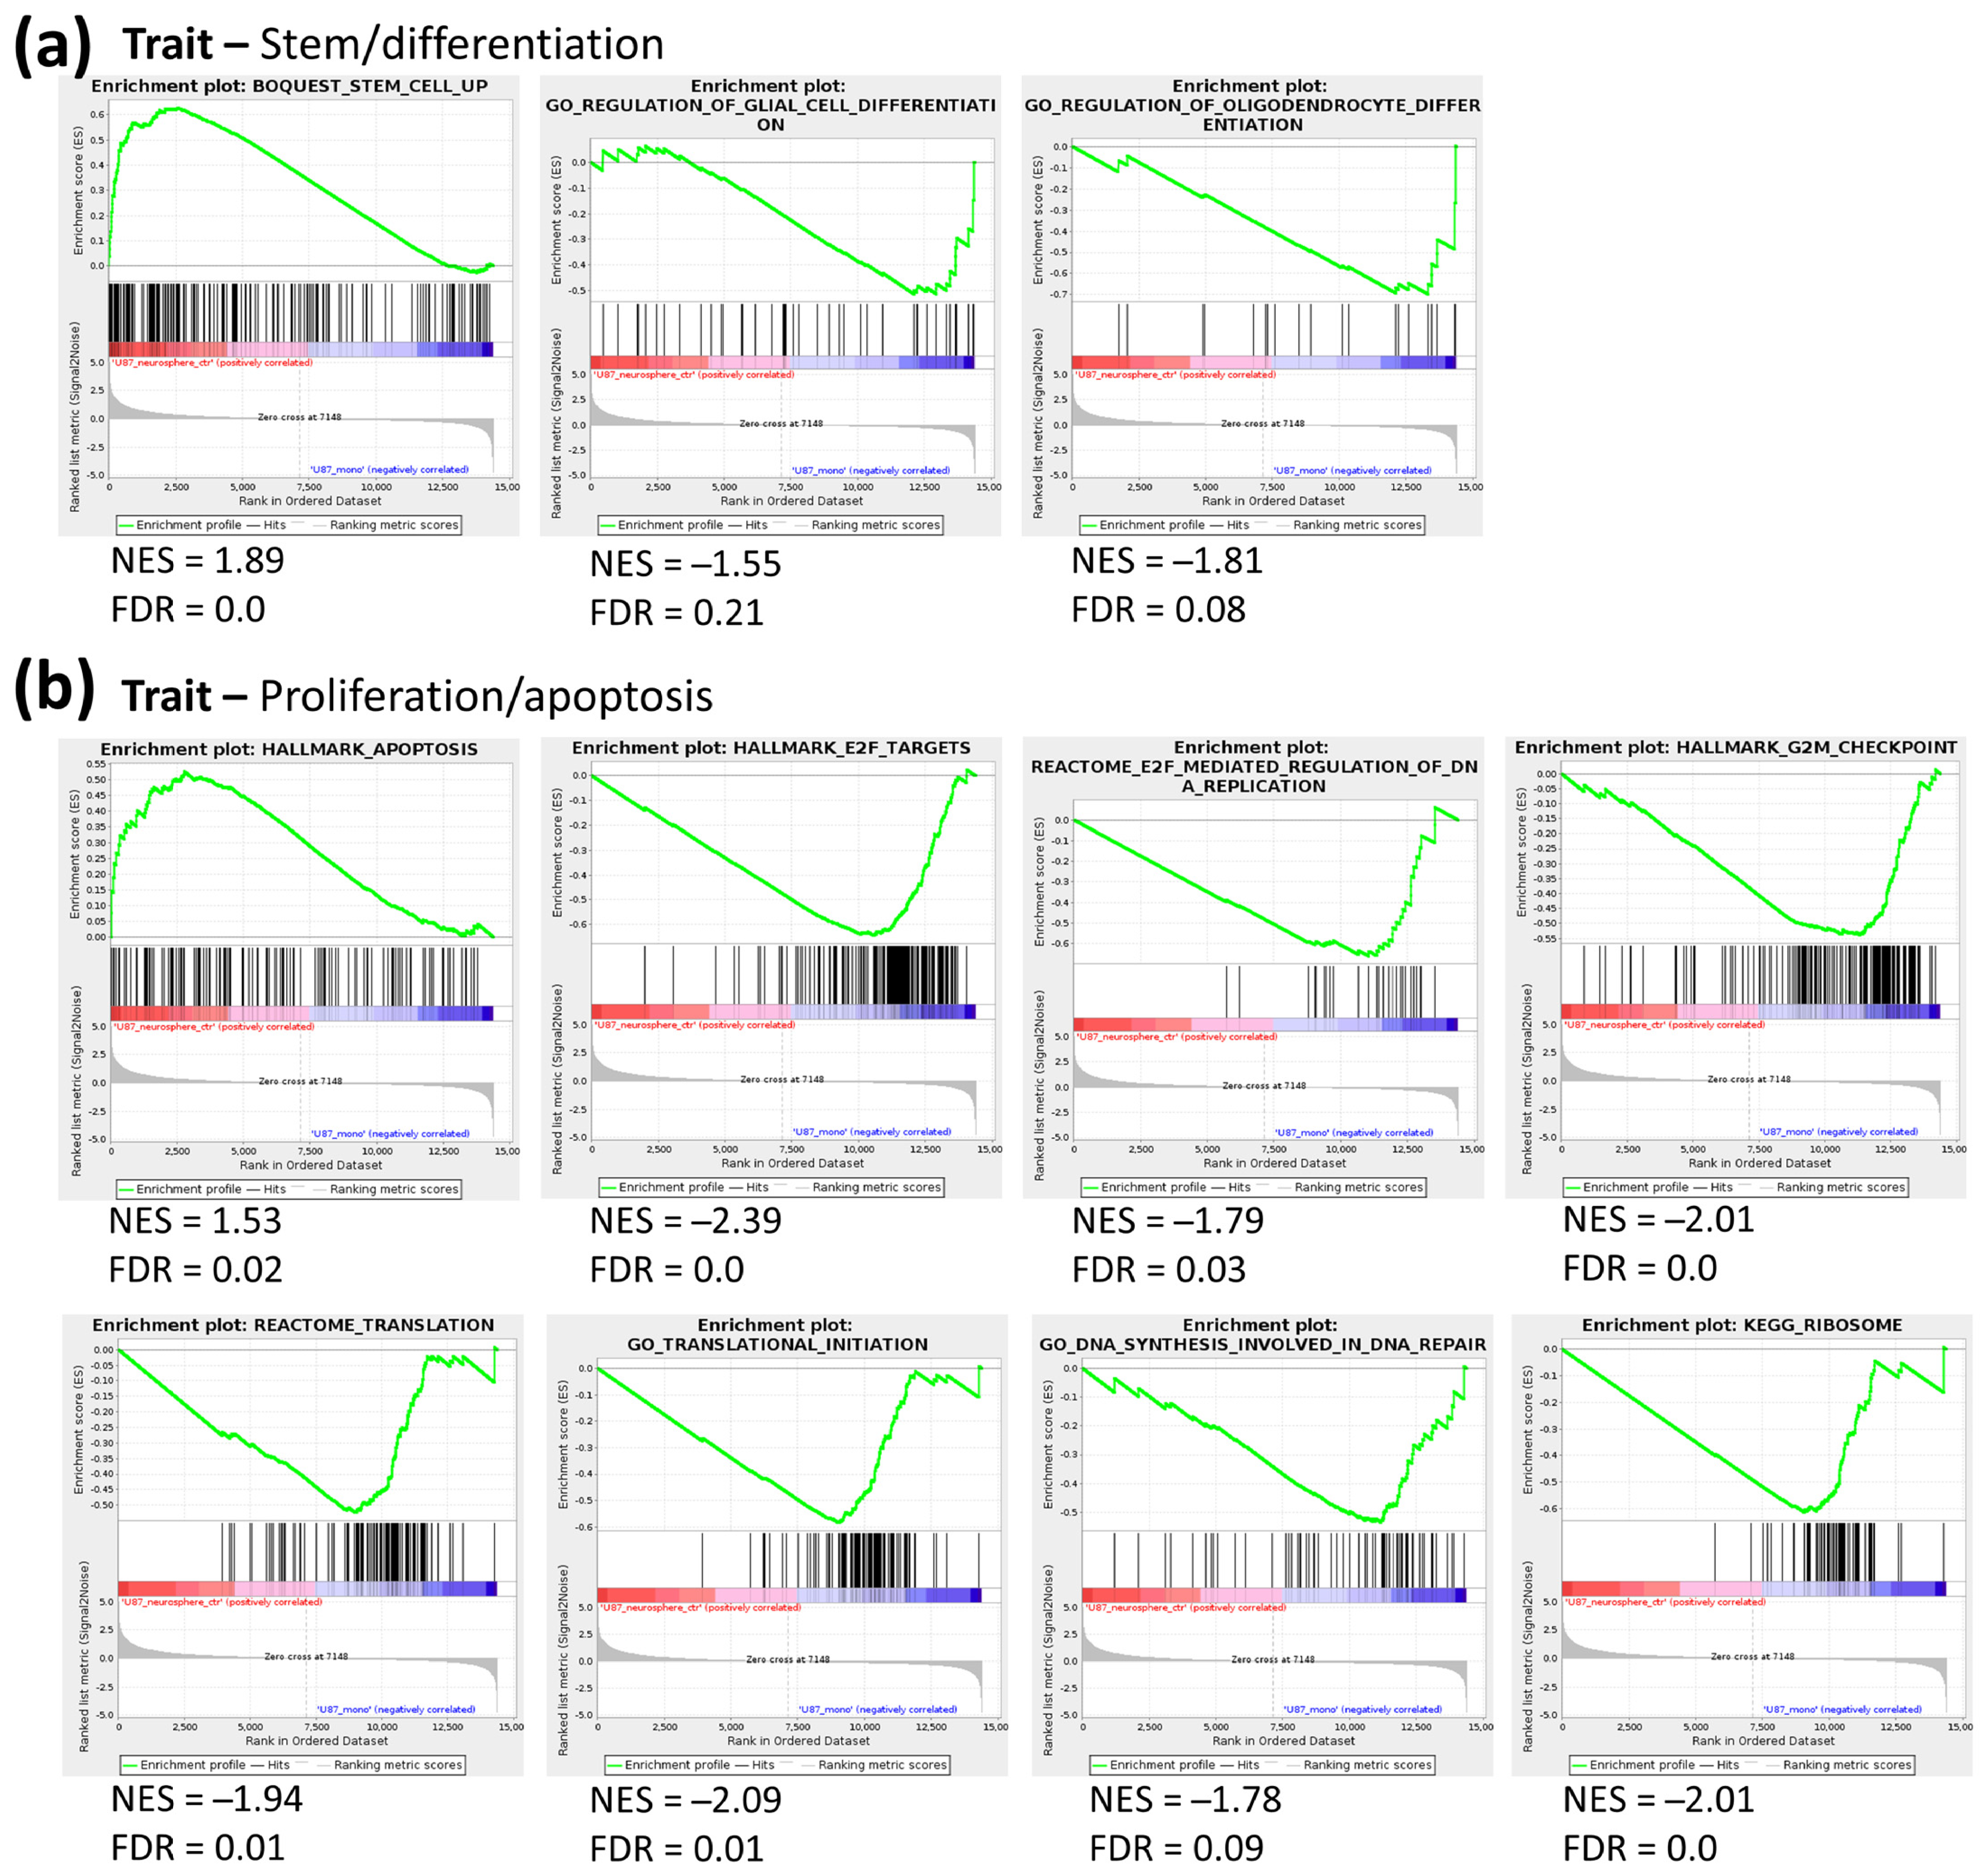
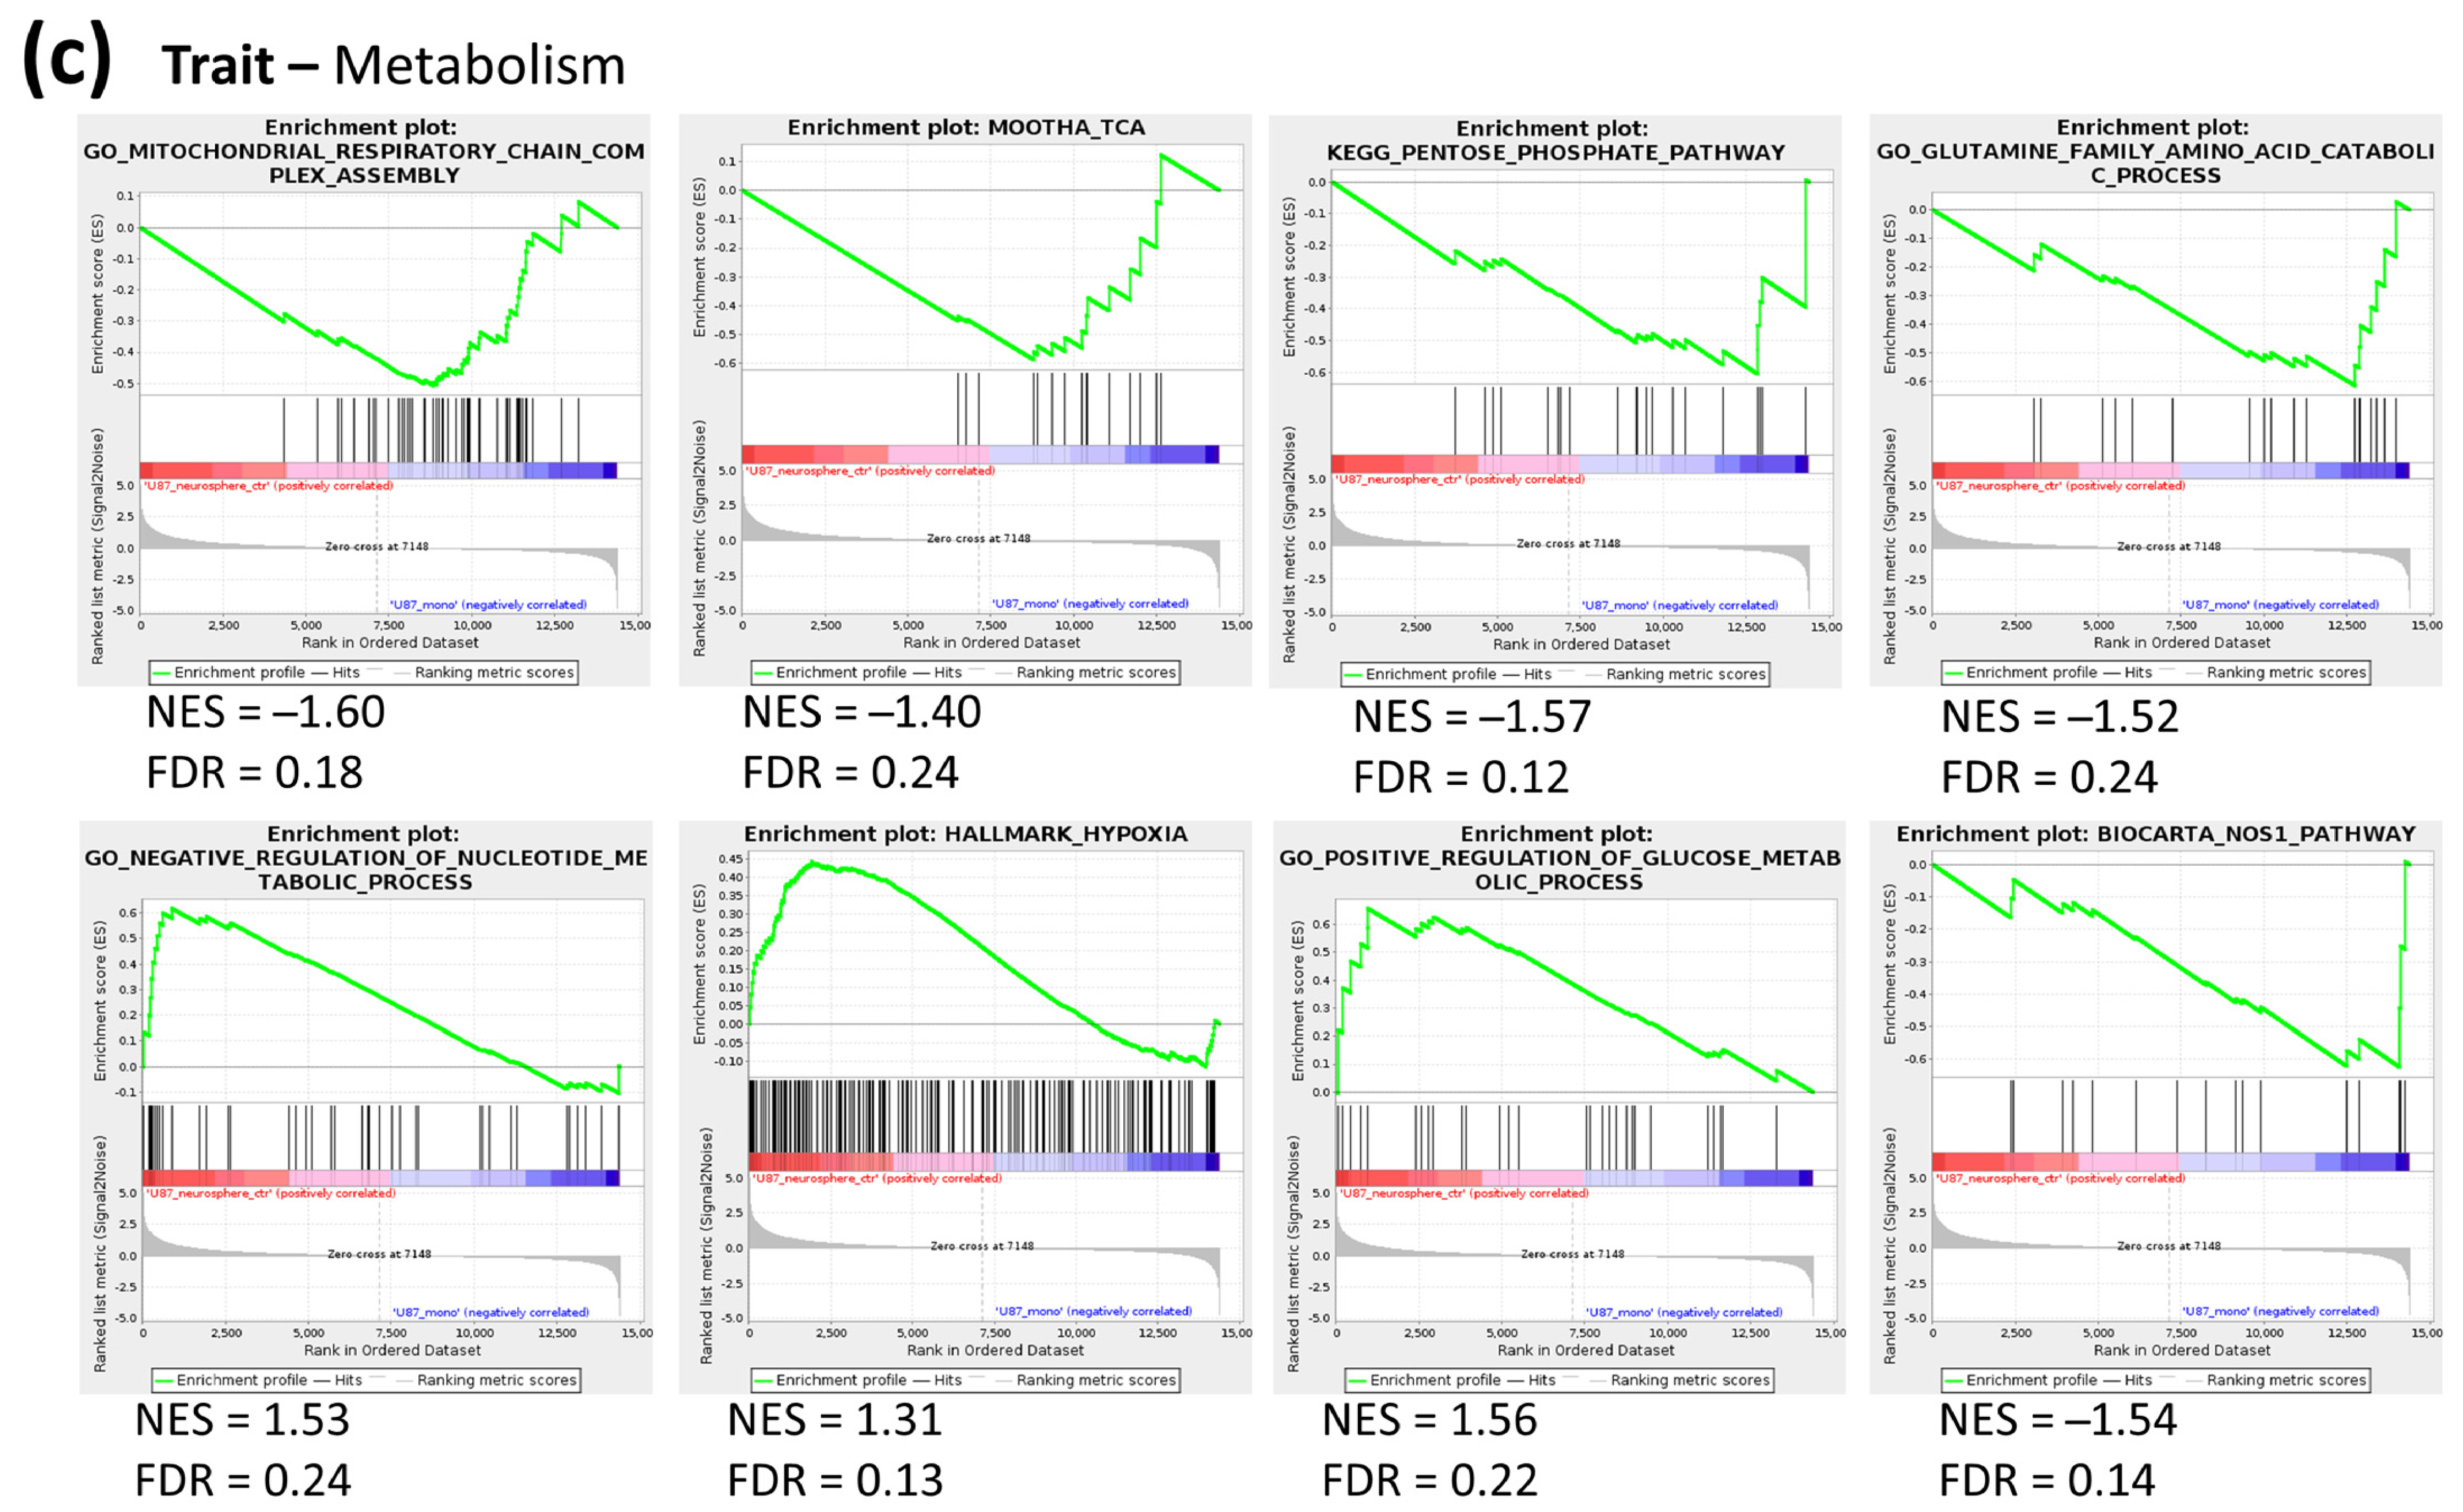
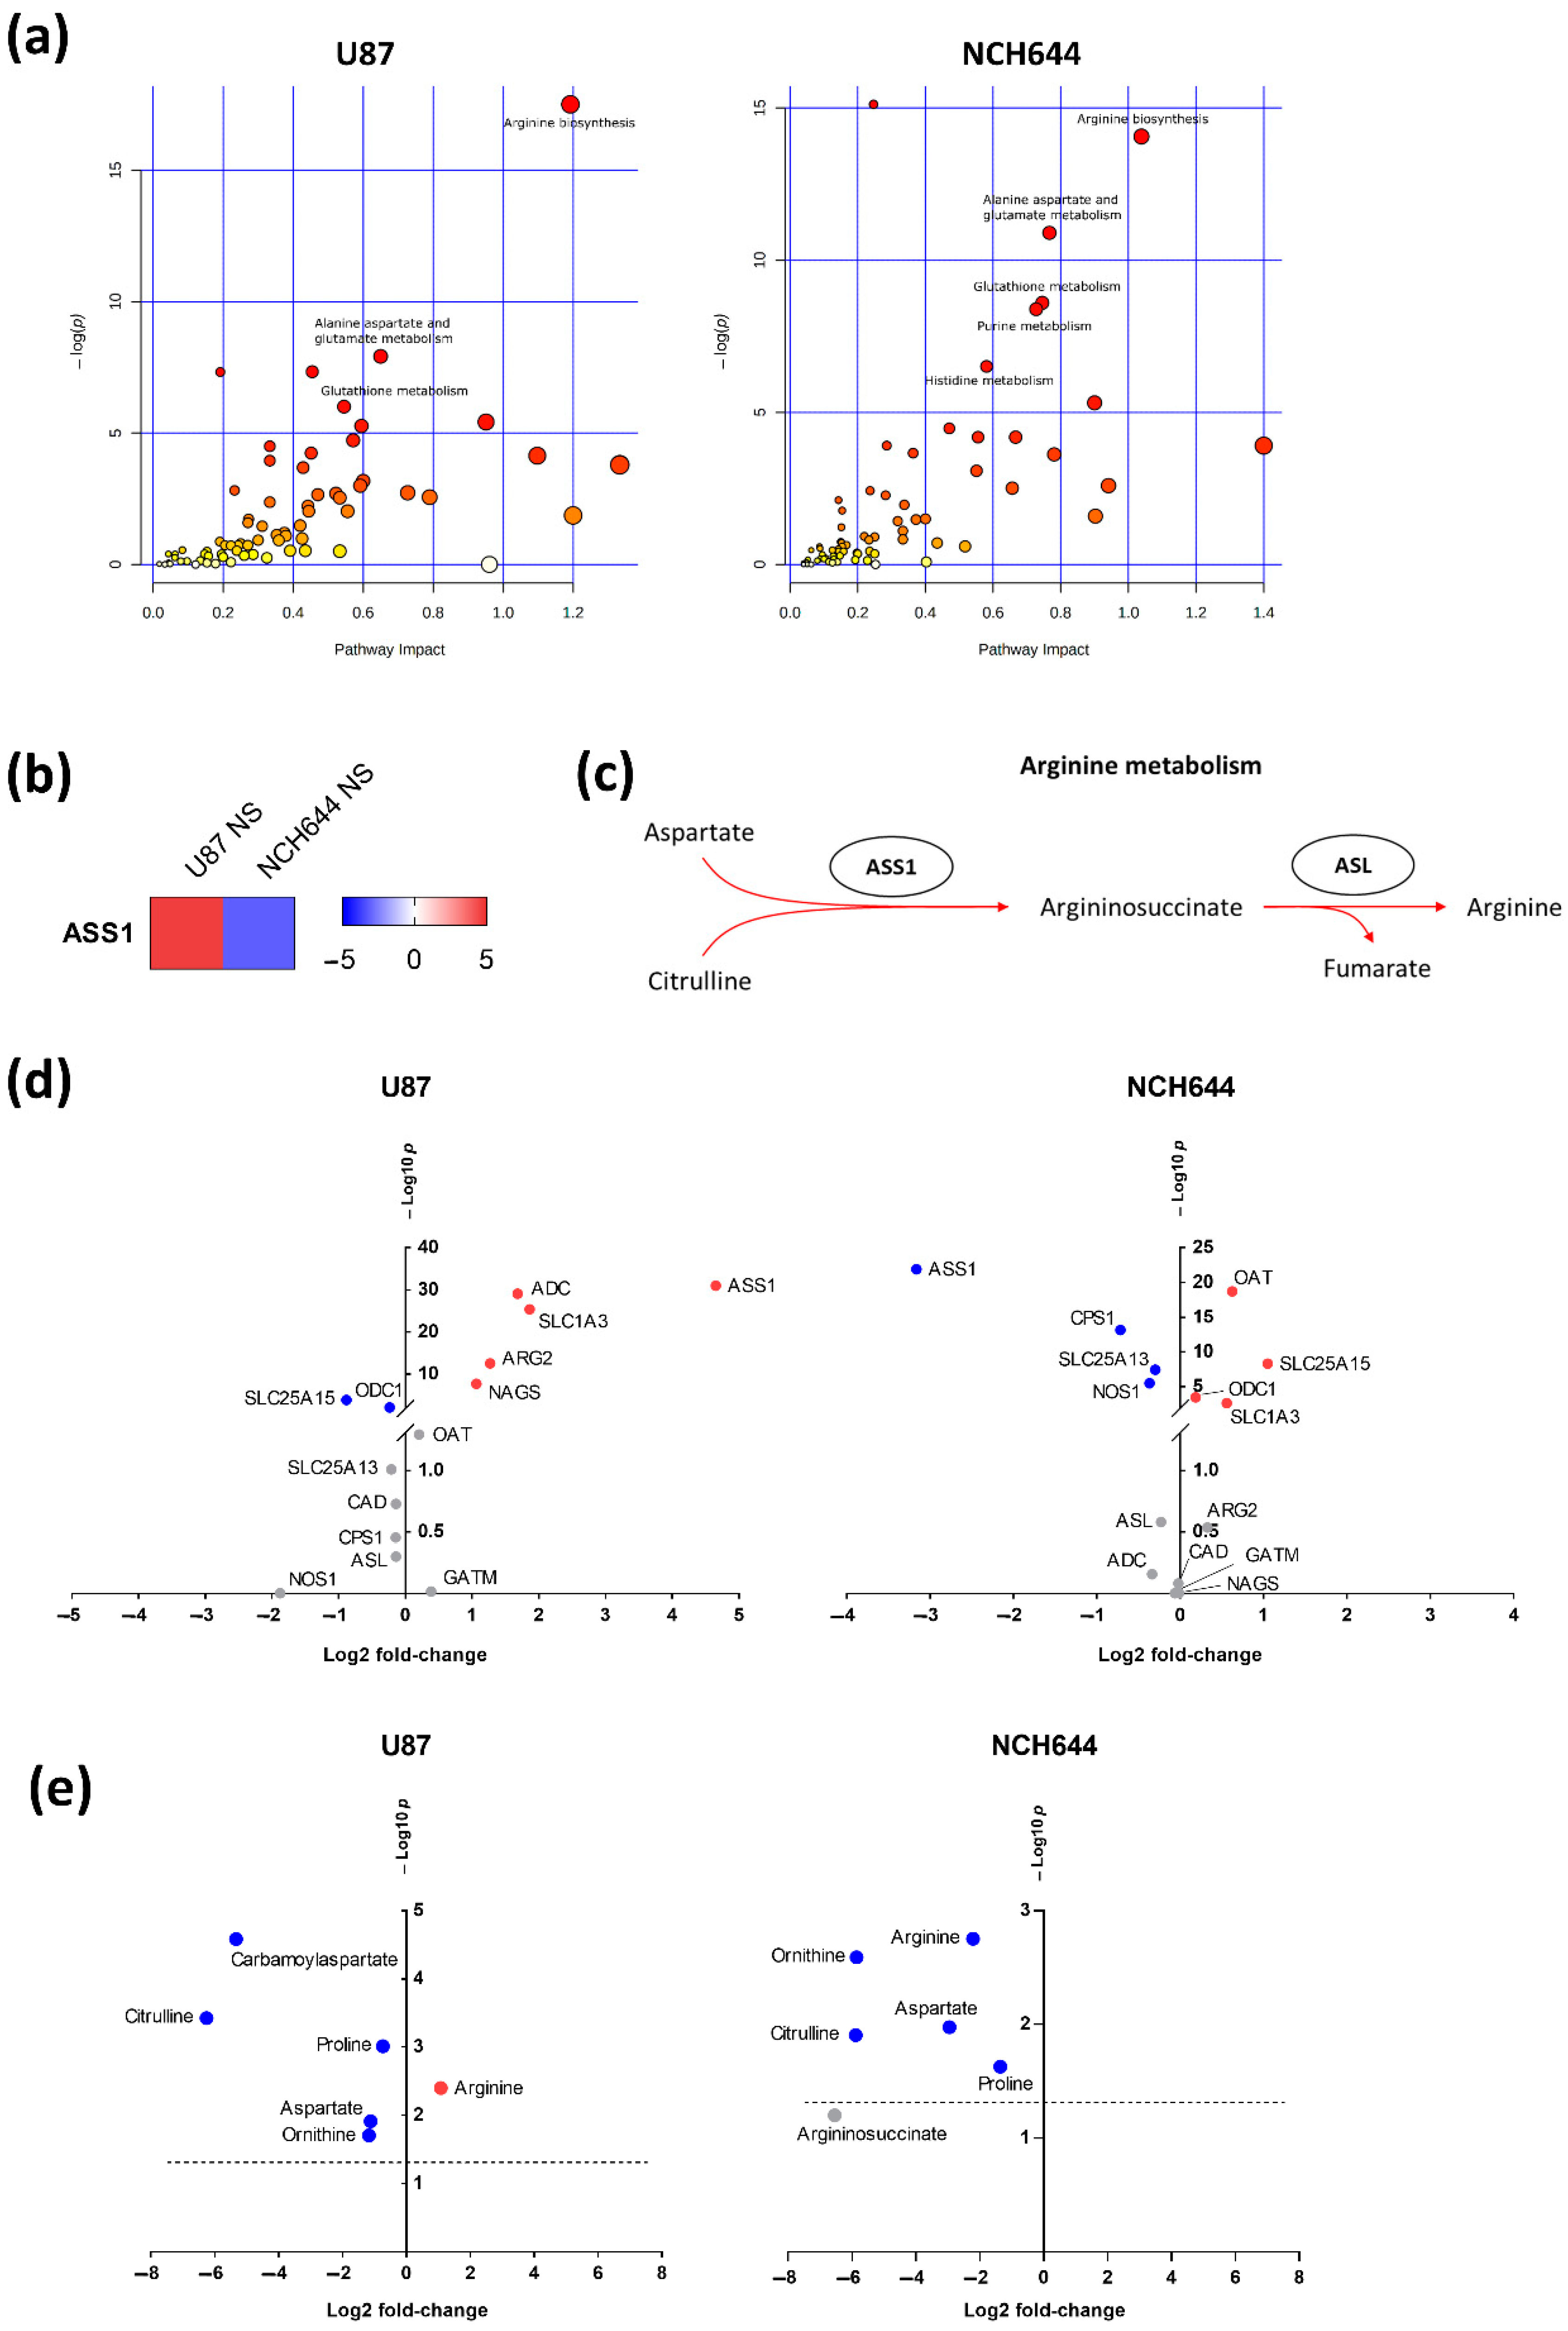
2.3. Joint Metabolomics and Gene Expression Pathway Analysis of Monolayer and Neurospheres
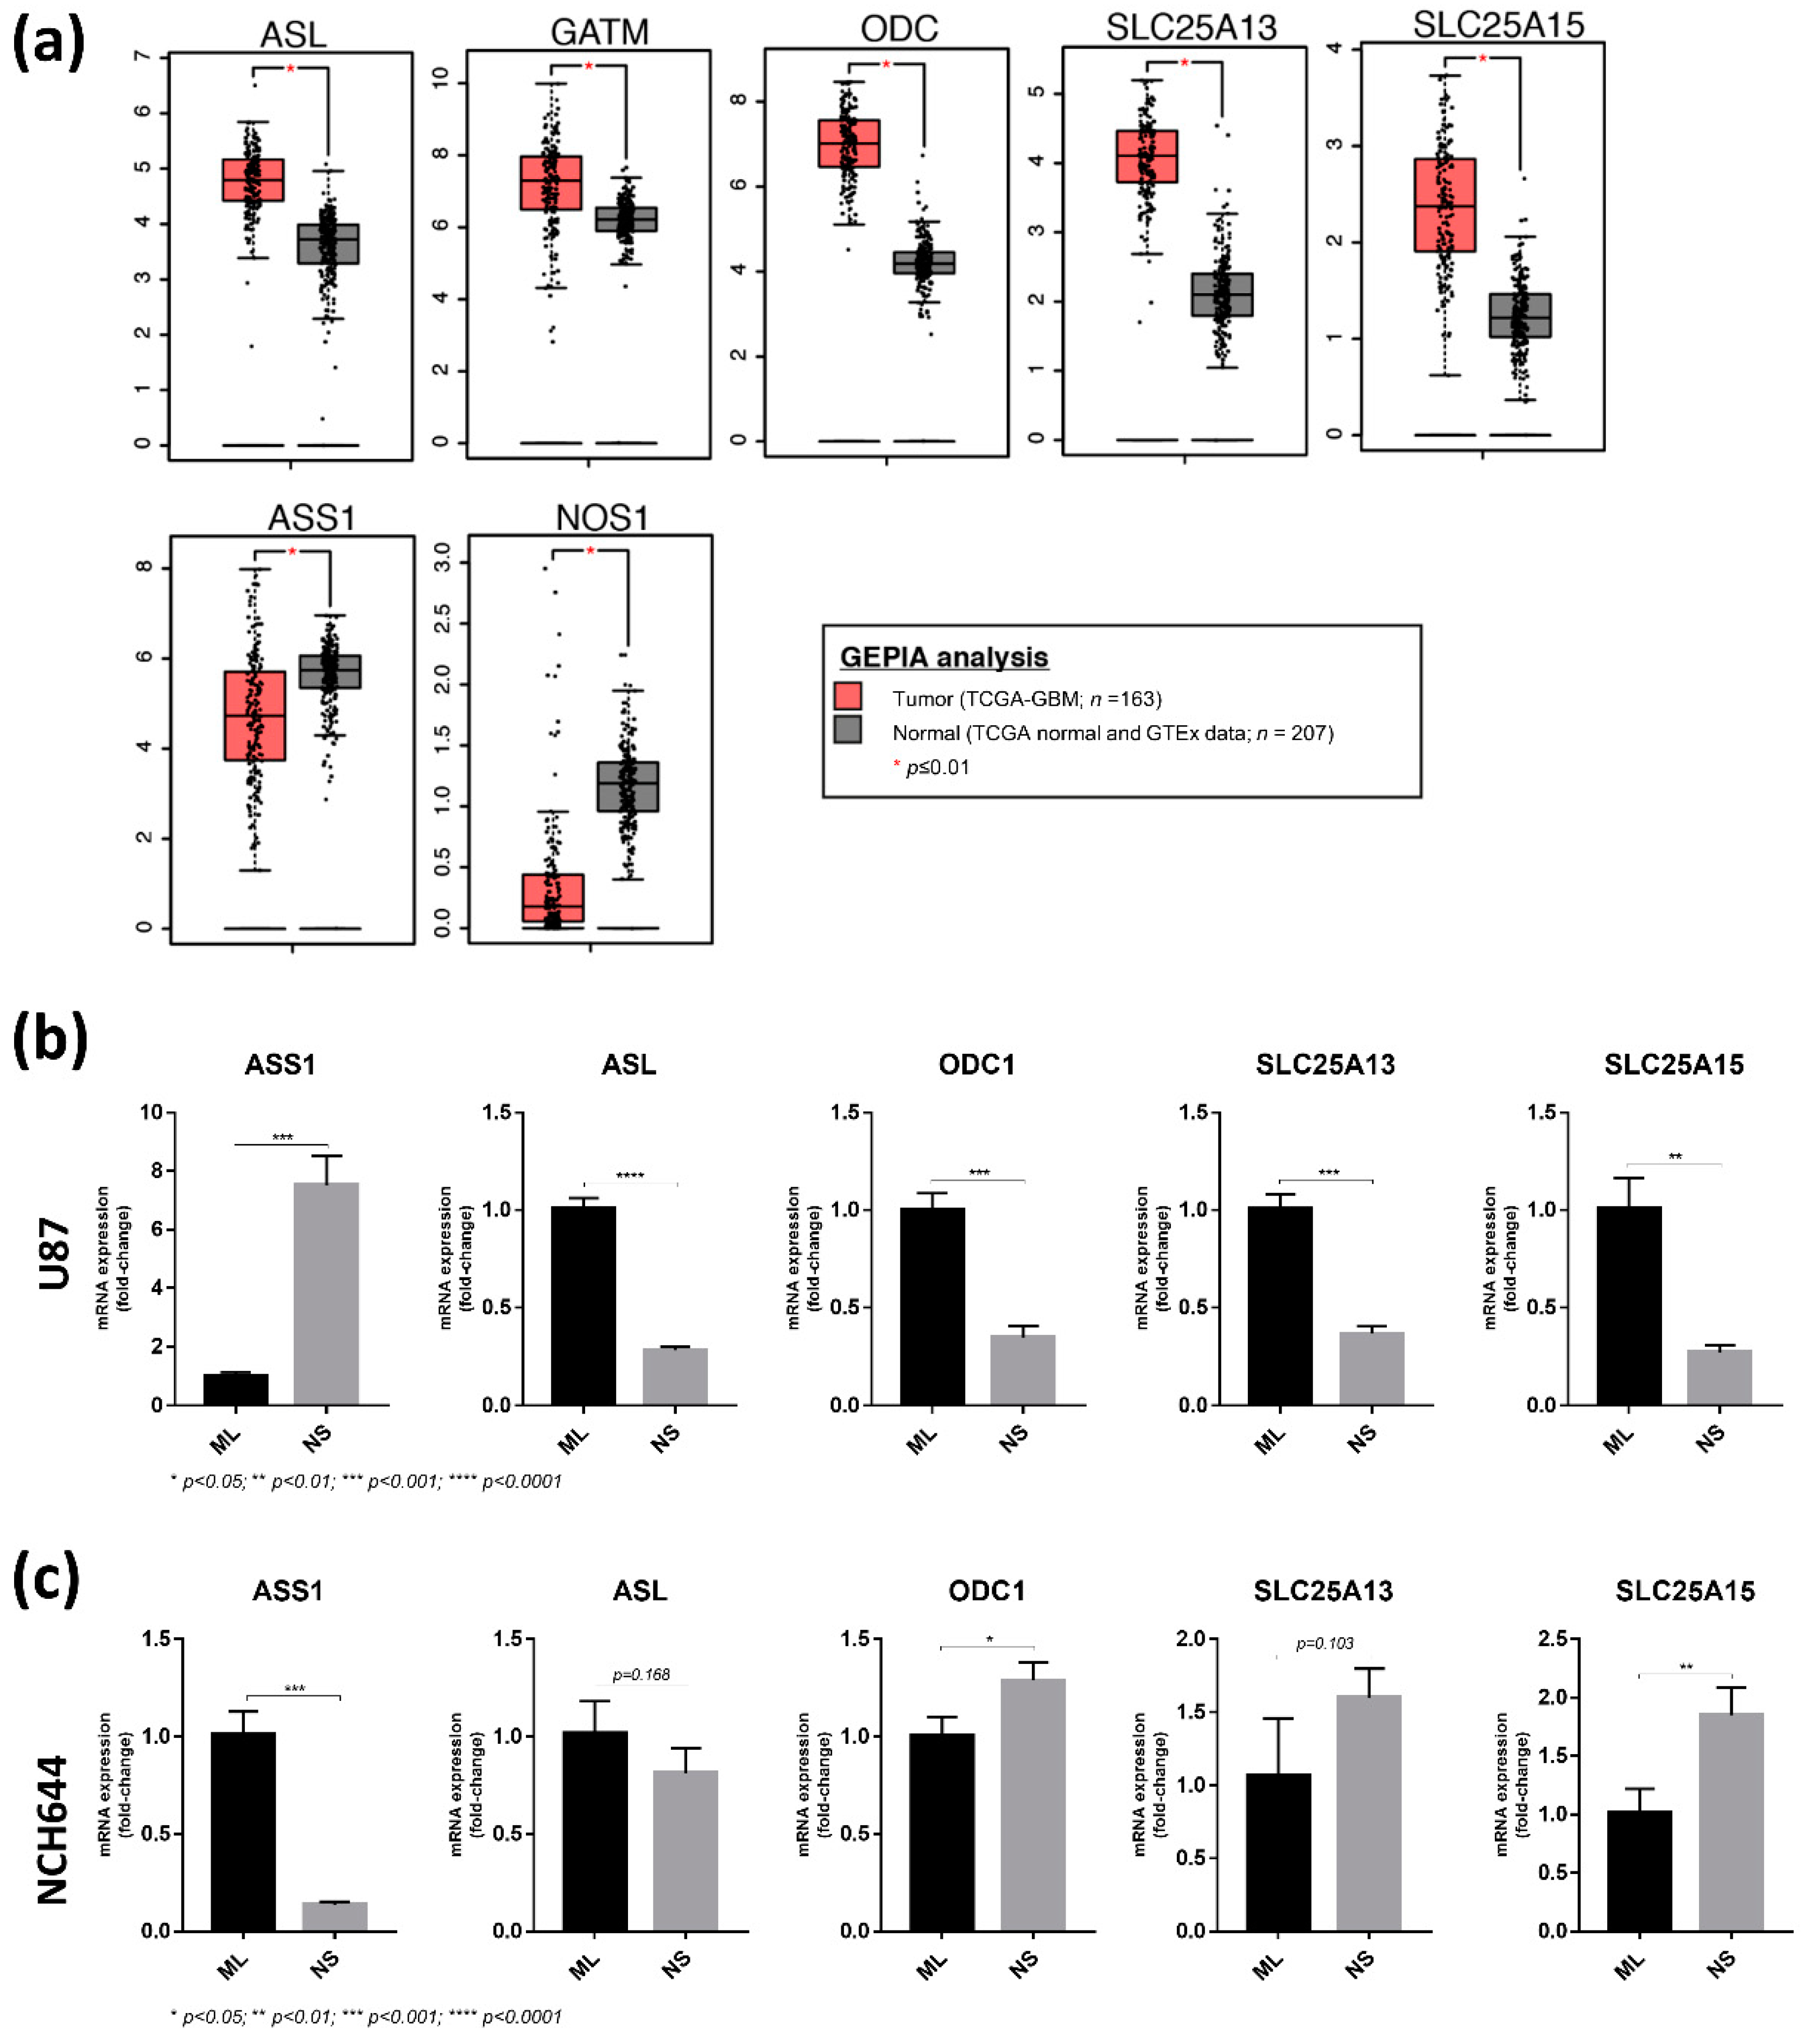
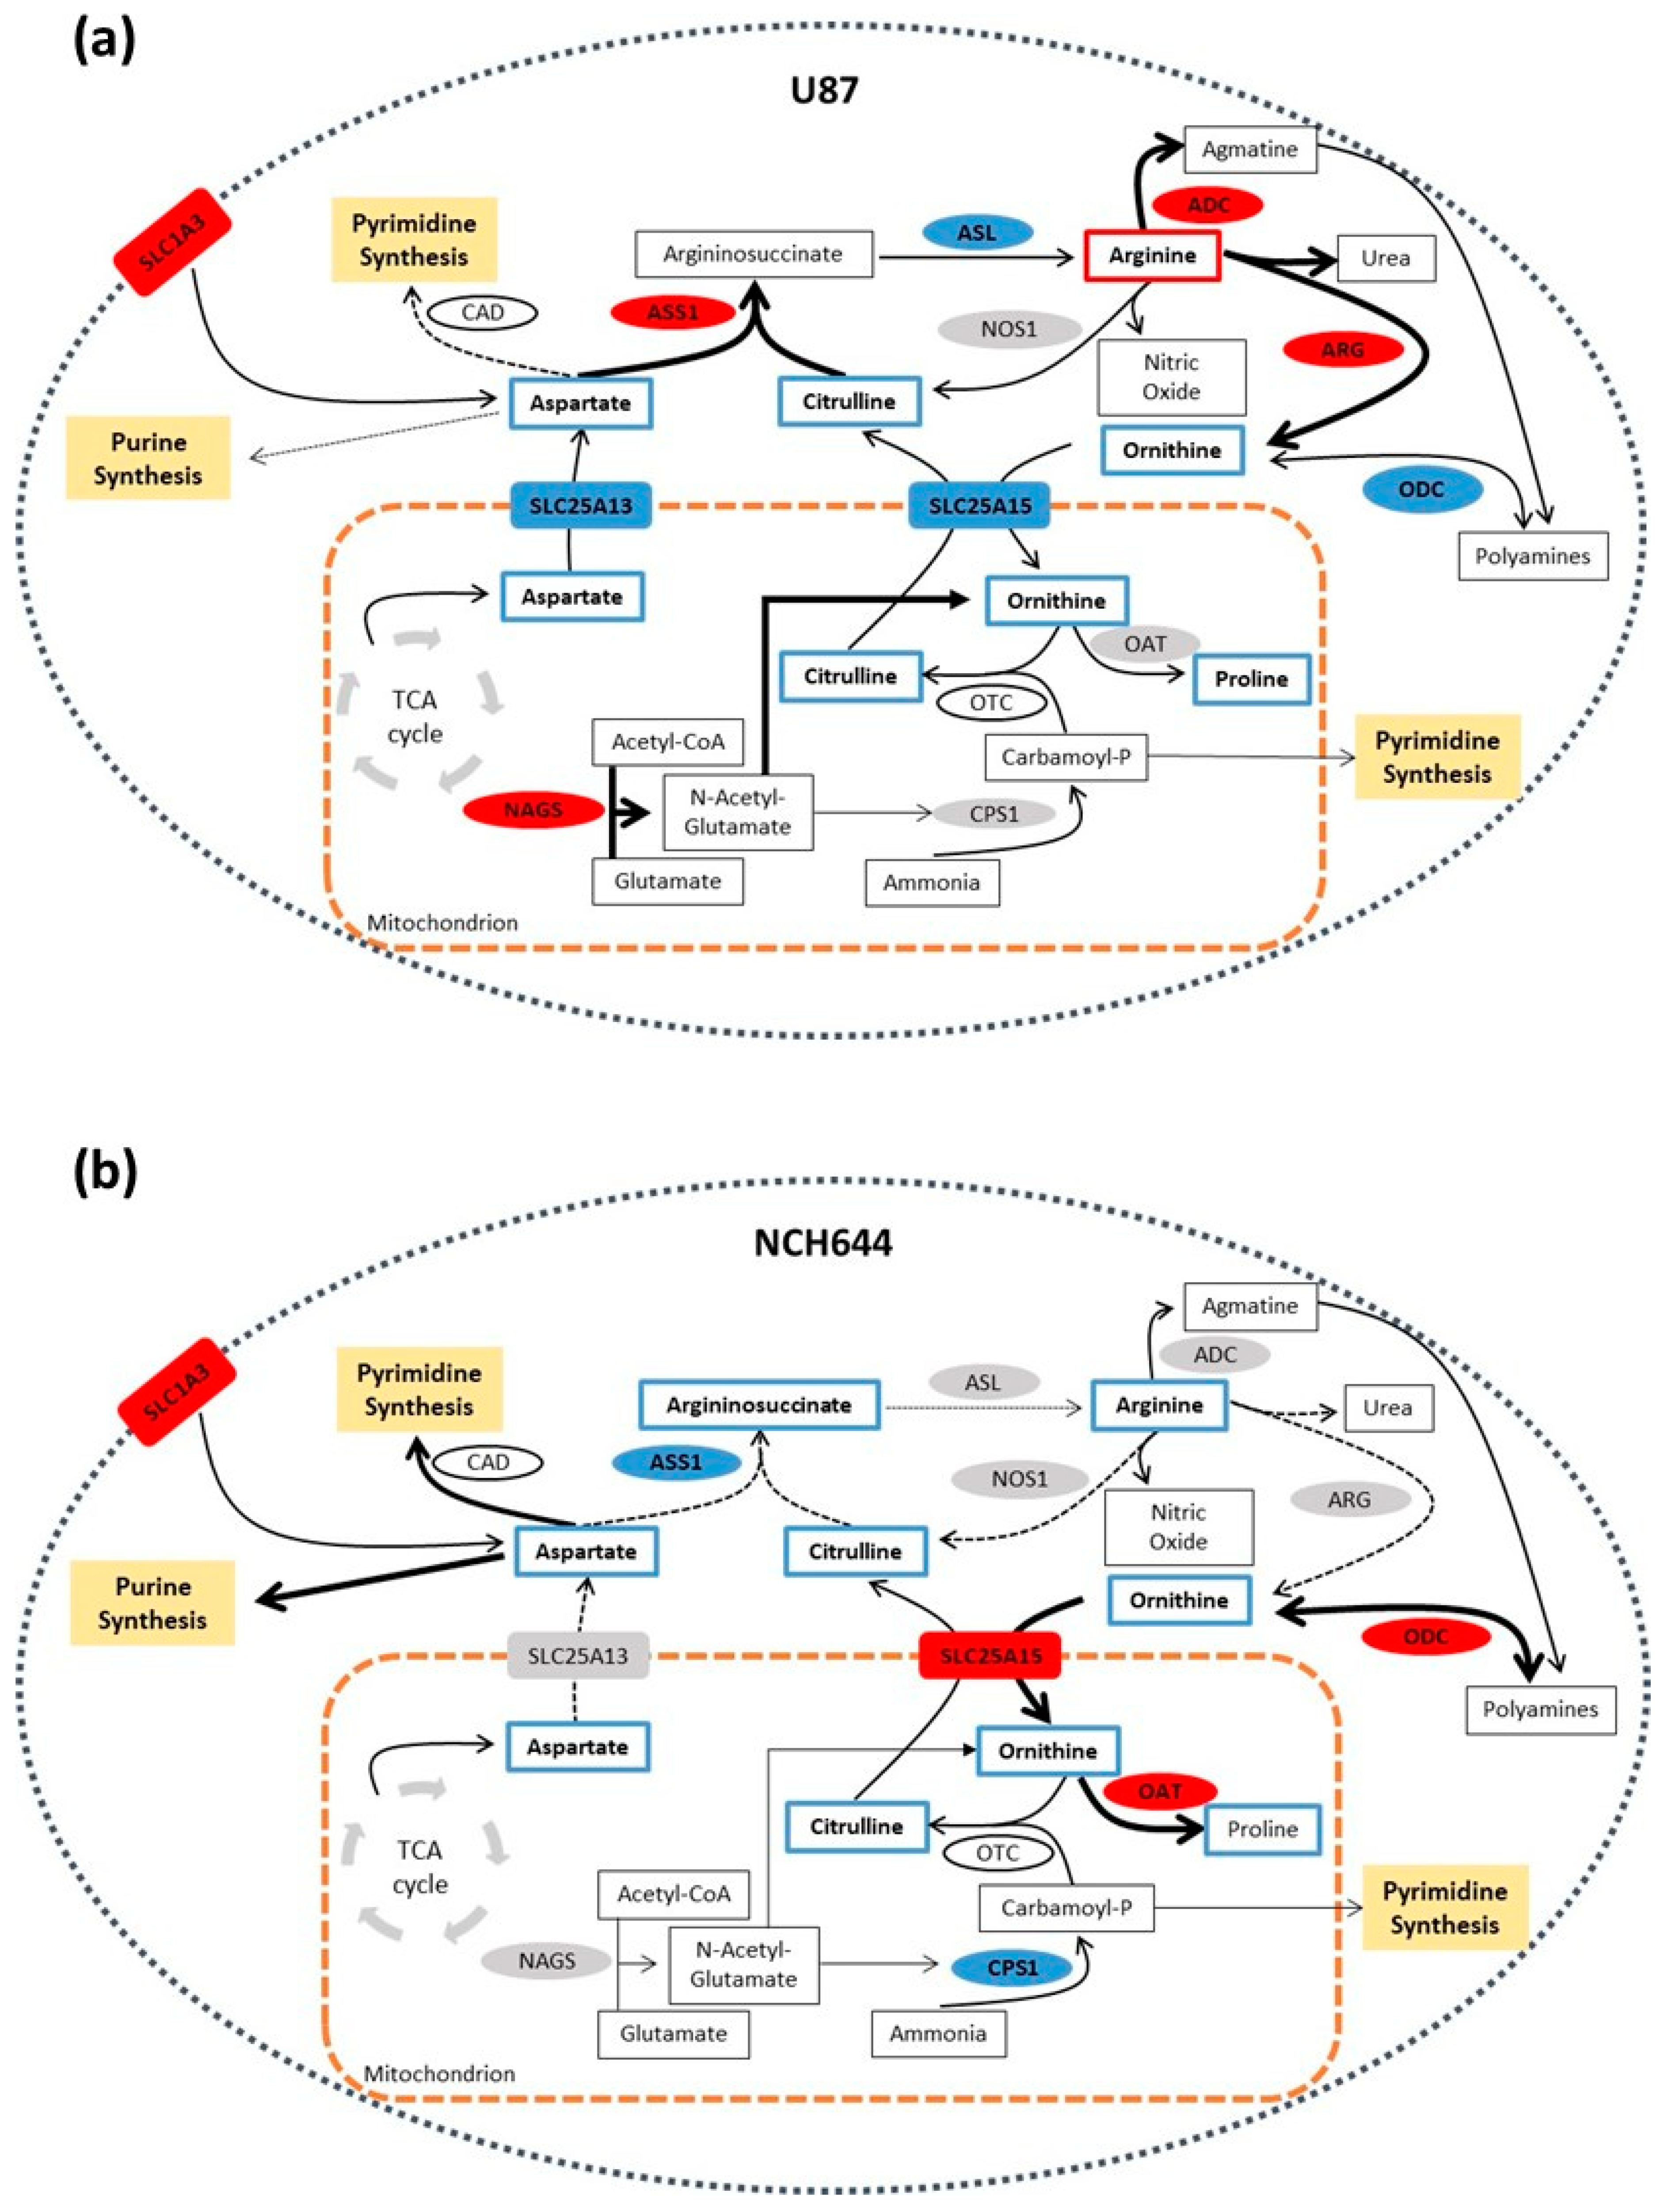
2.4. Differential Expression of Arginine Biosynthesis Genes in Human GBM and GBM Cell Lines
3. Discussion
4. Materials and Methods
4.1. Glioblastoma Cell Lines
4.2. Cell Culture in Monolayer Conditions
4.3. Cell Culture for Neurosphere Formation
4.4. RNA Sequencing
4.5. qPCR Analysis
4.6. Extraction of Water-Soluble Metabolites from Cells
4.7. Liquid Chromatography–Mass Spectrometry (LC–MS)
4.8. Metabolomics and Transcriptomics Analyses
4.9. Analysis of TCGA Data
5. Conclusions
Supplementary Materials
Author Contributions
Funding
Data Availability Statement
Acknowledgments
Conflicts of Interest
References
- Singh, S.K.; Hawkins, C.; Clarke, I.D.; Squire, J.A.; Bayani, J.; Hide, T.; Henkelman, R.M.; Cusimano, M.D.; Dirks, P.B. Identification of human brain tumour initiating cells. Nature 2004, 432, 396–401. [Google Scholar] [CrossRef]
- Lee, J.; Kotliarova, S.; Kotliarov, Y.; Li, A.; Su, Q.; Donin, N.M.; Pastorino, S.; Purow, B.W.; Christopher, N.; Zhang, W.; et al. Tumor stem cells derived from glioblastomas cultured in bFGF and EGF more closely mirror the phenotype and genotype of primary tumors than do serum-cultured cell lines. Cancer Cell 2006, 9, 391–403. [Google Scholar] [CrossRef]
- Bao, S.; Wu, Q.; McLendon, R.E.; Hao, Y.; Shi, Q.; Hjelmeland, A.B.; Dewhirst, M.W.; Bigner, D.D.; Rich, J.N. Glioma stem cells promote radioresistance by preferential activation of the DNA damage response. Nature 2006, 444, 756–760. [Google Scholar] [CrossRef] [PubMed]
- Liu, G.; Yuan, X.; Zeng, Z.; Tunici, P.; Ng, H.; Abdulkadir, I.R.; Lu, L.; Irvin, D.; Black, K.L.; Yu, J.S. Analysis of gene expression and chemoresistance of CD133+ cancer stem cells in glioblastoma. Mol. Cancer 2006, 5, 67. [Google Scholar] [CrossRef] [PubMed]
- Chen, J.; Li, Y.; Yu, T.S.; McKay, R.M.; Burns, D.K.; Kernie, S.G.; Parada, L.F. A restricted cell population propagates glioblastoma growth after chemotherapy. Nature 2012, 488, 522–526. [Google Scholar] [CrossRef]
- Bao, S.; Wu, Q.; Sathornsumetee, S.; Hao, Y.; Li, Z.; Hjelmeland, A.B.; Shi, Q.; McLendon, R.E.; Bigner, D.D.; Rich, J.N. Stem cell-like glioma cells promote tumor angiogenesis through vascular endothelial growth factor. Cancer Res. 2006, 66, 7843–7848. [Google Scholar] [CrossRef]
- Cheng, L.; Huang, Z.; Zhou, W.; Wu, Q.; Donnola, S.; Liu, J.K.; Fang, X.; Sloan, A.E.; Mao, Y.; Lathia, J.D.; et al. Glioblastoma stem cells generate vascular pericytes to support vessel function and tumor growth. Cell 2013, 153, 139–152. [Google Scholar] [CrossRef]
- Wakimoto, H.; Kesari, S.; Farrell, C.J.; Curry, W.T., Jr.; Zaupa, C.; Aghi, M.; Kuroda, T.; Stemmer-Rachamimov, A.; Shah, K.; Liu, T.C.; et al. Human glioblastoma-derived cancer stem cells: Establishment of invasive glioma models and treatment with oncolytic herpes simplex virus vectors. Cancer Res. 2009, 69, 3472–3481. [Google Scholar] [CrossRef]
- Pardal, R.; Clarke, M.F.; Morrison, S.J. Applying the principles of stem-cell biology to cancer. Nat. Rev. Cancer 2003, 3, 895–902. [Google Scholar] [CrossRef] [PubMed]
- Reya, T.; Morrison, S.J.; Clarke, M.F.; Weissman, I.L. Stem cells, cancer, and cancer stem cells. Nature 2001, 414, 105–111. [Google Scholar] [CrossRef]
- Li, Z.; Bao, S.; Wu, Q.; Wang, H.; Eyler, C.; Sathornsumetee, S.; Shi, Q.; Cao, Y.; Lathia, J.; McLendon, R.E.; et al. Hypoxia-inducible factors regulate tumorigenic capacity of glioma stem cells. Cancer Cell 2009, 15, 501–513. [Google Scholar] [CrossRef]
- Soeda, A.; Park, M.; Lee, D.; Mintz, A.; Androutsellis-Theotokis, A.; McKay, R.D.; Engh, J.; Iwama, T.; Kunisada, T.; Kassam, A.B.; et al. Hypoxia promotes expansion of the CD133-positive glioma stem cells through activation of HIF-1alpha. Oncogene 2009, 28, 3949–3959. [Google Scholar] [CrossRef] [PubMed]
- Zhou, Y.; Zhou, Y.; Shingu, T.; Feng, L.; Chen, Z.; Ogasawara, M.; Keating, M.J.; Kondo, S.; Huang, P. Metabolic alterations in highly tumorigenic glioblastoma cells: Preference for hypoxia and high dependency on glycolysis. J. Biol. Chem. 2011, 286, 32843–32853. [Google Scholar] [CrossRef] [PubMed]
- Tang, Z.; Li, C.; Kang, B.; Gao, G.; Li, C.; Zhang, Z. GEPIA: A web server for cancer and normal gene expression profiling and interactive analyses. Nucleic Acids Res. 2017, 45, W98–W102. [Google Scholar] [CrossRef] [PubMed]
- Shan, Y.S.; Hsu, H.P.; Lai, M.D.; Yen, M.C.; Chen, W.C.; Fang, J.H.; Weng, T.Y.; Chen, Y.L. Argininosuccinate synthetase 1 suppression and arginine restriction inhibit cell migration in gastric cancer cell lines. Sci. Rep. 2015, 5, 9783. [Google Scholar] [CrossRef] [PubMed]
- Guerreiro, J.R.; Lameu, C.; Oliveira, E.F.; Klitzke, C.F.; Melo, R.L.; Linares, E.; Augusto, O.; Fox, J.W.; Lebrun, I.; Serrano, S.M.; et al. Argininosuccinate synthetase is a functional target for a snake venom anti-hypertensive peptide: Role in arginine and nitric oxide production. J. Biol. Chem. 2009, 284, 20022–20033. [Google Scholar] [CrossRef] [PubMed]
- Shen, L.J.; Beloussow, K.; Shen, W.C. Accessibility of endothelial and inducible nitric oxide synthase to the intracellular citrulline-arginine regeneration pathway. Biochem. Pharm. 2005, 69, 97–104. [Google Scholar] [CrossRef] [PubMed]
- Flam, B.R.; Eichler, D.C.; Solomonson, L.P. Endothelial nitric oxide production is tightly coupled to the citrulline-NO cycle. Nitric Oxide 2007, 17, 115–121. [Google Scholar] [CrossRef] [PubMed]
- Chakraborty, S.; Kanakasabai, S.; Bright, J.J. Constitutive androstane receptor agonist CITCO inhibits growth and expansion of brain tumour stem cells. Br. J. Cancer 2011, 104, 448–459. [Google Scholar] [CrossRef] [PubMed]
- Erhart, F.; Blauensteiner, B.; Zirkovits, G.; Printz, D.; Soukup, K.; Klingenbrunner, S.; Fischhuber, K.; Reitermaier, R.; Halfmann, A.; Lotsch, D.; et al. Gliomasphere marker combinatorics: Multidimensional flow cytometry detects CD44+/CD133+/ITGA6+/CD36+ signature. J. Cell Mol. Med. 2019, 23, 281–292. [Google Scholar] [CrossRef] [PubMed]
- Goidts, V.; Bageritz, J.; Puccio, L.; Nakata, S.; Zapatka, M.; Barbus, S.; Toedt, G.; Campos, B.; Korshunov, A.; Momma, S.; et al. RNAi screening in glioma stem-like cells identifies PFKFB4 as a key molecule important for cancer cell survival. Oncogene 2012, 31, 3235–3243. [Google Scholar] [CrossRef] [PubMed]
- Campos, B.; Wan, F.; Farhadi, M.; Ernst, A.; Zeppernick, F.; Tagscherer, K.E.; Ahmadi, R.; Lohr, J.; Dictus, C.; Gdynia, G.; et al. Differentiation therapy exerts antitumor effects on stem-like glioma cells. Clin. Cancer Res. 2010, 16, 2715–2728. [Google Scholar] [CrossRef] [PubMed]
- Podergajs, N.; Brekka, N.; Radlwimmer, B.; Herold-Mende, C.; Talasila, K.M.; Tiemann, K.; Rajcevic, U.; Lah, T.T.; Bjerkvig, R.; Miletic, H. Expansive growth of two glioblastoma stem-like cell lines is mediated by bFGF and not by EGF. Radiol. Oncol. 2013, 47, 330–337. [Google Scholar] [CrossRef]
- Bageritz, J.; Puccio, L.; Piro, R.M.; Hovestadt, V.; Phillips, E.; Pankert, T.; Lohr, J.; Herold-Mende, C.; Lichter, P.; Goidts, V. Stem cell characteristics in glioblastoma are maintained by the ecto-nucleotidase E-NPP1. Cell Death Differ. 2014, 21, 929–940. [Google Scholar] [CrossRef]
- Yang, X.J.; Cui, W.; Gu, A.; Xu, C.; Yu, S.C.; Li, T.T.; Cui, Y.H.; Zhang, X.; Bian, X.W. A novel zebrafish xenotransplantation model for study of glioma stem cell invasion. PLoS ONE 2013, 8, e61801. [Google Scholar] [CrossRef]
- Kelly, S.E.; Di Benedetto, A.; Greco, A.; Howard, C.M.; Sollars, V.E.; Primerano, D.A.; Valluri, J.V.; Claudio, P.P. Rapid selection and proliferation of CD133+ cells from cancer cell lines: Chemotherapeutic implications. PLoS ONE 2010, 5, e10035. [Google Scholar] [CrossRef] [PubMed]
- Chong, J.; Wishart, D.S.; Xia, J. Using MetaboAnalyst 4.0 for Comprehensive and Integrative Metabolomics Data Analysis. Curr. Protoc. Bioinform. 2019, 68, e86. [Google Scholar] [CrossRef] [PubMed]
- Kahlert, U.D.; Koch, K.; Suwala, A.K.; Hartmann, R.; Cheng, M.; Maciaczyk, D.; Willbold, D.; Eberhart, C.G.; Glunde, K.; Maciaczyk, J. The effect of neurosphere culture conditions on the cellular metabolism of glioma cells. Folia Neuropathol. 2015, 53, 219–225. [Google Scholar] [CrossRef]
- Garnier, D.; Renoult, O.; Alves-Guerra, M.C.; Paris, F.; Pecqueur, C. Glioblastoma Stem-Like Cells, Metabolic Strategy to Kill a Challenging Target. Front. Oncol. 2019, 9, 118. [Google Scholar] [CrossRef] [PubMed]
- Vlashi, E.; Lagadec, C.; Vergnes, L.; Matsutani, T.; Masui, K.; Poulou, M.; Popescu, R.; Della Donna, L.; Evers, P.; Dekmezian, C.; et al. Metabolic state of glioma stem cells and nontumorigenic cells. Proc. Natl. Acad. Sci. USA 2011, 108, 16062–16067. [Google Scholar] [CrossRef]
- Mao, P.; Joshi, K.; Li, J.; Kim, S.H.; Li, P.; Santana-Santos, L.; Luthra, S.; Chandran, U.R.; Benos, P.V.; Smith, L.; et al. Mesenchymal glioma stem cells are maintained by activated glycolytic metabolism involving aldehyde dehydrogenase 1A3. Proc. Natl. Acad. Sci. USA 2013, 110, 8644–8649. [Google Scholar] [CrossRef] [PubMed]
- Morfouace, M.; Lalier, L.; Oliver, L.; Cheray, M.; Pecqueur, C.; Cartron, P.F.; Vallette, F.M. Control of glioma cell death and differentiation by PKM2-Oct4 interaction. Cell Death Dis. 2014, 5, e1036. [Google Scholar] [CrossRef]
- Lane, A.N.; Fan, T.W. Regulation of mammalian nucleotide metabolism and biosynthesis. Nucleic Acids Res. 2015, 43, 2466–2485. [Google Scholar] [CrossRef] [PubMed]
- Tong, X.; Zhao, F.; Thompson, C.B. The molecular determinants of de novo nucleotide biosynthesis in cancer cells. Curr Opin Genet. Dev. 2009, 19, 32–37. [Google Scholar] [CrossRef] [PubMed]
- Becerra, A.; Lazcano, A. The role of gene duplication in the evolution of purine nucleotide salvage pathways. Orig. Life Evol. Biosph 1998, 28, 539–553. [Google Scholar] [CrossRef] [PubMed]
- Szlosarek, P.W.; Grimshaw, M.J.; Wilbanks, G.D.; Hagemann, T.; Wilson, J.L.; Burke, F.; Stamp, G.; Balkwill, F.R. Aberrant regulation of argininosuccinate synthetase by TNF-alpha in human epithelial ovarian cancer. Int. J. Cancer 2007, 121, 6–11. [Google Scholar] [CrossRef]
- Wu, M.S.; Lin, Y.S.; Chang, Y.T.; Shun, C.T.; Lin, M.T.; Lin, J.T. Gene expression profiling of gastric cancer by microarray combined with laser capture microdissection. World J. Gastroenterol. 2005, 11, 7405–7412. [Google Scholar] [CrossRef] [PubMed]
- Delage, B.; Fennell, D.A.; Nicholson, L.; McNeish, I.; Lemoine, N.R.; Crook, T.; Szlosarek, P.W. Arginine deprivation and argininosuccinate synthetase expression in the treatment of cancer. Int. J. Cancer 2010, 126, 2762–2772. [Google Scholar] [CrossRef]
- Bateman, L.A.; Ku, W.M.; Heslin, M.J.; Contreras, C.M.; Skibola, C.F.; Nomura, D.K. Argininosuccinate Synthase 1 is a Metabolic Regulator of Colorectal Cancer Pathogenicity. ACS Chem. Biol. 2017, 12, 905–911. [Google Scholar] [CrossRef]
- Dillon, B.J.; Prieto, V.G.; Curley, S.A.; Ensor, C.M.; Holtsberg, F.W.; Bomalaski, J.S.; Clark, M.A. Incidence and distribution of argininosuccinate synthetase deficiency in human cancers: A method for identifying cancers sensitive to arginine deprivation. Cancer 2004, 100, 826–833. [Google Scholar] [CrossRef] [PubMed]
- Feun, L.; You, M.; Wu, C.J.; Kuo, M.T.; Wangpaichitr, M.; Spector, S.; Savaraj, N. Arginine deprivation as a targeted therapy for cancer. Curr. Pharm. Des. 2008, 14, 1049–1057. [Google Scholar] [CrossRef]
- Syed, N.; Langer, J.; Janczar, K.; Singh, P.; Lo Nigro, C.; Lattanzio, L.; Coley, H.M.; Hatzimichael, E.; Bomalaski, J.; Szlosarek, P.; et al. Epigenetic status of argininosuccinate synthetase and argininosuccinate lyase modulates autophagy and cell death in glioblastoma. Cell Death Dis. 2013, 4, e458. [Google Scholar] [CrossRef] [PubMed]
- Qiu, F.; Chen, Y.R.; Liu, X.; Chu, C.Y.; Shen, L.J.; Xu, J.; Gaur, S.; Forman, H.J.; Zhang, H.; Zheng, S.; et al. Arginine starvation impairs mitochondrial respiratory function in ASS1-deficient breast cancer cells. Sci. Signal. 2014, 7, ra31. [Google Scholar] [CrossRef] [PubMed]
- Kobayashi, E.; Masuda, M.; Nakayama, R.; Ichikawa, H.; Satow, R.; Shitashige, M.; Honda, K.; Yamaguchi, U.; Shoji, A.; Tochigi, N.; et al. Reduced argininosuccinate synthetase is a predictive biomarker for the development of pulmonary metastasis in patients with osteosarcoma. Mol. Cancer 2010, 9, 535–544. [Google Scholar] [CrossRef]
- Allen, M.D.; Luong, P.; Hudson, C.; Leyton, J.; Delage, B.; Ghazaly, E.; Cutts, R.; Yuan, M.; Syed, N.; Lo Nigro, C.; et al. Prognostic and therapeutic impact of argininosuccinate synthetase 1 control in bladder cancer as monitored longitudinally by PET imaging. Cancer Res. 2014, 74, 896–907. [Google Scholar] [CrossRef] [PubMed]
- Nicholson, L.J.; Smith, P.R.; Hiller, L.; Szlosarek, P.W.; Kimberley, C.; Sehouli, J.; Koensgen, D.; Mustea, A.; Schmid, P.; Crook, T. Epigenetic silencing of argininosuccinate synthetase confers resistance to platinum-induced cell death but collateral sensitivity to arginine auxotrophy in ovarian cancer. Int. J. Cancer 2009, 125, 1454–1463. [Google Scholar] [CrossRef]
- Bowles, T.L.; Kim, R.; Galante, J.; Parsons, C.M.; Virudachalam, S.; Kung, H.J.; Bold, R.J. Pancreatic cancer cell lines deficient in argininosuccinate synthetase are sensitive to arginine deprivation by arginine deiminase. Int. J. Cancer. 2008, 123, 1950–1955. [Google Scholar] [CrossRef]
- Qiu, F.; Huang, J.; Sui, M. Targeting arginine metabolism pathway to treat arginine-dependent cancers. Cancer Lett. 2015, 364, 1–7. [Google Scholar] [CrossRef]
- Cao, Y.; Feng, Y.; Zhang, Y.; Zhu, X.; Jin, F. L-Arginine supplementation inhibits the growth of breast cancer by enhancing innate and adaptive immune responses mediated by suppression of MDSCs in vivo. BMC Cancer 2016, 16, 343. [Google Scholar] [CrossRef] [PubMed]
- Ma, Q.; Williamson, K.E.; O’Rourke, D.; Rowlands, B.J. The effects of l-arginine on crypt cell hyperproliferation in colorectal cancer. J. Surg. Res. 1999, 81, 181–188. [Google Scholar] [CrossRef]
- Peranzoni, E.; Marigo, I.; Dolcetti, L.; Ugel, S.; Sonda, N.; Taschin, E.; Mantelli, B.; Bronte, V.; Zanovello, P. Role of arginine metabolism in immunity and immunopathology. Immunobiology 2007, 212, 795–812. [Google Scholar] [CrossRef]
- Gaude, E.; Frezza, C. Tissue-specific and convergent metabolic transformation of cancer correlates with metastatic potential and patient survival. Nat. Commun. 2016, 7, 13041. [Google Scholar] [CrossRef]
- Rabinovich, S.; Adler, L.; Yizhak, K.; Sarver, A.; Silberman, A.; Agron, S.; Stettner, N.; Sun, Q.; Brandis, A.; Helbling, D.; et al. Diversion of aspartate in ASS1-deficient tumours fosters de novo pyrimidine synthesis. Nature 2015, 527, 379–383. [Google Scholar] [CrossRef] [PubMed]
- Kim, D.; Pertea, G.; Trapnell, C.; Pimentel, H.; Kelley, R.; Salzberg, S.L. TopHat2: Accurate alignment of transcriptomes in the presence of insertions, deletions and gene fusions. Genome Biol. 2013, 14, R36. [Google Scholar] [CrossRef] [PubMed]
- Langmead, B. Aligning short sequencing reads with Bowtie. Curr. Protoc. Bioinform. 2010, 32, 11.7.1.–11.7.14. [Google Scholar] [CrossRef] [PubMed]
- Liberzon, A.; Subramanian, A.; Pinchback, R.; Thorvaldsdottir, H.; Tamayo, P.; Mesirov, J.P. Molecular signatures database (MSigDB) 3.0. Bioinformatics 2011, 27, 1739–1740. [Google Scholar] [CrossRef]
- Subramanian, A.; Tamayo, P.; Mootha, V.K.; Mukherjee, S.; Ebert, B.L.; Gillette, M.A.; Paulovich, A.; Pomeroy, S.L.; Golub, T.R.; Lander, E.S.; et al. Gene set enrichment analysis: A knowledge-based approach for interpreting genome-wide expression profiles. Proc. Natl. Acad. Sci. USA 2005, 102, 15545–15550. [Google Scholar] [CrossRef]


Publisher’s Note: MDPI stays neutral with regard to jurisdictional claims in published maps and institutional affiliations. |
© 2021 by the authors. Licensee MDPI, Basel, Switzerland. This article is an open access article distributed under the terms and conditions of the Creative Commons Attribution (CC BY) license (http://creativecommons.org/licenses/by/4.0/).
Share and Cite
Peixoto, J.; Janaki-Raman, S.; Schlicker, L.; Schmitz, W.; Walz, S.; Winkelkotte, A.M.; Herold-Mende, C.; Soares, P.; Schulze, A.; Lima, J. Integrated Metabolomics and Transcriptomics Analysis of Monolayer and Neurospheres from Established Glioblastoma Cell Lines. Cancers 2021, 13, 1327. https://doi.org/10.3390/cancers13061327
Peixoto J, Janaki-Raman S, Schlicker L, Schmitz W, Walz S, Winkelkotte AM, Herold-Mende C, Soares P, Schulze A, Lima J. Integrated Metabolomics and Transcriptomics Analysis of Monolayer and Neurospheres from Established Glioblastoma Cell Lines. Cancers. 2021; 13(6):1327. https://doi.org/10.3390/cancers13061327
Chicago/Turabian StylePeixoto, Joana, Sudha Janaki-Raman, Lisa Schlicker, Werner Schmitz, Susanne Walz, Alina M. Winkelkotte, Christel Herold-Mende, Paula Soares, Almut Schulze, and Jorge Lima. 2021. "Integrated Metabolomics and Transcriptomics Analysis of Monolayer and Neurospheres from Established Glioblastoma Cell Lines" Cancers 13, no. 6: 1327. https://doi.org/10.3390/cancers13061327
APA StylePeixoto, J., Janaki-Raman, S., Schlicker, L., Schmitz, W., Walz, S., Winkelkotte, A. M., Herold-Mende, C., Soares, P., Schulze, A., & Lima, J. (2021). Integrated Metabolomics and Transcriptomics Analysis of Monolayer and Neurospheres from Established Glioblastoma Cell Lines. Cancers, 13(6), 1327. https://doi.org/10.3390/cancers13061327