
Candidate Markers of Olaparib Response from Genomic Data Analyses of Human Cancer Cell Lines

 ,
,  , ,
, ,
Abstract
Simple Summary
Abstract
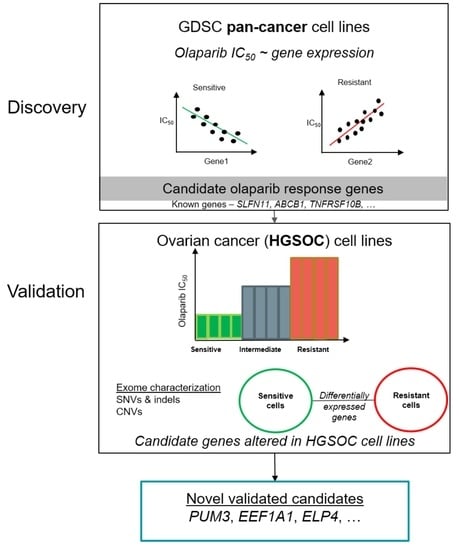
1. Introduction
2. Results
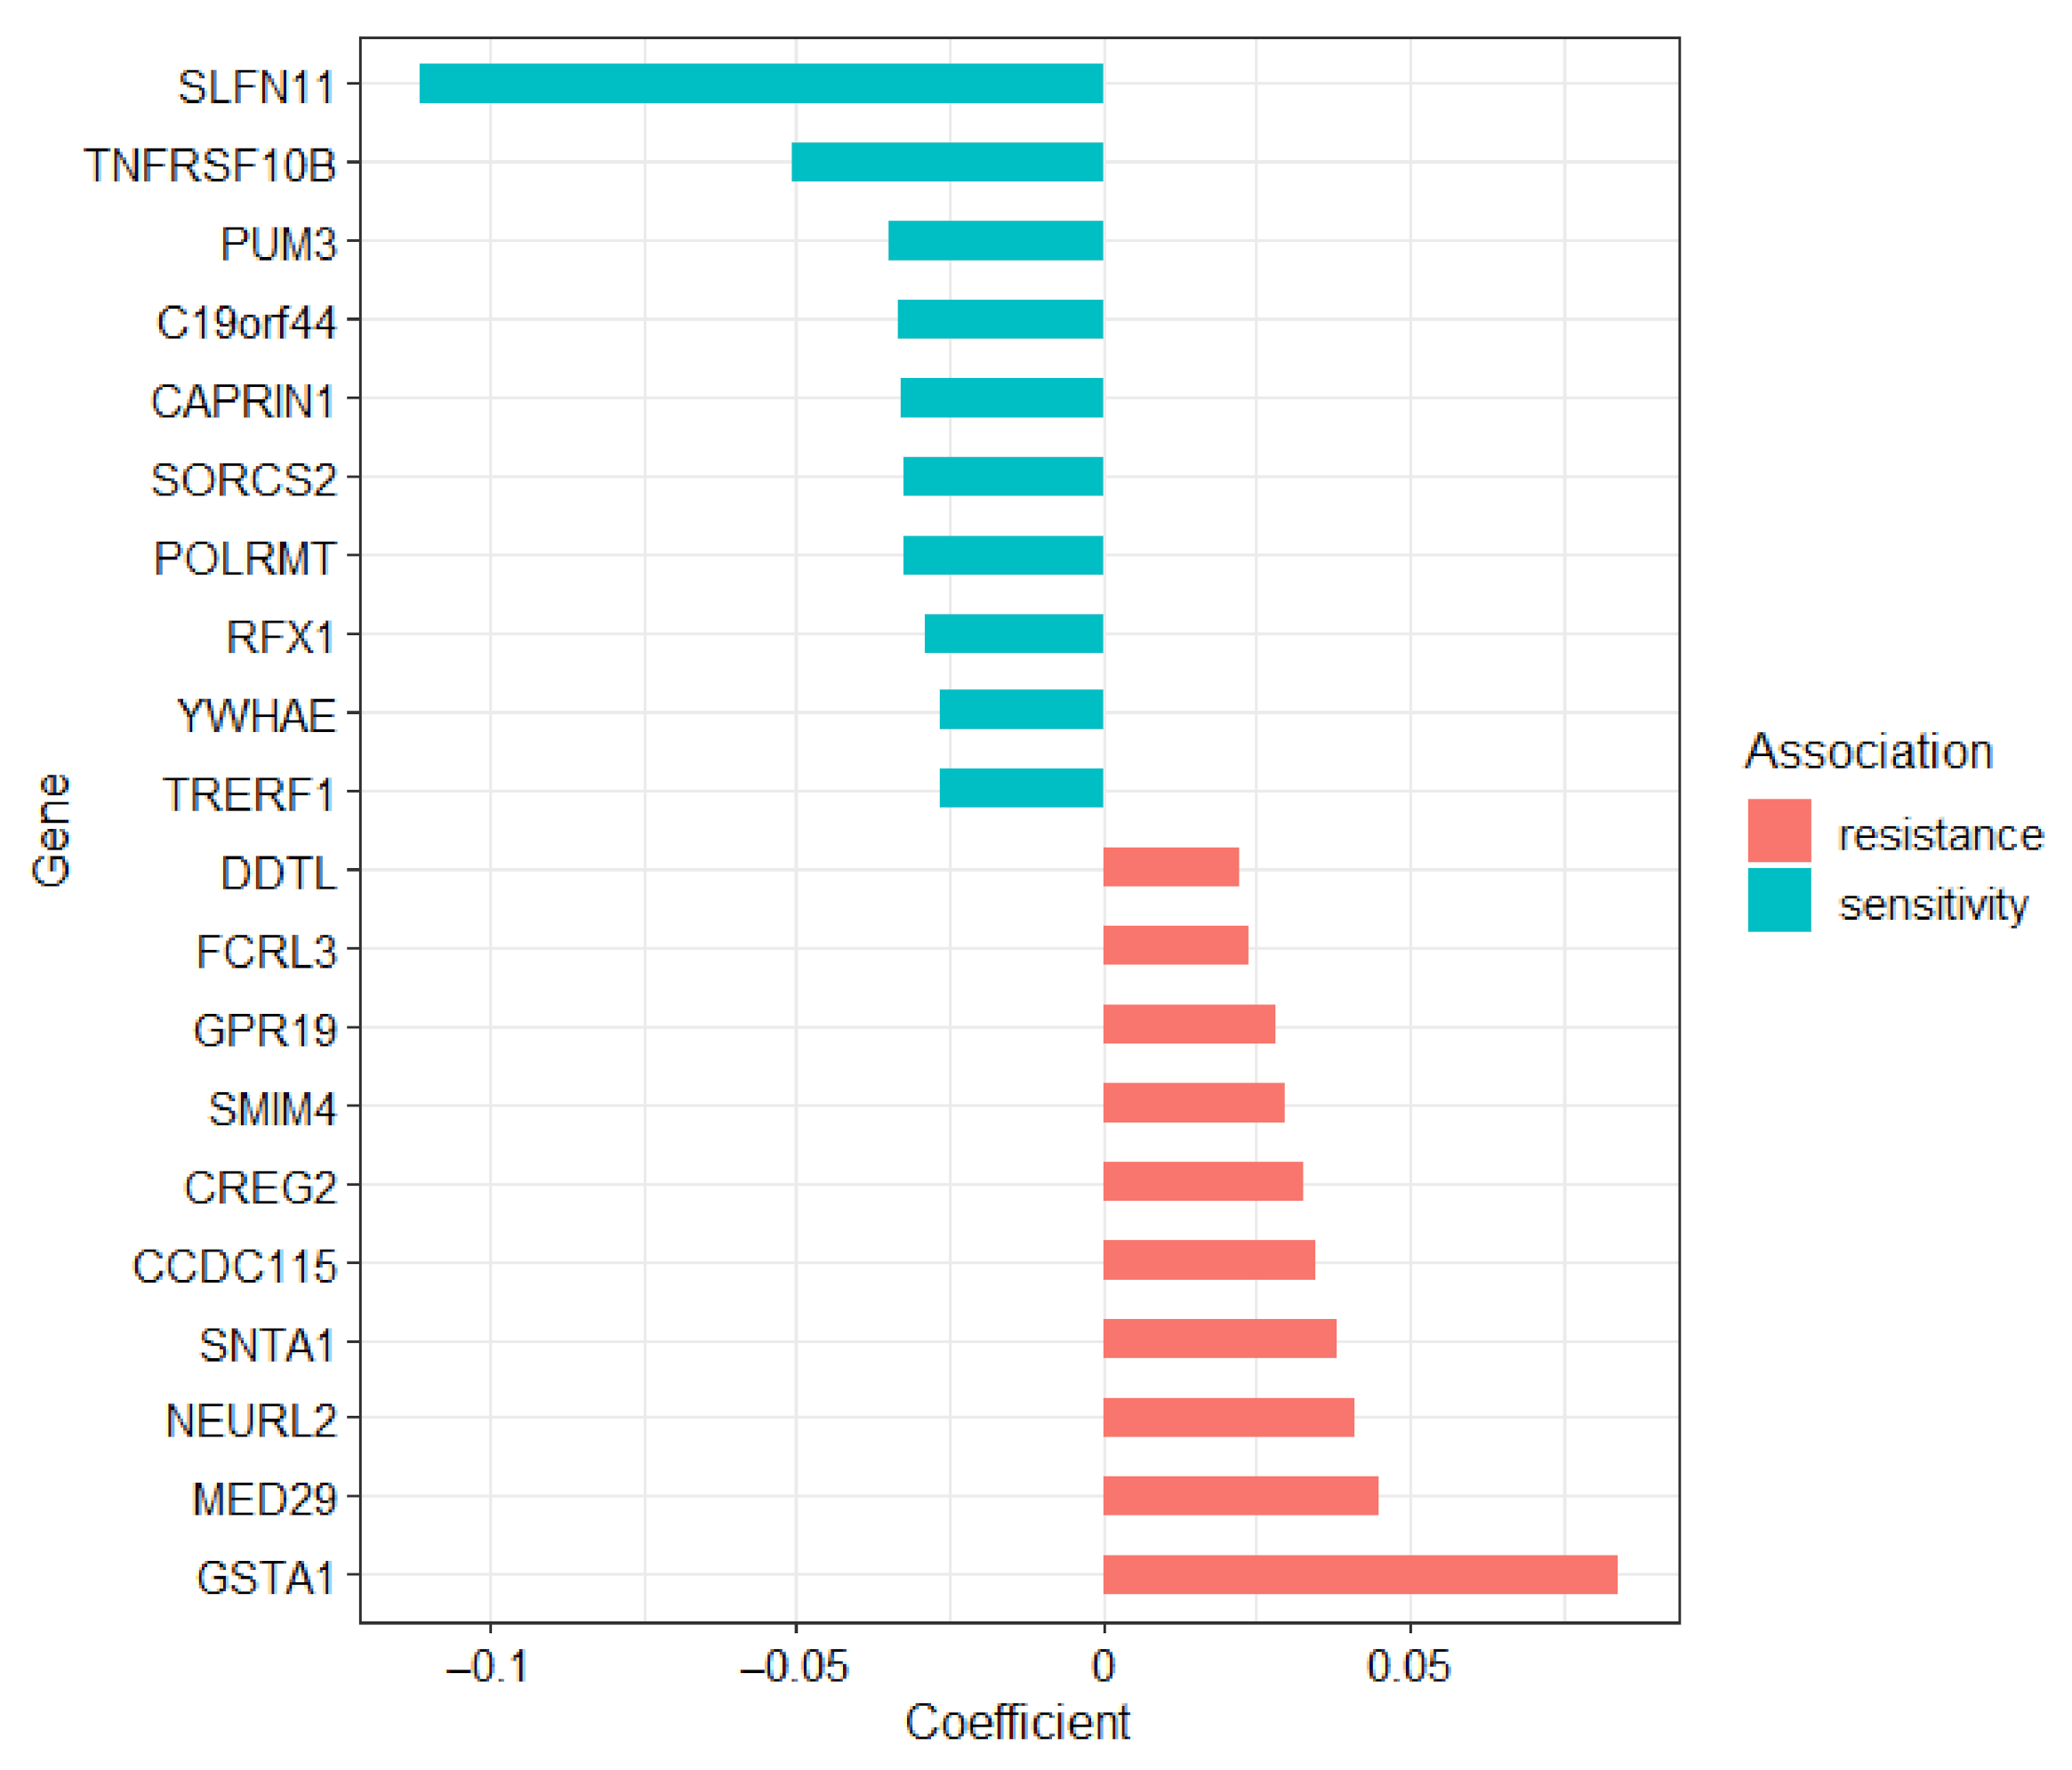
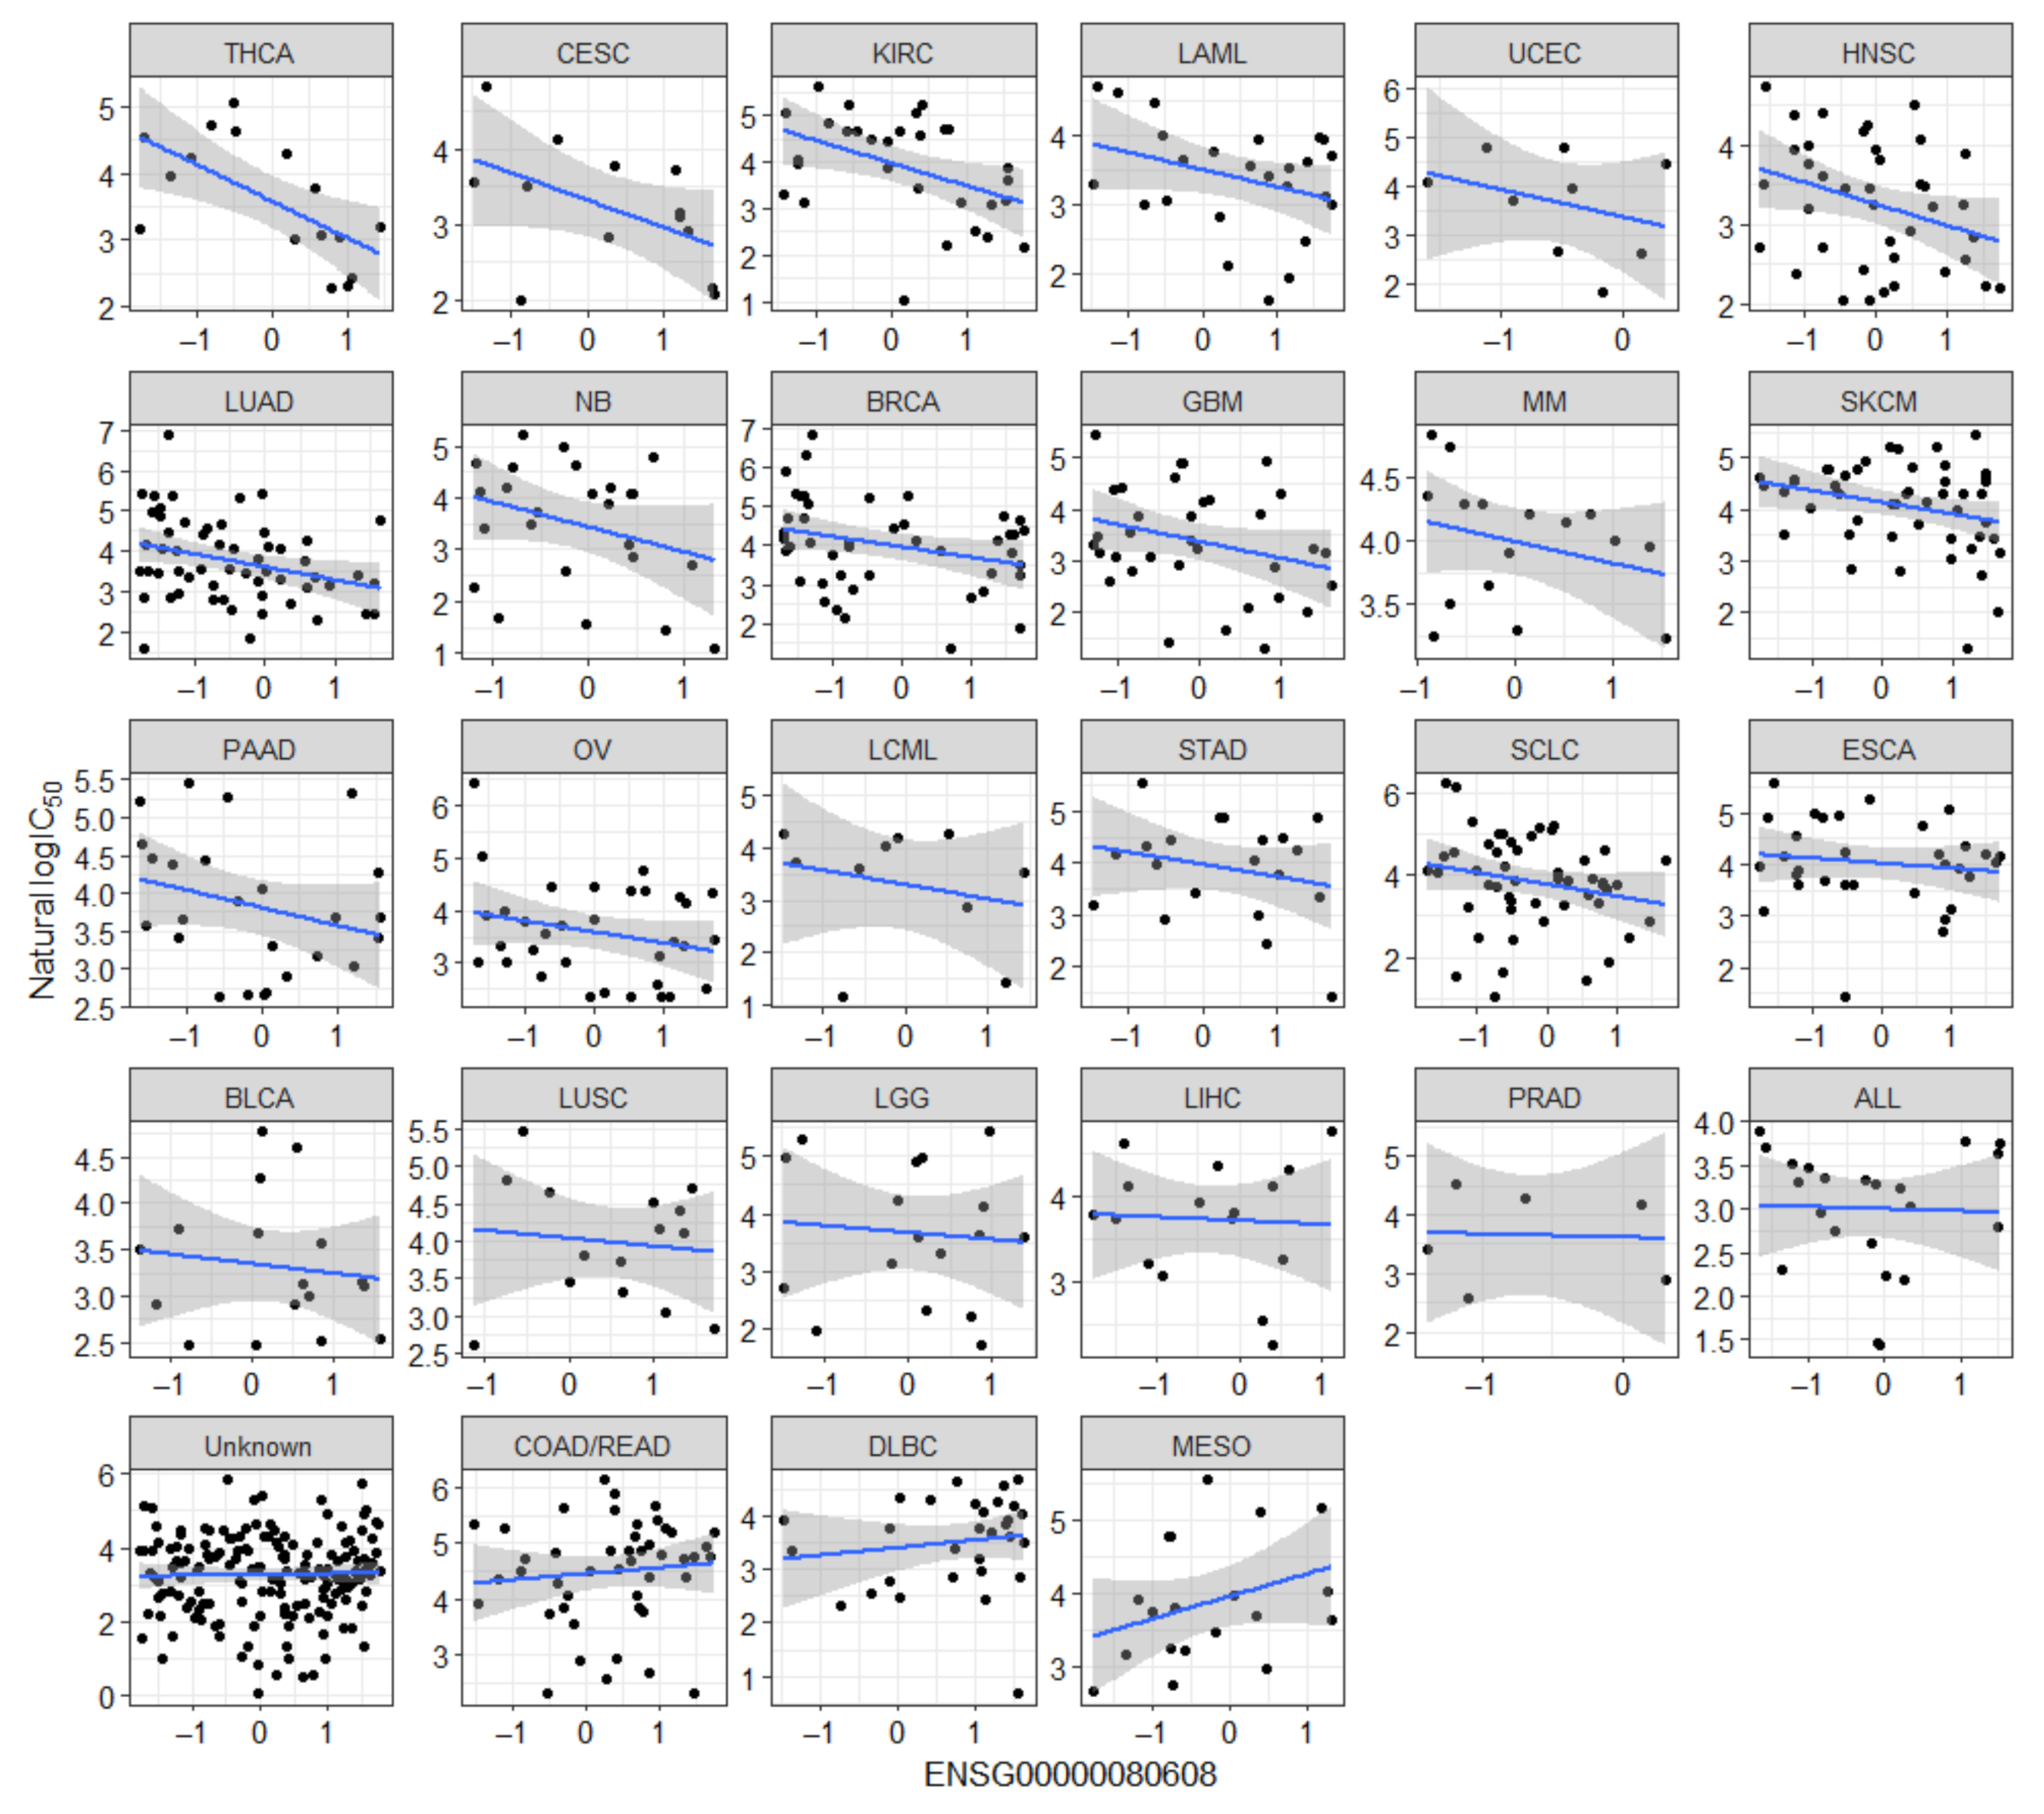
2.1. Known Markers of Olaparib Response Are among Candidate Olaparib Sensitivity and Resistance Genes
2.2. Novel Candidate Markers of Olaparib Response
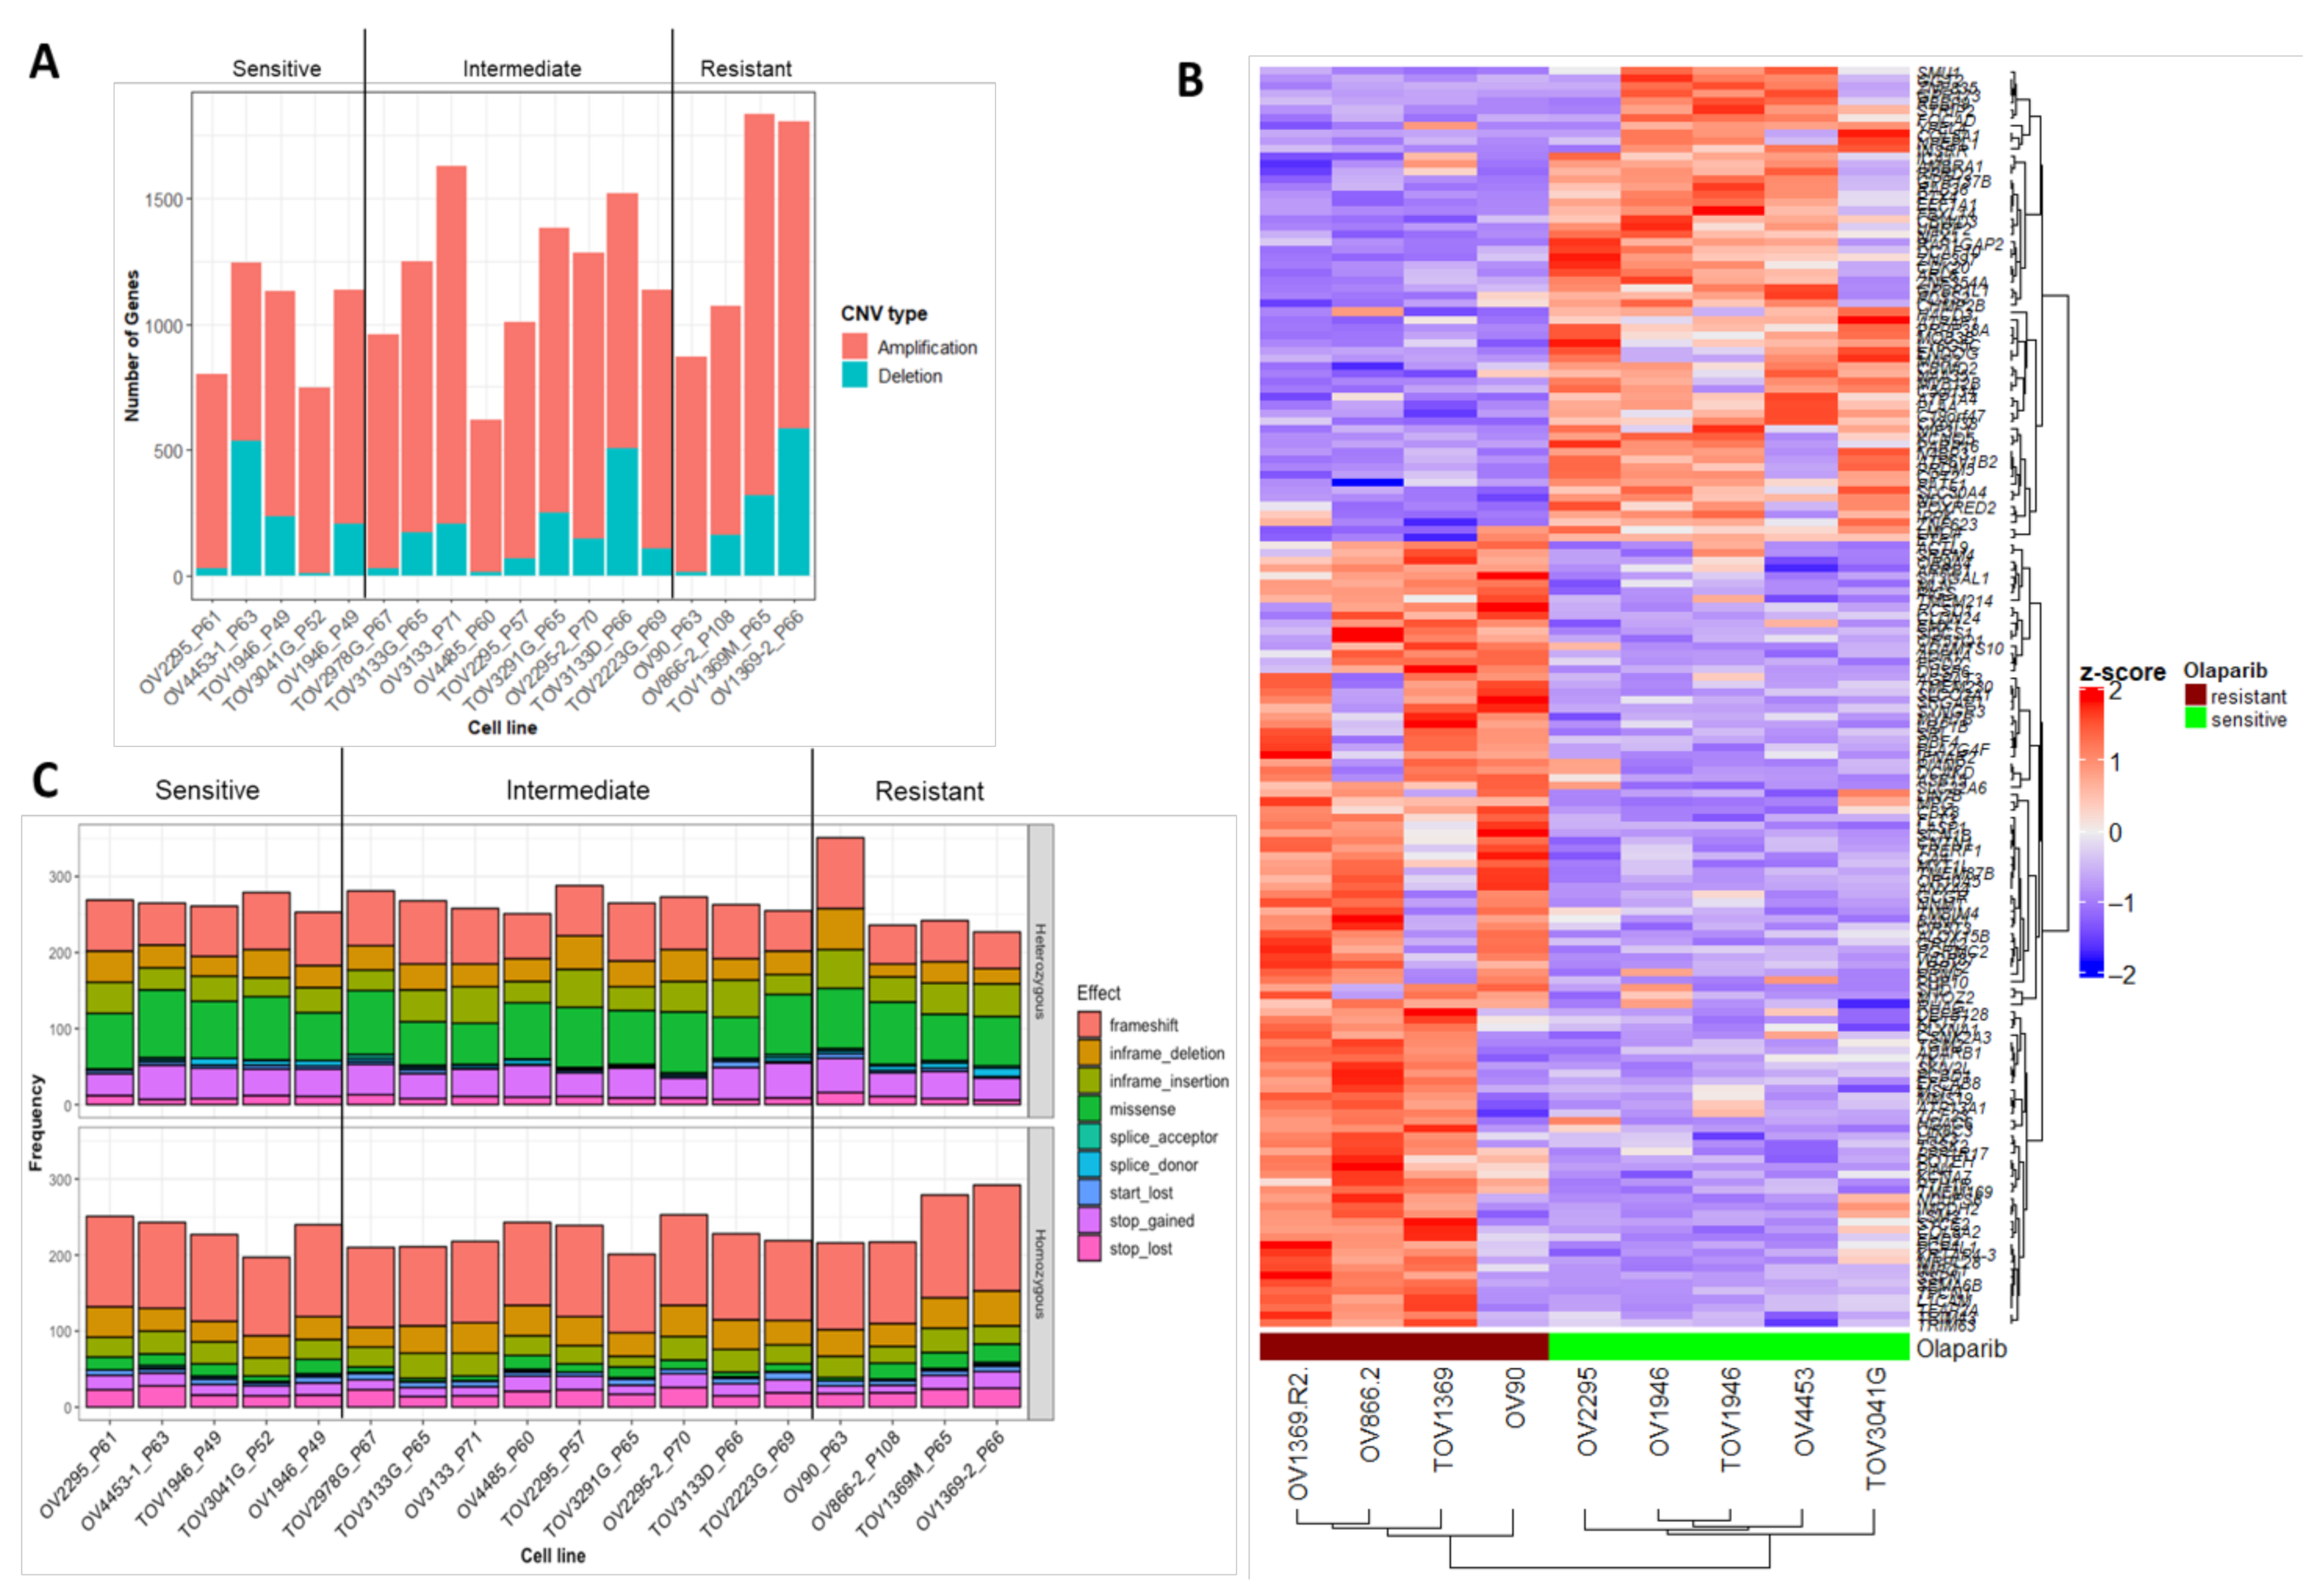
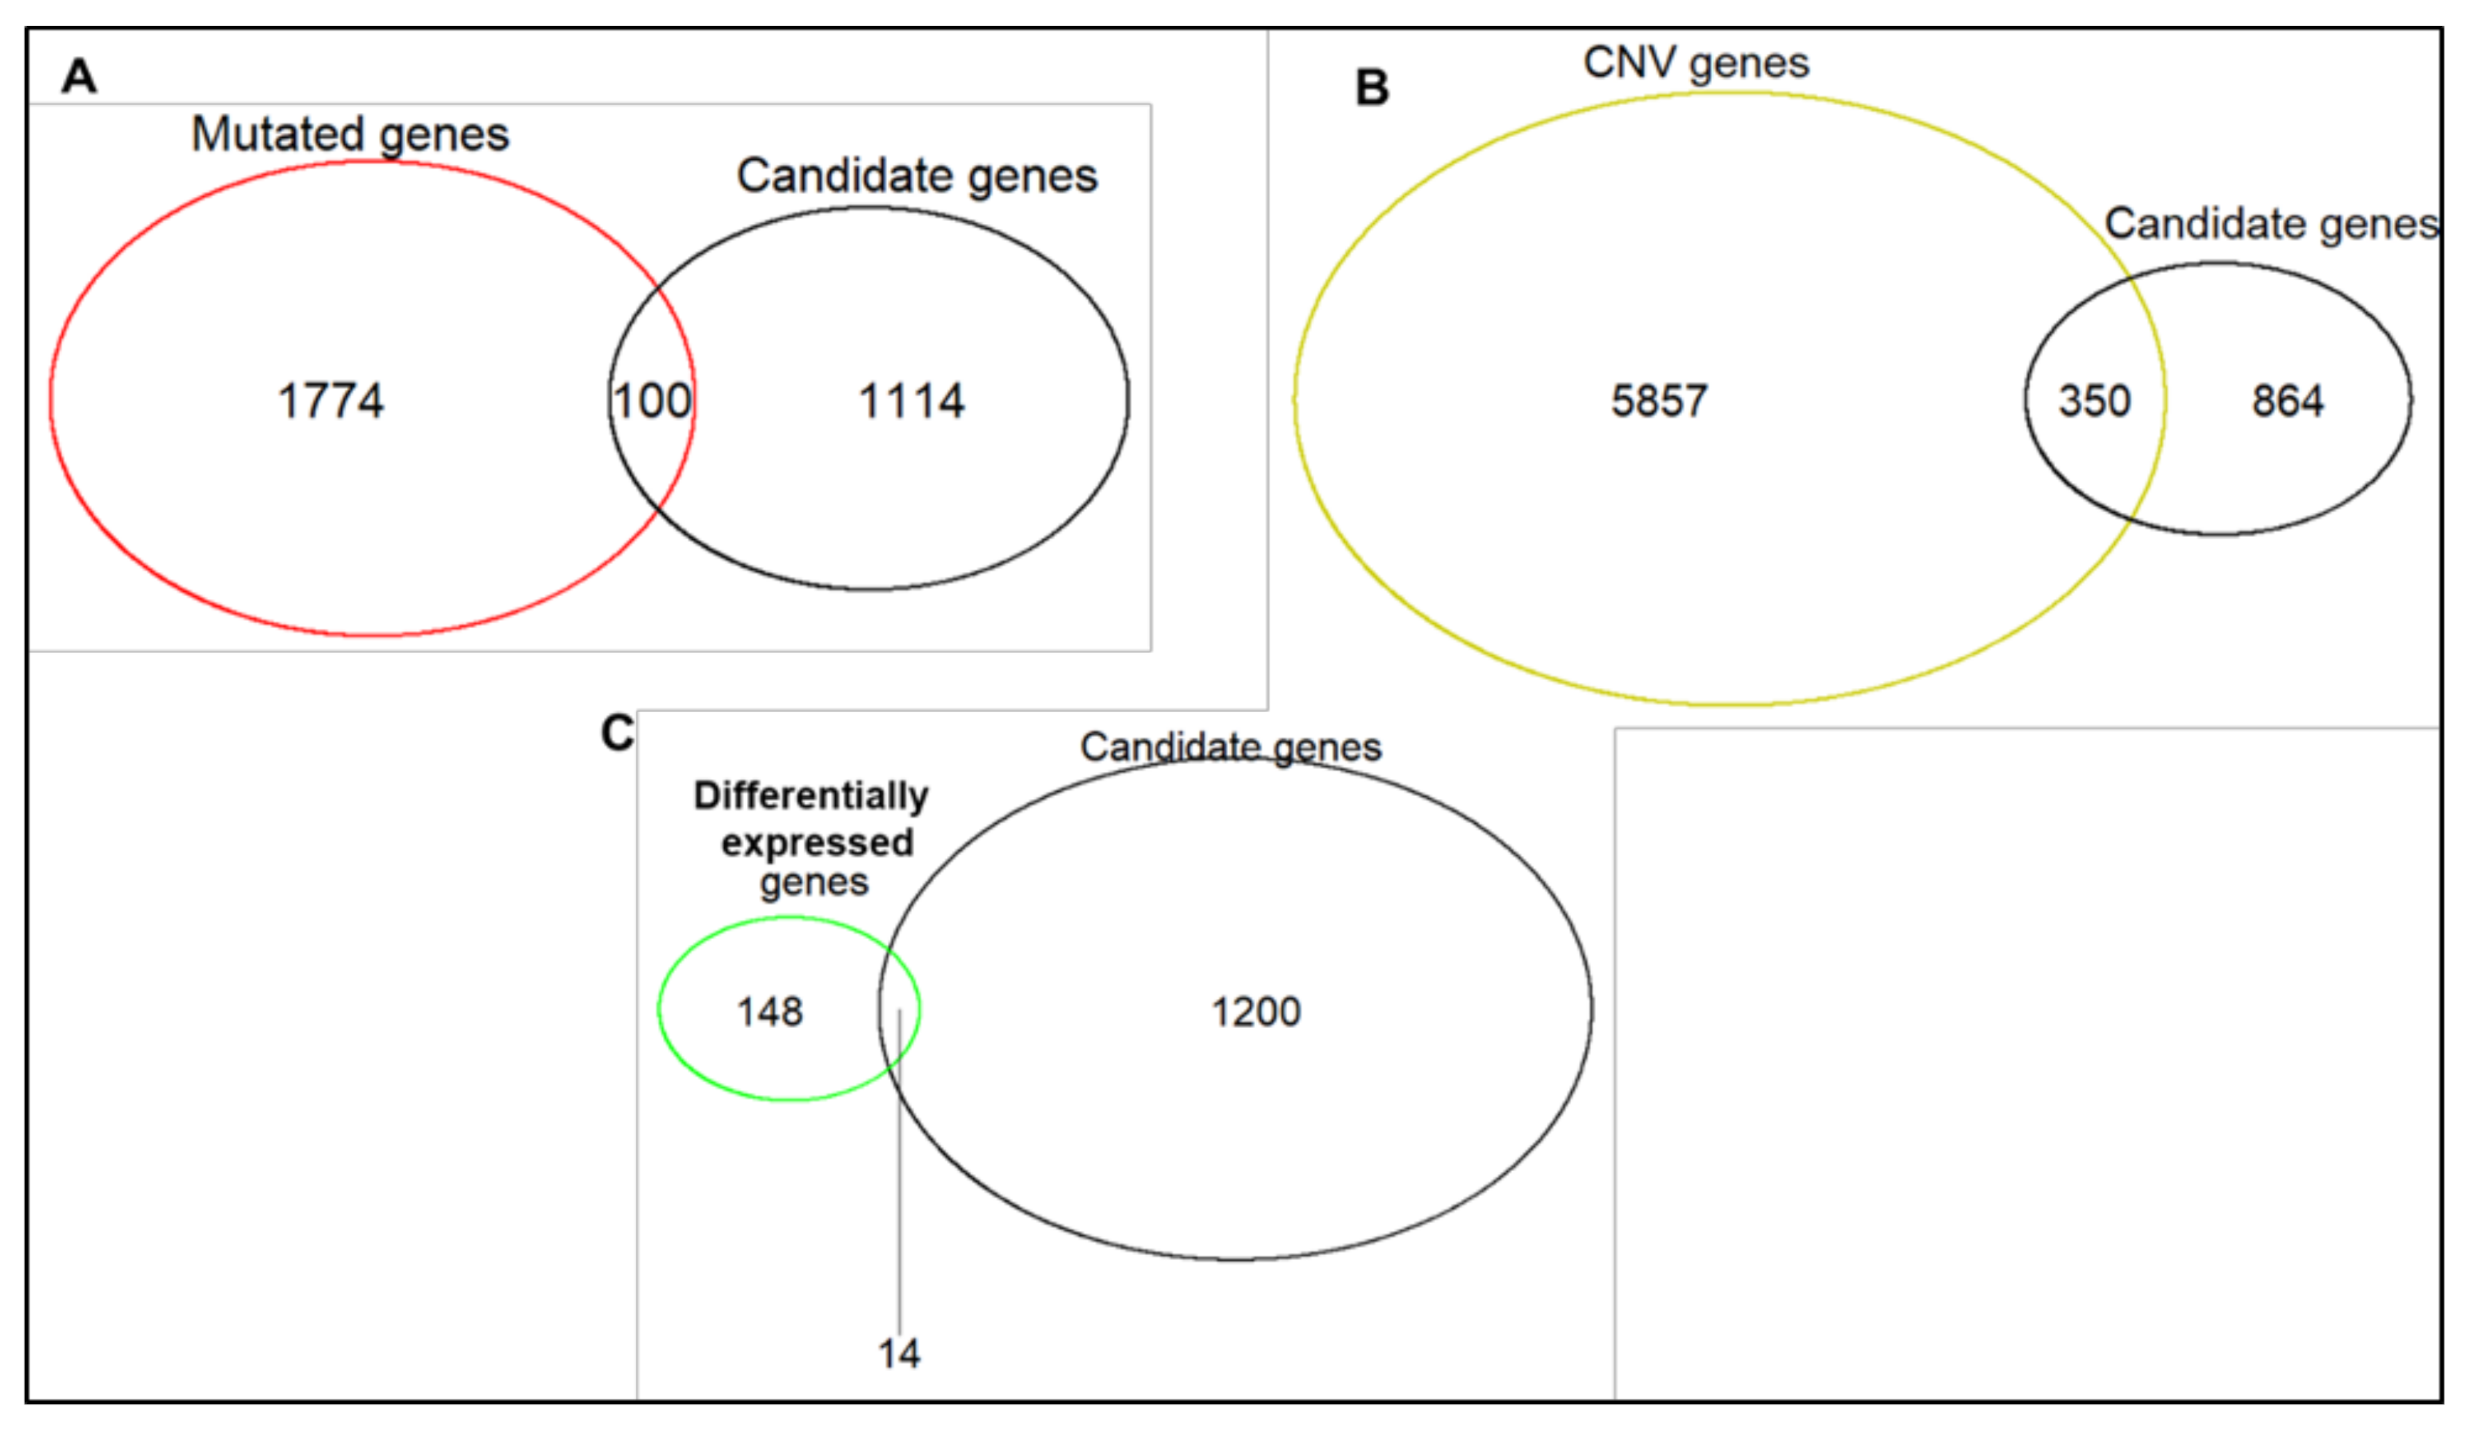
2.3. Characterization of Sequence and Copy Number Variation from Whole Exome Sequencing and Differential Gene Expression Analysis of HGSOC Cell Lines
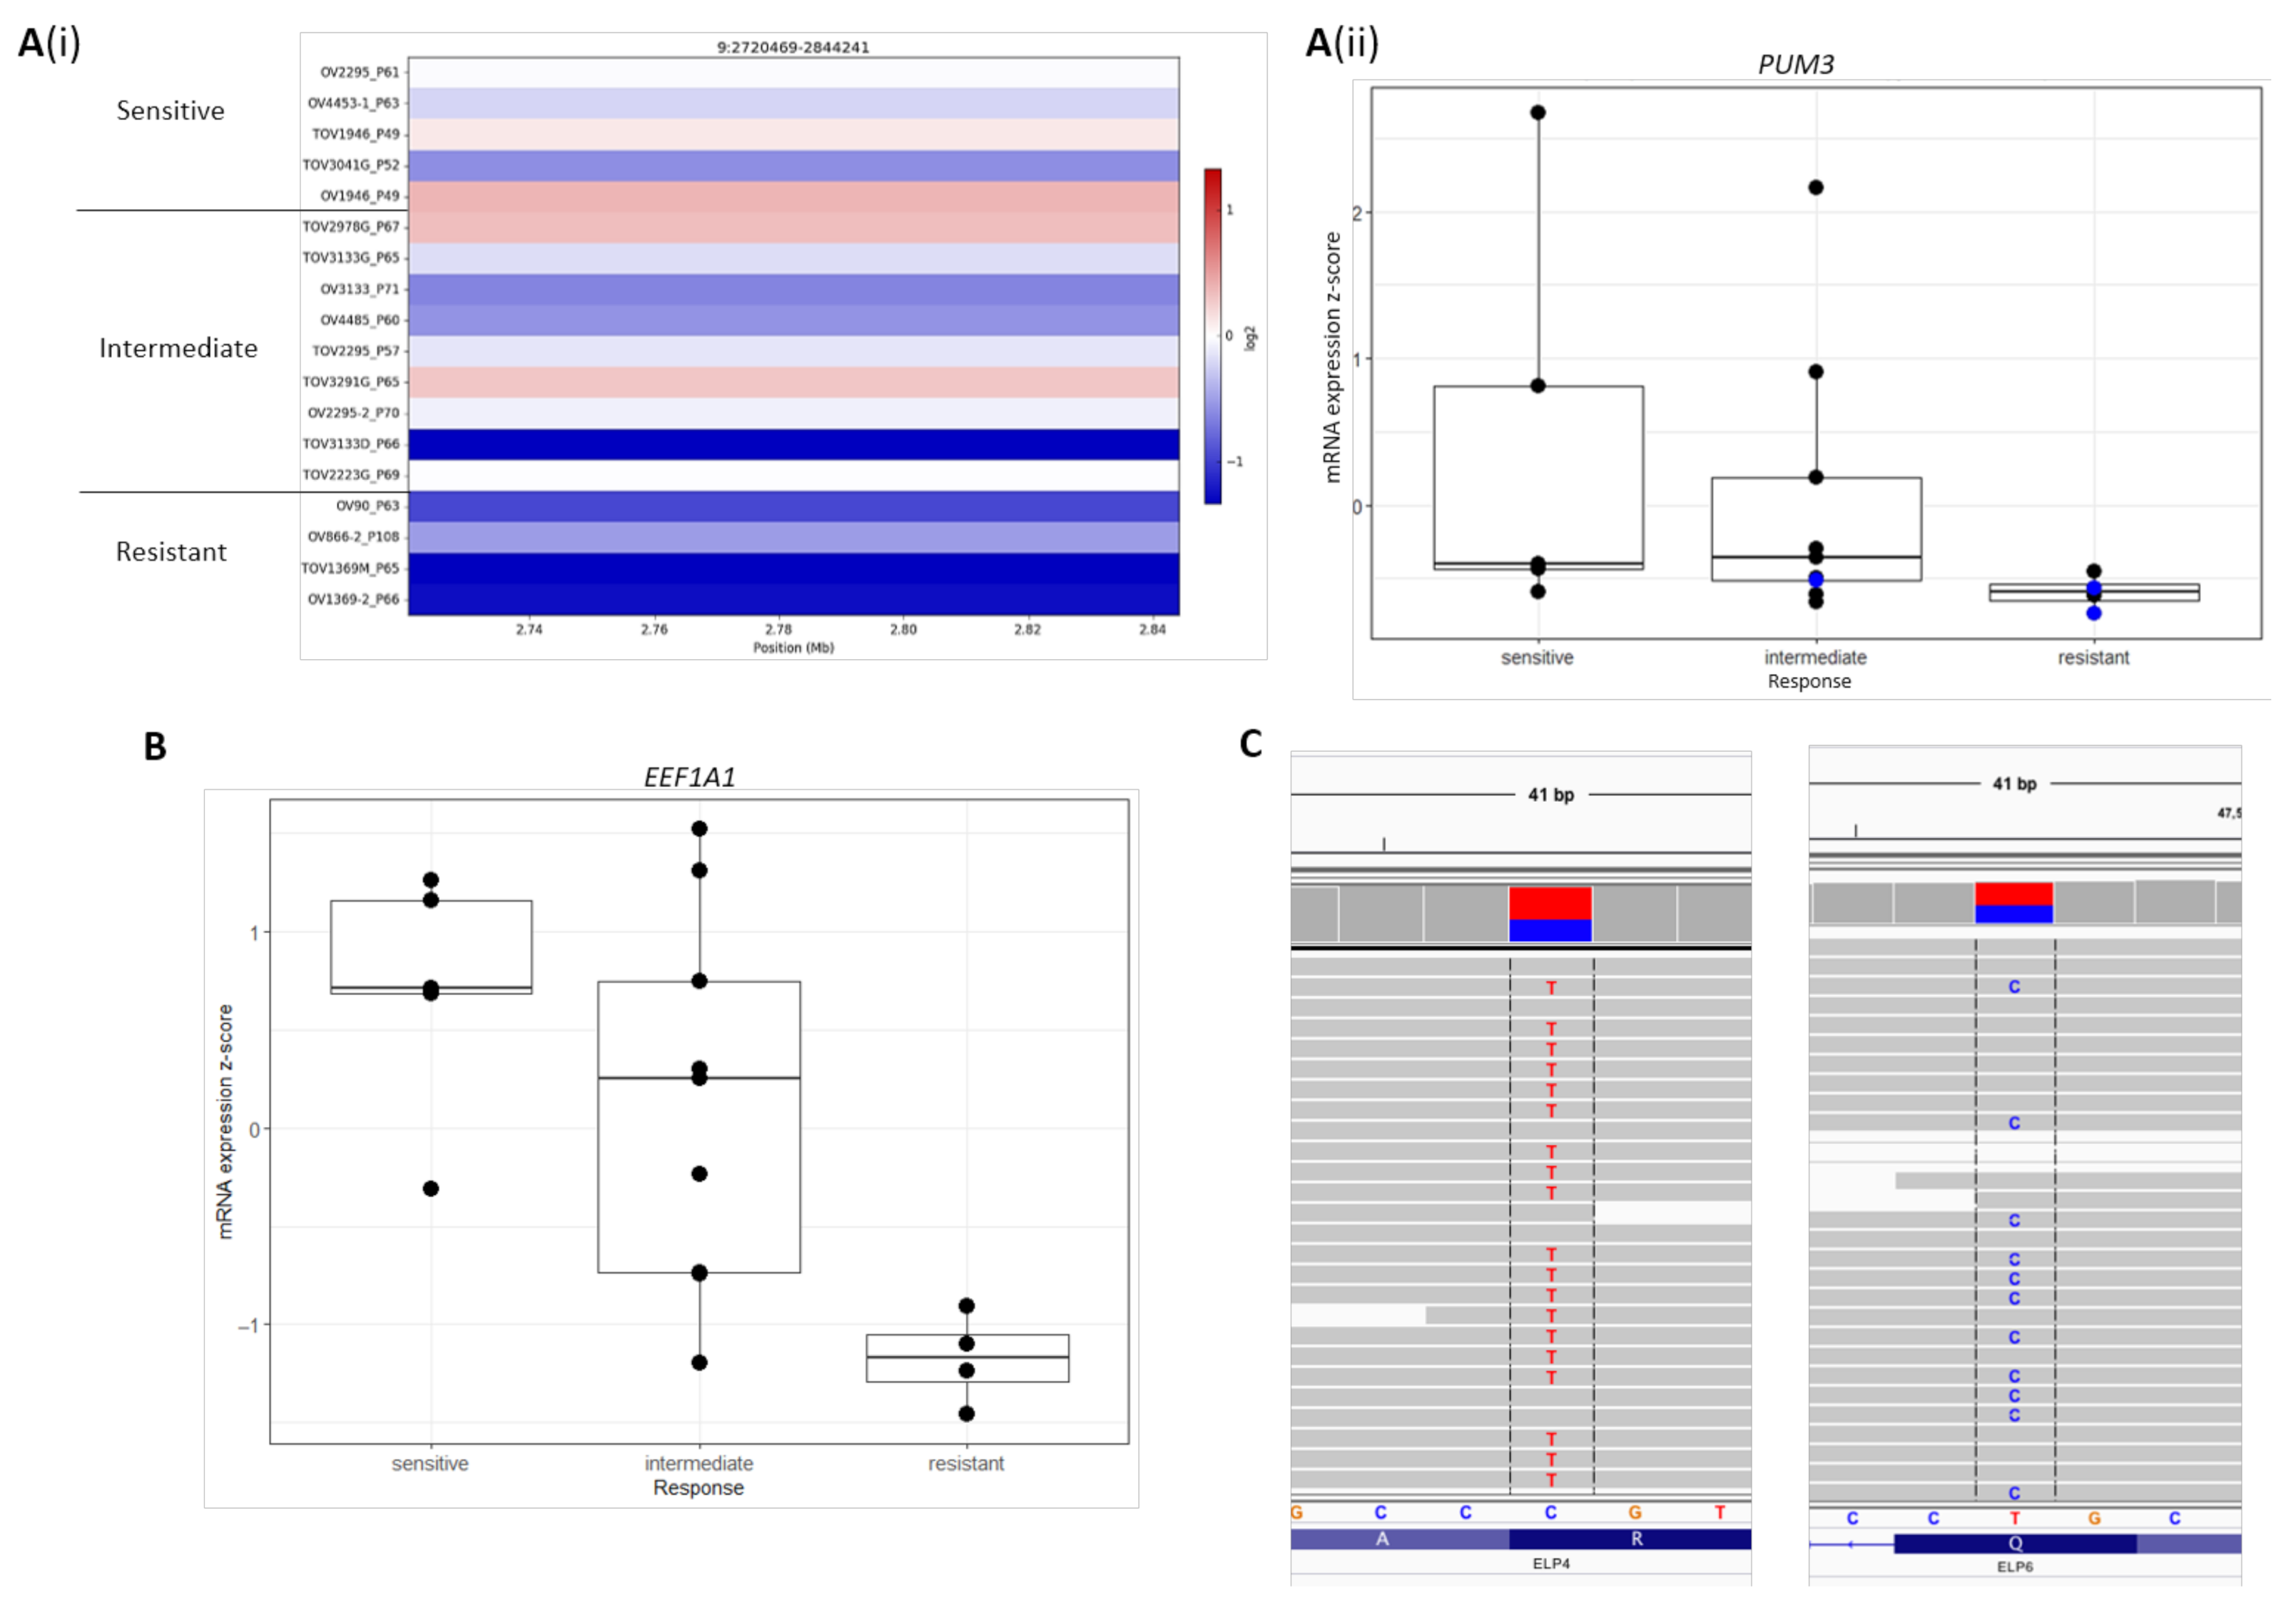
2.4. Novel Candidate Olaparib Response Genes Linked to Genomic Alterations in Independent HGSOC Cell Lines
2.5. Frequency of Genomic Alterations Involving Candidate Olaparib Response Genes in the Cancer Genome Atlas (TCGA) EOC Cases
3. Discussion
4. Materials and Methods
4.1. Data Description and Linear Regression Analyses
4.2. Exome Characterization and Differential Gene Expression Analysis of 18 HGSOC Cell Lines Previously Screened for In Vitro Olaparib Response
4.3. Exome Sequencing, Read Mapping and Variant Calling
4.4. Filtering and Prioritization of SNVs and Indels
4.5. Copy Number Variation Analysis
4.6. Differential Gene Expression Analysis
4.7. Mutational Signature Analysis
5. Conclusions
Supplementary Materials
Author Contributions
Funding
Institutional Review Board Statement
Informed Consent Statement
Data Availability Statement
Acknowledgments
Conflicts of Interest
References
- Ashworth, A. A synthetic lethal therapeutic approach: Poly(ADP) ribose polymerase inhibitors for the treatment of cancers deficient in DNA double-strand break repair. J. Clin. Oncol. 2008, 3785–3790. [Google Scholar] [CrossRef]
- Farmer, H.; McCabe, N.; Lord, C.J.; Tutt, A.N.J.; Johnson, D.A.; Richardson, T.B.; Santarosa, M.; Dillon, K.J.; Hickson, I.; Knights, C.; et al. Targeting the DNA repair defect in BRCA mutant cells as a therapeutic strategy. Nature 2005, 434, 917–921. [Google Scholar] [CrossRef]
- Bryant, H.E.; Schultz, N.; Thomas, H.D.; Parker, K.M.; Flower, D.; Lopez, E.; Kyle, S.; Meuth, M.; Curtin, N.J.; Helleday, T. Specific killing of BRCA2-deficient tumours with inhibitors of poly(ADP-ribose) polymerase. Nature 2005, 434, 913–917. [Google Scholar] [CrossRef] [PubMed]
- Murai, J.; Huang, S.N.; Das, B.B.; Renaud, A.; Zhang, Y.; Doroshow, J.H.; Ji, J.; Takeda, S.; Pommier, Y. Trapping of PARP1 and PARP2 by Clinical PARP Inhibitors. Cancer Res. 2012, 72, 5588–5599. [Google Scholar] [CrossRef] [PubMed]
- Ledermann, J.; Harter, P.; Gourley, C.; Friedlander, M.; Vergote, I.; Rustin, G.; Scott, C.; Meier, W.; Shapira-Frommer, R.; Safra, T.; et al. Olaparib Maintenance Therapy in Platinum-Sensitive Relapsed Ovarian Cancer. N. Engl. J. Med. 2012, 366, 1382–1392. [Google Scholar] [CrossRef] [PubMed]
- Moore, K.; Colombo, N.; Scambia, G.; Kim, B.-G.; Oaknin, A.; Friedlander, M.; Lisyanskaya, A.; Floquet, A.; Leary, A.; Sonke, G.S.; et al. Maintenance Olaparib in Patients with Newly Diagnosed Advanced Ovarian Cancer. N. Engl. J. Med. 2018, 379, 2495–2505. [Google Scholar] [CrossRef]
- The Cancer Genome Atlas Research Network (TCGAR). Integrated genomic analyses of ovarian carcinoma. Nature 2011, 474, 609–615. [Google Scholar] [CrossRef]
- Konstantinopoulos, P.A.; Ceccaldi, R.; Shapiro, G.I.; D’Andrea, A.D. Homologous Recombination Deficiency: Exploiting the Fundamental Vulnerability of Ovarian Cancer. Cancer Discov. 2015, 5, 1137–1154. [Google Scholar] [CrossRef]
- Hennessy, B.T.J.; Timms, K.M.; Carey, M.S.; Gutin, A.; Meyer, L.A.; Flake, D.D.; Abkevich, V.; Potter, J.; Pruss, D.; Glenn, P.; et al. Somatic mutations in BRCA1 and BRCA2 could expand the number of patients that benefit from poly (ADP ribose) polymerase inhibitors in ovarian cancer. J. Clin. Oncol. 2010, 28, 3570–3576. [Google Scholar] [CrossRef]
- Alsop, K.; Fereday, S.; Meldrum, C.; DeFazio, A.; Emmanuel, C.; George, J.; Dobrovic, A.; Birrer, M.J.; Webb, P.M.; Stewart, C.; et al. BRCA mutation frequency and patterns of treatment response in BRCA mutation-positive women with ovarian cancer: A report from the Australian ovarian cancer study group. J. Clin. Oncol. 2012, 30, 2654–2663. [Google Scholar] [CrossRef]
- Pal, T.; Permuth-Wey, J.; Betts, J.A.; Krischer, J.P.; Fiorica, J.; Arango, H.; LaPolla, J.; Hoffman, M.; Martino, M.A.; Wakeley, K.; et al. BRCA1 and BRCA2 mutations account for a large proportion of ovarian carcinoma cases. Cancer 2005, 104, 2807–2816. [Google Scholar] [CrossRef] [PubMed]
- Bowtell, D.D.; Böhm, S.; Ahmed, A.A.; Aspuria, P.-J.; Bast, R.C.; Beral, V.; Berek, J.S.; Birrer, M.J.; Blagden, S.; Bookman, M.A.; et al. Rethinking ovarian cancer II: Reducing mortality from high-grade serous ovarian cancer. Nat. Rev. Cancer 2015, 15, 668–679. [Google Scholar] [CrossRef] [PubMed]
- Le Page, C.; Amuzu, S.; Rahimi, K.; Gotlieb, W.; Ragoussis, J.; Tonin, P.N. Lessons learned from understanding chemotherapy resistance in epithelial tubo-ovarian carcinoma from BRCA1 and BRCA2 mutation carriers. Semin. Cancer Biol. 2020. [Google Scholar] [CrossRef] [PubMed]
- McCabe, N.; Turner, N.C.; Lord, C.J.; Kluzek, K.; Białkowska, A.; Swift, S.; Giavara, S.; O’Connor, M.J.; Tutt, A.N.; Zdzienicka, M.Z.; et al. Deficiency in the Repair of DNA Damage by Homologous Recombination and Sensitivity to Poly(ADP-Ribose) Polymerase Inhibition. Cancer Res. 2006, 66, 8109–8115. [Google Scholar] [CrossRef] [PubMed]
- Lord, C.J.; McDonald, S.; Swift, S.; Turner, N.C.; Ashworth, A. A high-throughput RNA interference screen for DNA repair determinants of PARP inhibitor sensitivity. DNA Repair 2008, 7, 2010–2019. [Google Scholar] [CrossRef]
- Horton, J.K.; Stefanick, D.F.; Prasad, R.; Gassman, N.R.; Kedar, P.S.; Wilson, S.H. Base Excision Repair Defects Invoke Hypersensitivity to PARP Inhibition. Mol. Cancer Res. 2014, 12, 1128–1139. [Google Scholar] [CrossRef]
- Fleury, H.; Carmona, E.; Morin, V.G.; Meunier, L.; Masson, J.-Y.; Tonin, P.N.; Provencher, D.; Mes-Masson, A.-M. Cumulative defects in DNA repair pathways drive the PARP inhibitor response in high-grade serous epithelial ovarian cancer cell lines. Oncotarget 2017, 8, 40152–40168. [Google Scholar] [CrossRef]
- Ray Chaudhuri, A.; Callen, E.; Ding, X.; Gogola, E.; Duarte, A.A.; Lee, J.-E.; Wong, N.; Lafarga, V.; Calvo, J.A.; Panzarino, N.J.; et al. Replication fork stability confers chemoresistance in BRCA-deficient cells. Nature 2016, 535, 382–387. [Google Scholar] [CrossRef]
- Rondinelli, B.; Gogola, E.; Yücel, H.; Duarte, A.A.; van de Ven, M.; van der Sluijs, R.; Konstantinopoulos, P.A.; Jonkers, J.; Ceccaldi, R.; Rottenberg, S.; et al. EZH2 promotes degradation of stalled replication forks by recruiting MUS81 through histone H3 trimethylation. Nat. Cell Biol. 2017, 19, 1371–1378. [Google Scholar] [CrossRef]
- Bajrami, I.; Frankum, J.R.; Konde, A.; Miller, R.E.; Rehman, F.L.; Brough, R.; Campbell, J.; Sims, D.; Rafiq, R.; Hooper, S.; et al. Genome-wide Profiling of Genetic Synthetic Lethality Identifies CDK12 as a Novel Determinant of PARP1/2 Inhibitor Sensitivity. Cancer Res. 2014, 74, 287–297. [Google Scholar] [CrossRef]
- Murai, J.; Feng, Y.; Yu, G.K.; Ru, Y.; Tang, S.-W.; Shen, Y.; Pommier, Y.; Murai, J.; Feng, Y.; Yu, G.K.; et al. Resistance to PARP inhibitors by SLFN11 inactivation can be overcome by ATR inhibition. Oncotarget 2016, 7, 76534–76550. [Google Scholar] [CrossRef]
- Krishnakumar, R.; Gamble, M.J.; Frizzell, K.M.; Berrocal, J.G.; Kininis, M.; Kraus, W.L. Reciprocal binding of PARP-1 and histone H1 at promoters specifies transcriptional outcomes. Science 2008, 319, 819–821. [Google Scholar] [CrossRef]
- Stilmann, M.; Hinz, M.; Arslan, S.Ç.; Zimmer, A.; Schreiber, V.; Scheidereit, C. A Nuclear Poly(ADP-Ribose)-Dependent Signalosome Confers DNA Damage-Induced IκB Kinase Activation. Mol. Cell 2009, 36, 365–378. [Google Scholar] [CrossRef] [PubMed]
- Rajesh, M.; Mukhopadhyay, P.; Godlewski, G.; Bátkai, S.; Haskó, G.; Liaudet, L.; Pacher, P. Poly(ADP-ribose)polymerase inhibition decreases angiogenesis. Biochem. Biophys. Res. Commun. 2006, 350, 1056–1062. [Google Scholar] [CrossRef] [PubMed]
- Wei, W.; Li, Y.; Lv, S.; Zhang, C.; Tian, Y. PARP-1 may be involved in angiogenesis in epithelial ovarian cancer. Oncol. Lett. 2016, 12, 4561–4567. [Google Scholar] [CrossRef]
- Yang, W.; Soares, J.; Greninger, P.; Edelman, E.J.; Lightfoot, H.; Forbes, S.; Bindal, N.; Beare, D.; Smith, J.A.; Thompson, I.R.; et al. Genomics of Drug Sensitivity in Cancer (GDSC): A resource for therapeutic biomarker discovery in cancer cells. Nucleic Acids Res. 2012, 41, D955–D961. [Google Scholar] [CrossRef] [PubMed]
- Lounis, H.; Provencher, D.; Godbout, C.; Fink, D.; Milot, M.-J.; Mes-Masson, A.-M. Primary Cultures of Normal and Tumoral Human Ovarian Epithelium: A Powerful Tool for Basic Molecular Studies. Exp. Cell Res. 1994, 215, 303–309. [Google Scholar] [CrossRef]
- Ouellet, V.; Zietarska, M.; Portelance, L.; Lafontaine, J.; Madore, J.; Puiffe, M.-L.; Arcand, S.L.; Shen, Z.; Hébert, J.; Tonin, P.N.; et al. Characterization of three new serous epithelial ovarian cancer cell lines. BMC Cancer 2008, 8, 152. [Google Scholar] [CrossRef]
- Fleury, H.; Communal, L.; Carmona, E.; Portelance, L.; Arcand, S.L.; Rahimi, K.; Tonin, P.N.; Provencher, D.; Mes-Masson, A.-M. Novel high-grade serous epithelial ovarian cancer cell lines that reflect the molecular diversity of both the sporadic and hereditary disease. Genes Cancer 2015, 6, 378–398. [Google Scholar] [CrossRef]
- Létourneau, I.J.; Quinn, M.C.J.; Wang, L.L.; Portelance, L.; Caceres, K.Y.; Cyr, L.; Delvoye, N.; Meunier, L.; de Ladurantaye, M.; Shen, Z.; et al. Derivation and characterization of matched cell lines from primary and recurrent serous ovarian cancer. BMC Cancer 2012, 12, 379. [Google Scholar] [CrossRef]
- Wang, A.; Schneider-Broussard, R.; Kumar, A.P.; MacLeod, M.C.; Johnson, D.G. Regulation of BRCA1 expression by the Rb-E2F pathway. J. Biol. Chem. 2000, 275, 4532–4536. [Google Scholar] [CrossRef] [PubMed]
- Ishida, S.; Huang, E.; Zuzan, H.; Spang, R.; Leone, G.; West, M.; Nevins, J.R. Role for E2F in Control of Both DNA Replication and Mitotic Functions as Revealed from DNA Microarray Analysis. Mol. Cell. Biol. 2001, 21, 4684–4699. [Google Scholar] [CrossRef] [PubMed]
- Meng, X.W.; Koh, B.D.; Zhang, J.-S.; Flatten, K.S.; Schneider, P.A.; Billadeau, D.D.; Hess, A.D.; Smith, B.D.; Karp, J.E.; Kaufmann, S.H. Poly(ADP-ribose) Polymerase Inhibitors Sensitize Cancer Cells to Death Receptor-mediated Apoptosis by Enhancing Death Receptor Expression. J. Biol. Chem. 2014, 289, 20543. [Google Scholar] [CrossRef]
- Zou, M.; Hu, X.; Xu, B.; Tong, T.; Jing, Y.; Xi, L.; Zhou, W.; Lu, J.; Wang, X.; Yang, X.; et al. Glutathione S-transferase isozyme alpha 1 is predominantly involved in the cisplatin resistance of common types of solid cancer. Oncol. Rep. 2018, 41, 989–998. [Google Scholar] [CrossRef] [PubMed]
- Vaidyanathan, A.; Sawers, L.; Gannon, A.-L.; Chakravarty, P.; Scott, A.L.; Bray, S.E.; Ferguson, M.J.; Smith, G. ABCB1 (MDR1) induction defines a common resistance mechanism in paclitaxel- and olaparib-resistant ovarian cancer cells. Br. J. Cancer 2016, 115, 431–441. [Google Scholar] [CrossRef]
- Rottenberg, S.; Jaspers, J.E.; Kersbergen, A.; van der Burg, E.; Nygren, A.O.H.; Zander, S.A.L.; Derksen, P.W.B.; de Bruin, M.; Zevenhoven, J.; Lau, A.; et al. High sensitivity of BRCA1-deficient mammary tumors to the PARP inhibitor AZD2281 alone and in combination with platinum drugs. Proc. Natl. Acad. Sci. USA 2008, 105, 17079–17084. [Google Scholar] [CrossRef]
- Frankum, J.; Moudry, P.; Brough, R.; Hodny, Z.; Ashworth, A.; Bartek, J.; Lord, C.J. Complementary Genetic Screens Identify the E3 Ubiquitin Ligase CBLC, as a Modifier of PARP Inhibitor Sensitivity. Oncotarget 2015, 6, 10746–10758. [Google Scholar] [CrossRef]
- Chang, H.-Y.; Fan, C.-C.; Chu, P.-C.; Hong, B.-E.; Lee, H.J.; Chang, M.-S. hPuf-A/KIAA0020 Modulates PARP-1 Cleavage upon Genotoxic Stress. Cancer Res. 2011, 71, 1126–1134. [Google Scholar] [CrossRef] [PubMed]
- Browne, G.J.; Proud, C.G. Regulation of peptide-chain elongation in mammalian cells. Eur. J. Biochem. 2002, 5360–5368. [Google Scholar] [CrossRef]
- Maruyama, T.; Nara, K.; Yoshikawa, H.; Suzuki, N. Txk, a member of the non-receptor tyrosine kinase of the Tec family, forms a complex with poly(ADP-ribose) polymerase 1 and elongation factor 1α and regulates interferon-γ gene transcription in Th1 cells. Clin. Exp. Immunol. 2007, 147, 164–175. [Google Scholar] [CrossRef]
- Duttaroy, A.; Bourbeau, D.; Wang, X.L.; Wang, E. Apoptosis rate can be accelerated or decelerated by overexpression or reduction of the level of elongation factor-1α. Exp. Cell Res. 1998, 238, 168–176. [Google Scholar] [CrossRef]
- Yang, F.; Demma, M.; Warren, V.; Dharmawardhane, S.; Condeelis, J. Identification of an actin-binding protein from Dictyostelium as elongation factor 1a. Nature 1990, 347, 494–496. [Google Scholar] [CrossRef]
- Gross, S.R.; Kinzy, T.G. Translation elongation factor 1A is essential for regulation of the actin cytoskeleton and cell morphology. Nat. Struct. Mol. Biol. 2005, 12, 772–778. [Google Scholar] [CrossRef] [PubMed]
- Kim, J.-H.; Lane, W.S.; Reinberg, D. Human Elongator facilitates RNA polymerase II transcription through chromatin. Proc. Natl. Acad. Sci. USA 2002, 99, 1241–1246. [Google Scholar] [CrossRef] [PubMed]
- Huang, B.; Johansson, M.J.O.; Byström, A.S. An early step in wobble uridine tRNA modification requires the Elongator complex. RNA 2005, 11, 424–436. [Google Scholar] [CrossRef]
- Sherill-Rofe, D.; Rahat, D.; Findlay, S.; Mellul, A.; Guberman, I.; Braun, M.; Bloch, I.; Lalezari, A.; Samiei, A.; Sadreyev, R.; et al. Mapping global and local coevolution across 600 species to identify novel homologous recombination repair genes. Genome Res. 2019, 29, 439–448. [Google Scholar] [CrossRef] [PubMed]
- Cerami, E.; Gao, J.; Dogrusoz, U.; Gross, B.E.; Sumer, S.O.; Aksoy, B.A.; Jacobsen, A.; Byrne, C.J.; Heuer, M.L.; Larsson, E.; et al. The cBio Cancer Genomics Portal: An Open Platform for Exploring Multidimensional Cancer Genomics Data. Cancer Discov. 2012, 2, 401–404. [Google Scholar] [CrossRef]
- Gao, J.; Aksoy, B.A.; Dogrusoz, U.; Dresdner, G.; Gross, B.; Sumer, S.O.; Sun, Y.; Jacobsen, A.; Sinha, R.; Larsson, E.; et al. Integrative Analysis of Complex Cancer Genomics and Clinical Profiles Using the cBioPortal. Sci. Signal. 2013, 6, pl1. [Google Scholar] [CrossRef]
- Provencher, D.M.; Lounis, H.; Champoux, L.; Tétrault, M.; Manderson, E.N.; Wang, J.C.; Eydoux, P.; Savoie, R.; Tonin, P.N.; Mes-Masson, A.-M. Characterization of four novel epithelial ovarian cancer cell lines. Vitro Cell. Dev. Biol. Anim. 2000, 36, 357–361. [Google Scholar] [CrossRef]
- Alexandrov, L.B.; Nik-Zainal, S.; Wedge, D.C.; Aparicio, S.A.J.R.; Behjati, S.; Biankin, A.V.; Bignell, G.R.; Bolli, N.; Borg, A.; Børresen-Dale, A.-L.; et al. Signatures of mutational processes in human cancer. Nature 2013, 500, 415–421. [Google Scholar] [CrossRef]
- Lin, Z.; Kong, H.; Nei, M.; Ma, H. Origins and evolution of the recA/RAD51 gene family: Evidence for ancient gene duplication and endosymbiotic gene transfer. Proc. Natl. Acad. Sci. USA 2006, 103, 10328–10333. [Google Scholar] [CrossRef]
- Glatt, S.; Létoquart, J.; Faux, C.; Taylor, N.M.I.; Séraphin, B.; Müller, C.W. The Elongator subcomplex Elp456 is a hexameric RecA-like ATPase. Nat. Struct. Mol. Biol. 2012, 19, 314–320. [Google Scholar] [CrossRef]
- Lin, Z.; Zhao, W.; Diao, W.; Xie, X.; Wang, Z.; Zhang, J.; Shen, Y.; Long, J. Crystal structure of elongator subcomplex Elp4-6. J. Biol. Chem. 2012, 287, 21501–21508. [Google Scholar] [CrossRef]
- Virág, L.; Robaszkiewicz, A.; Rodriguez-Vargas, J.M.; Oliver, F.J. Poly(ADP-ribose) signaling in cell death. Mol. Asp. Med. 2013, 34, 1153–1167. [Google Scholar] [CrossRef] [PubMed]
- Wickens, M.; Bernstein, D.S.; Kimble, J.; Parker, R. A PUF family portrait: 3′UTR regulation as a way of life. Trends Genet. 2002, 150–157. [Google Scholar] [CrossRef]
- Miller, M.A.; Olivas, W.M. Roles of Puf proteins in mRNA degradation and translation. Wiley Interdiscip. Rev. RNA 2011, 2, 471–492. [Google Scholar] [CrossRef]
- Subramaniam, K.; Seydoux, G. Dedifferentiation of primary spermatocytes into germ cell tumors in C. elegans Lacking the pumilio-like protein PUF-8. Curr. Biol. 2003, 13, 134–139. [Google Scholar] [CrossRef]
- Kuo, M.-W.; Wang, S.-H.; Chang, J.-C.; Chang, C.-H.; Huang, L.-J.; Lin, H.-H.; Yu, A.L.-T.; Li, W.-H.; Yu, J. A Novel puf-A Gene Predicted from Evolutionary Analysis is Involved in the Development of Eyes and Primordial Germ-Cells. PLoS ONE 2009, 4, e4980. [Google Scholar] [CrossRef]
- Fan, C.-C.; Lee, L.-Y.; Yu, M.-Y.; Tzen, C.-Y.; Chou, C.; Chang, M.-S. Upregulated hPuf-A promotes breast cancer tumorigenesis. Tumor Biol. 2013, 34, 2557–2564. [Google Scholar] [CrossRef] [PubMed]
- Strumberg, D.; Pilon, A.A.; Smith, M.; Hickey, R.; Malkas, L.; Pommier, Y. Conversion of Topoisomerase I Cleavage Complexes on the Leading Strand of Ribosomal DNA into 5′-Phosphorylated DNA Double-Strand Breaks by Replication Runoff. Mol. Cell. Biol. 2000, 20, 3977–3987. [Google Scholar] [CrossRef] [PubMed]
- Hsiang, Y.-H.; Hertzberg, R.; Hecht, S.; Liu, L.F. Camptothecin Induces Protein-linked DNA Breaks via Mammalian DNA Topoisomerase I*. J. Biol. Chem. 1985, 260, 14873–14878. [Google Scholar] [CrossRef]
- Sordet, O.; Larochelle, S.; Nicolas, E.; Stevens, E.V.; Zhang, C.; Shokat, K.M.; Fisher, R.P.; Pommier, Y. Hyperphosphorylation of RNA Polymerase II in Response to Topoisomerase I Cleavage Complexes and its Association with Transcription- and BRCA1-dependent Degradation of Topoisomerase, I. J. Mol. Biol. 2008, 381, 540–549. [Google Scholar] [CrossRef] [PubMed]
- Subramanian, D.; Rosenstein, B.S.; Muller, M.T. Ultraviolet-induced DNA Damage Stimulates Topoisomerase I-DNA Complex Formation in Vivo: Possible Relationship with DNA Repair. Cancer Res. 1998, 58, 58. [Google Scholar]
- Chan, G.L.; Doetsch, P.W.; Haseltine, W.A. Cyclobutane Pyrimidine Dimers and (6-4) Photoproducts Block Polymerization by DNA Polymerase I†. Biochemistry 1985, 24, 5723–5728. [Google Scholar] [CrossRef] [PubMed]
- Karachaliou, N.; Gonzalez-Cao, M.; Crespo, G.; Drozdowskyj, A.; Aldeguer, E.; Gimenez-Capitan, A.; Teixido, C.; Molina-Vila, M.A.; Viteri, S.; Gil, M.D.L.L.; et al. Interferon gamma, an important marker of response to immune checkpoint blockade in non-small cell lung cancer and melanoma patients. Ther. Adv. Med. Oncol. 2018, 10. [Google Scholar] [CrossRef] [PubMed]
- Park, H.; Uronis, H.; Kang, Y.-K.; Ng, M.C.H.; Enzinger, P.; Lee, K.W.; Rutella, S.; Church, S.E.; Nordstrom, J.; Knutson, K.; et al. Phase II study of olaparib + durvalumab (MEDIOLA): Updated results in germline BRCA-mutated platinum-sensitive relapsed (PSR) ovarian cancer (OC). In Proceedings of the Abstract Book 44th ESMO Congress (ESMO 2019), Barcelona, Spain, 27 September–1 October 2019; Volume 30, pp. v485–v486. [Google Scholar] [CrossRef]
- Strickland, K.C.; Howitt, B.E.; Shukla, S.A.; Rodig, S.; Ritterhouse, L.L.; Liu, J.F.; Garber, J.E.; Chowdhury, D.; Wu, C.J.; D’Andrea, A.D.; et al. Association and prognostic significance of BRCA1/2-mutation status with neoantigen load, number of tumor-infiltrating lymphocytes and expression of PD-1/PD-L1 in high grade serous ovarian cancer. Oncotarget 2016, 7, 13587–13598. [Google Scholar] [CrossRef] [PubMed]
- Hawkes, N.A.; Otero, G.; Sebastiaan Winkler, G.; Marshall, N.; Dahmus, M.E.; Krappmann, D.; Scheidereit, C.; Thomas, C.L.; Schiavo, G.; Erdjument-Bromage, H.; et al. Purification and characterization of the human elongator complex. J. Biol. Chem. 2002, 277, 3047–3052. [Google Scholar] [CrossRef] [PubMed]
- Lemmens, B.B.L.G.; Johnson, N.M.; Tijsterman, M. COM-1 Promotes Homologous Recombination during Caenorhabditis elegans Meiosis by Antagonizing Ku-Mediated Non-Homologous End Joining. PLoS Genet. 2013, 9. [Google Scholar] [CrossRef]
- Vis, D.J.; Bombardelli, L.; Lightfoot, H.; Iorio, F.; Garnett, M.J.; Wessels, L.F. Multilevel models improve precision and speed of IC 50 estimates. Pharmacogenomics 2016, 17, 691–700. [Google Scholar] [CrossRef]
- Barretina, J.; Caponigro, G.; Stransky, N.; Venkatesan, K.; Margolin, A.A.; Kim, S.; Wilson, C.J.; Lehár, J.; Kryukov, G.V.; Sonkin, D.; et al. The Cancer Cell Line Encyclopedia enables predictive modeling of anticancer drug sensitivity. Nature 2012, 483, 603–607. [Google Scholar] [CrossRef]
- Klijn, C.; Durinck, S.; Stawiski, E.W.; Haverty, P.M.; Jiang, Z.; Liu, H.; Degenhardt, J.; Mayba, O.; Gnad, F.; Liu, J.; et al. A comprehensive transcriptional portrait of human cancer cell lines. Nat. Biotechnol. 2015, 33, 306–312. [Google Scholar] [CrossRef]
- Garcia-Alonso, L.; Iorio, F.; Matchan, A.; Fonseca, N.; Jaaks, P.; Peat, G.; Pignatelli, M.; Falcone, F.; Benes, C.H.; Dunham, I.; et al. Transcription Factor Activities Enhance Markers of Drug Sensitivity in Cancer. Cancer Res. 2018. [Google Scholar] [CrossRef] [PubMed]
- Kuhn, M. Building predictive models in R using the caret package. J. Stat. Softw. 2008, 28, 1–26. [Google Scholar] [CrossRef]
- Bolger, A.M.; Lohse, M.; Usadel, B. Trimmomatic: A flexible trimmer for Illumina sequence data. Bioinformatics 2014, 30, 2114–2120. [Google Scholar] [CrossRef]
- Li, H.; Durbin, R. Fast and accurate short read alignment with Burrows-Wheeler transform. Bioinformatics 2009, 25, 1754–1760. [Google Scholar] [CrossRef] [PubMed]
- Broad Institute. Picard Tools. Broad Institute, GitHub Repository. 2017. Available online: https://broadinstitute.github.io/picard/ (accessed on 11 March 2021).
- McKenna, A.; Hanna, M.; Banks, E.; Sivachenko, A.; Cibulskis, K.; Kernytsky, A.; Garimella, K.; Altshuler, D.; Gabriel, S.; Daly, M.; et al. The Genome Analysis Toolkit: A MapReduce framework for analyzing next-generation DNA sequencing data. Genome Res. 2010, 20, 1297–1303. [Google Scholar] [CrossRef] [PubMed]
- Li, H.; Handsaker, B.; Wysoker, A.; Fennell, T.; Ruan, J.; Homer, N.; Marth, G.; Abecasis, G.; Durbin, R. The Sequence Alignment/Map format and SAMtools. Bioinformatics 2009, 25, 2078–2079. [Google Scholar] [CrossRef]
- Cingolani, P.; Platts, A.; Wang, L.L.; Coon, M.; Nguyen, T.; Wang, L.; Land, S.J.; Lu, X.; Ruden, D.M. A program for annotating and predicting the effects of single nucleotide polymorphisms, SnpEff: SNPs in the genome of Drosophila melanogaster strain w1118; iso-2; iso-3. Fly 2012, 6, 80–92. [Google Scholar] [CrossRef]
- Sherry, S.T.; Ward, M.H.; Kholodov, M.; Baker, J.; Phan, L.; Smigielski, E.M.; Sirotkin, K. dbSNP: The NCBI database of genetic variation. Nucleic Acids Res. 2001, 29, 308–311. [Google Scholar] [CrossRef]
- Forbes, S.A.; Beare, D.; Boutselakis, H.; Bamford, S.; Bindal, N.; Tate, J.; Cole, C.G.; Ward, S.; Dawson, E.; Ponting, L.; et al. COSMIC: Somatic cancer genetics at high-resolution. Nucleic Acids Res. 2017, 45. [Google Scholar] [CrossRef]
- Cingolani, P.; Patel, V.M.; Coon, M.; Nguyen, T.; Land, S.J.; Ruden, D.M.; Lu, X. Using Drosophila melanogaster as a Model for Genotoxic Chemical Mutational Studies with a New Program, SnpSift. Front. Genet. 2012, 3, 35. [Google Scholar] [CrossRef]
- Liu, X.; Wu, C.; Li, C.; Boerwinkle, E. dbNSFP v3.0: A One-Stop Database of Functional Predictions and Annotations for Human Nonsynonymous and Splice-Site SNVs. Hum. Mutat. 2016, 37, 235–241. [Google Scholar] [CrossRef] [PubMed]
- Jian, X.; Boerwinkle, E.; Liu, X. In silico prediction of splice-altering single nucleotide variants in the human genome. Nucleic Acids Res. 2014, 42, 13534–13544. [Google Scholar] [CrossRef] [PubMed]
- R Core Team. R: A Language and Environment for Statistical Computing, Vienna, Austria. 2016. Available online: https://www.r-project.org/ (accessed on 11 March 2021).
- Knijnenburg, T.A.; Wang, L.; Zimmermann, M.T.; Chambwe, N.; Gao, G.F.; Cherniack, A.D.; Fan, H.; Shen, H.; Way, G.P.; Greene, C.S.; et al. Genomic and Molecular Landscape of DNA Damage Repair Deficiency across The Cancer Genome Atlas. Cell Rep. 2018, 23, 239–254. [Google Scholar] [CrossRef]
- Kanehisa, M.; Goto, S. KEGG: Kyoto encyclopedia of genes and genomes. Nucleic Acids Res. 2000, 28, 27–30. [Google Scholar] [CrossRef] [PubMed]
- Arikawa, E.; Quellhorst, G.; Han, Y.; Pan, H.; Yang, J. RT2 Profiler PCR Arrays: Pathway-Focused Gene Expression Profiling with qRT-PCR. 2015. Available online: https://www.qiagen.com/ca/resources/download.aspx?id=67a0be21-6869-4053-a2f9-ee98258a04a2&lang=en (accessed on 11 March 2021).
- Kumar, P.; Henikoff, S.; Ng, P.C. Predicting the effects of coding non-synonymous variants on protein function using the SIFT algorithm. Nat. Protoc. 2009, 4, 1073–1081. [Google Scholar] [CrossRef]
- Maathuis, M.; Colombo, D.; Kalisch, M.; Bühlmann, P. A method and server for predicting damaging missense mutations. Nat. Publ. Gr. 2010, 7, 3133–3164. [Google Scholar] [CrossRef]
- Shihab, H.A.; Rogers, M.F.; Gough, J.; Mort, M.; Cooper, D.N.; Day, I.N.M.; Gaunt, T.R.; Campbell, C. An integrative approach to predicting the functional effects of non-coding and coding sequence variation. Bioinformatics 2015, 31, 1536–1543. [Google Scholar] [CrossRef] [PubMed]
- Reva, B.; Antipin, Y.; Sander, C. Predicting the functional impact of protein mutations: Application to cancer genomics. Nucleic Acids Res. 2011, 39, e118. [Google Scholar] [CrossRef]
- Schwarz, J.M.; Cooper, D.N.; Schuelke, M.; Seelow, D. MutationTaster2: Mutation prediction for the deep-sequencing age. Nat. Methods 2014, 11, 361–362. [Google Scholar] [CrossRef] [PubMed]
- Ioannidis, N.M.; Rothstein, J.H.; Pejaver, V.; Middha, S.; McDonnell, S.K.; Baheti, S.; Musolf, A.; Li, Q.; Holzinger, E.; Karyadi, D.; et al. REVEL: An Ensemble Method for Predicting the Pathogenicity of Rare Missense Variants. Am. J. Hum. Genet. 2016, 99, 877–885. [Google Scholar] [CrossRef]
- Dong, C.; Wei, P.; Jian, X.; Gibbs, R.; Boerwinkle, E.; Wang, K.; Liu, X. Comparison and integration of deleteriousness prediction methods for nonsynonymous SNVs in whole exome sequencing studies. Hum. Mol. Genet. 2015, 24, 2125–2137. [Google Scholar] [CrossRef]
- Karczewski, K.J.; Francioli, L.C.; Tiao, G.; Cummings, B.B.; Alföldi, J.; Wang, Q.; Collins, R.L.; Laricchia, K.M.; Ganna, A.; Birnbaum, D.P.; et al. Variation across 141,456 human exomes and genomes reveals the spectrum of loss-of-function intolerance across human protein-coding genes. bioRxiv 2019, 531210. [Google Scholar] [CrossRef]
- Smit, A.F. Interspersed repeats and other mementos of transposable elements in mammalian genomes. Curr. Opin. Genet. Dev. 1999, 9, 657–663. [Google Scholar] [CrossRef]
- Lawrence, M.; Gentleman, R.; Carey, V. rtracklayer: An R package for interfacing with genome browsers. Bioinformatics 2009, 25, 1841–1842. [Google Scholar] [CrossRef] [PubMed]
- Thorvaldsdóttir, H.; Robinson, J.T.; Mesirov, J.P. Integrative Genomics Viewer (IGV): High-performance genomics data visualization and exploration. Brief. Bioinform. 2013, 14, 178–192. [Google Scholar] [CrossRef] [PubMed]
- Talevich, E.; Shain, A.H.; Botton, T.; Bastian, B.C.; Carlson, M.; Gentleman, R. CNVkit: Genome-Wide Copy Number Detection and Visualization from Targeted DNA Sequencing. PLoS Comput. Biol. 2016, 12, e1004873. [Google Scholar] [CrossRef]
- Ritchie, M.E.; Phipson, B.; Wu, D.; Hu, Y.; Law, C.W.; Shi, W.; Smyth, G.K. Limma powers differential expression analyses for RNA-sequencing and microarray studies. Nucleic Acids Res. 2015, 43, e47. [Google Scholar] [CrossRef] [PubMed]
- Alexandrov, L.B.; Nik-Zainal, S.; Wedge, D.C.; Campbell, P.J.; Stratton, M.R. Deciphering Signatures of Mutational Processes Operative in Human Cancer. Cell Rep. 2013, 3, 246–259. [Google Scholar] [CrossRef]
- Rosenthal, R.; McGranahan, N.; Herrero, J.; Taylor, B.S.; Swanton, C.; Kumar, S. DeconstructSigs: Delineating mutational processes in single tumors distinguishes DNA repair deficiencies and patterns of carcinoma evolution. Genome Biol. 2016, 17, 31. [Google Scholar] [CrossRef]


| Gene | Ensembl ID | Analysis | Association |
|---|---|---|---|
| APTX | ENSG00000137074 | Multivariate, univariate | sensitivity |
| AURKB | ENSG00000178999 | univariate | sensitivity |
| CCNA1 | ENSG00000133101 | univariate | sensitivity |
| CDC20 | ENSG00000117399 | univariate | sensitivity |
| CDKN2A | ENSG00000147889 | univariate | resistance |
| CDKN2B | ENSG00000147883 | multivariate | resistance |
| CDKN2C | ENSG00000123080 | univariate | resistance |
| CKAP5 | ENSG00000175216 | univariate | sensitivity |
| E2F1 | ENSG00000101412 | Multivariate, univariate | resistance |
| EBP | ENSG00000147155 | univariate | resistance |
| FANCE | ENSG00000112039 | Multivariate, univariate | sensitivity |
| FXYD5 | ENSG00000089327 | univariate | sensitivity |
| GADD45G | ENSG00000130222 | univariate | resistance |
| HMGA2 | ENSG00000149948 | univariate | sensitivity |
| IPO7 | ENSG00000205339 | univariate | sensitivity |
| KIF18A | ENSG00000121621 | univariate | sensitivity |
| LLGL1 | ENSG00000131899 | univariate | sensitivity |
| MELK | ENSG00000165304 | univariate | sensitivity |
| MNAT1 | ENSG00000020426 | univariate | sensitivity |
| ORC2 | ENSG00000115942 | univariate | sensitivity |
| PER1 | ENSG00000179094 | multivariate | sensitivity |
| PFN1 | ENSG00000108518 | univariate | sensitivity |
| PLK3 | ENSG00000173846 | univariate | sensitivity |
| PMS1 | ENSG00000064933 | univariate | sensitivity |
| PSMB6 | ENSG00000142507 | univariate | sensitivity |
| SLFN11 | ENSG00000172716 | Multivariate, univariate | sensitivity |
| STAG1 | ENSG00000118007 | univariate | sensitivity |
| TP53 | ENSG00000141510 | univariate | sensitivity |
| TUBA1C | ENSG00000167553 | univariate | sensitivity |
| TUBA4A | ENSG00000127824 | univariate | resistance |
| VAMP8 | ENSG00000118640 | univariate | resistance |
| XRCC5 | ENSG00000079246 | univariate | sensitivity |
| YWHAE | ENSG00000108953 | Multivariate, univariate | sensitivity |
| Gene | Coefficient | 95% Confidence Interval | FDR-Adjusted p Value |
|---|---|---|---|
| PUM3 | −0.180 | −0.247–−0.114 | 1.66 × 10⁻⁴ |
| ELP4 | −0.118 | −0.191–−0.044 | 0.0311 |
| ELP5 | −0.131 | −0.200–−0.063 | 0.00925 |
| EEF1A1 | −0.132 | −0.210–−0.054 | 0.0211 |
| Cancer Type (TCGA Classification) | Abbreviation | Number of Cell Lines |
|---|---|---|
| Adrenocortical carcinoma | ACC | 1 |
| Acute lymphoblastic leukemia | ALL | 22 |
| Bladder Urothelial Carcinoma | BLCA | 17 |
| Breast invasive carcinoma | BRCA | 45 |
| Cervical squamous cell carcinoma and endocervical adenocarcinoma | CESC | 13 |
| Chronic Lymphocytic Leukemia | CLL | 3 |
| Colon adenocarcinoma and Rectum adenocarcinoma | COAD/READ | 46 |
| Lymphoid Neoplasm Diffuse Large B-cell Lymphoma | DLBC | 30 |
| Esophageal carcinoma | ESCA | 32 |
| Glioblastoma multiforme | GBM | 34 |
| Head and Neck squamous cell carcinoma | HNSC | 39 |
| Kidney renal clear cell carcinoma | KIRC | 30 |
| Acute Myeloid Leukemia | LAML | 25 |
| Chronic Myelogenous Leukemia | LCML | 10 |
| Brain Lower Grade Glioma | LGG | 17 |
| Liver hepatocellular carcinoma | LIHC | 16 |
| Lung adenocarcinoma | LUAD | 57 |
| Lung squamous cell carcinoma | LUSC | 15 |
| Medulloblastoma | MB | 3 |
| Mesothelioma | MESO | 19 |
| Multiple Myeloma | MM | 16 |
| Neuroblastoma | NB | 25 |
| Ovarian serous cystadenocarcinoma | OV | 32 |
| Pancreatic adenocarcinoma | PAAD | 25 |
| Prostate adenocarcinoma | PRAD | 6 |
| Small Cell Lung Cancer | SCLC | 51 |
| Skin Cutaneous Melanoma | SKCM | 50 |
| Stomach adenocarcinoma | STAD | 20 |
| Thyroid carcinoma | THCA | 16 |
| Uterine Corpus Endometrial Carcinoma | UCEC | 9 |
| Unknown | - | 172 |
| Cell Line | Passage Number * | Response | Olaparib IC50 (µM) ± Standard Error of Mean (SEM) | Chemotherapy Status | Cellosaurus Number ** |
|---|---|---|---|---|---|
| OV2295 | P61 | Sensitive | 0.0003 ± 0.0004 | Pre-chemo | CVCL_9T13 |
| OV4453 | P63 | 0.01 ± 0.0009 | Pre-chemo | CVCL_9T20 | |
| TOV1946 | P49 | 0.02 ± 0.007 | Pre-chemo | CVCL_4062 | |
| TOV3041G | P52 | 0.02 ± 0.01 | Post-chemo | CVCL_9T24 | |
| OV1946 | P49 | 0.07 ± 0.05 | Pre-chemo | CVCL_4375 | |
| TOV2978G | P67 | Intermediate | 0.45 ± 0.30 | Pre-chemo | CVCL_9U73 |
| TOV3133G | P65 | 0.58 ± 0.44 | Pre-chemo | CVCL_4064 | |
| OV3133(R) | P71 | 0.75 ± 0.04 | Post-chemo | CVCL_9T15 | |
| OV4485 | P60 | 0.90 ± 0.58 | Post-chemo | CVCL_9T21 | |
| TOV2295(R) | P57 | 1.52 ± 1.14 | Post-chemo | CVCL_9T18 | |
| TOV3291G | P65 | 1.58 ± 0.23 | Pre-chemo | CVCL_9T25 | |
| OV2295(R2) | P70 | 1.66 ± 0.99 | Post-chemo | CVCL_9T14 | |
| TOV3133D | P66 | 2.00 ± 1.15 | Post-chemo | CVCL_9T19 | |
| TOV2223G | P69 | 2.99 ± 1.20 | Post-chemo | CVCL_4063 | |
| OV90 | P63 | Resistant | 7.04 ± 2.33 | Pre-chemo | CVCL_3768 |
| OV866(2) | P108 | 8.11 ± 1.27 | Post-chemo | CVCL_9T22 | |
| TOV1369 | P65 | 9.02 ± 3.66 | Pre-chemo | CVCL_9T17 | |
| OV1369(R2) | P66 | 21.71 ± 10.33 | Post-chemo | CVCL_9T12 |
Publisher’s Note: MDPI stays neutral with regard to jurisdictional claims in published maps and institutional affiliations. |
© 2021 by the authors. Licensee MDPI, Basel, Switzerland. This article is an open access article distributed under the terms and conditions of the Creative Commons Attribution (CC BY) license (http://creativecommons.org/licenses/by/4.0/).
Share and Cite
Amuzu, S.; Carmona, E.; Mes-Masson, A.-M.; Greenwood, C.M.T.; Tonin, P.N.; Ragoussis, J. Candidate Markers of Olaparib Response from Genomic Data Analyses of Human Cancer Cell Lines. Cancers 2021, 13, 1296. https://doi.org/10.3390/cancers13061296
Amuzu S, Carmona E, Mes-Masson A-M, Greenwood CMT, Tonin PN, Ragoussis J. Candidate Markers of Olaparib Response from Genomic Data Analyses of Human Cancer Cell Lines. Cancers. 2021; 13(6):1296. https://doi.org/10.3390/cancers13061296
Chicago/Turabian StyleAmuzu, Setor, Euridice Carmona, Anne-Marie Mes-Masson, Celia M. T. Greenwood, Patricia N. Tonin, and Jiannis Ragoussis. 2021. "Candidate Markers of Olaparib Response from Genomic Data Analyses of Human Cancer Cell Lines" Cancers 13, no. 6: 1296. https://doi.org/10.3390/cancers13061296
APA StyleAmuzu, S., Carmona, E., Mes-Masson, A.-M., Greenwood, C. M. T., Tonin, P. N., & Ragoussis, J. (2021). Candidate Markers of Olaparib Response from Genomic Data Analyses of Human Cancer Cell Lines. Cancers, 13(6), 1296. https://doi.org/10.3390/cancers13061296