Simple Summary
The prognostic impact of the different tumor-infiltrating lymphocyte (TIL) subpopulations remains debated in solid cancers. We investigated the clinicopathological correlates and prognostic impact of TILs, particularly of γδ T cells, in 162 triple-negative breast cancer (TNBC) patients. A high γδ T cell density was significantly associated with younger age, higher tumor histological grade, adjuvant chemotherapy, BRCA1 promoter methylation, TIL density, and PD-L1 and PD-1 expression. In multivariate analyses, γδ T cell infiltration was an independent prognostic factor. However, this prognostic impact varied according to the tumor PIK3CA mutational status. High γδ T cell infiltration was associated with better survival in patients with PIK3CA wild-type tumors, without significant difference in the PIK3CA-mutated tumor subgroup. Altogether, these data suggest that high γδ T cell infiltrate is correlated with immune infiltration and might represent a prognostic tool in TNBC patients.
Abstract
The prognostic impact of the different tumor-infiltrating lymphocyte (TIL) subpopulations in solid cancers is still debated. Here, we investigated the clinicopathological correlates and prognostic impact of TILs, particularly of γδ T cells, in 162 patients with triple-negative breast cancer (TNBC). A high γδ T cell density (>6.625 γδ T cells/mm2) was associated with younger age (p = 0.008), higher tumor histological grade (p = 0.002), adjuvant chemotherapy (p = 0.010), BRCA1 promoter methylation (p = 0.010), TIL density (p < 0.001), and PD-L1 (p < 0.001) and PD-1 expression (p = 0.040). In multivariate analyses, γδ T cell infiltration (cutoff = 6.625 γδ T cells/mm2) was an independent prognostic factor (5-year relapse-free survival: 63.3% vs. 89.8%, p = 0.027; 5-year overall survival: 73.8% vs. 89.9%, p = 0.031, for low vs. high infiltration). This prognostic impact varied according to the tumor PIK3CA mutational status. High γδ T cell infiltration was associated with better survival in patients with PIK3CA wild-type tumors, but the difference was not significant in the subgroup with PIK3CA-mutated tumors. Altogether, these data suggest that high γδ T cell infiltrate is correlated with immune infiltration and might represent a candidate prognostic tool in patients with TNBC.
1. Introduction
Triple-negative breast cancers (TNBCs) represent 15% of all breast cancers (BCs) and are defined by the absence of estrogen receptors (ERs), progesterone receptors (PRs), and HER2 overexpression/amplification [1,2]. Despite good chemosensitivity of TNBC, its prognosis is poor [1,2,3]. Tremendous efforts have been made in the last decades to better characterize TNBC subtypes. Based on hierarchical clustering, Perou et al. initially described five intrinsic molecular BC subtypes, including a basal-like subtype [4,5]. TNBCs represent approximately 70% of all basal-like BCs, and 80% of the TNBCs can be classified as basal-like tumors using the PAM50 classifier [6]. Immunohistochemistry (IHC) with an expanded surrogate panel of markers (ER, PR, HER2, EGFR, and cytokeratin (CK) 5/6) has provided a more specific definition of basal-like BC [7]. Finally, Lehmann et al. classified a set of 587 TNBC into six subtypes with unique gene expression profiles and ontologies: luminal androgen receptor (AR), basal-like 1 and 2, immunomodulatory, mesenchymal, and mesenchymal stem-like [8]. These subtypes have different therapeutic targets, chemosensitivity levels, and stromal characteristics [9,10].
It is also described that genetic alterations in tumor cells influence the tumor microenvironment. The PIK3CA pathway is the most common activated pathway in breast cancer (for a review, see [11]). In ER+ breast cancers, Sobral-Leite et al. have shown that PIK3CA pathway alteration was associated with CD8 infiltration [12]. In a mouse model of invasive lobular carcinoma of the breast, activation of the PIK3CA pathway led to immune suppression and exhaustion [13]. In TNBC, we previously showed that exon 9 PIK3CA mutation was an independent poor prognostic factor [14].
Besides the molecular features, the immune infiltrate also varies in the different BC subtypes. TNBCs show higher density of tumor-infiltrating lymphocytes (TILs) than other BC subtypes, probably because of their higher number of antigenic tumor variants, neoepitope load, and tumor mutational burden [15]. In TNBC, stromal TILs are considered a strong prognostic factor and patients with a high TIL density show better survival [16,17,18,19]. Guidelines for the reliable and reproducible scoring of TIL density have been issued [20] for the routine management of primary BC, in addition to other prognostic markers.
The tumor immune microenvironment comprises heterogeneous populations of different lymphocyte subtypes, predominantly T cells and then B cells, natural killer (NK) cells, macrophages, and dendritic cells (DCs) [21]. The tumor immune cell infiltration differs among TNBC subtypes. This suggests that the immune response can be modulated by the cancer subtype. It also underlies the complex cross-talk between cancer cells and the immune microenvironment [10,22] and its critical role in the cancer outcome. However, in breast cancer, besides the global evaluation of stromal TIL density, there is no consensus to date on the clinical relevance of analyzing the extent of tumor infiltration by specific immune populations [20,23,24]. Particularly, the prognostic value of tumor infiltration by lymphocyte subpopulations, such as different T helper CD4+ cell subsets (Th1, Th2, Th17, and FOXP3+ regulatory T cells), B cells, cytotoxic NK cells, γδ T cells, and myeloid cells, is poorly documented. Although IHC-based subtyping could improve accuracy, it does not seem to add any new information for outcome prediction compared with their morphology [20]. Therefore, it is important to better describe the TNBC immune microenvironment to precisely understand the mechanisms driving the immune-regulatory processes. This might allow improving TNBC clinical management and developing new therapeutic strategies.
In this context, a recent study emphasized the importance of investigating the role of γδ T cell populations in TNBC outcome [25]. Indeed, Wu et al. demonstrated that progression-free survival and overall survival (OS) correlate with the density of Vδ1+ T cells, a subset of γδ T cells. γδ T cells belong to the family of non-conventional or innate lymphocytes that display both T cell and NK cell characteristics (T cell receptor (TCR), NK receptor, Fc receptor expression, etc.). Two main γδ T cell subtypes are present in humans: Vδ1 T cells, mainly found in tissues, and Vγ9Vδ2 T cells, mainly found in peripheral blood. Both subsets have been detected in the microenvironment of solid tumors (e.g., melanoma, breast, colon, lung, ovary, and prostate), and several studies have shown that they participate in the immune response against many solid and hematological malignancies [26,27,28,29,30]. γδ T cells unveil their anti-tumor activities by displaying direct cytolytic activities against transformed cells or/and by stimulating or regulating the biological functions of other immune cells, such as DCs, interferon-γ-producing CD8 αβ T cells, and NK cells [27,28,29]. γδ T cells are considered as attractive therapeutic targets for anti-tumor immunotherapies because of their unique properties. Indeed, they display a strong major histocompatibility complex-independent reactivity against many tumor cell types; they also have no alloreactivity and can be massively expanded from human samples [31]. Although evidence indicates that γδ T cells have a role in cancer, data on their frequency in cancer tissues and clinicopathological correlates remain scarce, particularly in TNBC, for which only a small number of samples have been analyzed [25,32,33,34]. Yet, the precise characterization of TNBC stromal components could allow refining the prognostic evaluation and identifying additional targets for immune modulation in this cancer subtype, for which treatments were lacking.
Here, we investigated the clinicopathological correlates and prognostic impact of TILs, and particularly γδ T cell infiltration, in 162 patients with TNBC. The clinicopathological variables of this cohort, including PIK3CA mutation status, were previously described [14,35,36].
2. Results
2.1. Patient and Tumor Characteristics
In this study, we evaluated γδ T cell infiltration in 162 TNBC samples from chemotherapy-naive patients that were previously analyzed in tissue microarrays (TMAs) (Figure 1) [35,36].
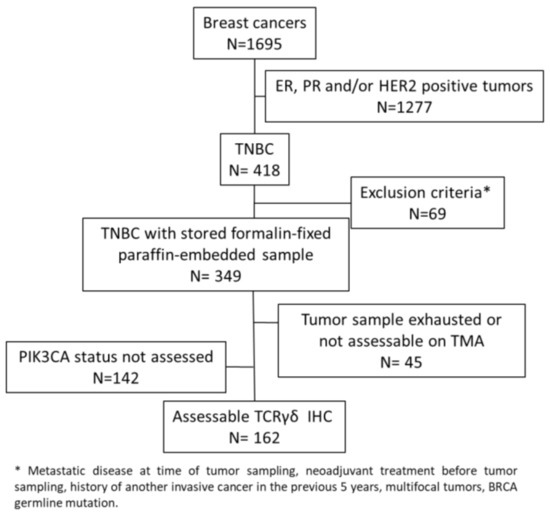
Figure 1.
Consort diagram.
The main clinicopathological characteristics of this cohort of patients with TNBC (Table 1) were consistent with the classical TNBC features. The patients’ median age was 55.4 years (range: 28.7–86.3 years). The most common histological type was ductal carcinoma (82.7%), and 72.0% of the patients received adjuvant chemotherapy. IHC data indicated that 60.6% of the tumors had a basal-like phenotype (i.e., a TNBC tumor that expresses at least one of the two basal markers, EGFR and CK5/6) and 36.5% of the tumors had a molecular apocrine phenotype (i.e., a TNBC tumor that expresses both AR and FOXA1). Moreover, 22.5% of the tumors exhibited BRCA1 promoter hypermethylation and 13.6% carried a PIK3CA mutation (exon 9 or 20).

Table 1.
Patient and tumor characteristics.
2.2. Association of Tumor-Infiltrating Lymphocytes with TNBC Biological Features
First, we evaluated the association between the immune microenvironment and biological variables in our TNBC cohort (Table S1). The molecular apocrine phenotype was associated with low TIL infiltration (p = 0.01), confirmed by the lower CD3+ cell density in this TNBC subtype (p = 0.024) and with negative PD-L1TC (tumor cells) status (p = 0.001). The immune infiltrate, based on TIL, CD3+, and CD8+ cell quantification, was similar in basal-like and non-basal-like tumors (p = 0.353, 0.509, and 0.668, respectively). However, positive PD-L1TC status was associated with the basal-like phenotype (p = 0.013) and with BRCA1 promoter methylation (p = 0.030). In TNBC samples with BRCA1 promoter methylation, the fraction of PD-1-positive cells was higher (p = 0.041) and a trend was observed with higher CD3+ cell density (p = 0.07). PIK3CA-mutated tumors were characterized by lower CD8+ cell infiltration (p = 0.038) and negative PD-L1SC (stromal cells) status (p = 0.048). Conversely, tumors with wild-type PIK3CA tended to have positive PD-L1TC status (p = 0.064).
Altogether, these results suggest an association between the immune network and the TNBC molecular subtype. Overall, basal-like tumors, which frequently harbor BRCA1 promoter hypermethylation (in our sample, 80.6% of TNBCs with BRCA1 promoter hypermethylation were basal-like tumors; p = 0.004), were more often associated with positive PD-L1TC and/or PD-1SC status. Conversely, molecular apocrine tumors, which frequently harbor PIK3CA mutations (77.3% of PIK3CA-mutated tumors had this phenotype in our study; p < 0.001), were more often associated with a low TIL density and the absence of PD-L1 and PD-1 expression.
2.3. In Situ γδ T Cell Infiltration Analysis
We used the recently validated monoclonal antibody H-41 [37] to detect the TCR δ-chain by IHC in the 162 TNBCs arrayed on TMAs. In TNBC samples, γδ T cell infiltration was very variable (from 0 to 193.8 γδ T cells/mm2; median: 6.625). Overall, we observed γδ T cell infiltration in 84.6% of the samples (137/162 TNBC samples had at least one γδ T cell). When present, γδ T cells were mostly located in the stroma and, to a lower extent, inside tumor nests (Figure 2).

Figure 2.
Immunohistochemical staining of γδ T cells in four triple-negative breast cancer (TNBC) samples showing variable γδ T cell infiltration, from absent (panel (A)) to high (panel (D)) infiltration. γδ T cells are highlighted by arrows in panels (B,C). In panel (D), note the presence of γδ T cells in the inflammatory stroma and inside tumor nests (surrounded by dotted lines). Tissue sections were analyzed by immunohistochemistry (IHC) with an anti-T cell receptor (TCR) δ-chain antibody to detect γδ T cells (brown) and counterstained with hematoxylin. Scale bar: 100 µm.
2.4. Association of In Situ γδ T Cell Infiltration with Clinicopathological Features
To determine the clinical significance of γδ T cells in TNBC, we analyzed the main clinicopathological features relative to the γδ T cell infiltration level (Table 2). A high γδ T cell density (above the median value of 6.625 cells/mm2) was associated with younger age (<55 years; p = 0.008); higher histological grade (p = 0.002); adjuvant chemotherapy (p = 0.010); BRCA1 promoter methylation (p = 0.010); TIL, CD3+, and CD8+ cell infiltration (p < 0.001 for all three parameters); PD-L1 expression by tumor cells (p < 0.001) and stromal cells (p < 0.001); and PD-1 expression (p = 0.040). Conversely, γδ T cell infiltration was not correlated with tumor size, nodal status, histological type, basal-like phenotype, PIK3CA1 mutations, and AR or FOXA1 expression. Nevertheless, we observed a trend between low γδ T cell density and molecular apocrine phenotype (AR and FOXA1 expression; p = 0.072).
Table 2.
Correlations between clinicopathological features and γδ T cell infiltration.
As we observed a significant association between γδ T cell density and TIL infiltration, assessed according to the published guidelines [20] or by CD3+ and CD8+ cell immunostaining and quantification, we asked whether γδ T cell density was positively correlated with TILs. We observed a strong correlation of γδ T cell density with CD3+ cell and TIL density (Spearman’s rho = 0.74 and 0.63, respectively; Figure 3A,B) and a moderate correlation with CD8+ cell density (Spearman’s rho = 0.51; Figure 3C).
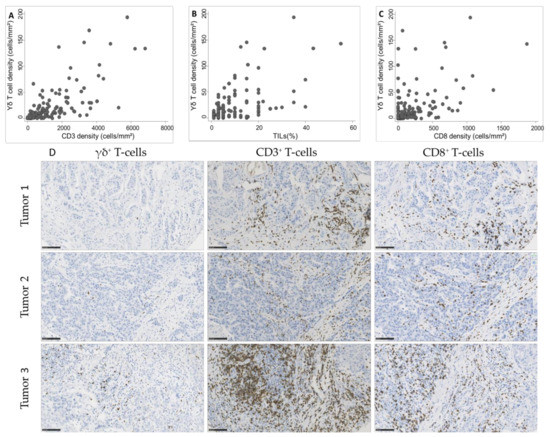
Figure 3.
Correlation between γδ T cell density and (A) CD3+ cell density (Spearman’s rho = 0.74), (B) tumor-infiltrating lymphocyte (TIL) infiltration (Spearman’s rho = 0.63), and (C) CD8+ cell density (Spearman’s rho = 0.51) in 162 TNBC samples. (D) Representative images of TNBC with variable γδ T cell densities and corresponding CD3 and CD8 infiltration. Scale bar: 100 µm.
2.5. Survival Analyses
Using 24 October 2016 as the cutoff date, the median follow-up was 10.4 years (95% CI (9.1–11.5)). During this period, 51 patients died (5-year OS: 81.8%; 95% CI (74.9–87.0)) and 39 had a tumor relapse (5-year relapse-free survival (RFS): 77.1%; 95% CI (69.4–83.1)). The relapse pattern was consistent with the previously reported temporal distribution of relapse risk in patients with TNBC [2,38].
Univariate analysis (Table 3) showed that high pT and pN stages, absence of adjuvant chemotherapy, low TIL and CD3+ cell densities, low PD-L1 expression by stromal cells, and low γδ T cell density were significantly associated with shorter OS and RFS. The 5-year OS rates were 73.8% (95% CI (62.6–82.0)) and 89.9% (95% CI (80.9–94.8)) (p = 0.001) (Figure 4A) and the 5-year RFS rates were 63.3% (95% CI (50.8–73.5)) and 89.8% (95% CI (80.6–94.8)) (p <0.001) in the subgroups with low γδ T cell density and high γδ T cell density, respectively (Figure 4B). OS was significantly associated with younger age (p = 0.030) and showed a trend for PIK3CA mutations (p = 0.061). High tumor infiltration by CD8+ cells was associated with longer RFS (p = 0.045).
Table 3.
Univariate analysis.

Figure 4.
Overall survival (A) and relapse-free survival (B) as a function of the tumor γδ T cell density (median value used as the cutoff) in the whole cohort of patients with TNBC.
We also analyzed the γδ T/CD3+ and γδ T/CD8+ cell ratios because the quantitative balance between these TIL subsets might give insights into γδ T cell functional impact. However, these ratios were not associated with OS and RFS, suggesting that the absolute density of each subpopulation is more important than its relative proportion.
In multivariate analysis (Table 4), high pT and pN stages and low γδ T cell infiltration were associated with shorter OS and RFS. Conversely, adjuvant chemotherapy and lack of PIK3CA mutations were associated with better OS and high tumor infiltration by CD8+ cells with longer RFS.
Table 4.
Multivariate analysis.
In an exploratory analysis, we evaluated the impact of γδ T cell infiltration on specific TNBC subgroups based on the tumor biological profile.
The prognostic impact of γδ T cell infiltration varied according to the PIK3CA mutational status. High γδ T cell infiltration was associated with better survival in PIK3CA wild-type tumors (Figure 5A,B) but not in the subgroup of tumors with mutated PIK3CA (Figure 5C,D).
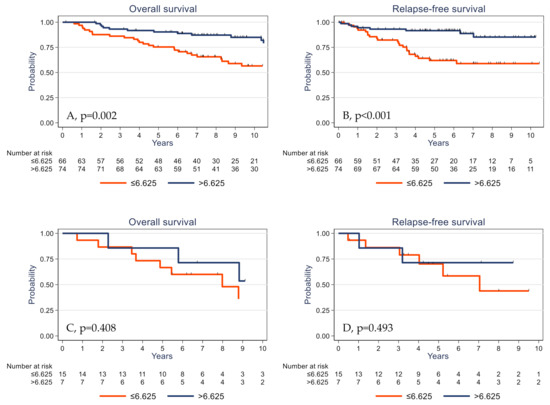
Figure 5.
Overall survival (A,C) and relapse-free survival (B,D) as a function of the tumor γδ T cell density (median value used as the cutoff) in patients with TNBC harboring wild-type (A,B) and mutated PIK3CA (C,D).
To further address the question of the impact of the methylation status of γδ T cells prognosis value, we analyzed OS and RFS in patients with TNBC harboring methylated or unmethylated BRCA1 promoter. Survival analyses showed a significant prognosis value of γδ T cells regardless of the methylation status of the BRCA1 promoter.
Finally, to evaluate the predictive value of γδ T cells on clinical outcome under adjuvant treatment, we analyzed the subgroup of patients who received adjuvant chemotherapy. In this subpopulation (n = 116), a high γδ T cell density was significantly associated with better OS and RFS (p = 0.007 and p = 0.002, respectively; Figure 6A,B). Conversely, the γδ T cell density assessed in the untreated TNBC cohort was not significantly associated with OS and RFS (p = 0.462 and p = 0.122, respectively; Figure 6C,D). Altogether, these data suggest that the prognostic impact of the γδ T cell infiltrate is restricted to the population of patients exposed to adjuvant chemotherapy, possibly due to the immunological effects described with this treatment. However, these latter analyses were carried out on a small number of samples (n = 45) and would need to be validated using independent cohorts with larger numbers of samples.

Figure 6.
Overall survival (A,C) and relapse-free survival (B,D) as a function of the tumor γδ T cell density (median value used as the cutoff) in patients with TNBC treated (A,B) or untreated (C,D) with adjuvant chemotherapy.
3. Discussion
Recently, considerable effort has been focused on targeting immune checkpoints in combination with chemotherapy for TNBC treatment, but with controversial results [39,40,41]. The effect of immunotherapy appears to be linked to tumor mutational burden and genome instability [42] and the functional aspects of immune cell infiltration [43]. As in TNBC, immune cell infiltration differs as a function of their molecular subtypes [21,22], a better description of the immune microenvironment could allow one to precisely determine their prognostic impact and therapeutic opportunities.
Several studies based on the CIBERSORT analysis have reported that intra-tumoral γδ T cell signatures emerged as the most significant favorable cancer-wide prognostic population [44], particularly in all BC types [45]. However, Tosolini et al. [46] demonstrated that the CIBERSORT analysis of pure γδ T cell transcriptome data fails to correctly differentiate these cells from αβ T and NK cells. As we previously validated a γδ T cell detection method by IHC in various human tumors, we used this approach to investigate γδ T cell infiltrate in TNBC [47]. We report here a comprehensive evaluation of the association of immune cell infiltration, particularly γδ T cells, with clinicopathological characteristics and its prognostic impact on 162 patients with TNBC and long-term follow-up.
First, we found, consistently with previous publications [22], that the basal-like phenotype, which is characterized by EGFR and/or CK5/6 expression, frequently related to genomic instability (highlighted in our series by the frequent hypermethylation of the BRCA1 promoter), was associated with positive PD-L1TC and/or PD-1SC status. Conversely, molecular apocrine tumors, defined as AR- and FOXA1-expressing tumors that frequently harbor PIK3CA mutations [48,49], were more frequently associated with a “cold tumor” phenotype (i.e., low TIL density and absence of PD-L1 expression). Altogether, these data reveal important differences between TNBC subtypes and their immune microenvironments.
TILs include different cell populations, but mostly T cells. We previously showed that γδ T cell infiltration tends to be higher in TNBC than in other BC types [47]. Here, we found that in TNBC, a high γδ T cell density was associated with aggressive clinicopathological variables, such as younger age, high histological grade, BRCA1 promoter hypermethylation, and adjuvant chemotherapy. A high γδ T cell density was also correlated with higher TIL, CD3+, and CD8+ cell densities and with expression of the PD-1 and PD-L1 immune checkpoint proteins. Overall, these results delineate, to our knowledge for the first time in a large TNBC population, the correlation between γδ T cell density, immune infiltrate extent, and immune exhaustion.
Interestingly, despite its association with pejorative clinicopathological factors, high γδ T cell infiltration was an independent determinant of longer survival (RFS and OS), together with classical clinicopathological prognostic factors, in this population. Moreover, the γδ T cell prognostic value was independent of, or stronger than, the TIL prognostic impact because TILs were not retained in the final multivariate model, highlighting, for the first time, the specific prognostic impact of γδ T cells.
Several studies have brought evidence of the presence of γδ T cells in the tumor microenvironment of TNBC [25,32,33,34]. Ma et al. previously evaluated the correlations between γδ T cell infiltration and BC characteristics and prognosis in 46 patients [50]. They found a correlation between γδ T cell infiltration, T and N stage, HER2 expression, and worse RFS and OS. In multivariate analysis, γδ T cell infiltration was the most significant independent prognostic factor. However, these 46 patients represented all BC complexity (biology, prognosis, and treatment) and no information was available on TNBC. On the other side, one study by Hidalgo et al. [32] described the localization of γδ T cells in a small cohort of 26 TNBC but did not analyze their correlation with clinical outcome. More recently, Wu et al. [25] and Janssen et al. [34] investigated the role of γδ T cells in TNBC by analyzing their biological functions. Wu et al. showed that γδ TILs from TNBC display a Th1 profile with cytolytic functions and IFN-γ production and their density positively correlates with progression-free and overall survival. Janssen et al. also demonstrated that γδ TILs produce IFN-γ and TNF-α but are not the source of IL-17 in TNBC, contrarily to γδ TILs from colorectal cancer.
The role of the various γδ T cell subsets (Vδ1 and Vγ9Vδ2 T cells) in the tumor microenvironment remains to be clarified. Conversely to Wu et al. [25], who identified Vδ1 T cells as the major human-breast-resident γδ subset, Janssen et al. [34] described Vδ2 T cells as the main subpopulation of the γδ T cells present in TNBC. The small number of patient samples in these two studies (n = 11 for each studies) might explain these contradictory results. Moreover, the function of Vδ1 cells in BC is still a matter of debate. We and others [51,52] described potent immunosuppressive functions. Our large population of 162 well-characterized TNBCs allowed us to refine these clinicopathological correlates by validating the results with patient survival, in particular in the patients treated with adjuvant chemotherapy. Together with the biological functions described by Wu et al. and Janssen et al., our data suggest that, in TNBC, γδ T cells display anti-tumor functions through a Th1 profile. Thus, γδ T cell density could be a prognostic and predictive marker in TNBC. One limitation of our study is that we assessed the total γδ T cell population, without identifying the specific Vδ1 or Vδ2 subsets. However, to the best of our knowledge, there is currently no validated antibody to differentiate Vδ1 and Vγ9Vδ2 T cells in formalin-fixed paraffin-embedded samples for the analysis of large BC cohorts.
Beside the phenotypic dichotomy between Vδ1 and Vγ9Vδ2 T cells, their functional properties can also allow the identification of specific γδ T subpopulations. For instance, a population of IL-17-producing γδ T cells with pro-tumor effects has been described in murine breast, ovarian, and hepatocellular cancer models [53,54,55,56], as well as in human colorectal cancer [53]. In human BC, γδ T cell pro-tumor functions have been associated with the induction of DC senescence [52], while in murine and human pancreatic ductal adenocarcinoma, γδ T cells allow tumor progression by inhibiting αβ T cell activation and infiltration via PD-L1 ligation. Overall, these data support the idea that some γδ T cell subsets can be immunosuppressive and favor tumor progression in selected solid tumor types. We recently reported the presence of γδ T cells in BC, particularly in high-grade tumors, and showed that ~20% of tumor-infiltrating γδ T cells express CD73, an enzyme involved in the production of the immunosuppressive molecule adenosine [51]. These cells also produce IL-10, an immunosuppressive cytokine, and IL-8, a chemokine involved in the recruitment of myeloid-derived suppressor cells. Therefore, some γδ T cells localized in the BC microenvironment might display pro-tumor functions that could favor an immunosuppressive microenvironment and ultimately promote tumor growth [51]. Thus, it would be interesting to combine CD73 and γδ TCR analyses to determine the ratio of CD73− (cytotoxic cells) vs. CD73+ (immunosuppressive cells) γδ T cells. To use a γδ T cell as a prognostic marker, it is necessary to analyze CD73− γδ T cell density vs. CD73+ γδ T cell density according to patient survival. Nevertheless, on the basis of our results on the prognostic value of γδ T cells in TNBC, we can hypothesize that if they exist, immunosuppressive CD73+ γδ T cells should be a minority.
The identification, in our cohort, of a possible association between the prognostic impact of γδ T cell infiltration and PIK3CA mutational status highlights the complex cross-talk between oncogenic signaling pathways and anti-tumor immunity [57]. This correlation between PI3K/AKT pathway activation and immune modulation has been previously described. Crane et al. reported that the expression of B7-H1, a negative regulator of T cell function, correlates with PI3K activation in breast and prostate cancers [58]. Recently, Borcoman et al. found a correlation between PIK3CA mutations and reduced immune infiltration of the tumor stroma in bladder cancer [59]. Moreover, PI3K inhibition has been associated with higher immune cell infiltration. In our series, the presence of PIK3CA mutations was not associated with TIL density (p = 0.681; Table S1) and with γδ T cell infiltration (p = 0.107). Although this last finding was not significant and the group of PIK3CA-mutated tumors was quite small (n = 22), it suggests possible differences in γδ T cell functions according to PIK3CA status. This hypothesis is strengthened by the observation that the prognostic value of γδ T cell infiltration was restricted, in our series, to the tumors without PIK3CA mutations.
Lastly, we identified a relation between the use of adjuvant chemotherapy and the prognostic impact of the γδ T cell infiltrate. While needing validation in an independent data set, considering the number of patients and the subgroup nature of the analysis, our results could emphasize the immunological effects reported with chemotherapy, such as cyclophosphamide, used in breast adjuvant chemotherapies [60,61].
Our findings, if validated in an independent series, could allow the development of strategies based on the characterization of the immune infiltrate and TNBC subtype. They might also help to develop immune intervention strategies for basal-like, immune-infiltrated tumors and anti-PI3K agents, possibly associated with immune modulators, to target the cold tumor phenotype of molecular apocrine tumors.
4. Materials and Methods
4.1. Objectives
The primary objective was the evaluation of the impact of γδ T cell infiltration, assessed by IHC, on OS and RFS in patients with TNBC. Secondary objectives were the evaluation of the association between γδ T cell infiltration and clinicopathological variables and the multivariate evaluation of the impact of these variables on prognosis (RFS and OS).
4.2. Patients and Tumor Samples
We used samples collected between 2002 and 2010 in a dedicated breast cancer prospective database (tumor biobank number BB-0033-00059). We selected only samples with less than 10% of RE- and RP-immunoreactive tumor cells and with HER2 0/1+ by immunohistochemistry and/or not amplified by in situ hybridization. Patients who received neoadjuvant treatment, who had metastatic disease at the time of surgery or multifocal tumors, who had a history of another invasive cancer in the previous 5 years, and those with known germline BRCA mutation were excluded from the study. Overall, 162 patients with available/sufficient tumor tissue and with described CK5/6, EGFR, PD-L1, PD-1, AR, and FOXA1 status (by IHC), as well as BRCA1 promoter methylation and PIK3CA status [35,36,62], were available for the study. None of the patients received targeted therapy or any investigational product, and each patient was treated according to our institution guidelines [63]. The clinicopathological characteristics and treatment of the study cohort are summarized in Table 1. The study was reviewed and approved by the Montpellier Cancer Institute Institutional Review Board (ID number ICM-CORT-2018-34). All patients gave their written, informed consent. As part of the study evaluated the prognostic impact of biological markers, this manuscript adheres to the REMARK guidelines.
4.3. Tissue Microarray
TCRδ expression was analyzed in the same TMA blocks that were used in our previous studies [35,36]. Briefly, for each tumor sample, two cores (1 mm in diameter) were sampled from different malignant areas and arrayed in six TMA blocks. Then, 3 or 4 μm thick sections were cut from the TMA blocks. The 4 µm sections were stained with hematoxylin-eosin-saffron (HES).
4.4. Immunohistochemistry
The 3 µm TMA sections were placed on microscope slides (Dako/Agilent, Santa Clara, CA, USA) and dried at room temperature overnight before IHC procedure using the Dako Autostainer Link48 platform and the Flex+ visualization system (Dako/Agilent, Santa Clara, CA, USA). Sections were incubated with the recently validated anti-TCRδ mouse monoclonal antibody (clone H-41, Santa Cruz Biotechnologies, Dallas, TX, USA) at 1:150 dilution at room temperature for 30 min [37] or with anti-CD3 (rabbit polyclonal, Ref A0452, 1:200, 20 min, Dako/Agilent, Santa Clara, CA, USA), anti-CD8 (mouse monoclonal, clone 8/144B, ready to use, 20 min, Dako/Agilent, Santa Clara, CA, USA), anti-CK 5/6 (mouse monoclonal, clone 6D5/16 B4, 1:100, 20 min, Dako/Agilent, Santa Clara, CA, USA), anti-EGFR (mouse monoclonal, clone 31G7, 1:50, 20 min, Invitrogen, Carlsbad, CA, USA), anti-PD-L1 (rabbit monoclonal, clone SP142, 1:200, 30 min, Roche Diagnostics, Basel, Switzerland), anti-PD1 (mouse monoclonal, clone MRQ-22, BioSB, Santa Barbara, CA, USA), anti-RA (mouse monoclonal, clone AR441, 1:150, 30 min, Dako/Agilent, Santa Clara, CA, USA), and anti-FOXA1 (goat polyclonal, Ref HNF-3α/β (C-20), 1:200, 20 min, Santa Cruz Biotechnologies, Dallas, TX, USA) antibodies, as previously described [35,36].
The NanoZoomer slide scanner system (Hamamatsu Photonics, Hamamatsu City, Shizuoka Pref., Japan) was used to digitalize the stained TMA sections with a ×20 objective. TCRδ-positive cells were manually identified and counted within the malignant areas on the digitalized slides with the NDP.view 2.7.39 software (Hamamatsu Photonics, Hamamatsu City, Shizuoka Pref., Japan). Data were expressed as the number of TCRγδ-positive cells per mm2. CD3+ and CD8+ cell densities were assessed using the Histolab® Image Analysis software (Microvision, Evry, France), as previously described [64]. TMA sections stained with other antibodies were analyzed independently by two trained observers, both blinded to the clinicopathological characteristics and patient outcomes at the time of scoring, as previously reported [35,36]. Missing TMA cores, those containing fewer than 10 cancer cells, or those demonstrating significant artefacts were not scored. Discordant cases were reviewed and scored by consensus.
4.5. TIL Assessment
A trained pathologist assessed TILs on HES-stained digitalized TMA sections, following the guidelines issued by the International TIL Working Group [20]. As recommended, only stromal TILs were quantified. Intratumor TILs, defined as intraepithelial mononuclear cells within tumor cell nests, were excluded from the TIL assessment. Stromal TILs are reported as the percentage of area occupied by TILs relative to the whole stroma area.
4.6. Tissue Processing and DNA Extraction
Frozen tumor samples were used for DNA extraction with the QIAamp DNA Mini Kit (Qiagen GmbH, Hilden, Germany) following the manufacturer’s instructions, as previously described [65,66].
4.7. Molecular Analysis
BRCA1 promoter methylation status was analyzed as previously reported [36]. Briefly, DNA methylation patterns at the CpG islands of the BRCA1 promoter were assessed using the methylation-specific polymerase chain reaction (PCR) assay [35,66,67], which analyzes seven CpG sites located at −37, −29, −21, −19, +16, +19, and +27 relative to the BRCA1 exon 1A transcription start site.
PIK3CA mutation status was analyzed by the PCR amplification and high-resolution melting method, followed by sequencing of the purified PCR products [14]. Primers were designed to amplify PIK3CA fragments that span the two mutation hotspots in exon 9, including the p.E542X and p.E545X mutations, and exon 20, including the hotspot mutations p.H1047X, p.H1048X, and p.G1049X.
4.8. Statistical Analysis
Categorical variables were described by the number of observations and the frequency of each modality and compared with Pearson’s chi-square or Fisher’s exact test. Continuous variables were described by the number of observations, the median, the minimum, and the maximum. OS was defined as the time from surgery to death (whatever the cause). Patients alive or lost to follow-up were censored at the date of last news. RFS was defined as the time from surgery to recurrence. Patients alive without recurrence and patients lost to follow-up were censored at the date of documented visit. Patients who died without recurrence were censored at the date of death. The Kaplan–Meier method was used to estimate the survival rates. The comparison of survival distributions was performed using the log–rank test. Hazard ratios (HRs) with a 95% confidence interval (95% CI) were estimated using a Cox proportional hazard model. Statistical analyses were performed with STATA 16.0 (StatCorp, College Station, TX, USA).
5. Conclusions
In TNBC, γδ T cell infiltration is correlated with immune infiltration and with a higher level of T-cell exhaustion, as indicated by its association with the expression of the immune checkpoints PD-L1 and PD-1. After adjusting for common clinicopathological factors in TNBC, γδ T cell infiltration remained a significant favorable prognostic factor for OS and RFS, especially in the PIK3CA wild-type subgroup of tumors, and thus represents a candidate prognostic tool. Nevertheless, before its broad application, it must be validated in studies that will also characterize the different γδ T cell populations.
Supplementary Materials
The following is available online at https://www.mdpi.com/2072-6694/13/4/765/s1: Table S1: Associations between immune microenvironment and TNBC biological variables.
Author Contributions
F.B.-M. provided the study patients and material, collected and assembled the data, carried out the assays, and drafted the manuscript. G.C. carried out the assays and helped to draft the manuscript. C.M. participated in the study conception and design and performed the statistical analysis. S.G. participated in the study conception and design, provided study patients and material, and helped to draft the manuscript. E.L.-C. collected and assembled the data and helped to draft the manuscript. J.R. performed the pathological evaluation and helped to draft the manuscript. N.B. participated in the study conception and design and helped to draft the manuscript. V.L. participated in the study conception and design, interpreted the data, and drafted the manuscript. W.J. participated in the study conception and design; provided study patients and material; collected, assembled, and interpreted the data; and drafted the manuscript. All authors have read and agreed to the published version of the manuscript.
Funding
This work was supported by Fondation pour la Recherche Médicale, France (grant number ECO201806006863 to GC).
Institutional Review Board Statement
The study was conducted according to the guidelines of the Declaration of Helsinki, and approved by the Institutional Review Board of Institut Régional du Cancer de Montpellier (study number ICM-CORT-2018-34; 12 November 2018).
Informed Consent Statement
Informed consent was obtained from all subjects involved in the study.
Data Availability Statement
No new data were created or analyzed in this study. Data sharing is not applicable to this article.
Acknowledgments
The authors acknowledge the microscopy (MRI) Montpellier BioCampus shared resource facilities and the Biological Resources Center from Montpellier Cancer Institute (ICM Biobank n° BB-0033-00059).
Conflicts of Interest
The authors declare that they have no competing interests.
Abbreviations
| AR | Androgen receptor |
| BC | Breast cancer |
| BRCA1 | Breast cancer type 1 susceptibility gene |
| CK 5/6 | Cytokeratin 5/6 |
| DC | Dendritic cells |
| DNA | Deoxyribonucleic acid |
| EGFR | Epidermal growth factor receptor |
| ER | Estrogen receptor |
| FOXA1 | Forkhead box protein A1 |
| HES | Hematoxylin-Eosin-Saffron |
| HER2 | Human epidermal growth factor receptor 2 |
| HR | Hazard ratio |
| IHC | Immunohistochemistry |
| NK | Natural killer |
| OS | Overall survival |
| PCR | Polymerase chain reaction |
| PD-1 | Programmed cell death 1 |
| PD-L1 | Programmed cell death ligand 1 |
| PR | Progesterone receptor |
| REMARK | Reporting recommendations for tumor marker prognostic studies |
| RFS | Relapse-free survival |
| SC | Stromal cells |
| TC | Tumor cells |
| TCR | T cell receptor |
| TIL | Tumor infiltrating lymphocyte |
| TMA | Tissue microarray |
| TNBC | Triple-negative breast cancer |
References
- Dent, R.; Hanna, W.M.; Trudeau, M.; Rawlinson, E.; Sun, P.; Narod, S.A. Pattern of metastatic spread in triple-negative breast cancer. Breast Cancer Res. Treat. 2009, 115, 423–428. [Google Scholar] [CrossRef]
- Dent, R.; Trudeau, M.; Pritchard, K.I.; Hanna, W.M.; Kahn, H.K.; Sawka, C.A.; Lickley, L.A.; Rawlinson, E.; Sun, P.; Narod, S.A. Triple-negative breast cancer: Clinical features and patterns of recurrence. Clin. Cancer Res. 2007, 13, 4429–4434. [Google Scholar] [CrossRef]
- Carey, L.A.; Dees, E.C.; Sawyer, L.; Gatti, L.; Moore, D.T.; Collichio, F.; Ollila, D.W.; Sartor, C.I.; Graham, M.L.; Perou, C.M. The triple negative paradox: Primary tumor chemosensitivity of breast cancer subtypes. Clin. Cancer Res. 2007, 13, 2329–2334. [Google Scholar] [CrossRef] [PubMed]
- Perou, C.M.; Sorlie, T.; Eisen, M.B.; van de Rijn, M.; Jeffrey, S.S.; Rees, C.A.; Pollack, J.R.; Ross, D.T.; Johnsen, H.; Akslen, L.A.; et al. Molecular portraits of human breast tumours. Nature 2000, 406, 747–752. [Google Scholar] [CrossRef]
- Sorlie, T.; Perou, C.M.; Tibshirani, R.; Aas, T.; Geisler, S.; Johnsen, H.; Hastie, T.; Eisen, M.B.; van de Rijn, M.; Jeffrey, S.S.; et al. Gene expression patterns of breast carcinomas distinguish tumor subclasses with clinical implications. Proc. Natl. Acad. Sci. USA 2001, 98, 10869–10874. [Google Scholar] [CrossRef] [PubMed]
- Prat, A.; Adamo, B.; Cheang, M.C.; Anders, C.K.; Carey, L.A.; Perou, C.M. Molecular characterization of basal-like and non-basal-like triple-negative breast cancer. Oncologist 2013, 18, 123–133. [Google Scholar] [CrossRef]
- Cheang, M.C.; Voduc, D.; Bajdik, C.; Leung, S.; McKinney, S.; Chia, S.K.; Perou, C.M.; Nielsen, T.O. Basal-like breast cancer defined by five biomarkers has superior prognostic value than triple-negative phenotype. Clin. Cancer Res. 2008, 14, 1368–1376. [Google Scholar] [CrossRef] [PubMed]
- Lehmann, B.D.; Bauer, J.A.; Chen, X.; Sanders, M.E.; Chakravarthy, A.B.; Shyr, Y.; Pietenpol, J.A. Identification of human triple-negative breast cancer subtypes and preclinical models for selection of targeted therapies. J. Clin. Investig. 2011, 121, 2750–2767. [Google Scholar] [CrossRef]
- Masuda, H.; Baggerly, K.A.; Wang, Y.; Zhang, Y.; Gonzalez-Angulo, A.M.; Meric-Bernstam, F.; Valero, V.; Lehmann, B.D.; Pietenpol, J.A.; Hortobagyi, G.N.; et al. Differential response to neoadjuvant chemotherapy among 7 triple-negative breast cancer molecular subtypes. Clin. Cancer. Res. 2013, 19, 5533–5540. [Google Scholar] [CrossRef] [PubMed]
- Lehmann, B.D.; Jovanovic, B.; Chen, X.; Estrada, M.V.; Johnson, K.N.; Shyr, Y.; Moses, H.L.; Sanders, M.E.; Pietenpol, J.A. Refinement of Triple-Negative Breast Cancer Molecular Subtypes: Implications for Neoadjuvant Chemotherapy Selection. PLoS ONE 2016, 11, e0157368. [Google Scholar] [CrossRef]
- Ellis, H.; Ma, C.X. PI3K Inhibitors in Breast Cancer Therapy. Curr. Oncol. Rep. 2019, 21, 110. [Google Scholar] [CrossRef]
- Sobral-Leite, M.; Salomon, I.; Opdam, M.; Kruger, D.T.; Beelen, K.J.; van der Noort, V.; van Vlierberghe, R.L.P.; Blok, E.J.; Giardiello, D.; Sanders, J.; et al. Cancer-immune interactions in ER-positive breast cancers: PI3K pathway alterations and tumor-infiltrating lymphocytes. Breast Cancer Res. 2019, 21, 90. [Google Scholar] [CrossRef]
- An, Y.; Adams, J.R.; Hollern, D.P.; Zhao, A.; Chang, S.G.; Gams, M.S.; Chung, P.E.D.; He, X.; Jangra, R.; Shah, J.S.; et al. Cdh1 and Pik3ca Mutations Cooperate to Induce Immune-Related Invasive Lobular Carcinoma of the Breast. Cell Rep. 2018, 25, 702–714.e706. [Google Scholar] [CrossRef]
- Jacot, W.; Mollevi, C.; Fina, F.; Lopez-Crapez, E.; Martin, P.M.; Colombo, P.E.; Bibeau, F.; Romieu, G.; Lamy, P.J. High EGFR protein expression and exon 9 PIK3CA mutations are independent prognostic factors in triple negative breast cancers. BMC Cancer 2015, 15, 986. [Google Scholar] [CrossRef] [PubMed]
- Narang, P.; Chen, M.; Sharma, A.A.; Anderson, K.S.; Wilson, M.A. The neoepitope landscape of breast cancer: Implications for immunotherapy. BMC Cancer 2019, 19, 200. [Google Scholar] [CrossRef] [PubMed]
- Ibrahim, E.M.; Al-Foheidi, M.E.; Al-Mansour, M.M.; Kazkaz, G.A. The prognostic value of tumor-infiltrating lymphocytes in triple-negative breast cancer: A meta-analysis. Breast Cancer Res. Treat. 2014, 148, 467–476. [Google Scholar] [CrossRef] [PubMed]
- Adams, S.; Gray, R.J.; Demaria, S.; Goldstein, L.; Perez, E.A.; Shulman, L.N.; Martino, S.; Wang, M.; Jones, V.E.; Saphner, T.J.; et al. Prognostic value of tumor-infiltrating lymphocytes in triple-negative breast cancers from two phase III randomized adjuvant breast cancer trials: ECOG 2197 and ECOG 1199. J. Clin. Oncol. 2014, 32, 2959–2966. [Google Scholar] [CrossRef]
- Gao, G.; Wang, Z.; Qu, X.; Zhang, Z. Prognostic value of tumor-infiltrating lymphocytes in patients with triple-negative breast cancer: A systematic review and meta-analysis. BMC Cancer 2020, 20, 179. [Google Scholar] [CrossRef]
- Pruneri, G.; Vingiani, A.; Bagnardi, V.; Rotmensz, N.; De Rose, A.; Palazzo, A.; Colleoni, A.M.; Goldhirsch, A.; Viale, G. Clinical validity of tumor-infiltrating lymphocytes analysis in patients with triple-negative breast cancer. Ann. Oncol. 2016, 27, 249–256. [Google Scholar] [CrossRef]
- Salgado, R.; Denkert, C.; Demaria, S.; Sirtaine, N.; Klauschen, F.; Pruneri, G.; Wienert, S.; Van den Eynden, G.; Baehner, F.L.; Penault-Llorca, F.; et al. The evaluation of tumor-infiltrating lymphocytes (TILs) in breast cancer: Recommendations by an International TILs Working Group 2014. Ann. Oncol. 2015, 26, 259–271. [Google Scholar] [CrossRef]
- Stovgaard, E.S.; Nielsen, D.; Hogdall, E.; Balslev, E. Triple negative breast cancer-prognostic role of immune-related factors: A systematic review. Acta Oncol. 2018, 57, 74–82. [Google Scholar] [CrossRef] [PubMed]
- Harano, K.; Wang, Y.; Lim, B.; Seitz, R.S.; Morris, S.W.; Bailey, D.B.; Hout, D.R.; Skelton, R.L.; Ring, B.Z.; Masuda, H.; et al. Rates of immune cell infiltration in patients with triple-negative breast cancer by molecular subtype. PLoS ONE 2018, 13, e0204513. [Google Scholar] [CrossRef]
- Bottai, G.; Raschioni, C.; Losurdo, A.; Di Tommaso, L.; Tinterri, C.; Torrisi, R.; Reis-Filho, J.S.; Roncalli, M.; Sotiriou, C.; Santoro, A.; et al. An immune stratification reveals a subset of PD-1/LAG-3 double-positive triple-negative breast cancers. Breast Cancer Res. 2016, 18, 121. [Google Scholar] [CrossRef]
- Dieci, M.V.; Tsvetkova, V.; Griguolo, G.; Miglietta, F.; Tasca, G.; Giorgi, C.A.; Cumerlato, E.; Massa, D.; Lo Mele, M.; Orvieto, E.; et al. Integration of tumour infiltrating lymphocytes, programmed cell-death ligand-1, CD8 and FOXP3 in prognostic models for triple-negative breast cancer: Analysis of 244 stage I-III patients treated with standard therapy. Eur. J. Cancer 2020, 136, 7–15. [Google Scholar] [CrossRef]
- Wu, Y.; Kyle-Cezar, F.; Woolf, R.T.; Naceur-Lombardelli, C.; Owen, J.; Biswas, D.; Lorenc, A.; Vantourout, P.; Gazinska, P.; Grigoriadis, A.; et al. An innate-like Vdelta1(+) gammadelta T cell compartment in the human breast is associated with remission in triple-negative breast cancer. Sci. Transl. Med. 2019, 11, eaax9364. [Google Scholar] [CrossRef]
- Bouet-Toussaint, F.; Cabillic, F.; Toutirais, O.; Le Gallo, M.; de la Pintiere, C.T.; Daniel, P.; Genetet, N.; Meunier, B.; Dupont-Bierre, E.; Boudjema, K.; et al. Vgamma9Vdelta2 T cell-mediated recognition of human solid tumors. Potential for immunotherapy of hepatocellular and colorectal carcinomas. Cancer Immunol. Immunother. 2008, 57, 531–539. [Google Scholar] [CrossRef]
- Cordova, A.; Toia, F.; La Mendola, C.; Orlando, V.; Meraviglia, S.; Rinaldi, G.; Todaro, M.; Cicero, G.; Zichichi, L.; Donni, P.L.; et al. Characterization of human gammadelta T lymphocytes infiltrating primary malignant melanomas. PLoS ONE 2012, 7, e49878. [Google Scholar] [CrossRef]
- Corvaisier, M.; Moreau-Aubry, A.; Diez, E.; Bennouna, J.; Mosnier, J.F.; Scotet, E.; Bonneville, M.; Jotereau, F. V gamma 9V delta 2 T cell response to colon carcinoma cells. J. Immunol. 2005, 175, 5481–5488. [Google Scholar] [CrossRef] [PubMed]
- Meraviglia, S.; Eberl, M.; Vermijlen, D.; Todaro, M.; Buccheri, S.; Cicero, G.; La Mendola, C.; Guggino, G.; D’Asaro, M.; Orlando, V.; et al. In vivo manipulation of Vgamma9Vdelta2 T cells with zoledronate and low-dose interleukin-2 for immunotherapy of advanced breast cancer patients. Clin. Exp. Immunol. 2010, 161, 290–297. [Google Scholar]
- Raspollini, M.R.; Castiglione, F.; Degl’innocenti, D.R.; Amunni, G.; Villanucci, A.; Garbini, F.; Baroni, G.; Taddei, G.L. Tumour-infiltrating gamma/delta T-lymphocytes are correlated with a brief disease-free interval in advanced ovarian serous carcinoma. Ann. Oncol. 2005, 16, 590–596. [Google Scholar] [CrossRef] [PubMed]
- Bonneville, M.; O’Brien, R.L.; Born, W.K. Gammadelta T cell effector functions: A blend of innate programming and acquired plasticity. Nat. Rev. Immunol. 2010, 10, 467–478. [Google Scholar] [CrossRef]
- Hidalgo, J.V.; Bronsert, P.; Orlowska-Volk, M.; Diaz, L.B.; Stickeler, E.; Werner, M.; Schmitt-Graeff, A.; Kayser, G.; Malkovsky, M.; Fisch, P. Histological Analysis of gammadelta T Lymphocytes Infiltrating Human Triple-Negative Breast Carcinomas. Front. Immunol. 2014, 5, 632. [Google Scholar] [CrossRef]
- Siegers, G.M.; Dutta, I.; Kang, E.Y.; Huang, J.; Kobel, M.; Postovit, L.M. Aberrantly Expressed Embryonic Protein NODAL Alters Breast Cancer Cell Susceptibility to gammadelta T Cell Cytotoxicity. Front. Immunol. 2020, 11, 1287. [Google Scholar] [CrossRef] [PubMed]
- Janssen, A.; Hidalgo, J.V.; Beringer, D.X.; van Dooremalen, S.; Fernando, F.; van Diest, E.; Terrizi, A.R.; Bronsert, P.; Kock, S.; Schmitt-Graff, A.; et al. gammadelta T-cell Receptors Derived from Breast Cancer-Infiltrating T Lymphocytes Mediate Antitumor Reactivity. Cancer Immunol. Res. 2020, 8, 530–543. [Google Scholar] [CrossRef]
- Guiu, S.; Mollevi, C.; Charon-Barra, C.; Boissiere, F.; Crapez, E.; Chartron, E.; Lamy, P.J.; Gutowski, M.; Bourgier, C.; Romieu, G.; et al. Prognostic value of androgen receptor and FOXA1 co-expression in non-metastatic triple negative breast cancer and correlation with other biomarkers. Br. J. Cancer 2018, 119, 76–79. [Google Scholar] [CrossRef]
- Jacot, W.; Lopez-Crapez, E.; Mollevi, C.; Boissiere-Michot, F.; Simony-Lafontaine, J.; Ho-Pun-Cheung, A.; Chartron, E.; Theillet, C.; Lemoine, A.; Saffroy, R.; et al. BRCA1 Promoter Hypermethylation is Associated with Good Prognosis and Chemosensitivity in Triple-Negative Breast Cancer. Cancers 2020, 12, 828. [Google Scholar] [CrossRef] [PubMed]
- Jungbluth, A.A.; Frosina, D.; Fayad, M.; Pulitzer, M.P.; Dogan, A.; Busam, K.J.; Imai, N.; Gnjatic, S. Immunohistochemical Detection of gamma/delta T Lymphocytes in Formalin-fixed Paraffin-embedded Tissues. Appl. Immunohistochem. Mol. Morphol. 2019, 27, 581–583. [Google Scholar] [CrossRef] [PubMed]
- Cho, E.Y.; Chang, M.H.; Choi, Y.L.; Lee, J.E.; Nam, S.J.; Yang, J.H.; Park, Y.H.; Ahn, J.S.; Im, Y.H. Potential candidate biomarkers for heterogeneity in triple-negative breast cancer (TNBC). Cancer Chemother. Pharmacol. 2011, 68, 753–761. [Google Scholar] [CrossRef]
- Schmid, P.; Adams, S.; Rugo, H.S.; Schneeweiss, A.; Barrios, C.H.; Iwata, H.; Dieras, V.; Hegg, R.; Im, S.A.; Shaw Wright, G.; et al. Atezolizumab and Nab-Paclitaxel in Advanced Triple-Negative Breast Cancer. N. Engl. J. Med. 2018, 379, 2108–2121. [Google Scholar] [CrossRef] [PubMed]
- Schmid, P.; Cortes, J.; Pusztai, L.; McArthur, H.; Kummel, S.; Bergh, J.; Denkert, C.; Park, Y.H.; Hui, R.; Harbeck, N.; et al. Pembrolizumab for Early Triple-Negative Breast Cancer. N. Engl. J. Med. 2020, 382, 810–821. [Google Scholar] [CrossRef]
- Schmid, P.; Rugo, H.S.; Adams, S.; Schneeweiss, A.; Barrios, C.H.; Iwata, H.; Dieras, V.; Henschel, V.; Molinero, L.; Chui, S.Y.; et al. Atezolizumab plus nab-paclitaxel as first-line treatment for unresectable, locally advanced or metastatic triple-negative breast cancer (IMpassion130): Updated efficacy results from a randomised, double-blind, placebo-controlled, phase 3 trial. Lancet Oncol. 2020, 21, 44–59. [Google Scholar] [CrossRef]
- Yarchoan, M.; Hopkins, A.; Jaffee, E.M. Tumor Mutational Burden and Response Rate to PD-1 Inhibition. N. Engl. J. Med. 2017, 377, 2500–2501. [Google Scholar] [CrossRef] [PubMed]
- Filipovic, A.; Miller, G.; Bolen, J. Progress Toward Identifying Exact Proxies for Predicting Response to Immunotherapies. Front. Cell. Dev. Biol. 2020, 8, 155. [Google Scholar] [CrossRef]
- Gentles, A.J.; Newman, A.M.; Liu, C.L.; Bratman, S.V.; Feng, W.; Kim, D.; Nair, V.S.; Xu, Y.; Khuong, A.; Hoang, C.D.; et al. The prognostic landscape of genes and infiltrating immune cells across human cancers. Nat. Med. 2015, 21, 938–945. [Google Scholar] [CrossRef]
- Bense, R.D.; Sotiriou, C.; Piccart-Gebhart, M.J.; Haanen, J.; van Vugt, M.; de Vries, E.G.E.; Schroder, C.P.; Fehrmann, R.S.N. Relevance of Tumor-Infiltrating Immune Cell Composition and Functionality for Disease Outcome in Breast Cancer. J. Natl. Cancer Inst. 2017, 109, djw192. [Google Scholar] [CrossRef]
- Tosolini, M.; Pont, F.; Poupot, M.; Vergez, F.; Nicolau-Travers, M.L.; Vermijlen, D.; Sarry, J.E.; Dieli, F.; Fournie, J.J. Assessment of tumor-infiltrating TCRVgamma9Vdelta2 gammadelta lymphocyte abundance by deconvolution of human cancers microarrays. Oncoimmunology 2017, 6, e1284723. [Google Scholar] [CrossRef] [PubMed]
- Chabab, G.; Boissiere-Michot, F.; Mollevi, C.; Ramos, J.; Lopez-Crapez, E.; Colombo, P.E.; Jacot, W.; Bonnefoy, N.; Lafont, V. Diversity of Tumor-Infiltrating, gammadelta T-Cell Abundance in Solid Cancers. Cells 2020, 9, 1537. [Google Scholar] [CrossRef]
- Lehmann-Che, J.; Hamy, A.S.; Porcher, R.; Barritault, M.; Bouhidel, F.; Habuellelah, H.; Leman-Detours, S.; de Roquancourt, A.; Cahen-Doidy, L.; Bourstyn, E.; et al. Molecular apocrine breast cancers are aggressive estrogen receptor negative tumors overexpressing either HER2 or GCDFP15. Breast Cancer Res. 2013, 15, R37. [Google Scholar] [CrossRef]
- Weisman, P.S.; Ng, C.K.; Brogi, E.; Eisenberg, R.E.; Won, H.H.; Piscuoglio, S.; De Filippo, M.R.; Ioris, R.; Akram, M.; Norton, L.; et al. Genetic alterations of triple negative breast cancer by targeted next-generation sequencing and correlation with tumor morphology. Mod. Pathol. 2016, 29, 476–488. [Google Scholar] [CrossRef]
- Ma, C.; Zhang, Q.; Ye, J.; Wang, F.; Zhang, Y.; Wevers, E.; Schwartz, T.; Hunborg, P.; Varvares, M.A.; Hoft, D.F.; et al. Tumor-infiltrating gammadelta T lymphocytes predict clinical outcome in human breast cancer. J. Immunol. 2012, 189, 5029–5036. [Google Scholar] [CrossRef]
- Chabab, G.; Barjon, C.; Abdellaoui, N.; Salvador-Prince, L.; Dejou, C.; Michaud, H.A.; Boissiere-Michot, F.; Lopez-Crapez, E.; Jacot, W.; Pourquier, D.; et al. Identification of a regulatory Vdelta1 gamma delta T cell subpopulation expressing CD73 in human breast cancer. J. Leukoc. Biol. 2020. [Google Scholar] [CrossRef] [PubMed]
- Peng, G.; Wang, H.Y.; Peng, W.; Kiniwa, Y.; Seo, K.H.; Wang, R.F. Tumor-infiltrating gammadelta T cells suppress T and dendritic cell function via mechanisms controlled by a unique toll-like receptor signaling pathway. Immunity 2007, 27, 334–348. [Google Scholar] [CrossRef]
- Wu, P.; Wu, D.; Ni, C.; Ye, J.; Chen, W.; Hu, G.; Wang, Z.; Wang, C.; Zhang, Z.; Xia, W.; et al. gammadeltaT17 cells promote the accumulation and expansion of myeloid-derived suppressor cells in human colorectal cancer. Immunity 2014, 40, 785–800. [Google Scholar] [CrossRef] [PubMed]
- Ma, S.; Cheng, Q.; Cai, Y.; Gong, H.; Wu, Y.; Yu, X.; Shi, L.; Wu, D.; Dong, C.; Liu, H. IL-17A produced by gammadelta T cells promotes tumor growth in hepatocellular carcinoma. Cancer Res. 2014, 74, 1969–1982. [Google Scholar] [CrossRef] [PubMed]
- Coffelt, S.B.; Kersten, K.; Doornebal, C.W.; Weiden, J.; Vrijland, K.; Hau, C.S.; Verstegen, N.J.M.; Ciampricotti, M.; Hawinkels, L.; Jonkers, J.; et al. IL-17-producing gammadelta T cells and neutrophils conspire to promote breast cancer metastasis. Nature 2015, 522, 345–348. [Google Scholar] [CrossRef]
- Rei, M.; Goncalves-Sousa, N.; Lanca, T.; Thompson, R.G.; Mensurado, S.; Balkwill, F.R.; Kulbe, H.; Pennington, D.J.; Silva-Santos, B. Murine CD27(-) Vgamma6(+) gammadelta T cells producing IL-17A promote ovarian cancer growth via mobilization of protumor small peritoneal macrophages. Proc. Natl. Acad. Sci. USA 2014, 111, E3562–E3570. [Google Scholar] [CrossRef]
- Kobayashi, Y.; Lim, S.O.; Yamaguchi, H. Oncogenic signaling pathways associated with immune evasion and resistance to immune checkpoint inhibitors in cancer. Semin. Cancer. Biol. 2020, 65, 51–64. [Google Scholar] [CrossRef]
- Crane, C.A.; Panner, A.; Murray, J.C.; Wilson, S.P.; Xu, H.; Chen, L.; Simko, J.P.; Waldman, F.M.; Pieper, R.O.; Parsa, A.T. PI(3) kinase is associated with a mechanism of immunoresistance in breast and prostate cancer. Oncogene 2009, 28, 306–312. [Google Scholar] [CrossRef]
- Borcoman, E.; De La Rochere, P.; Richer, W.; Vacher, S.; Chemlali, W.; Krucker, C.; Sirab, N.; Radvanyi, F.; Allory, Y.; Pignot, G.; et al. Inhibition of PI3K pathway increases immune infiltrate in muscle-invasive bladder cancer. Oncoimmunology 2019, 8, e1581556. [Google Scholar] [CrossRef]
- Bao, L.; Hao, C.; Wang, J.; Wang, D.; Zhao, Y.; Li, Y.; Yao, W. High-Dose Cyclophosphamide Administration Orchestrates Phenotypic and Functional Alterations of Immature Dendritic Cells and Regulates Th Cell Polarization. Front. Pharmacol. 2020, 11, 775. [Google Scholar] [CrossRef] [PubMed]
- Madondo, M.T.; Quinn, M.; Plebanski, M. Low dose cyclophosphamide: Mechanisms of T cell modulation. Cancer. Treat. Rev. 2016, 42, 3–9. [Google Scholar] [CrossRef] [PubMed]
- Jacot, W.; Lopez-Crapez, E.; Thezenas, S.; Senal, R.; Fina, F.; Bibeau, F.; Romieu, G.; Lamy, P.J. Lack of EGFR-activating mutations in European patients with triple-negative breast cancer could emphasise geographic and ethnic variations in breast cancer mutation profiles. Breast Cancer Res. 2011, 13, R133. [Google Scholar] [CrossRef]
- Jacot, W.; Gutowski, M.; Azria, D.; Romieu, G. Adjuvant early breast cancer systemic therapies according to daily used technologies. Crit. Rev. Oncol. Hematol. 2012, 2, 361–369. [Google Scholar] [CrossRef] [PubMed]
- Boissiere-Michot, F.; Jacot, W.; Fraisse, J.; Gourgou, S.; Timaxian, C.; Lazennec, G. Prognostic Value of CXCR2 in Breast Cancer. Cancers 2020, 12, 2076. [Google Scholar] [CrossRef] [PubMed]
- Lamy, P.J.; Fina, F.; Bascoul-Mollevi, C.; Laberenne, A.C.; Martin, P.M.; Ouafik, L.; Jacot, W. Quantification and clinical relevance of gene amplification at chromosome 17q12-q21 in human epidermal growth factor receptor 2-amplified breast cancers. Breast Cancer Res. 2011, 13, R15. [Google Scholar] [CrossRef] [PubMed]
- Jacot, W.; Thezenas, S.; Senal, R.; Viglianti, C.; Laberenne, A.C.; Lopez-Crapez, E.; Bibeau, F.; Bleuse, J.P.; Romieu, G.; Lamy, P.J. BRCA1 promoter hypermethylation, 53BP1 protein expression and PARP-1 activity as biomarkers of DNA repair deficit in breast cancer. BMC Cancer 2013, 13, 523. [Google Scholar] [CrossRef]
- Esteller, M.; Silva, J.M.; Dominguez, G.; Bonilla, F.; Matias-Guiu, X.; Lerma, E.; Bussaglia, E.; Prat, J.; Harkes, I.C.; Repasky, E.A.; et al. Promoter hypermethylation and BRCA1 inactivation in sporadic breast and ovarian tumors. J. Natl. Cancer Inst. 2000, 92, 564–569. [Google Scholar] [CrossRef] [PubMed]


Publisher’s Note: MDPI stays neutral with regard to jurisdictional claims in published maps and institutional affiliations. |
© 2021 by the authors. Licensee MDPI, Basel, Switzerland. This article is an open access article distributed under the terms and conditions of the Creative Commons Attribution (CC BY) license (http://creativecommons.org/licenses/by/4.0/).