Cancer-Associated Fibroblast Subgroups Showing Differential Promoting Effect on HNSCC Progression

 ,
,  , and
, and 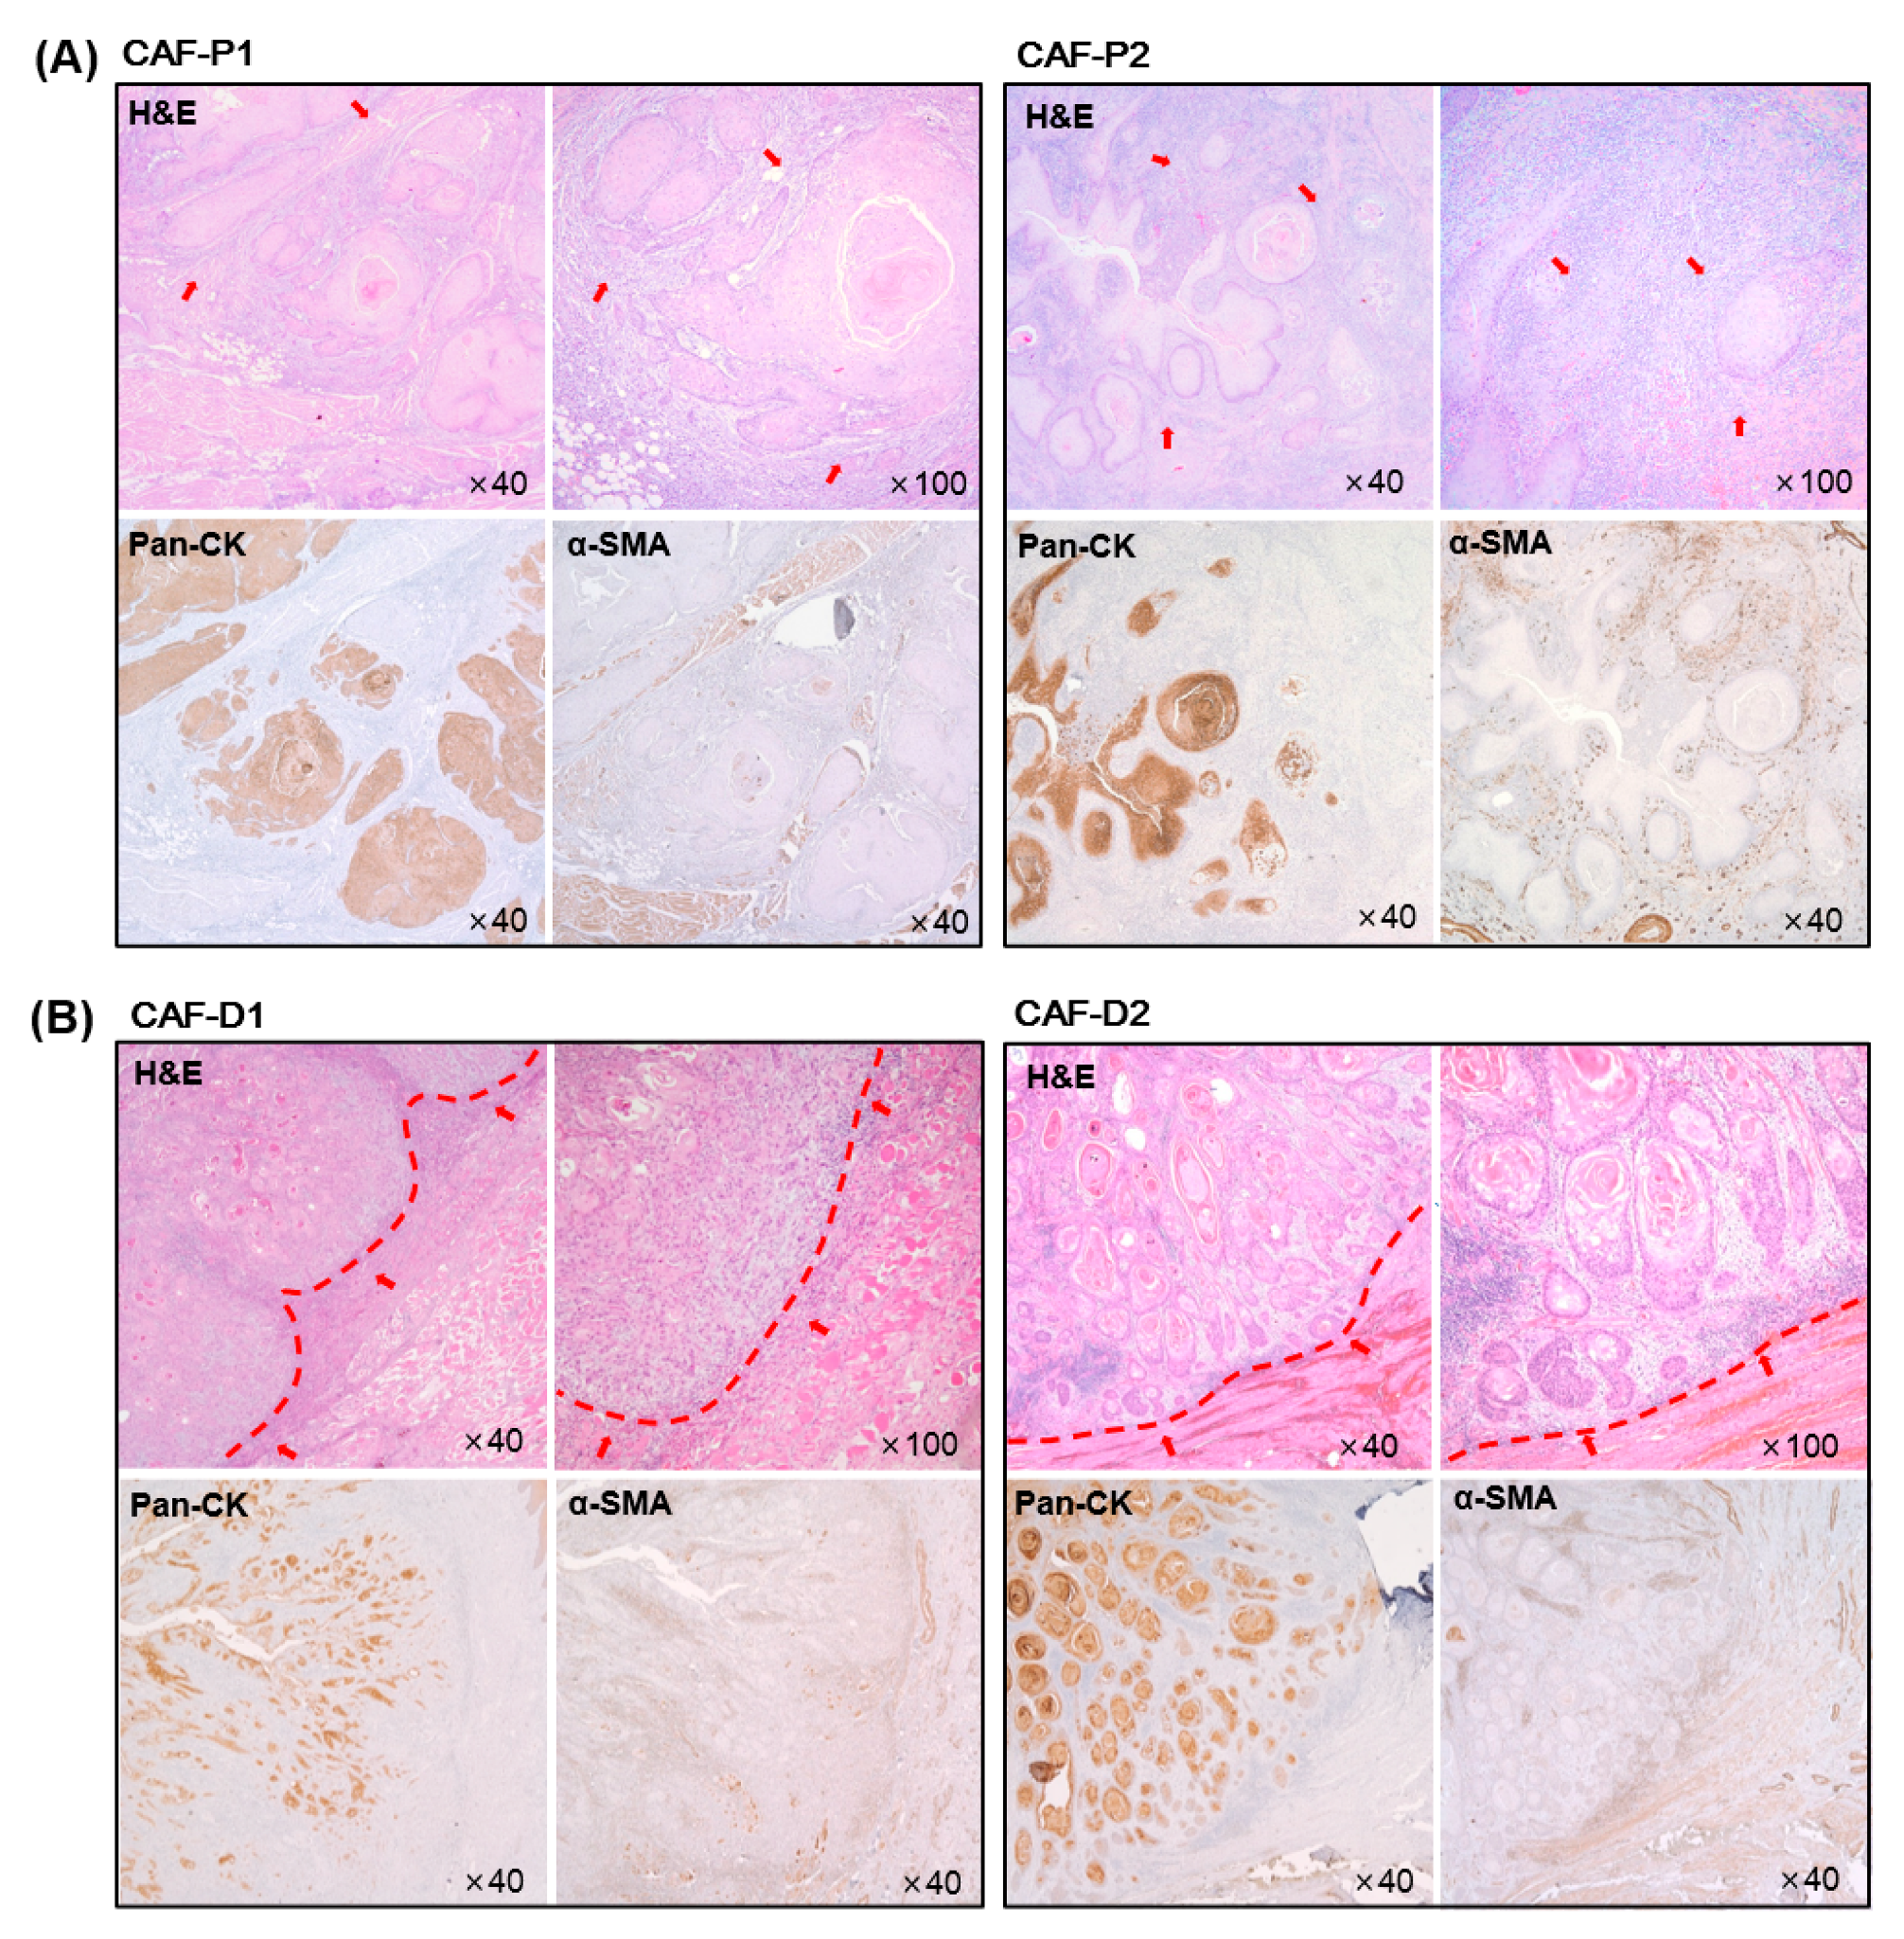
Abstract
:Simple Summary
Abstract
1. Introduction
2. Results
2.1. Characteristics of HNSCC Tissues according to the Marginal Shape between CAF and Cancer Epithelial Cells
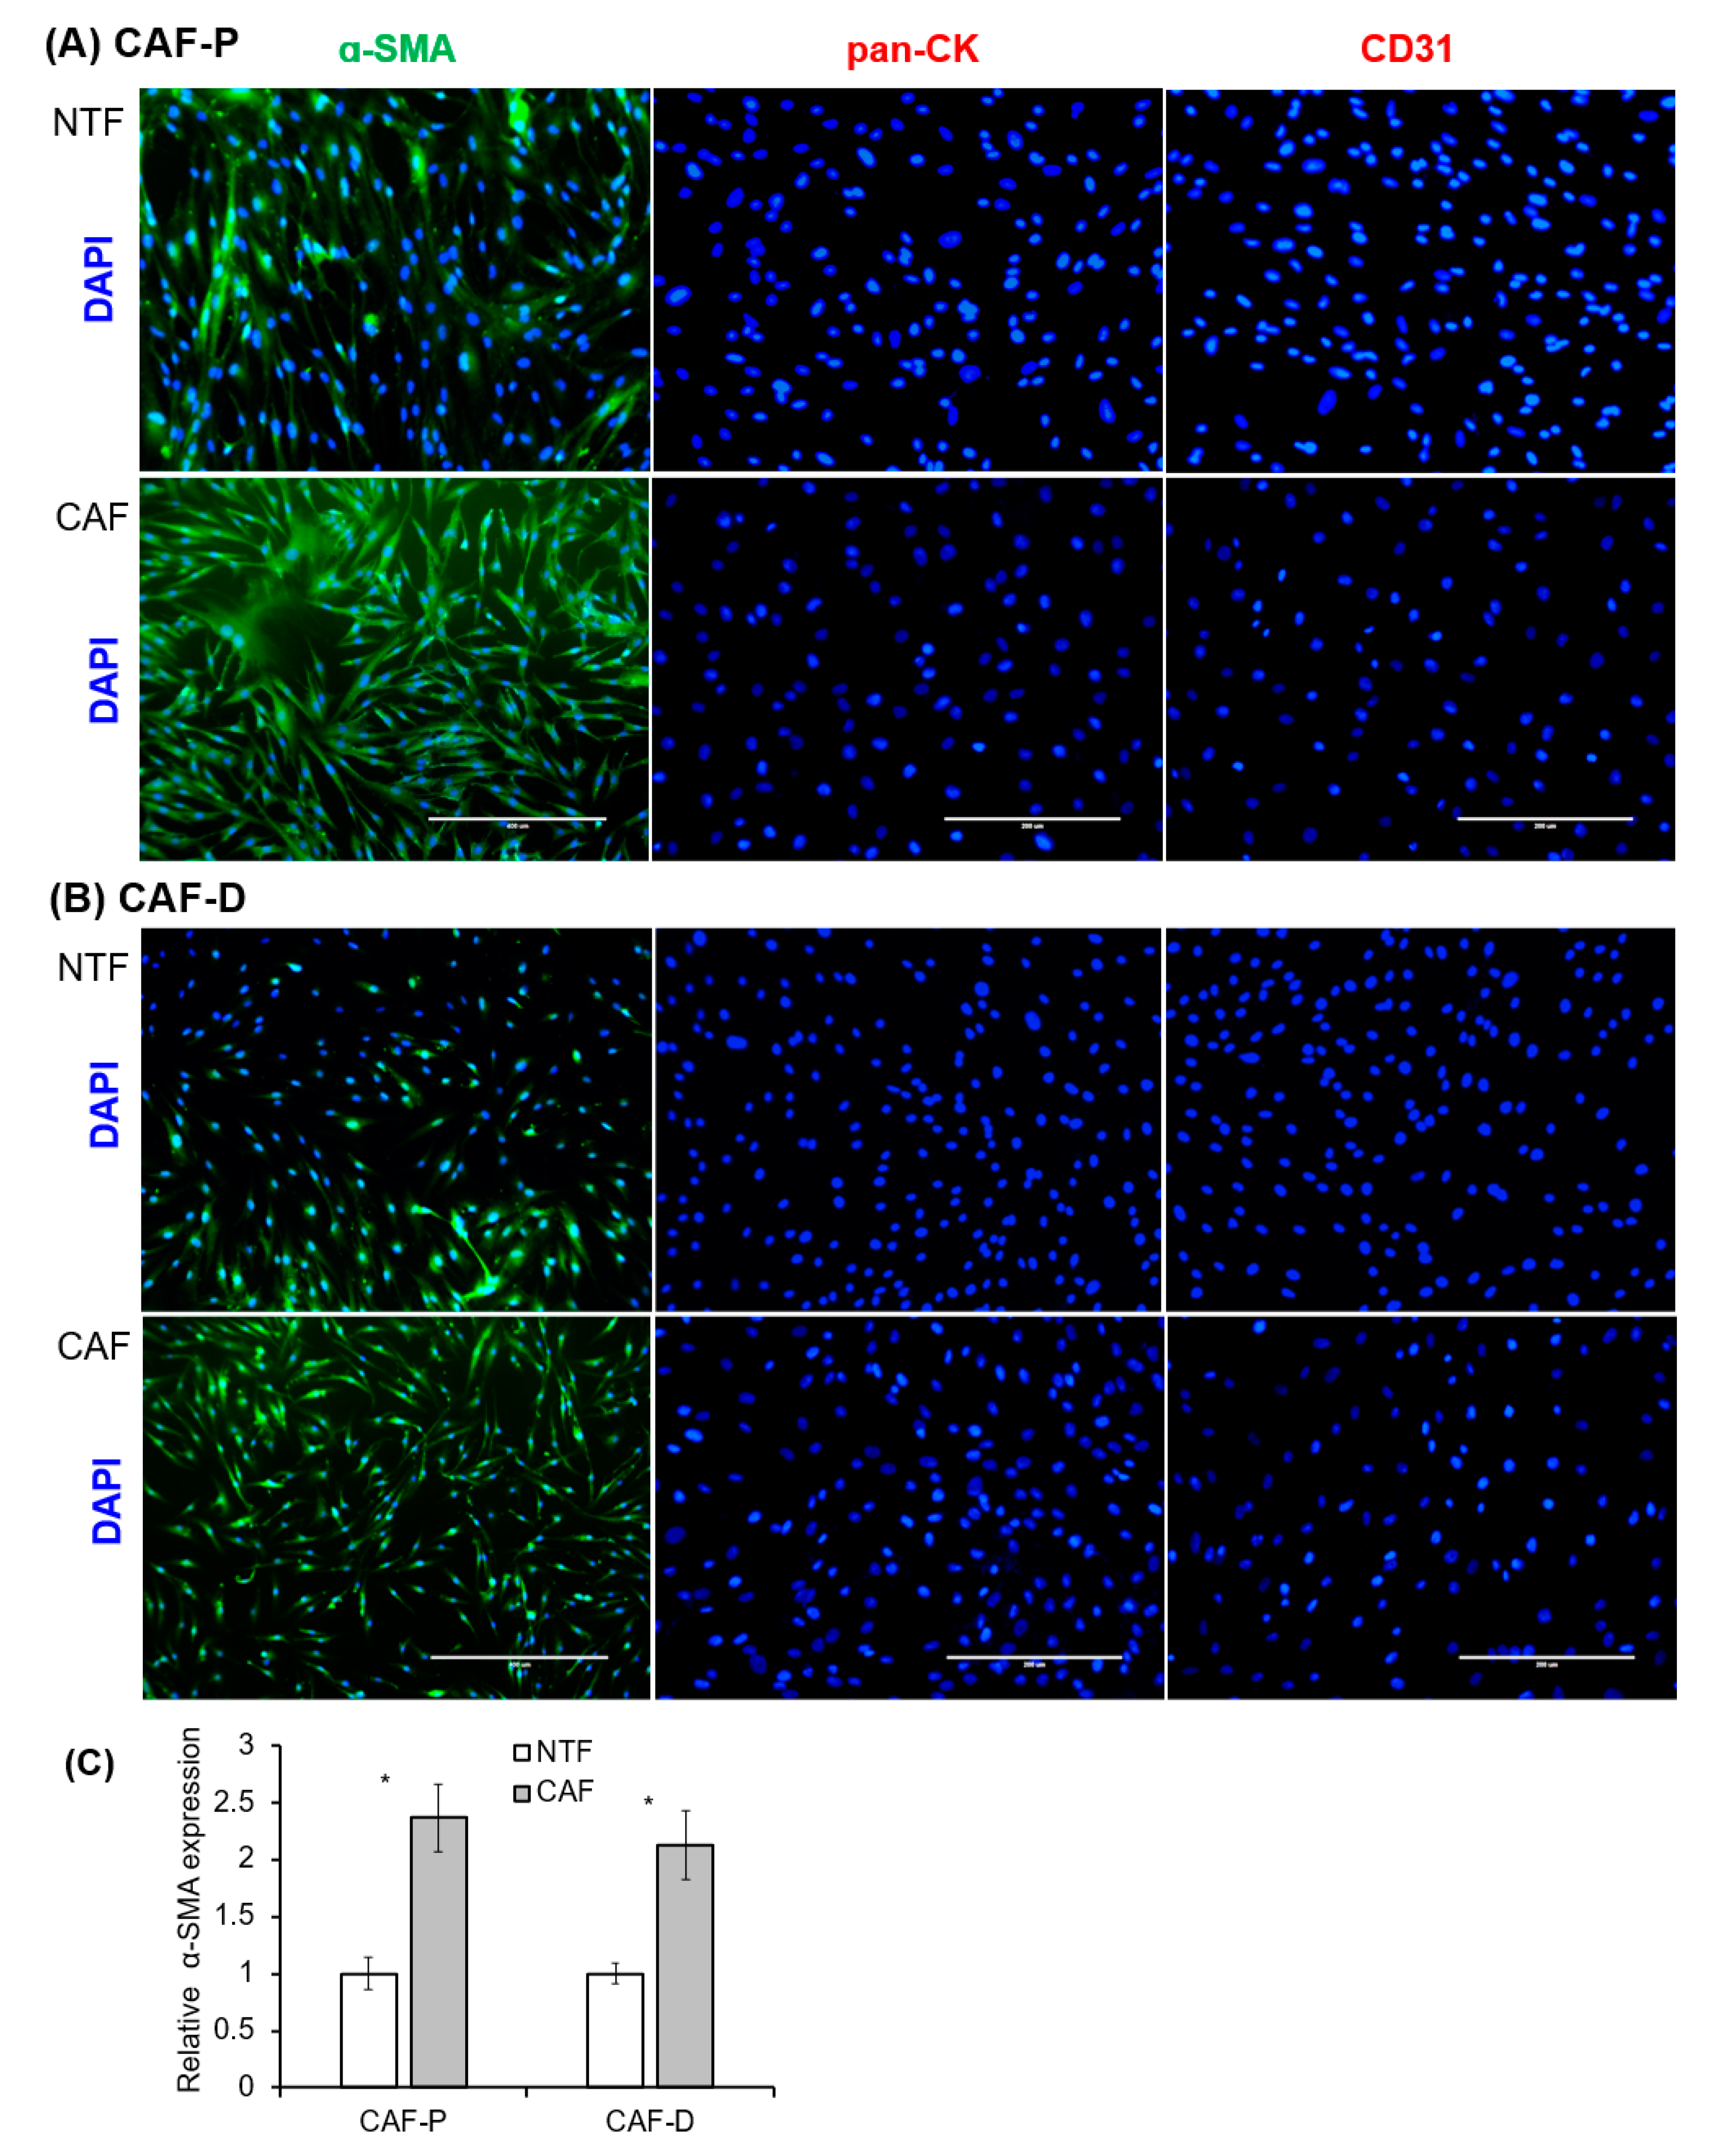
2.2. Characterization of Fibroblast Cells Cultured from HNSCC Tissues
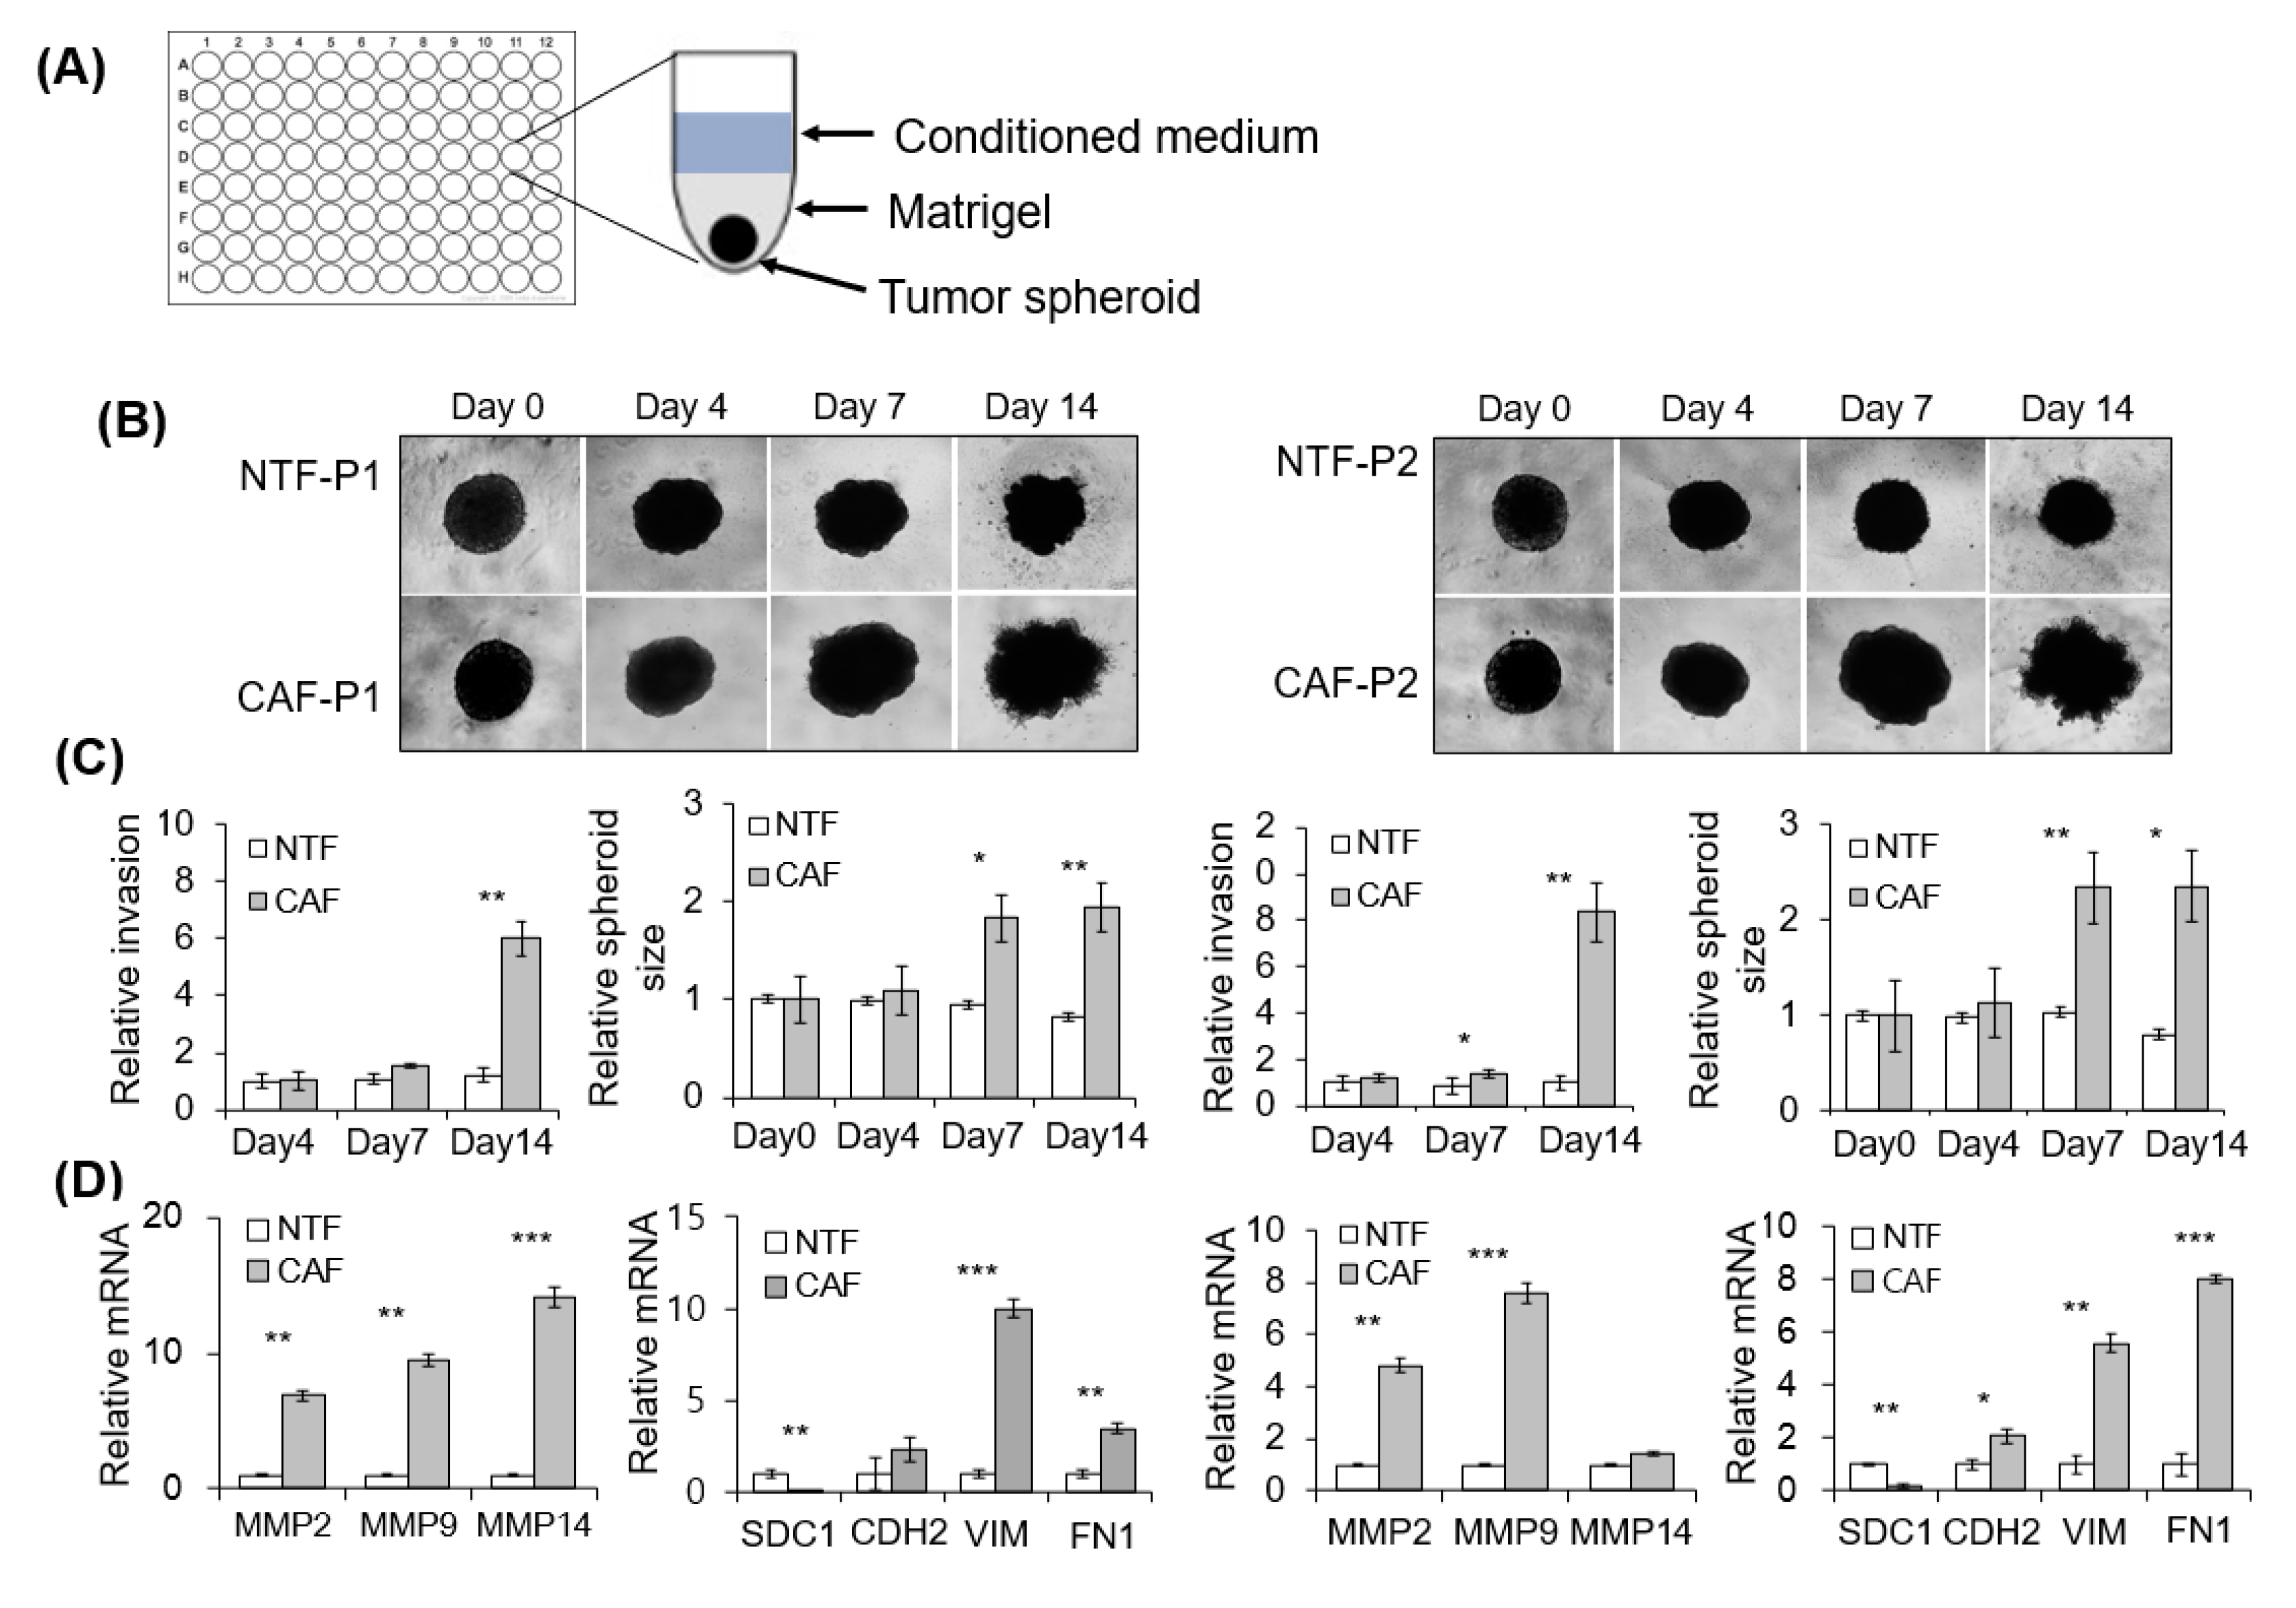
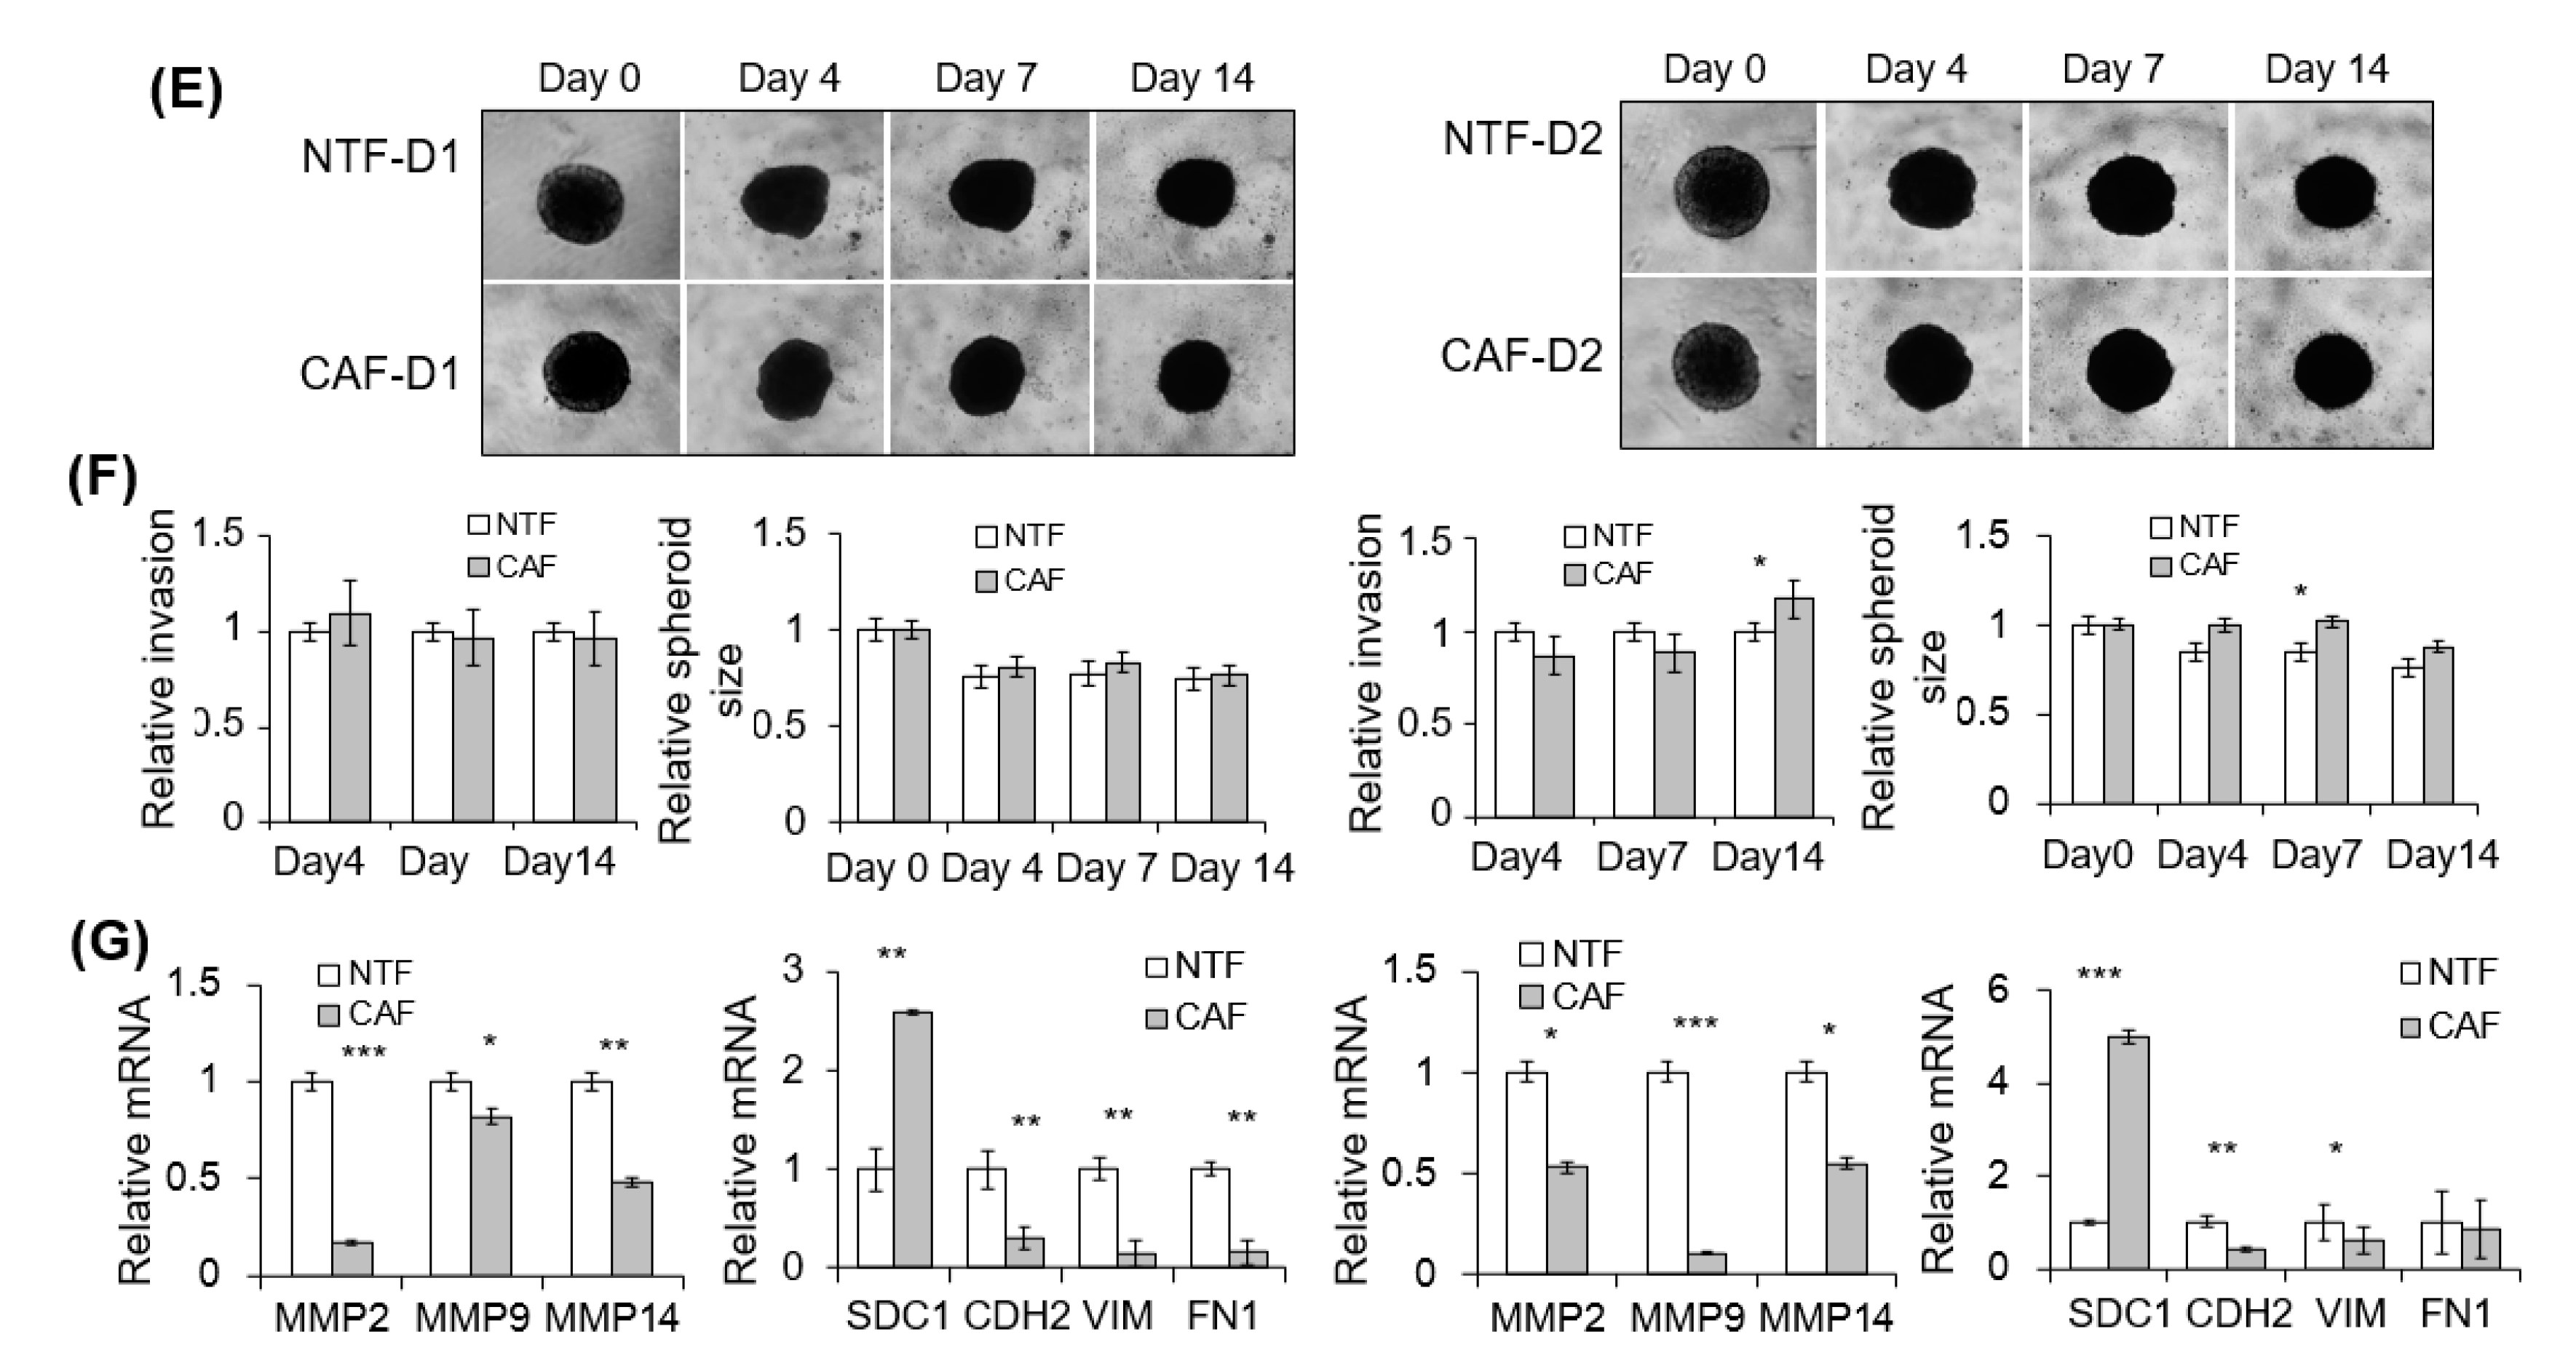
2.3. Effect of CAFs on Matrigel Invasion of HNSCC Cells
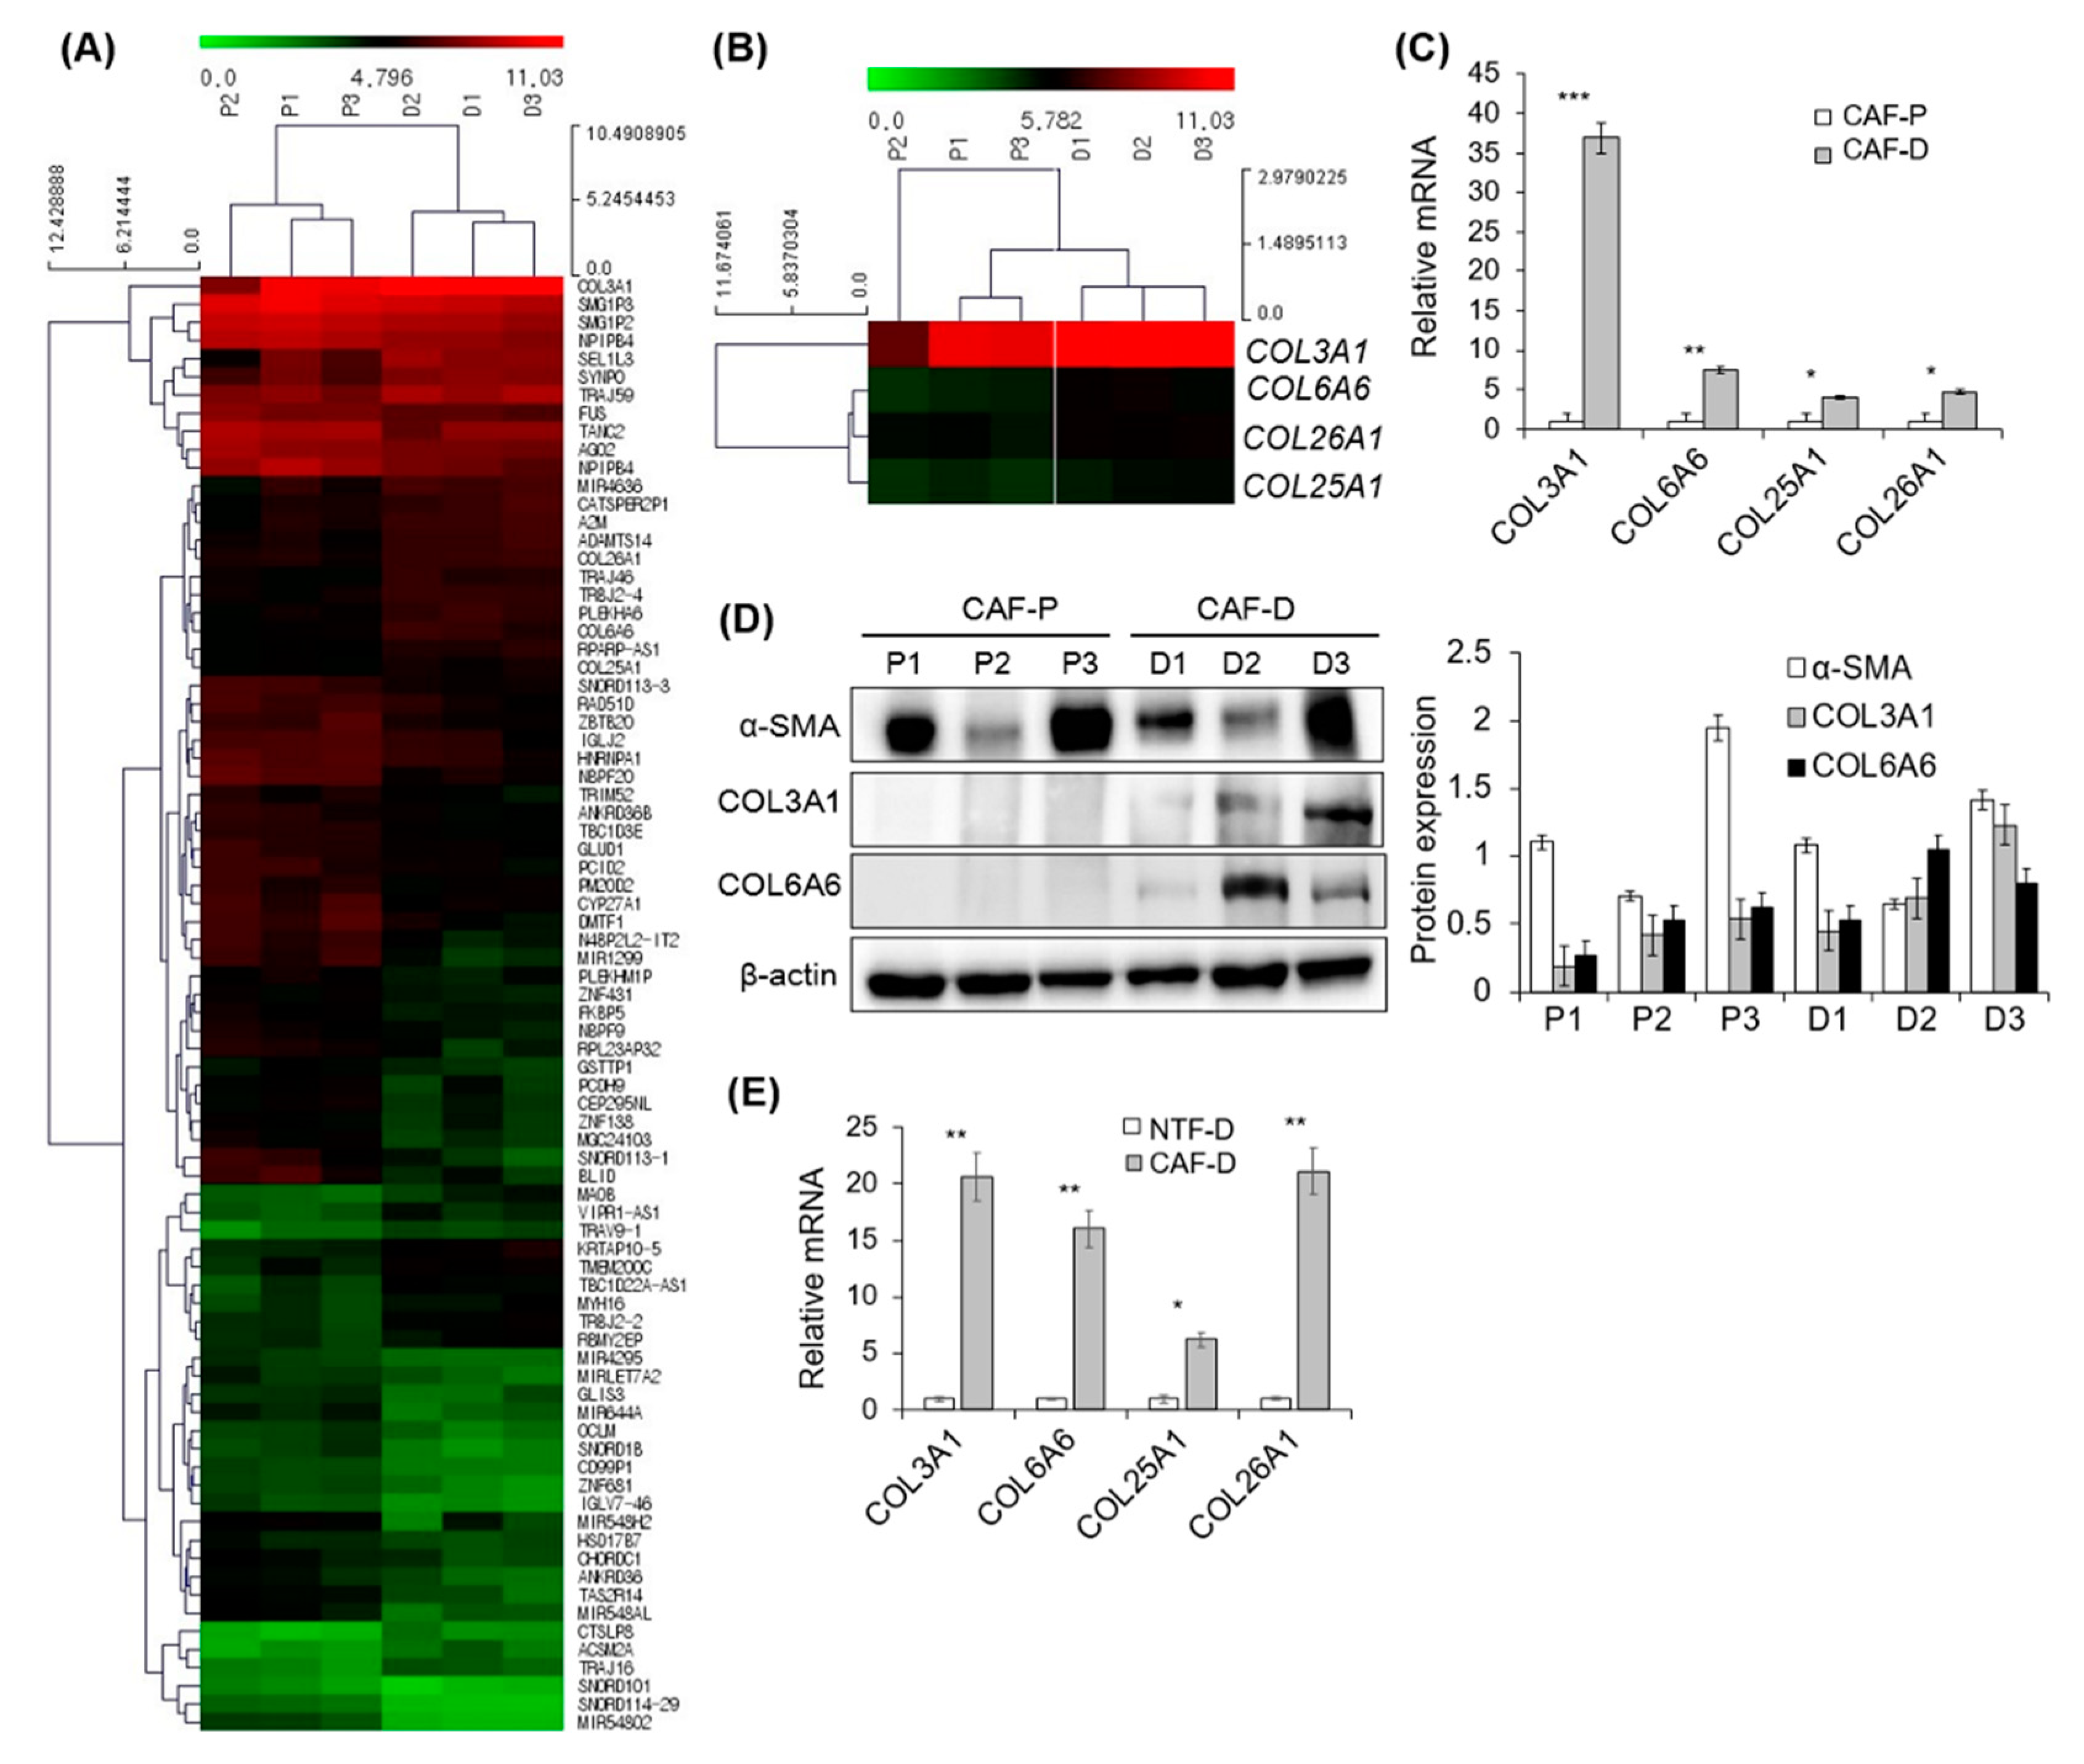
2.4. DNA Microarray Analysis of Primary CAF-P and CAF-D
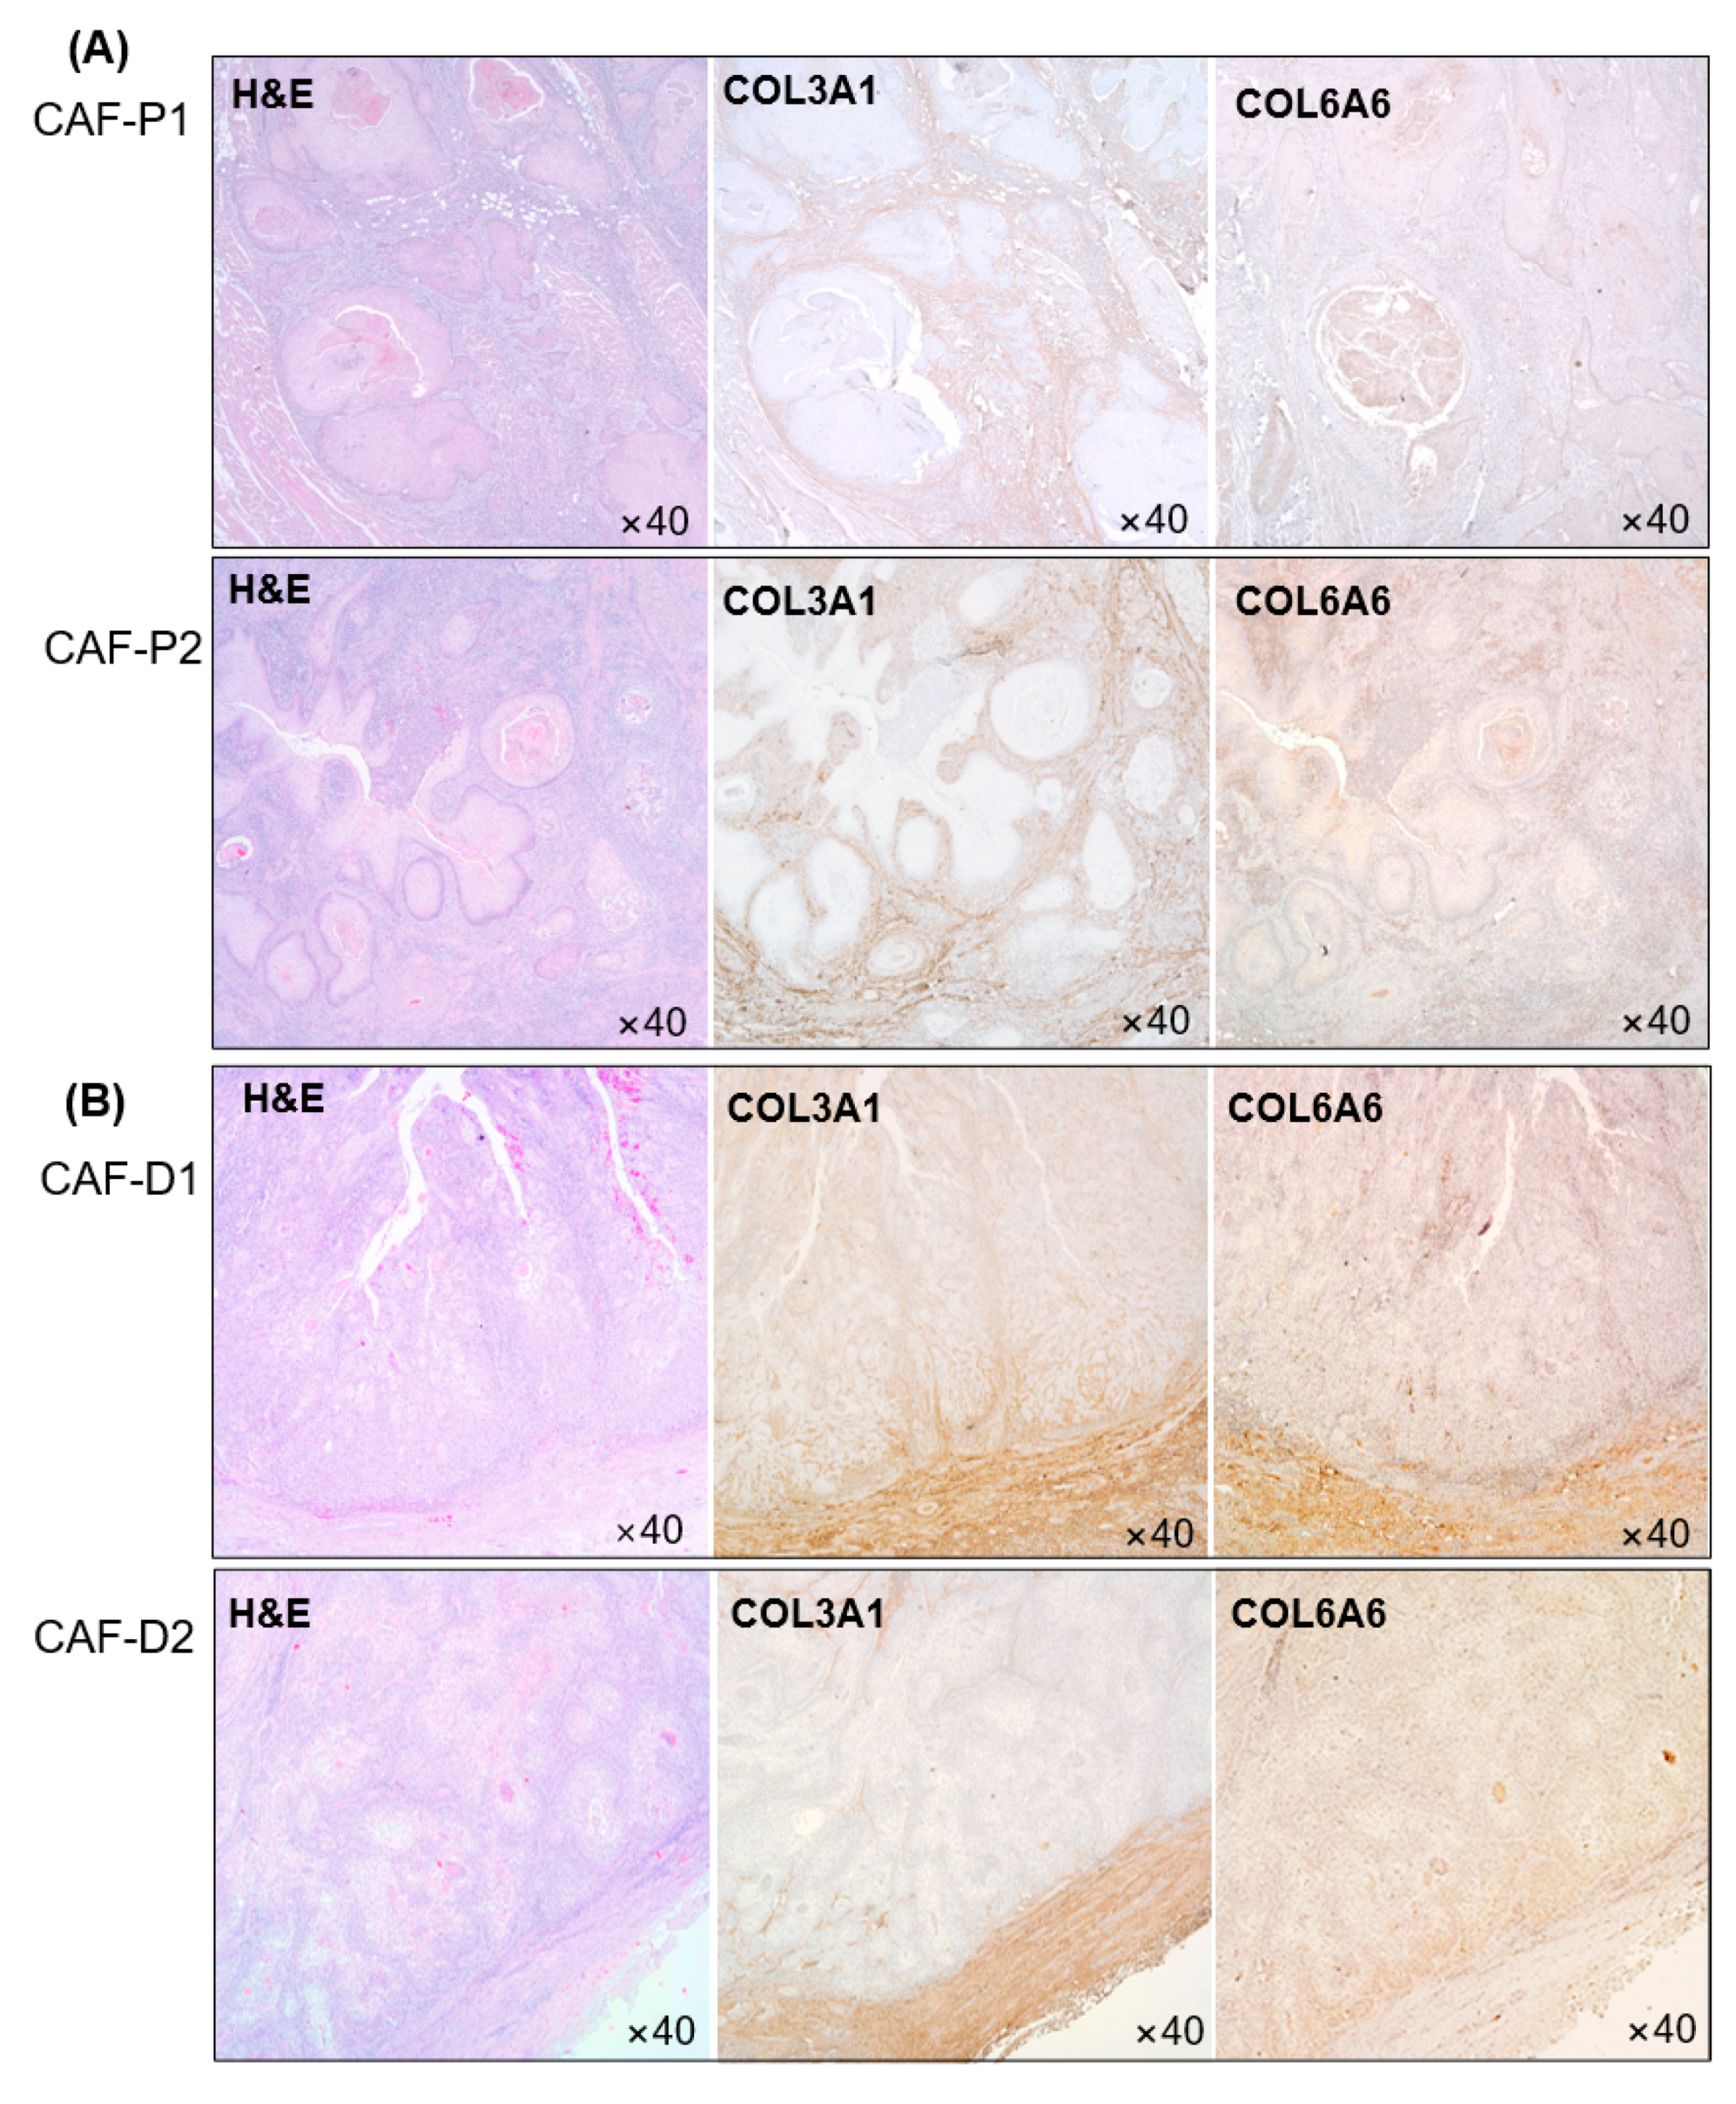
2.5. IHC Analysis of Collagen Proteins in Tissues Obtained from Patients with HNSCC
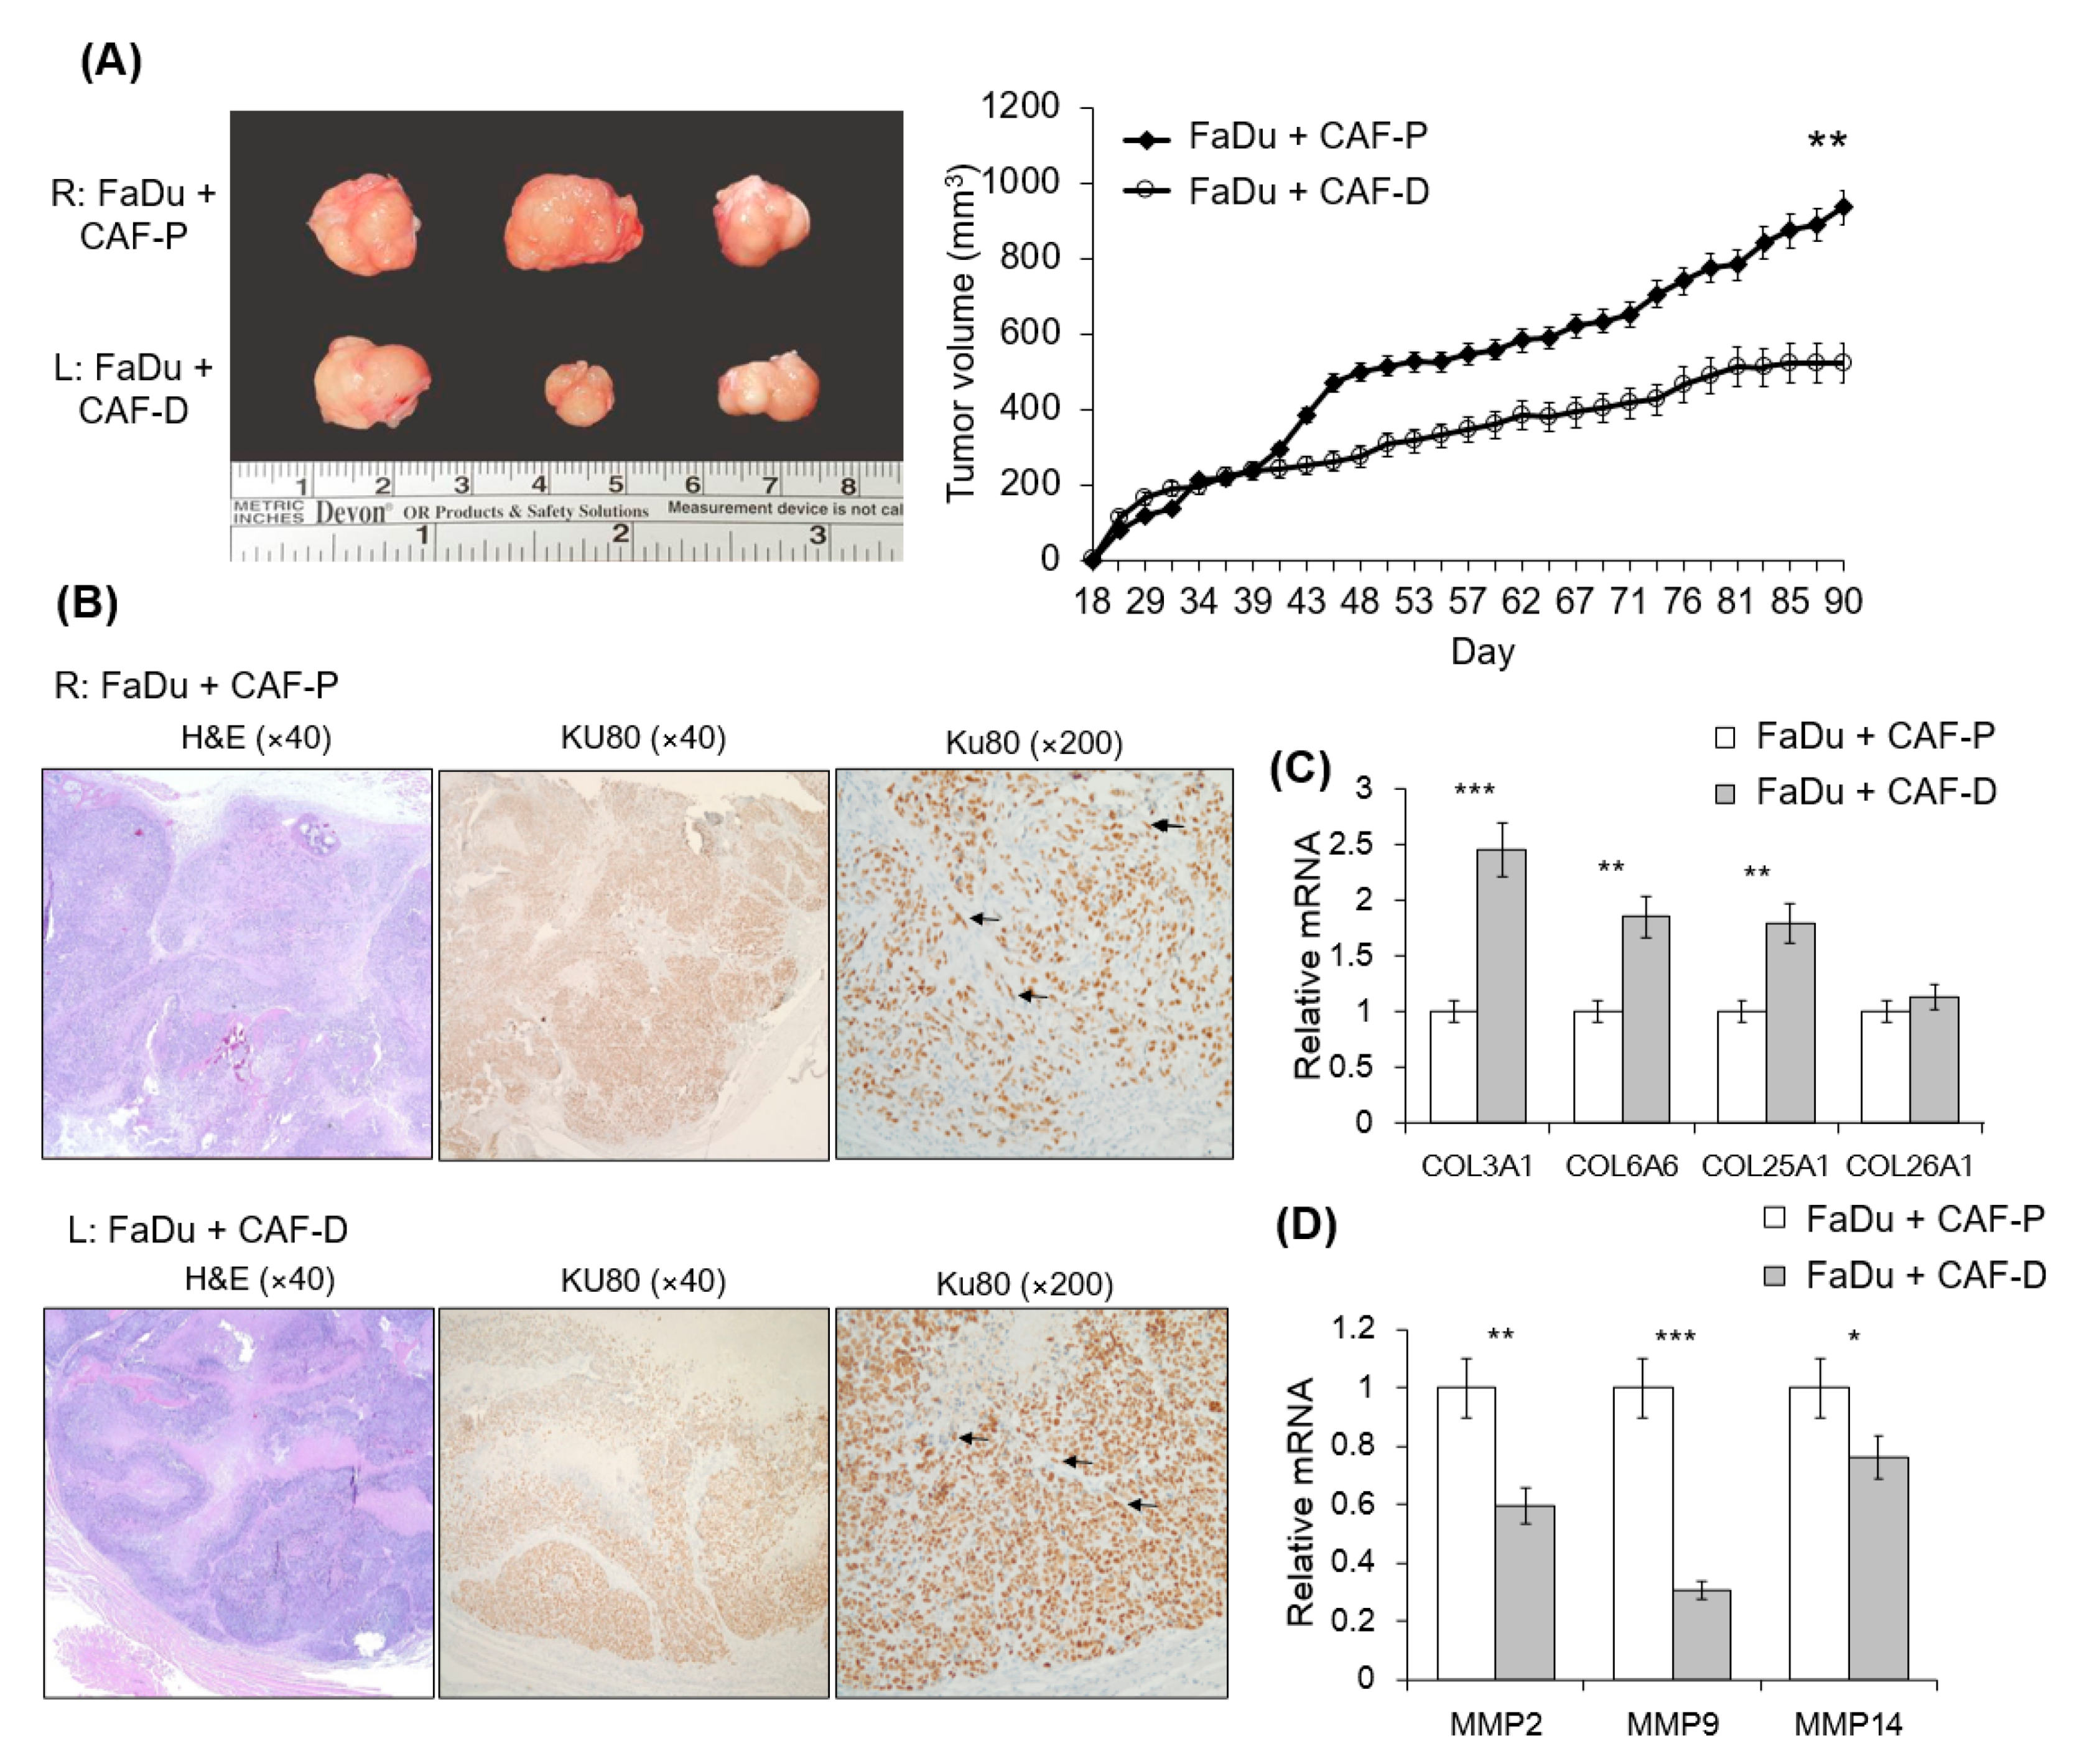
2.6. Mouse Tumorigenesis from FaDu and CAF-P/CAF-D
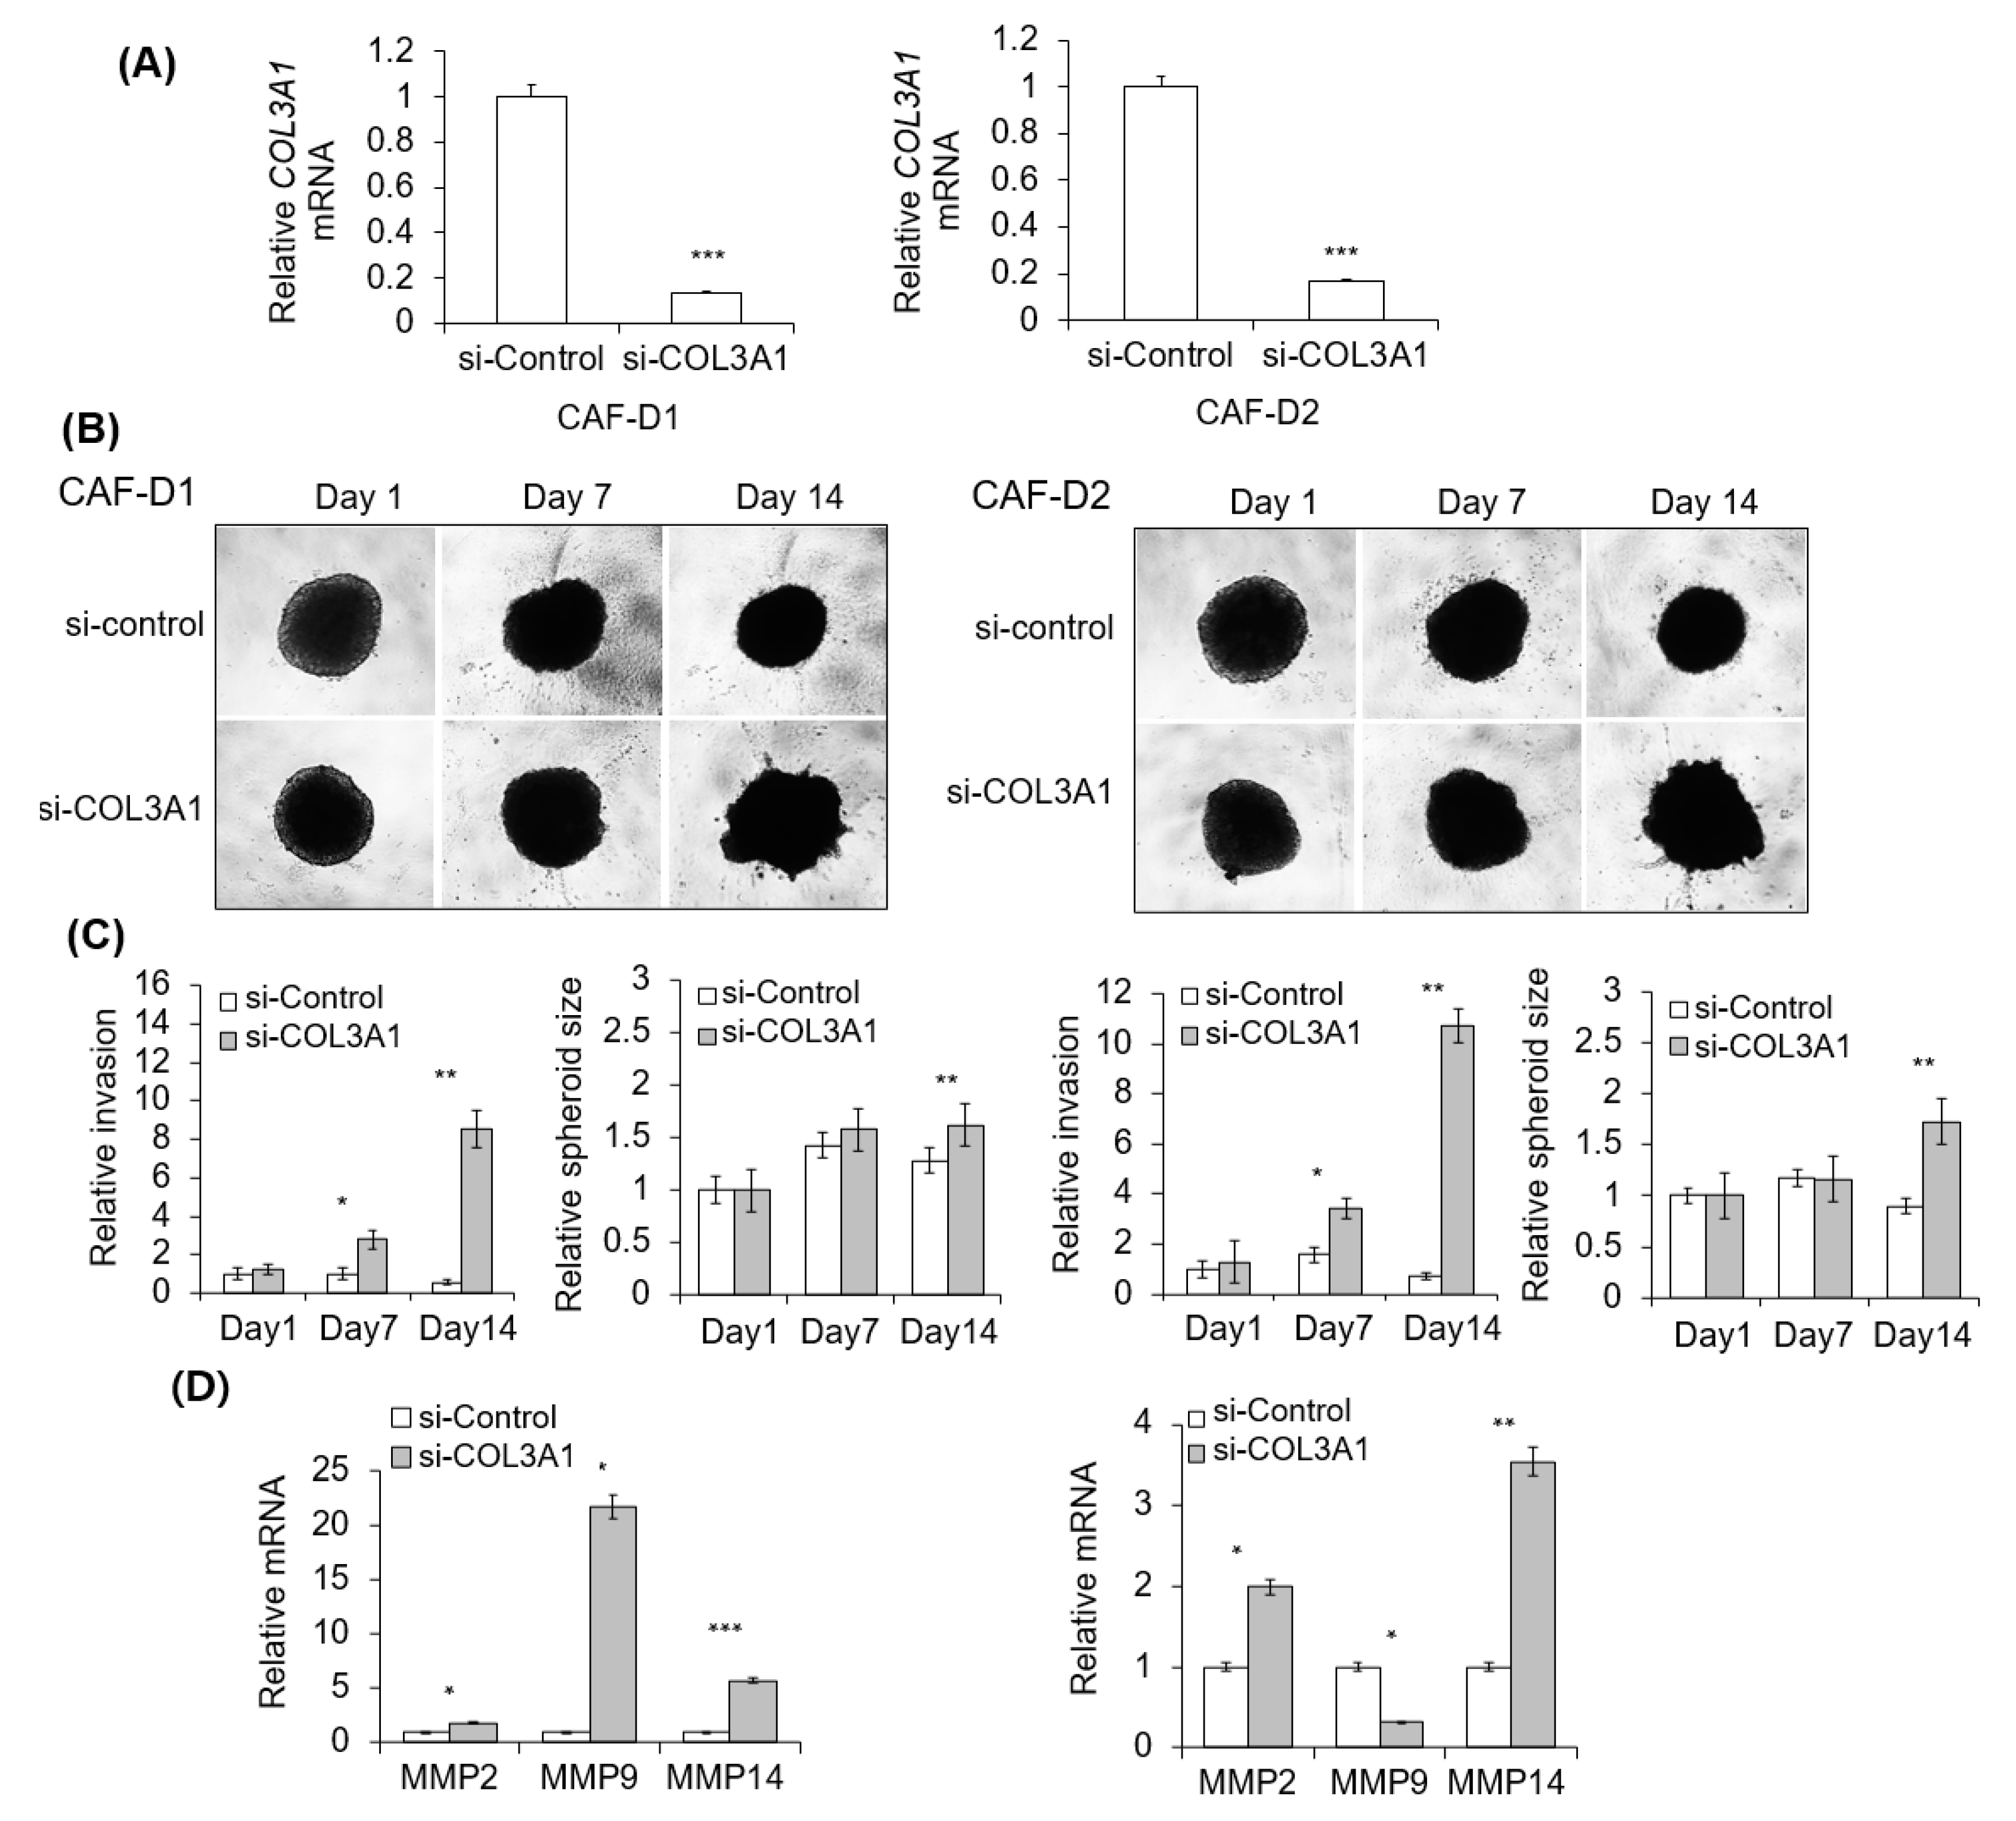
2.7. Effect of CAF-D with Collagen Knockdown on FaDu Matrigel Invasion
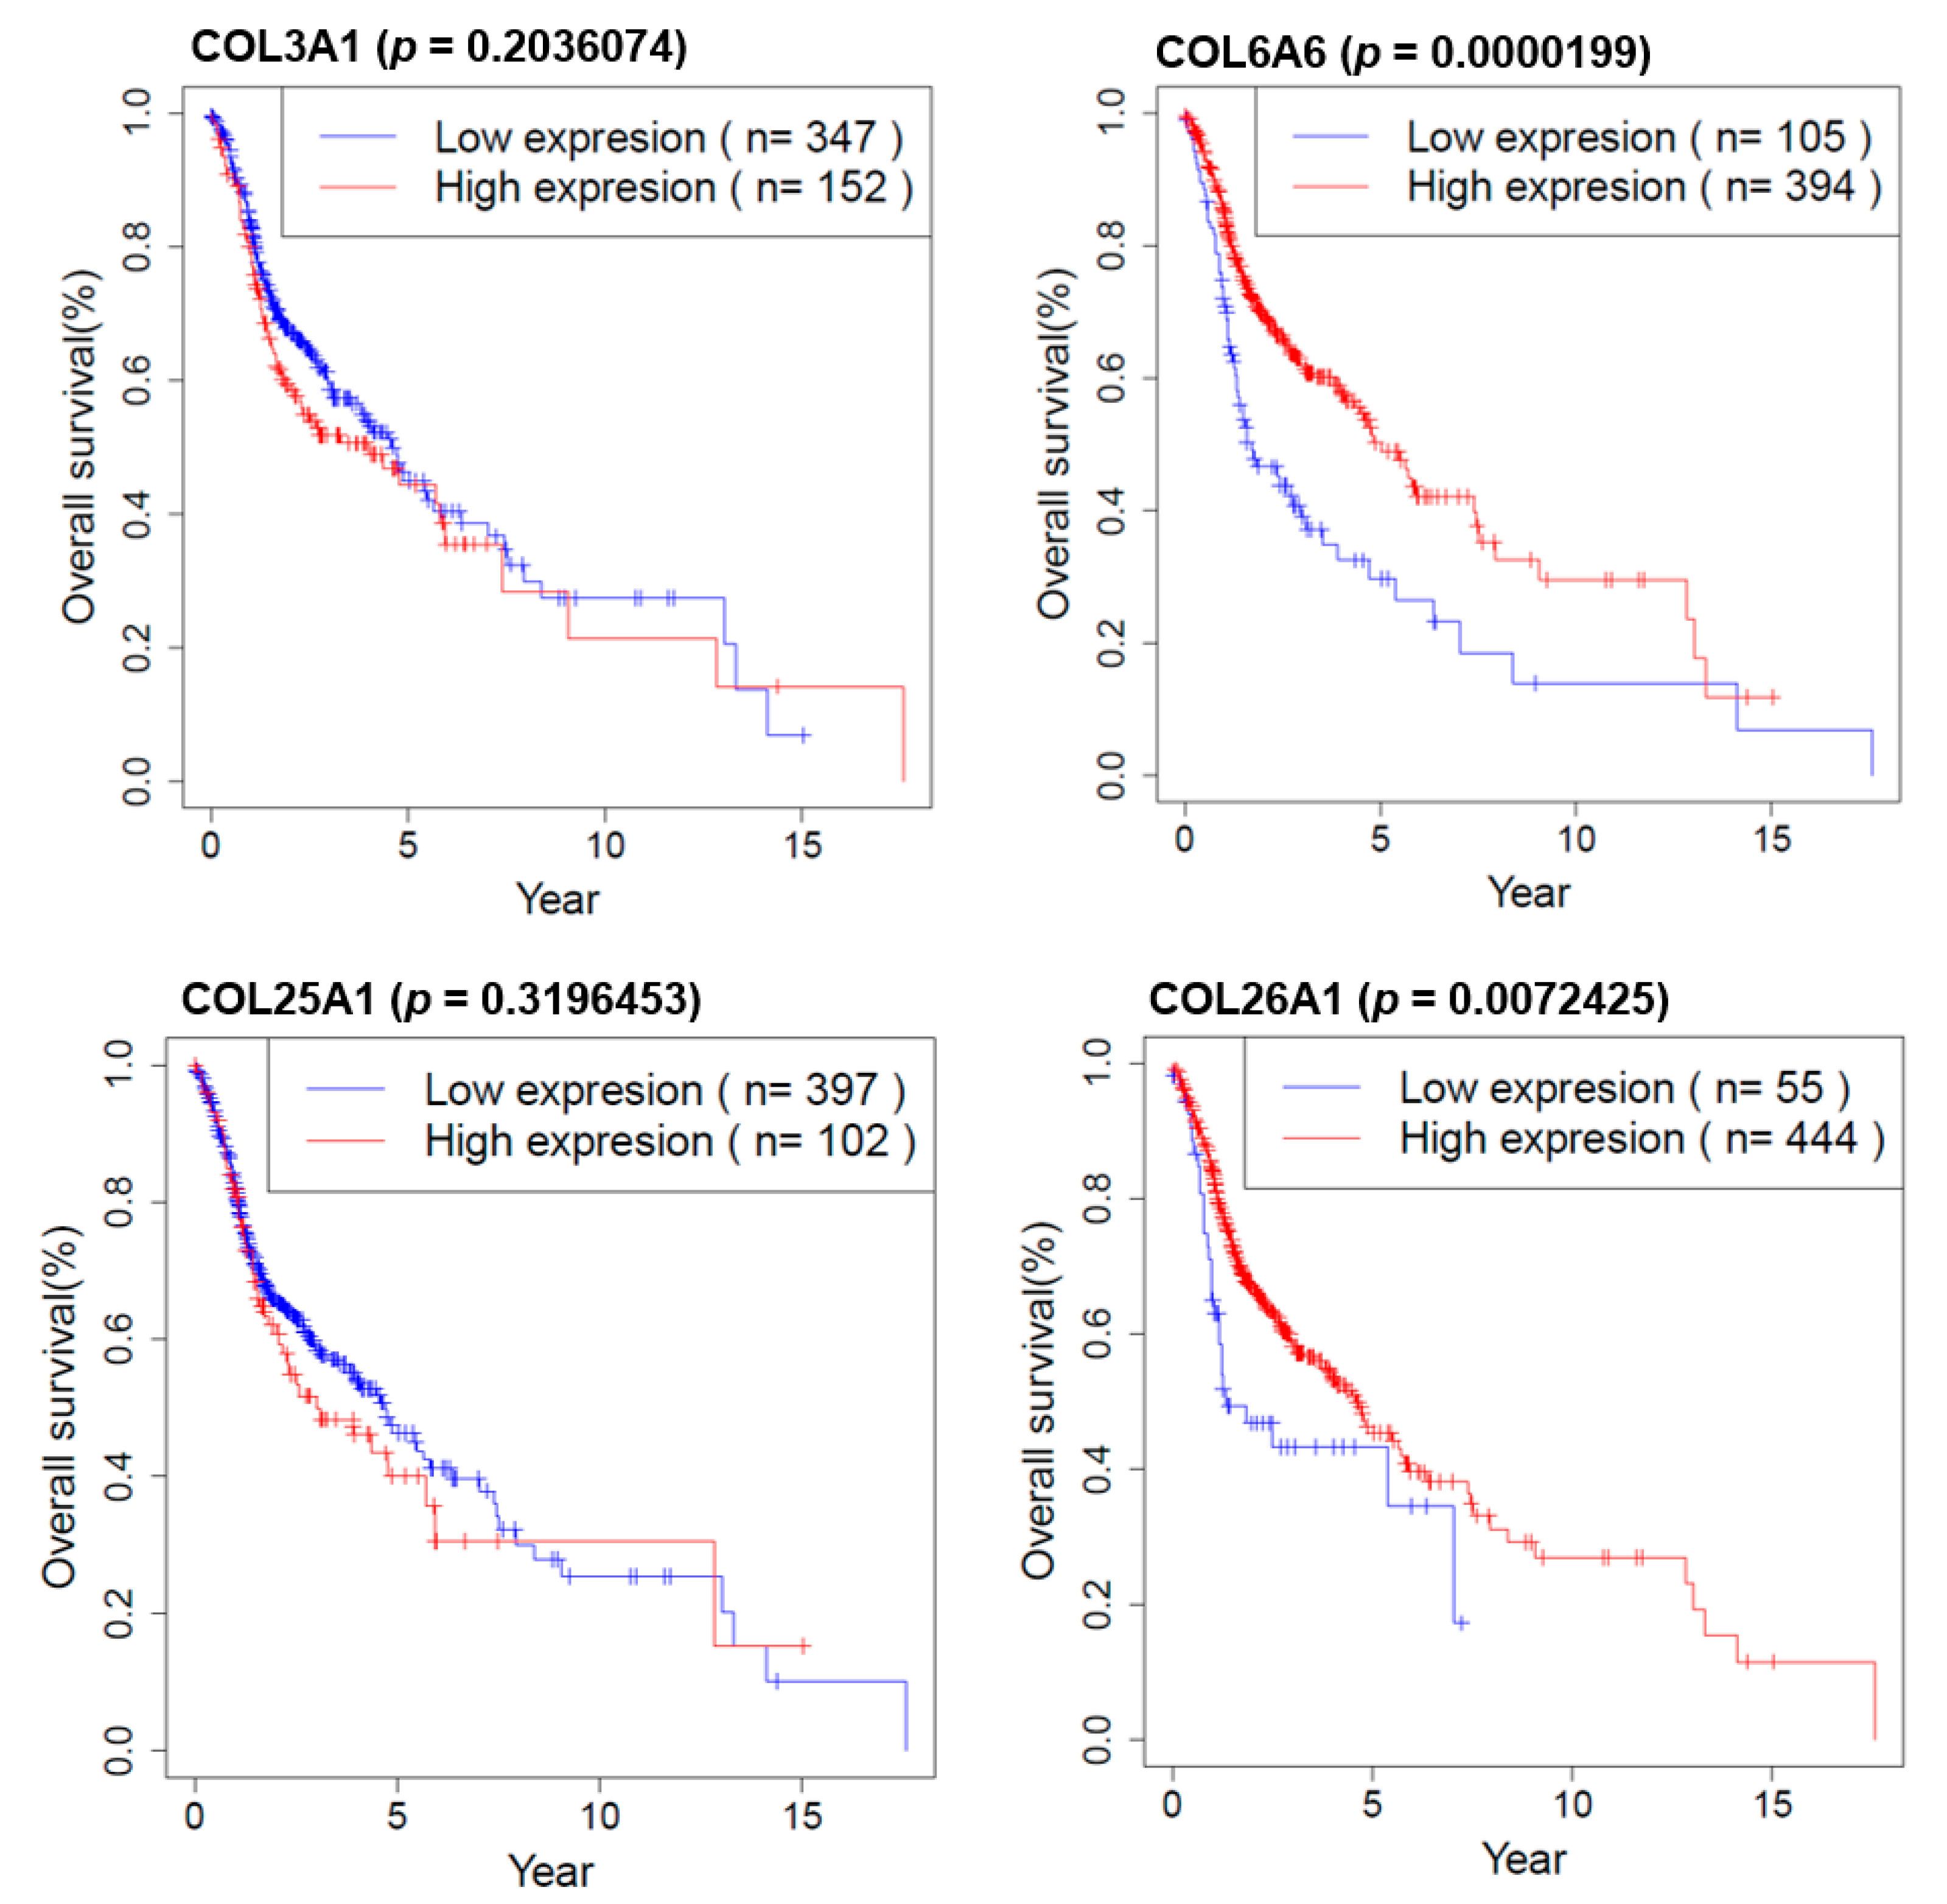
2.8. Survival Analysis of COL Genes in HNSCC Patients
3. Discussion
4. Materials and Methods
4.1. Ethical Statement
4.2. Chemicals and Reagents
4.3. Immunohistochemical Analysis of Clinical Specimens
4.4. Fibroblast Primary Culture from Fresh HNSCC Tissues
4.5. HNSCC Cell Culture and FaDu Spheroid Formation
4.6. Matrigel Invasion Assay
4.7. Real-Time Polymerase Chain Reaction
4.8. DNA Microarray Analysis
4.9. Western Blot Analysis
4.10. Mouse Xenograft Model
4.11. Transfection of Small Interfering RNA
4.12. Statistical Analysis
5. Conclusions
Supplementary Materials
Author Contributions
Funding
Institutional Review Board Statement
Informed Consent Statement
Data Availability Statement
Acknowledgments
Conflicts of Interest
Abbreviations
| HNSCC | head and neck squamous cell carcinoma |
| OSCC | oral squamous cell carcinoma |
| ECM | extracellular matrix |
| CAF | cancer-associated fibroblast |
| CM | conditioned medium |
References
- Bhowmick, N.A.; Neilson, E.G.; Moses, H.L. Stromal fibroblasts in cancer initiation and progression. Nature 2004, 432, 332–337. [Google Scholar] [CrossRef]
- Sadlonova, A.; Bowe, D.B.; Novak, Z.; Mukherjee, S.; Duncan, V.E.; Page, G.P.; Frost, A.R. Identification of molecular distinctions between normal breast-associated fibroblasts and breast cancer-associated fibroblasts. Cancer Microenviron. 2009, 2, 9–21. [Google Scholar] [CrossRef] [Green Version]
- Hanahan, D.; Weinberg, R.A. Hallmarks of cancer: The next generation. Cell 2011, 144, 646–674. [Google Scholar] [CrossRef] [PubMed] [Green Version]
- Ohlund, D.; Elyada, E.; Tuveson, D. Fibroblast heterogeneity in the cancer wound. J. Exp. Med. 2014, 211, 1503–1523. [Google Scholar] [CrossRef]
- Tomasek, J.J.; Gabbiani, G.; Hinz, B.; Chaponnier, C.; Brown, R.A. Myofibroblasts and mechano-regulation of connective tissue remodelling. Nat. Rev. Mol. Cell Biol. 2002, 3, 349–363. [Google Scholar] [CrossRef] [PubMed]
- Hinz, B.; Celetta, G.; Tomasek, J.J.; Gabbiani, G.; Chaponnier, C. Alpha-smooth muscle actin expression upregulates fibroblast contractile activity. Mol. Biol. Cell 2001, 12, 2730–2741. [Google Scholar] [CrossRef] [Green Version]
- Durning, P.; Schor, S.L.; Sellwood, R.A. Fibroblasts from patients with breast cancer show abnormal migratory behaviour in vitro. Lancet 1984, 2, 890–892. [Google Scholar] [CrossRef]
- Ayala, G.; Tuxhorn, J.A.; Wheeler, T.M.; Frolov, A.; Scardino, P.T.; Ohori, M.; Wheeler, M.; Spitler, J.; Rowley, D.R. Reactive stroma as a predictor of biochemical-free recurrence in prostate cancer. Clin. Cancer Res. 2003, 9, 4792–4801. [Google Scholar]
- Olumi, A.F.; Grossfeld, G.D.; Hayward, S.W.; Carroll, P.R.; Tlsty, T.D.; Cunha, G.R. Carcinoma-associated fibroblasts direct tumor progression of initiated human prostatic epithelium. Cancer Res. 1999, 59, 5002–5011. [Google Scholar] [CrossRef]
- Suetsugu, A.; Osawa, Y.; Nagaki, M.; Saji, S.; Moriwaki, H.; Bouvet, M.; Hoffman, R.M. Imaging the recruitment of cancer-associated fibroblasts by liver-metastatic colon cancer. J. Cell. Biochem. 2011, 112, 949–953. [Google Scholar] [CrossRef] [PubMed]
- Stoker, M.G.; Shearer, M.; O’Neill, C. Growth inhibition of polyoma-transformed cells by contact with static normal fibroblasts. J. Cell Sci. 1966, 1, 297–310. [Google Scholar]
- Flaberg, E.; Markasz, L.; Petranyi, G.; Stuber, G.; Dicso, F.; Alchihabi, N.; Olah, E.; Csizy, I.; Jozsa, T.; Andren, O.; et al. High-throughput live-cell imaging reveals differential inhibition of tumor cell proliferation by human fibroblasts. Int. J. Cancer 2011, 128, 2793–2802. [Google Scholar] [CrossRef]
- Cox, T.R.; Erler, J.T. Remodeling and homeostasis of the extracellular matrix: Implications for fibrotic diseases and cancer. Dis. Model. Mech. 2011, 4, 165–178. [Google Scholar] [CrossRef] [Green Version]
- Bonnans, C.; Chou, J.; Werb, Z. Remodelling the extracellular matrix in development and disease. Nat. Rev. Mol. Cell Biol. 2014, 15, 786–801. [Google Scholar] [CrossRef] [PubMed]
- Charras, G.; Sahai, E. Physical influences of the extracellular environment on cell migration. Nat. Rev. Mol. Cell Biol. 2014, 15, 813–824. [Google Scholar] [CrossRef] [PubMed]
- Butcher, D.T.; Alliston, T.; Weaver, V.M. A tense situation: Forcing tumour progression. Nat. Rev. Cancer 2009, 9, 108–122. [Google Scholar] [CrossRef] [PubMed]
- Huijbers, I.J.; Iravani, M.; Popov, S.; Robertson, D.; Al-Sarraj, S.; Jones, C.; Isacke, C.M. A role for fibrillar collagen deposition and the collagen internalization receptor endo180 in glioma invasion. PLoS ONE 2010, 5, e9808. [Google Scholar] [CrossRef]
- Riching, K.M.; Cox, B.L.; Salick, M.R.; Pehlke, C.; Riching, A.S.; Ponik, S.M.; Bass, B.R.; Crone, W.C.; Jiang, Y.; Weaver, A.M.; et al. 3D collagen alignment limits protrusions to enhance breast cancer cell persistence. Biophys. J. 2014, 107, 2546–2558. [Google Scholar] [CrossRef] [Green Version]
- Sapudom, J.; Rubner, S.; Martin, S.; Kurth, T.; Riedel, S.; Mierke, C.T.; Pompe, T. The phenotype of cancer cell invasion controlled by fibril diameter and pore size of 3D collagen networks. Biomaterials 2015, 52, 367–375. [Google Scholar] [CrossRef] [PubMed] [Green Version]
- Ogawa, Y.; Masugi, Y.; Abe, T.; Yamazaki, K.; Ueno, A.; Fujii-Nishimura, Y.; Hori, S.; Yagi, H.; Abe, Y.; Kitago, M.; et al. Three distinct stroma types in human pancreatic cancer identified by image analysis of fibroblast subpopulations and collagen. Clin. Cancer Res. 2021, 27, 107–119. [Google Scholar] [CrossRef]
- Brisson, B.K.; Mauldin, E.A.; Lei, W.; Vogel, L.K.; Power, A.M.; Lo, A.; Dopkin, D.; Khanna, C.; Wells, R.G.; Pure, E.; et al. Type III Collagen Directs Stromal Organization and Limits Metastasis in a Murine Model of Breast Cancer. Am. J. Pathol. 2015, 185, 1471–1486. [Google Scholar] [CrossRef] [PubMed] [Green Version]
- Shoulders, M.D.; Raines, R.T. Collagen structure and stability. Annu. Rev. Biochem. 2009, 78, 929–958. [Google Scholar] [CrossRef] [PubMed] [Green Version]
- Edmondson, R.; Broglie, J.J.; Adcock, A.F.; Yang, L. Three-dimensional cell culture systems and their applications in drug discovery and cell-based biosensors. Assay Drug Dev. Technol. 2014, 12, 207–218. [Google Scholar] [CrossRef] [Green Version]
- Hirschhaeuser, F.; Leidig, T.; Rodday, B.; Lindemann, C.; Mueller-Klieser, W. Test system for trifunctional antibodies in 3D MCTS culture. J. Biomol. Screen. 2009, 14, 980–990. [Google Scholar] [CrossRef] [Green Version]
- Jung, H.R.; Kang, H.M.; Ryu, J.W.; Kim, D.S.; Noh, K.H.; Kim, E.S.; Lee, H.J.; Chung, K.S.; Cho, H.S.; Kim, N.S.; et al. Cell Spheroids with Enhanced Aggressiveness to Mimic Human Liver Cancer In Vitro and In Vivo. Sci. Rep. 2017, 7, 10499. [Google Scholar] [CrossRef] [Green Version]
- Lazzari, G.; Nicolas, V.; Matsusaki, M.; Akashi, M.; Couvreur, P.; Mura, S. Multicellular spheroid based on a triple co-culture: A novel 3D model to mimic pancreatic tumor complexity. Acta Biomater. 2018, 78, 296–307. [Google Scholar] [CrossRef]
- Micke, P.; Ostman, A. Exploring the tumour environment: Cancer-associated fibroblasts as targets in cancer therapy. Expert Opin. Ther. Targets 2005, 9, 1217–1233. [Google Scholar] [CrossRef] [PubMed]
- Augsten, M. Cancer-associated fibroblasts as another polarized cell type of the tumor microenvironment. Front. Oncol. 2014, 4, 62. [Google Scholar] [CrossRef]
- Chang, P.H.; Hwang-Verslues, W.W.; Chang, Y.C.; Chen, C.C.; Hsiao, M.; Jeng, Y.M.; Chang, K.J.; Lee, E.Y.; Shew, J.Y.; Lee, W.H. Activation of Robo1 signaling of breast cancer cells by Slit2 from stromal fibroblast restrains tumorigenesis via blocking PI3K/Akt/beta-catenin pathway. Cancer Res. 2012, 72, 4652–4661. [Google Scholar] [CrossRef] [Green Version]
- Green, J.L.; La, J.; Yum, K.W.; Desai, P.; Rodewald, L.W.; Zhang, X.; Leblanc, M.; Nusse, R.; Lewis, M.T.; Wahl, G.M. Paracrine Wnt signaling both promotes and inhibits human breast tumor growth. Proc. Natl. Acad. Sci. USA 2013, 110, 6991–6996. [Google Scholar] [CrossRef] [PubMed] [Green Version]
- Paszek, M.J.; Zahir, N.; Johnson, K.R.; Lakins, J.N.; Rozenberg, G.I.; Gefen, A.; Reinhart-King, C.A.; Margulies, S.S.; Dembo, M.; Boettiger, D.; et al. Tensional homeostasis and the malignant phenotype. Cancer Cell 2005, 8, 241–254. [Google Scholar] [CrossRef] [Green Version]
- Fang, M.; Yuan, J.; Peng, C.; Li, Y. Collagen as a double-edged sword in tumor progression. Tumor Biol. 2014, 35, 2871–2882. [Google Scholar] [CrossRef] [Green Version]
- Sabeh, F.; Shimizu-Hirota, R.; Weiss, S.J. Protease-dependent versus -independent cancer cell invasion programs: Three-dimensional amoeboid movement revisited. J. Cell Biol. 2009, 185, 11–19. [Google Scholar] [CrossRef] [Green Version]
- Ohlund, D.; Handly-Santana, A.; Biffi, G.; Elyada, E.; Almeida, A.S.; Ponz-Sarvise, M.; Corbo, V.; Oni, T.E.; Hearn, S.A.; Lee, E.J.; et al. Distinct populations of inflammatory fibroblasts and myofibroblasts in pancreatic cancer. J. Exp. Med. 2017, 214, 579–596. [Google Scholar] [CrossRef]
- Pompella, L.; Tirino, G.; Pappalardo, A.; Caterino, M.; Ventriglia, A.; Nacca, V.; Orditura, M.; Ciardiello, F.; De Vita, F. Pancreatic Cancer Molecular Classifications: From Bulk Genomics to Single Cell Analysis. Int. J. Mol. Sci. 2020, 21, 2814. [Google Scholar] [CrossRef] [PubMed] [Green Version]
- Friedl, P.; Alexander, S. Cancer invasion and the microenvironment: Plasticity and reciprocity. Cell 2011, 147, 992–1009. [Google Scholar] [CrossRef] [Green Version]
- Friedl, P.; Gilmour, D. Collective cell migration in morphogenesis, regeneration and cancer. Nat. Rev. Mol. Cell Biol. 2009, 10, 445–457. [Google Scholar] [CrossRef]
- Wyckoff, J.B.; Wang, Y.; Lin, E.Y.; Li, J.F.; Goswami, S.; Stanley, E.R.; Segall, J.E.; Pollard, J.W.; Condeelis, J. Direct visualization of macrophage-assisted tumor cell intravasation in mammary tumors. Cancer Res. 2007, 67, 2649–2656. [Google Scholar] [CrossRef] [PubMed] [Green Version]
- Wang, X.Q.; Tang, Z.X.; Yu, D.; Cui, S.J.; Jiang, Y.H.; Zhang, Q.; Wang, J.; Yang, P.Y.; Liu, F. Epithelial but not stromal expression of collagen alpha-1(III) is a diagnostic and prognostic indicator of colorectal carcinoma. Oncotarget 2016, 7, 8823–8838. [Google Scholar] [CrossRef] [PubMed] [Green Version]
- Pham, V.C.; Henzel, W.J.; Lill, J.R. Rapid on-membrane proteolytic cleavage for Edman sequencing and mass spectrometric identification of proteins. Electrophoresis 2005, 26, 4243–4251. [Google Scholar] [CrossRef] [PubMed]
- Beck, A.H.; Espinosa, I.; Gilks, C.B.; van de Rijn, M.; West, R.B. The fibromatosis signature defines a robust stromal response in breast carcinoma. Lab. Investig. 2008, 88, 591–601. [Google Scholar] [CrossRef] [PubMed]
- Theocharidis, G.; Drymoussi, Z.; Kao, A.P.; Barber, A.H.; Lee, D.A.; Braun, K.M.; Connelly, J.T. Type VI Collagen Regulates Dermal Matrix Assembly and Fibroblast Motility. J. Investig. Dermatol. 2016, 136, 74–83. [Google Scholar] [CrossRef] [PubMed] [Green Version]
- Long, R.; Liu, Z.; Li, J.; Yu, H. COL6A6 interacted with P4HA3 to suppress the growth and metastasis of pituitary adenoma via blocking PI3K-Akt pathway. Aging 2019, 11, 8845–8859. [Google Scholar] [CrossRef]
- Kalluri, R.; Zeisberg, M. Fibroblasts in cancer. Nat. Rev. Cancer 2006, 6, 392–401. [Google Scholar] [CrossRef] [PubMed]
- Pietras, K.; Ostman, A. Hallmarks of cancer: Interactions with the tumor stroma. Exp. Cell Res. 2010, 316, 1324–1331. [Google Scholar] [CrossRef]
- Desmouliere, A.; Guyot, C.; Gabbiani, G. The stroma reaction myofibroblast: A key player in the control of tumor cell behavior. Int. J. Dev. Biol. 2004, 48, 509–517. [Google Scholar] [CrossRef] [Green Version]
- Hawinkels, L.J.; Paauwe, M.; Verspaget, H.W.; Wiercinska, E.; van der Zon, J.M.; van der Ploeg, K.; Koelink, P.J.; Lindeman, J.H.; Mesker, W.; ten Dijke, P.; et al. Interaction with colon cancer cells hyperactivates TGF-β signaling in cancer-associated fibroblasts. Oncogene 2014, 33, 97–107. [Google Scholar] [CrossRef] [Green Version]
- Madar, S.; Brosh, R.; Buganim, Y.; Ezra, O.; Goldstein, I.; Solomon, H.; Kogan, I.; Goldfinger, N.; Klocker, H.; Rotter, V. Modulated expression of WFDC1 during carcinogenesis and cellular senescence. Carcinogenesis 2009, 30, 20–27. [Google Scholar] [CrossRef] [Green Version]
- Wendling, O.; Bornert, J.M.; Chambon, P.; Metzger, D. Efficient temporally-controlled targeted mutagenesis in smooth muscle cells of the adult mouse. Genesis 2009, 47, 14–18. [Google Scholar] [CrossRef]
- Okada, H.; Danoff, T.M.; Kalluri, R.; Neilson, E.G. Early role of Fsp1 in epithelial-mesenchymal transformation. Am. J. Physiol. 1997, 273, F563–F574. [Google Scholar] [CrossRef]
- Allard, J.; Li, K.; Lopez, X.M.; Blanchard, S.; Barbot, P.; Rorive, S.; Decaestecker, C.; Pochet, R.; Bohl, D.; Lepore, A.C.; et al. Immunohistochemical toolkit for tracking and quantifying xenotransplanted human stem cells. Regen. Med. 2014, 9, 437–452. [Google Scholar] [CrossRef] [PubMed] [Green Version]
- Kim, J.; Kang, H.S.; Lee, Y.J.; Lee, H.J.; Yun, J.; Shin, J.H.; Lee, C.W.; Kwon, B.M.; Hong, S.H. EGR1-dependent PTEN upregulation by 2-benzoyloxycinnamaldehyde attenuates cell invasion and EMT in colon cancer. Cancer Lett. 2014, 349, 35–44. [Google Scholar] [CrossRef] [PubMed]


Publisher’s Note: MDPI stays neutral with regard to jurisdictional claims in published maps and institutional affiliations. |
© 2021 by the authors. Licensee MDPI, Basel, Switzerland. This article is an open access article distributed under the terms and conditions of the Creative Commons Attribution (CC BY) license (http://creativecommons.org/licenses/by/4.0/).
Share and Cite
Kang, S.H.; Oh, S.Y.; Lee, H.-J.; Kwon, T.-G.; Kim, J.-W.; Lee, S.-T.; Choi, S.-Y.; Hong, S.-H. Cancer-Associated Fibroblast Subgroups Showing Differential Promoting Effect on HNSCC Progression. Cancers 2021, 13, 654. https://doi.org/10.3390/cancers13040654
Kang SH, Oh SY, Lee H-J, Kwon T-G, Kim J-W, Lee S-T, Choi S-Y, Hong S-H. Cancer-Associated Fibroblast Subgroups Showing Differential Promoting Effect on HNSCC Progression. Cancers. 2021; 13(4):654. https://doi.org/10.3390/cancers13040654
Chicago/Turabian StyleKang, Soo Hyun, Su Young Oh, Heon-Jin Lee, Tae-Geon Kwon, Jin-Wook Kim, Sung-Tak Lee, So-Young Choi, and Su-Hyung Hong. 2021. "Cancer-Associated Fibroblast Subgroups Showing Differential Promoting Effect on HNSCC Progression" Cancers 13, no. 4: 654. https://doi.org/10.3390/cancers13040654