Neuroendocrine Neoplasms: Identification of Novel Metabolic Circuits of Potential Diagnostic Utility

 , ,
, ,  ,
,
Abstract
:Simple Summary
Abstract
1. Introduction
2. Results
3. Discussion
4. Materials and Methods
4.1. Patient Recruitment and Sample Collection
4.2. Sample Preparation
4.3. 1H-NMR Spectroscopic Analysis of Urine Samples
4.4. Statistical Analysis of the Spectral Data
5. Conclusions
Author Contributions
Funding
Institutional Review Board Statement
Informed Consent Statement
Data Availability Statement
Acknowledgments
Conflicts of Interest
References
- Ellis, L.; Shale, M.J.; Coleman, M.P. Carcinoid tumors of the gastrointestinal tract: Trends in incidence in England since 1971. Am. J. Gastroenterol. 2010, 105, 2563–2569. [Google Scholar] [CrossRef] [PubMed]
- Dasari, A.; Shen, C.; Halperin, D.; Zhao, B.; Zhou, S.; Xu, Y.; Shih, T.; Yao, J.C. Trends in the Incidence, Prevalence, and Survival Outcomes in Patients With Neuroendocrine Tumors in the United States. JAMA Oncol. 2017, 3, 1335. [Google Scholar] [CrossRef] [PubMed]
- Clift, A.K.; Faiz, O.; Al-Nahhas, A.; Bockisch, A.; Liedke, M.O.; Schloericke, E.; Wasan, H.; Martin, J.; Ziprin, P.; Moorthy, K.; et al. Role of Staging in Patients with Small Intestinal Neuroendocrine Tumours. J. Gastrointest. Surg. 2016, 20, 180–188. [Google Scholar] [CrossRef] [PubMed]
- Raymond, E.; Dahan, L.; Raoul, J.-L.; Bang, Y.-J.; Borbath, I.; Lombard-Bohas, C.; Valle, J.; Metrakos, P.; Smith, D.; Vinik, A.; et al. Sunitinib malate for the treatment of pancreatic neuroendocrine tumors. N. Engl. J. Med. 2011, 364, 501–513. [Google Scholar] [CrossRef] [PubMed] [Green Version]
- Yao, J.C.; Guthrie, K.A.; Moran, C.; Strosberg, J.R.; Kulke, M.H.; Chan, J.A.; LoConte, N.; McWilliams, R.R.; Wolin, E.M.; Mattar, B.; et al. Phase III Prospective Randomized Comparison Trial of Depot Octreotide Plus Interferon Alfa-2b Versus Depot Octreotide Plus Bevacizumab in Patients with Advanced Carcinoid Tumors: SWOG S0518. J. Clin. Oncol. 2017, 35, 1695–1703. [Google Scholar] [CrossRef] [PubMed]
- Caplin, M.E.; Pavel, M.; Ćwikła, J.B.; Phan, A.T.; Raderer, M.; Sedláčková, E.; Cadiot, G.; Wolin, E.M.; Capdevila, J.; Wall, L.; et al. Lanreotide in metastatic enteropancreatic neuroendocrine tumors. N. Engl. J. Med. 2014, 371, 224–233. [Google Scholar] [CrossRef] [PubMed]
- Strosberg, J.; El-Haddad, G.; Wolin, E.; Hendifar, A.; Yao, J.; Chasen, B.; Mittra, E.; Kunz, P.L.; Kulke, M.H.; Jacene, H.; et al. Phase 3 Trial of177Lu-Dotatate for Midgut Neuroendocrine Tumors. N. Engl. J. Med. 2017, 376, 125–135. [Google Scholar] [CrossRef]
- Frilling, A.; Clift, A.K. Therapeutic strategies for neuroendocrine liver metastases. Cancer 2015, 121. [Google Scholar] [CrossRef]
- Oberg, K.; Modlin, I.M.; De Herder, W.; Pavel, M.; Klimstra, D.; Frilling, A.; Metz, D.C.; Heaney, A.; Kwekkeboom, D.; Strosberg, J.; et al. Consensus on biomarkers for neuroendocrine tumour disease. Lancet Oncol. 2015, 16, e435–e446. [Google Scholar] [CrossRef] [Green Version]
- Nicholson, J.K.; Holmes, E.; Kinross, J.M.; Darzi, A.W.; Takats, Z.; Lindon, J.C. Metabolic phenotyping in clinical and surgical environments. Nature 2012, 491, 384–392. [Google Scholar] [CrossRef]
- Li, S.-C.C.; Essaghir, A.; Martijn, C.; Lloyd, R.V.; Demoulin, J.-B.B.; Oberg, K.; Giandomenico, V.; Öberg, K.; Giandomenico, V. Global microRNA profiling of well-differentiated small intestinal neuroendocrine tumors. Mod. Pathol. 2013, 26, 685–696. [Google Scholar] [CrossRef]
- Malczewska, A.; Frampton, A.E.; Mato Prado, M.; Ameri, S.; Dabrowska, A.F.; Zagorac, S.; Clift, A.K.; Kos-Kudła, B.; Faiz, O.; Stebbing, J.; et al. Circulating MicroRNAs in Small-bowel Neuroendocrine Tumors. Ann. Surg. 2019. [Google Scholar] [CrossRef] [PubMed]
- Khan, M.S.; Tsigani, T.; Rashid, M.; Rabouhans, J.S.; Yu, D.; Luong, T.V.; Caplin, M.; Meyer, T. Circulating tumor cells and EpCAM expression in neuroendocrine tumors. Clin. Cancer Res. 2011, 17, 337–345. [Google Scholar] [CrossRef] [PubMed] [Green Version]
- Boons, G.; Vandamme, T.; Peeters, M.; Beyens, M.; Driessen, A.; Janssens, K.; Zwaenepoel, K.; Roeyen, G.; Van Camp, G.; De Beeck, K.O. Cell-free DNA from metastatic pancreatic neuroendocrine tumor patients contains tumor-specific mutations and copy number variations. Front. Oncol. 2018, 8. [Google Scholar] [CrossRef] [PubMed] [Green Version]
- Modlin, I.M.; Frilling, A.; Salem, R.R.; Alaimo, D.; Drymousis, P.; Wasan, H.S.; Callahan, S.; Faiz, O.; Weng, L.; Teixeira, N.; et al. Blood measurement of neuroendocrine gene transcripts defines the effectiveness of operative resection and ablation strategies. Surgery 2015, 159, 336–347. [Google Scholar] [CrossRef] [PubMed]
- Modlin, I.M.; Bodei, L.; Kidd, M. Neuroendocrine tumor biomarkers: From monoanalytes to transcripts and algorithms. Best Pract. Res. Clin. Endocrinol. Metab. 2016, 30, 59–77. [Google Scholar] [CrossRef]
- Sreekumar, A.; Poisson, L.M.; Rajendiran, T.M.; Khan, A.P.; Cao, Q.; Yu, J.; Laxman, B.; Mehra, R.; Lonigro, R.J.; Li, Y.; et al. Metabolomic profiles delineate potential role for sarcosine in prostate cancer progression. Nature 2009, 457, 910–914. [Google Scholar] [CrossRef] [Green Version]
- Asiago, V.M.; Alvarado, L.Z.; Shanaiah, N.; Gowda, G.A.N.; Owusu-Sarfo, K.; Ballas, R.A.; Raftery, D. Early detection of recurrent breast cancer using metabolite profiling. Cancer Res. 2010, 70, 8309–8318. [Google Scholar] [CrossRef] [Green Version]
- Qiu, Y.; Cai, G.; Su, M.; Chen, T.; Liu, Y.; Xu, Y.; Ni, Y.; Zhao, A.; Cai, S.; Xu, L.X.; et al. Urinary Metabonomic Study on Colorectal Cancer. J. Proteome Res. 2010, 9, 1627–1634. [Google Scholar] [CrossRef]
- Mirnezami, R.; Jiménez, B.; Li, J.V.; Kinross, J.M.; Veselkov, K.; Goldin, R.D.; Holmes, E.; Nicholson, J.K.; Darzi, A. Rapid diagnosis and staging of colorectal cancer via high-resolution magic angle spinning nuclear magnetic resonance (HR-MAS NMR) spectroscopy of intact tissue biopsies. Ann. Surg. 2014, 259, 1138–1149. [Google Scholar] [CrossRef]
- Chen, T.; Xie, G.; Wang, X.; Fan, J.; Qiu, Y.; Zheng, X.; Qi, X.; Cao, Y.; Su, M.; Wang, X.; et al. Serum and Urine Metabolite Profiling Reveals Potential Biomarkers of Human Hepatocellular Carcinoma. Mol. Cell. Proteomics 2011, 10, M110.004945. [Google Scholar] [CrossRef] [PubMed] [Green Version]
- Carrola, J.; Rocha, C.M.; Barros, A.S.; Gil, A.M.; Goodfellow, B.J.; Carreira, I.M.; Bernardo, J.; Gomes, A.; Sousa, V.; Carvalho, L.; et al. Metabolic Signatures of Lung Cancer in Biofluids: NMR-Based Metabonomics of Urine. J. Proteome Res. 2011, 10, 221–230. [Google Scholar] [CrossRef] [PubMed]
- MacIntyre, D.A.; Jiménez, B.; Lewintre, E.J.; Martín, C.R.; Schäfer, H.; Ballesteros, C.G.; Mayans, J.R.; Spraul, M.; García-Conde, J.; Pineda-Lucena, A. Serum metabolome analysis by 1H-NMR reveals differences between chronic lymphocytic leukaemia molecular subgroups. Leukemia 2010, 24, 788–797. [Google Scholar] [CrossRef] [PubMed] [Green Version]
- Kinross, J.M.; Drymousis, P.; Jiménez, B.; Frilling, A. Metabonomic profiling: A novel approach in neuroendocrine neoplasias. Surgery 2013, 154, 1185–1192. [Google Scholar] [CrossRef]
- Rindi, G.; Klöppel, G.; Couvelard, A.; Komminoth, P.; Körner, M.; Lopes, J.M.; McNicol, A.-M.; Nilsson, O.; Perren, A.; Scarpa, A.; et al. TNM staging of midgut and hindgut (neuro) endocrine tumors: A consensus proposal including a grading system. Virchows Arch. 2007, 451, 757–762. [Google Scholar] [CrossRef] [Green Version]
- Rindi, G.; Klöppel, G.; Alhman, H.; Caplin, M.; Couvelard, A.; de Herder, W.W.; Erikssson, B.; Falchetti, A.; Falconi, M.; Komminoth, P.; et al. TNM staging of foregut (neuro)endocrine tumors: A consensus proposal including a grading system. Virchows Arch. 2006, 449, 395–401. [Google Scholar] [CrossRef] [Green Version]
- Edge, S.; Byrd, D.; Compton, C.; Fritz, A.; Greene, F.; Trotti, A. AJCC Cancer Staging Manual, 7th ed.; Springer: Chicago, IL, USA, 2010. [Google Scholar]
- Edmands, W.M.B.; Beckonert, O.P.; Stella, C.; Campbell, A.; Lake, B.G.; Lindon, J.C.; Holmes, E.; Gooderham, N.J. Identification of human urinary biomarkers of cruciferous vegetable consumption by metabonomic profiling. J. Proteome Res. 2011, 10, 4513–4521. [Google Scholar] [CrossRef] [Green Version]
- Mokhtari, M.; Rezaei, A.; Ghasemi, A. Determination of Urinary 5-Hydroxyindoleacetic Acid as a Metabolomics in Gastric Cancer. J. Gastrointest. Cancer 2015, 46, 138–142. [Google Scholar] [CrossRef]
- Nam, H.; Chung, B.C.; Kim, Y.; Lee, K.Y.; Lee, D. Combining tissue transcriptomics and urine metabolomics for breast cancer biomarker identification. Bioinformatics 2009, 25, 3151–3157. [Google Scholar] [CrossRef] [Green Version]
- Landry, C.S.; Cavaness, K.; Celinski, S.; Preskitt, J. Biochemical prognostic indicators for pancreatic neuroendocrine tumors and small bowel neuroendocrine tumors. Gland Surg. 2014, 3. [Google Scholar] [CrossRef]
- Arai, K.; Terashima, H.; Aizawa, S.I.; Taga, A.; Yamamoto, A.; Tsutsumiuchi, K.; Kodama, S. Simultaneous determination of trigonelline, caffeine, chlorogenic acid and their related compounds in instant coffee samples by HPLC using an acidic mobile phase containing octanesulfonate. Anal. Sci. 2015, 31, 831–835. [Google Scholar] [CrossRef] [PubMed] [Green Version]
- Jeong, Y.-I.; Kim, D.H.; Chung, K.D.; Kim, Y.H.; Lee, Y.S.; Choi, K.-C. Antitumor activity of trigonelline-incorporated chitosan nanoparticles. J. Nanosci. Nanotechnol. 2014, 14, 5633–5637. [Google Scholar] [CrossRef]
- Liao, J.C.; Lee, K.T.; You, B.J.; Lee, C.L.; Chang, W.T.; Wu, Y.C.; Lee, H.Z. Raf/ERK/Nrf2 signaling pathway and MMP-7 expression involvement in the trigonelline-mediated inhibition of hepatocarcinoma cell migration. Food Nutr. Res. 2015, 59. [Google Scholar] [CrossRef] [PubMed] [Green Version]
- Bouma, G.; van Faassen, M.; Kats-Ugurlu, G.; de Vries, E.G.E.; Kema, I.P.; Walenkamp, A.M.E. Niacin (Vitamin B3) Supplementation in Patients with Serotonin-Producing Neuroendocrine Tumor. Neuroendocrinology 2016, 103, 489–494. [Google Scholar] [CrossRef] [PubMed]
- Heng, B.; Lim, C.K.; Lovejoy, D.B.; Bessede, A.; Gluch, L.; Guillemin, G.J. Understanding the role of the kynurenine pathway in human breast cancer immunobiology. Oncotarget 2016, 7, 6506–6520. [Google Scholar] [CrossRef] [Green Version]
- Lyon, D.E.; Walter, J.M.; Starkweather, A.R.; Schubert, C.M.; McCain, N.L. Tryptophan degradation in women with breast cancer: A pilot study. BMC Res. Notes 2011, 4. [Google Scholar] [CrossRef] [PubMed] [Green Version]
- Suzuki, Y.; Suda, T.; Furuhashi, K.; Suzuki, M.; Fujie, M.; Hahimoto, D.; Nakamura, Y.; Inui, N.; Nakamura, H.; Chida, K. Increased serum kynurenine/tryptophan ratio correlates with disease progression in lung cancer. Lung Cancer 2010, 67, 361–365. [Google Scholar] [CrossRef] [PubMed]
- Boyland, E.; Williams, D.C. The metabolism of tryptophan. 2. The metabolism of tryptophan in patients suffering from cancer of the bladder. Biochem. J. 1956, 64, 578–582. [Google Scholar] [CrossRef] [PubMed] [Green Version]
- Gamagedara, S.; Kaczmarek, A.T.; Jiang, Y.; Cheng, X.; Rupasinghe, M.; Ma, Y. Validation study of urinary metabolites as potential biomarkers for prostate cancer detection. Bioanalysis 2012, 4, 1175–1183. [Google Scholar] [CrossRef]
- Aronov, P.A.; Luo, F.J.-G.; Plummer, N.S.; Quan, Z.; Holmes, S.; Hostetter, T.H.; Meyer, T.W. Colonic contribution to uremic solutes. J. Am. Soc. Nephrol. 2011, 22, 1769–1776. [Google Scholar] [CrossRef] [Green Version]
- Lees, H.J.; Swann, J.R.; Wilson, I.D.; Nicholson, J.K.; Holmes, E. Hippurate: The natural history of a mammalian-microbial cometabolite. J. Proteome Res. 2013, 12, 1527–1546. [Google Scholar] [CrossRef] [PubMed]
- Cheng, Y.; Xie, G.; Chen, T.; Qiu, Y.; Zou, X.; Zheng, M.; Tan, B.; Feng, B.; Dong, T.; He, P.; et al. Distinct urinary metabolic profile of human colorectal cancer. J. Proteome Res. 2012, 11, 1354–1363. [Google Scholar] [CrossRef] [PubMed]
- Monteiro, M.S.; Barros, A.S.; Pinto, J.; Carvalho, M.; Pires-Luís, A.S.; Henrique, R.; Jerónimo, C.; Bastos, M.D.L.; Gil, A.M.; Guedes De Pinho, P. Nuclear Magnetic Resonance metabolomics reveals an excretory metabolic signature of renal cell carcinoma. Sci. Rep. 2016, 6. [Google Scholar] [CrossRef] [PubMed] [Green Version]
- O’Keefe, S.J.D.; Li, J.V.; Lahti, L.; Ou, J.; Carbonero, F.; Mohammed, K.; Posma, J.M.; Kinross, J.; Wahl, E.; Ruder, E.; et al. Fat, fibre and cancer risk in African Americans and rural Africans. Nat. Commun. 2015, 6, 6342. [Google Scholar] [CrossRef] [PubMed] [Green Version]
- Tang, W.H.W.; Wang, Z.; Levison, B.S.; Koeth, R.A.; Britt, E.B.; Fu, X.; Wu, Y.; Hazen, S.L. Intestinal Microbial Metabolism of Phosphatidylcholine and Cardiovascular Risk. N. Engl. J. Med. 2013, 368, 1575–1584. [Google Scholar] [CrossRef] [PubMed] [Green Version]
- Dumas, M.E.; Barton, R.H.; Toye, A.; Cloarec, O.; Blancher, C.; Rothwell, A.; Fearnside, J.; Tatoud, R.; Blanc, V.; Lindon, J.C.; et al. Metabolic profiling reveals a contribution of gut microbiota to fatty liver phenotype in insulin-resistant mice. Proc. Natl. Acad. Sci. USA 2006, 103, 12511–12516. [Google Scholar] [CrossRef] [Green Version]
- Jung, J.; Jung, Y.; Bang, E.J.; Cho, S.-I.; Jang, Y.J.; Kwak, J.M.; Ryu, D.H.; Park, S.; Hwang, G.S. Noninvasive Diagnosis and Evaluation of Curative Surgery for Gastric Cancer by Using NMR-based Metabolomic Profiling. Ann. Surg. Oncol. 2014, 21, 736–742. [Google Scholar] [CrossRef]
- McShane, L.M.; Altman, D.G.; Sauerbrei, W.; Taube, S.E.; Gion, M.; Clark, G.M. Statistics Subcommittee of the NCI-EORTC Working Group on Cancer Diagnostics Reporting recommendations for tumor MARKer prognostic studies (REMARK). Nat. Clin. Pract. Oncol. 2005, 2, 416–422. [Google Scholar]
- Dona, A.C.; Jiménez, B.; Schäfer, H.; Humpfer, E.; Spraul, M.; Lewis, M.R.; Pearce, J.T.M.; Holmes, E.; Lindon, J.C.; Nicholson, J.K. Precision High-Throughput Proton NMR Spectroscopy of Human Urine, Serum, and Plasma for Large-Scale Metabolic Phenotyping. Anal. Chem. 2014, 86, 9887–9894. [Google Scholar] [CrossRef]
- Spraul, M.; Nicholson, J.K.; Lynch, M.J.; Lindon, J.C. Application of the one-dimensional TOCSY pulse sequence in 750 MHz 1H-NMR spectroscopy for assignment of endogenous metabolite resonances in biofluids. J. Pharm. Biomed. Anal. 1994, 12, 613–618. [Google Scholar] [CrossRef]
- Beckonert, O.; Keun, H.C.; Ebbels, T.M.D.; Bundy, J.; Holmes, E.; Lindon, J.C.; Nicholson, J.K. Metabolic profiling, metabolomic and metabonomic procedures for NMR spectroscopy of urine, plasma, serum and tissue extracts. Nat. Protoc. 2007, 2, 2692–2703. [Google Scholar] [CrossRef] [PubMed]
- Fonville, J.M.; Maher, A.D.; Coen, M.; Holmes, E.; Lindon, J.C.; Nicholson, J.K. Evaluation of full-resolution J-resolved 1H-NMR projections of biofluids for metabonomics information retrieval and biomarker identification. Anal. Chem. 2010, 82, 1811–1821. [Google Scholar] [CrossRef] [PubMed]
- Veselkov, K.A.; Lindon, J.C.; Ebbels, T.M.D.; Crockford, D.; Volynkin, V.V.; Holmes, E.; Davies, D.B.; Nicholson, J.K. Recursive Segment-Wise Peak Alignment of Biological 1H-NMR Spectra for Improved Metabolic Biomarker Recovery. Anal. Chem. 2009, 81, 56–66. [Google Scholar] [CrossRef] [PubMed]
- Dieterle, F.; Ross, A.; Schlotterbeck, G.; Senn, H. Probabilistic quotient normalization as robust method to account for dilution of complex biological mixtures. Application in 1H-NMR metabonomics. Anal. Chem. 2006, 78, 4281–4290. [Google Scholar] [CrossRef]
- Trygg, J.; Wold, S. Orthogonal projections to latent structures (O-PLS). J. Chemom. 2002, 16, 119–128. [Google Scholar] [CrossRef]
- Benjamini, Y.; Hochberg, Y. Controlling the False Discovery Rate: A Practical and Powerful Approach to Multiple Testing. J. R. Stat. Soc. Ser. B 1995, 57, 289–300. [Google Scholar] [CrossRef]
- Robin, X.; Turck, N.; Hainard, A.; Tiberti, N.; Lisacek, F.; Sanchez, J.C.; Müller, M. pROC: An open-source package for R and S+ to analyze and compare ROC curves. BMC Bioinform. 2011, 12. [Google Scholar] [CrossRef]
- Cloarec, O.; Dumas, M.-E.; Craig, A.; Barton, R.H.; Trygg, J.; Hudson, J.; Blancher, C.; Gauguier, D.; Lindon, J.C.; Holmes, E.; et al. Statistical Total Correlation Spectroscopy: An Exploratory Approach for Latent Biomarker Identification from Metabolic 1H-NMR Data Sets. Anal. Chem. 2005, 77, 1282–1289. [Google Scholar] [CrossRef]
- Posma, J.M.; Garcia-Perez, I.; De Iorio, M.; Lindon, J.C.; Elliott, P.; Holmes, E.; Ebbels, T.M.D.; Nicholson, J.K. Subset optimization by reference matching (STORM): An optimized statistical approach for recovery of metabolic biomarker structural information from 1H-NMR spectra of biofluids. Anal. Chem. 2012, 84, 10694–10701. [Google Scholar] [CrossRef]


| Parameter | Number |
|---|---|
| Number of patients | 34 |
| Sex | - |
| Male | 21 |
| Female | 13 |
| Ethnicity | - |
| Caucasian | 20 |
| African/Caribbean | 5 |
| Asian/Arabic | 9 |
| Median age at diagnosis (years) | 59.3 (range 36–85) |
| Median BMI | 27.8 (range 17.4–42.0) |
| Site of primary tumour | - |
| Small Bowel | 16 |
| Pancreas (sporadic) | 18 |
| Tumour functionality–Pancreas | - |
| Non-functioning | 11 |
| Functioning | 7 |
| Median serum chromogranin A (normal < 60 pmol/L) | 42 (range 21–2342) |
| Median 5-HIAA in 24 h urine (normal 0.0–45.0 µmol/L) | 25.5 (range 9.4–581.4) |
| Tumour Grade * | - |
| 1 | 18 |
| 2 | 16 |
| 3 | 0 |
| Tumour stage # | - |
| T1–4N0M0 | 7 |
| T1–4N1M0 | 13 |
| T1–4N0M1 | 2 |
| T1–4N1M1 | 12 |
| Liver metastases present | - |
| Pancreas NEN | - |
| Yes | 3 |
| No | 15 |
| Small bowel NEN | - |
| Yes | 11 |
| No | 5 |
| OPLS-DA Model | Wilcoxon’s Rank Sum Test | |||||||||||||||
|---|---|---|---|---|---|---|---|---|---|---|---|---|---|---|---|---|
| - | Healthy Vs. NEN | Healthy Vs. PanNEN | Healthy Vs. SBNEN | Healthy Vs. NEN | Healthy Vs. PanNEN | Healthy Vs. SBNEN | PanNEN Vs. SBNEN | |||||||||
| Metabolite | ppm | Multiplicity | r | pFDR | r | pFDR | r | pFDR | p | pFDR | p | pFDR | p | pFDR | p | pFDR |
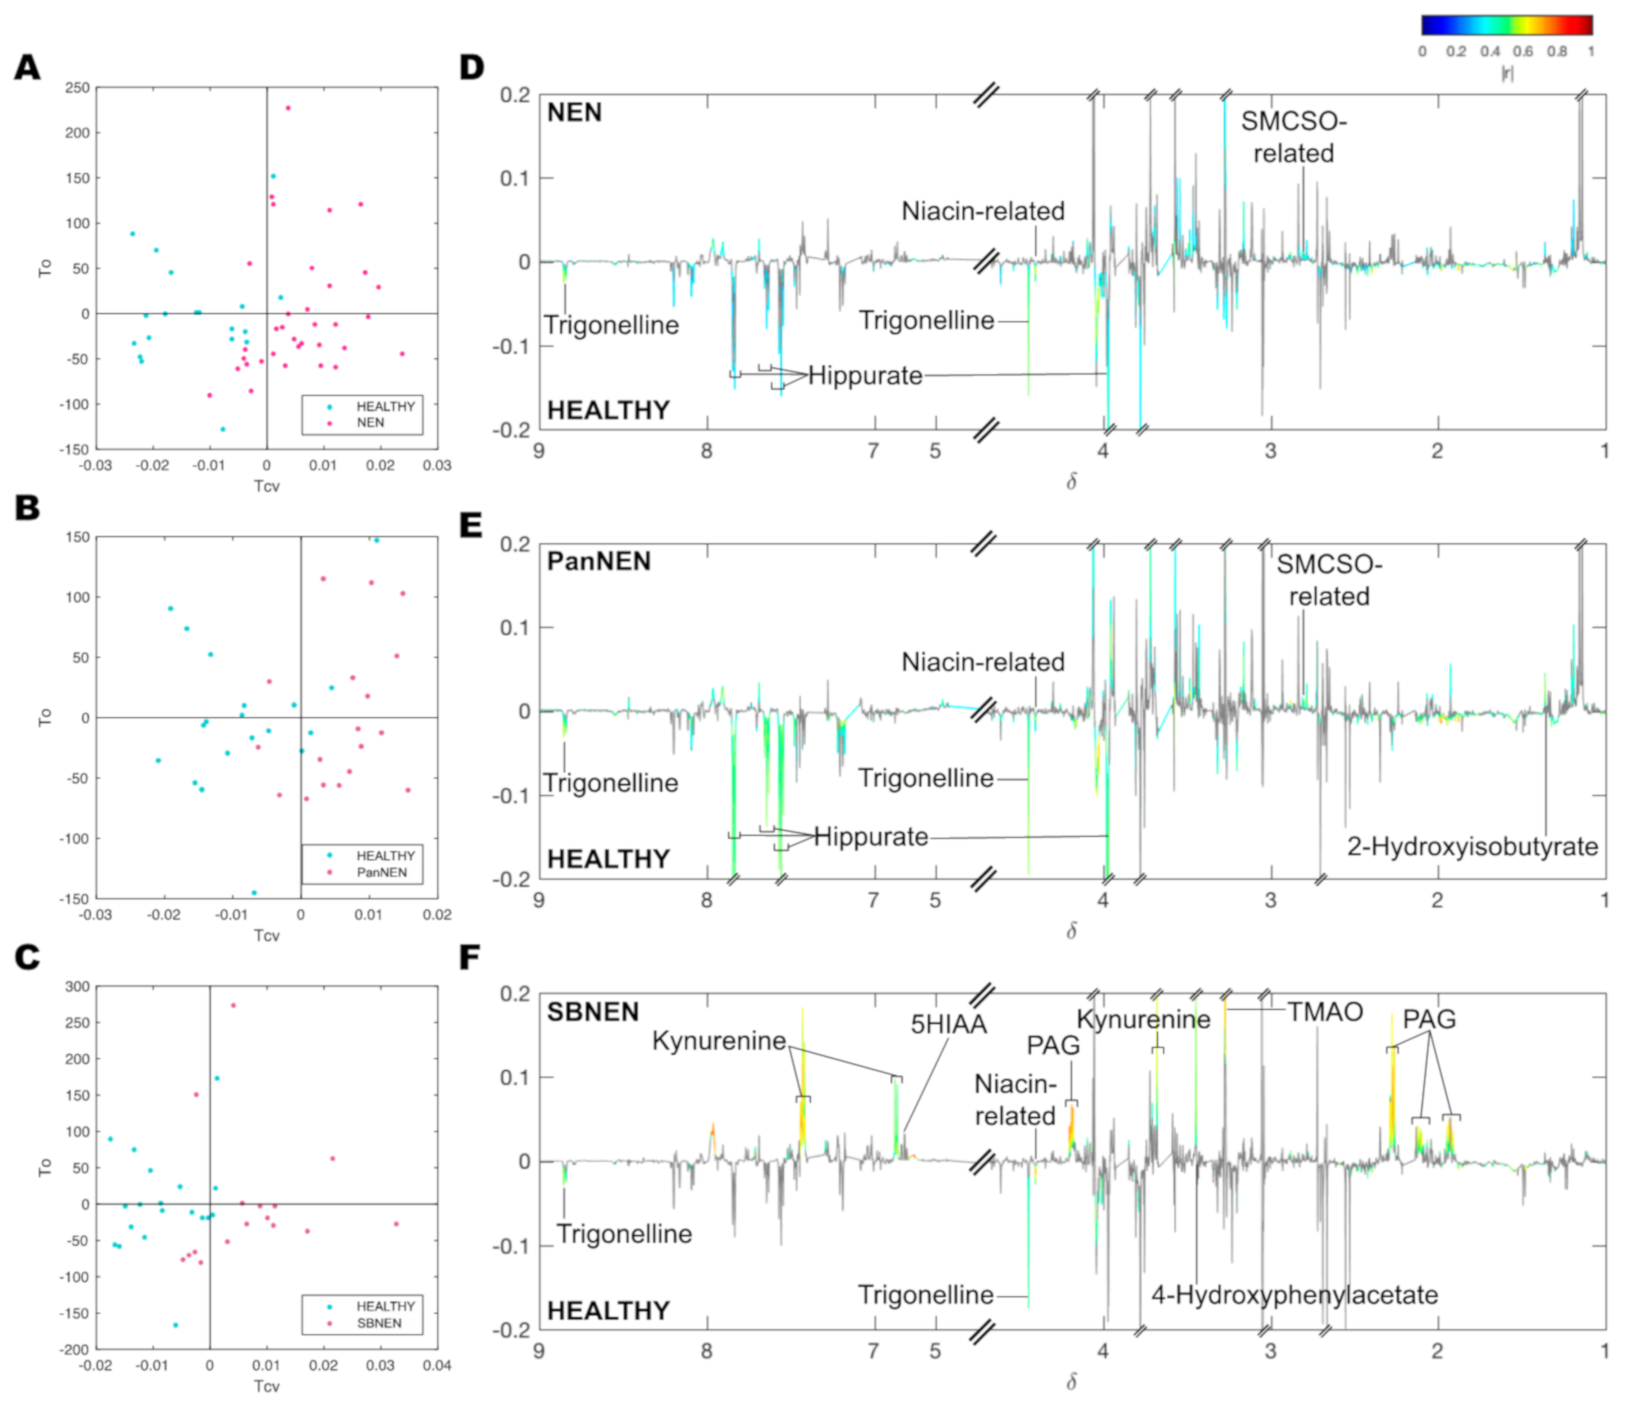
| Hippurate | 3.978 | s | - | 0.199 | −0.488 | 0.022 | - | 0.867 | 0.105 | 0.173 | 0.075 | 0.123 | 0.345 | 0.423 | 0.438 | 0.751 |
| 7.557 | t | −0.318 | 0.098 | −0.511 | 0.016 | - | 0.642 | 0.061 | 0.129 | 0.068 | 0.123 | 0.18 | 0.263 | 0.569 | 0.751 | |
| 7.644 | t | - | 0.107 | −0.511 | 0.016 | - | 0.681 | 0.071 | 0.132 | 0.075 | 0.123 | 0.202 | 0.275 | 0.523 | 0.751 | |
| 7.84 * | d | −0.375 | 0.044 | −0.549 | 0.01 | - | 0.488 | 0.073 | 0.132 | 0.081 | 0.123 | 0.202 | 0.275 | 0.666 | 0.751 | |
| Niacin-related | 4.405 * | s | −0.46 | 0.008 | −0.391 | 0.08 | −0.517 | 0.03 | 0 | 0 | 0 | 0.003 | 0 | 0.001 | 0.666 | 0.751 |
| 8.791 | d | −0.342 | 0.072 | - | 0.213 | - | 0.156 | 0.01 | 0.035 | 0.075 | 0.123 | 0.008 | 0.029 | 0.641 | 0.751 | |
| Trigonelline | 4.444 * | s | −0.525 | 0.002 | −0.533 | 0.012 | - | 0.053 | 0.003 | 0.012 | 0.045 | 0.111 | 0.002 | 0.01 | 0.116 | 0.295 |
| 8.85 | m | −0.457 | 0.009 | −0.411 | 0.063 | −0.509 | 0.034 | 0.003 | 0.012 | 0.047 | 0.111 | 0.002 | 0.01 | 0.081 | 0.238 | |
| 9.128 | s | −0.485 | 0.005 | −0.508 | 0.017 | −0.462 | 0.067 | 0.005 | 0.019 | 0.092 | 0.129 | 0.002 | 0.01 | 0.037 | 0.156 | |
| 2-Hydroxyisobutyrate | 1.363 * | s | - | 0.125 | 0.507 | 0.017 | - | 0.815 | 0.312 | 0.439 | 0.104 | 0.141 | 0.987 | 0.987 | 0.221 | 0.441 |
| PAG | 1.935 | m | - | 0.299 | - | 0.687 | 0.648 | 0.002 | 0.788 | 0.907 | 0.218 | 0.252 | 0.066 | 0.132 | 0.028 | 0.154 |
| 2.107 | m | - | 0.886 | −0.48 | 0.025 | 0.553 | 0.017 | 0.897 | 0.921 | 0.062 | 0.123 | 0.074 | 0.133 | 0.016 | 0.115 | |
| 2.276 * | t | - | 0.537 | - | 0.092 | 0.644 | 0.002 | 0.704 | 0.836 | 0.035 | 0.101 | 0.108 | 0.171 | 0.016 | 0.115 | |
| 4.187 | m | - | 0.307 | - | 0.49 | 0.726 | 0 | 0.623 | 0.789 | 0.013 | 0.046 | 0.071 | 0.133 | 0.009 | 0.115 | |
| SMCSO-related | 2.809 | s | 0.42 | 0.02 | 0.454 | 0.036 | - | 0.162 | 0.001 | 0.007 | 0 | 0.003 | 0.066 | 0.132 | 0.056 | 0.192 |
| 4-Hydroxyphenylacetate | 3.446 * | s | - | 0.129 | - | 0.432 | 0.557 | 0.015 | 0.228 | 0.333 | 0.649 | 0.685 | 0.101 | 0.167 | 0.438 | 0.751 |
| TMAO | 3.273 * | s | - | 0.465 | - | 0.998 | 0.653 | 0.002 | 0.065 | 0.13 | 0.494 | 0.537 | 0.011 | 0.036 | 0.051 | 0.192 |
| Kynurenine | 3.679 * | d | - | 0.179 | - | 0.864 | 0.626 | 0.003 | 0.853 | 0.921 | 0.171 | 0.204 | 0.066 | 0.132 | 0.018 | 0.115 |
| 6.87 | dd | - | 0.328 | - | 0.994 | 0.55 | 0.018 | 0.889 | 0.921 | 0.081 | 0.123 | 0.03 | 0.071 | 0.01 | 0.115 | |
| 7.428 | t | - | 0.388 | - | 0.246 | 0.646 | 0.002 | 0.817 | 0.913 | 0.23 | 0.257 | 0.082 | 0.142 | 0.034 | 0.156 | |
| 5HIAA | 6.819 * | dd | - | 0.48 | −0.482 | 0.024 | - | 0.151 | 0.985 | 0.985 | 0.008 | 0.036 | 0.003 | 0.015 | 0 | 0.003 |
Publisher’s Note: MDPI stays neutral with regard to jurisdictional claims in published maps and institutional affiliations. |
© 2021 by the authors. Licensee MDPI, Basel, Switzerland. This article is an open access article distributed under the terms and conditions of the Creative Commons Attribution (CC BY) license (http://creativecommons.org/licenses/by/4.0/).
Share and Cite
Jiménez, B.; Abellona U, M.R.; Drymousis, P.; Kyriakides, M.; Clift, A.K.; Liu, D.S.K.; Rees, E.; Holmes, E.; Nicholson, J.K.; Kinross, J.M.; et al. Neuroendocrine Neoplasms: Identification of Novel Metabolic Circuits of Potential Diagnostic Utility. Cancers 2021, 13, 374. https://doi.org/10.3390/cancers13030374
Jiménez B, Abellona U MR, Drymousis P, Kyriakides M, Clift AK, Liu DSK, Rees E, Holmes E, Nicholson JK, Kinross JM, et al. Neuroendocrine Neoplasms: Identification of Novel Metabolic Circuits of Potential Diagnostic Utility. Cancers. 2021; 13(3):374. https://doi.org/10.3390/cancers13030374
Chicago/Turabian StyleJiménez, Beatriz, Mei Ran Abellona U, Panagiotis Drymousis, Michael Kyriakides, Ashley K. Clift, Daniel S. K. Liu, Eleanor Rees, Elaine Holmes, Jeremy K. Nicholson, James M. Kinross, and et al. 2021. "Neuroendocrine Neoplasms: Identification of Novel Metabolic Circuits of Potential Diagnostic Utility" Cancers 13, no. 3: 374. https://doi.org/10.3390/cancers13030374