
Artificial Neural Networks Predicted the Overall Survival and Molecular Subtypes of Diffuse Large B-Cell Lymphoma Using a Pancancer Immune-Oncology Panel

 ,
,  ,
,  and
and
Abstract
:Simple Summary
Abstract
1. Introduction
2. Materials and Methods
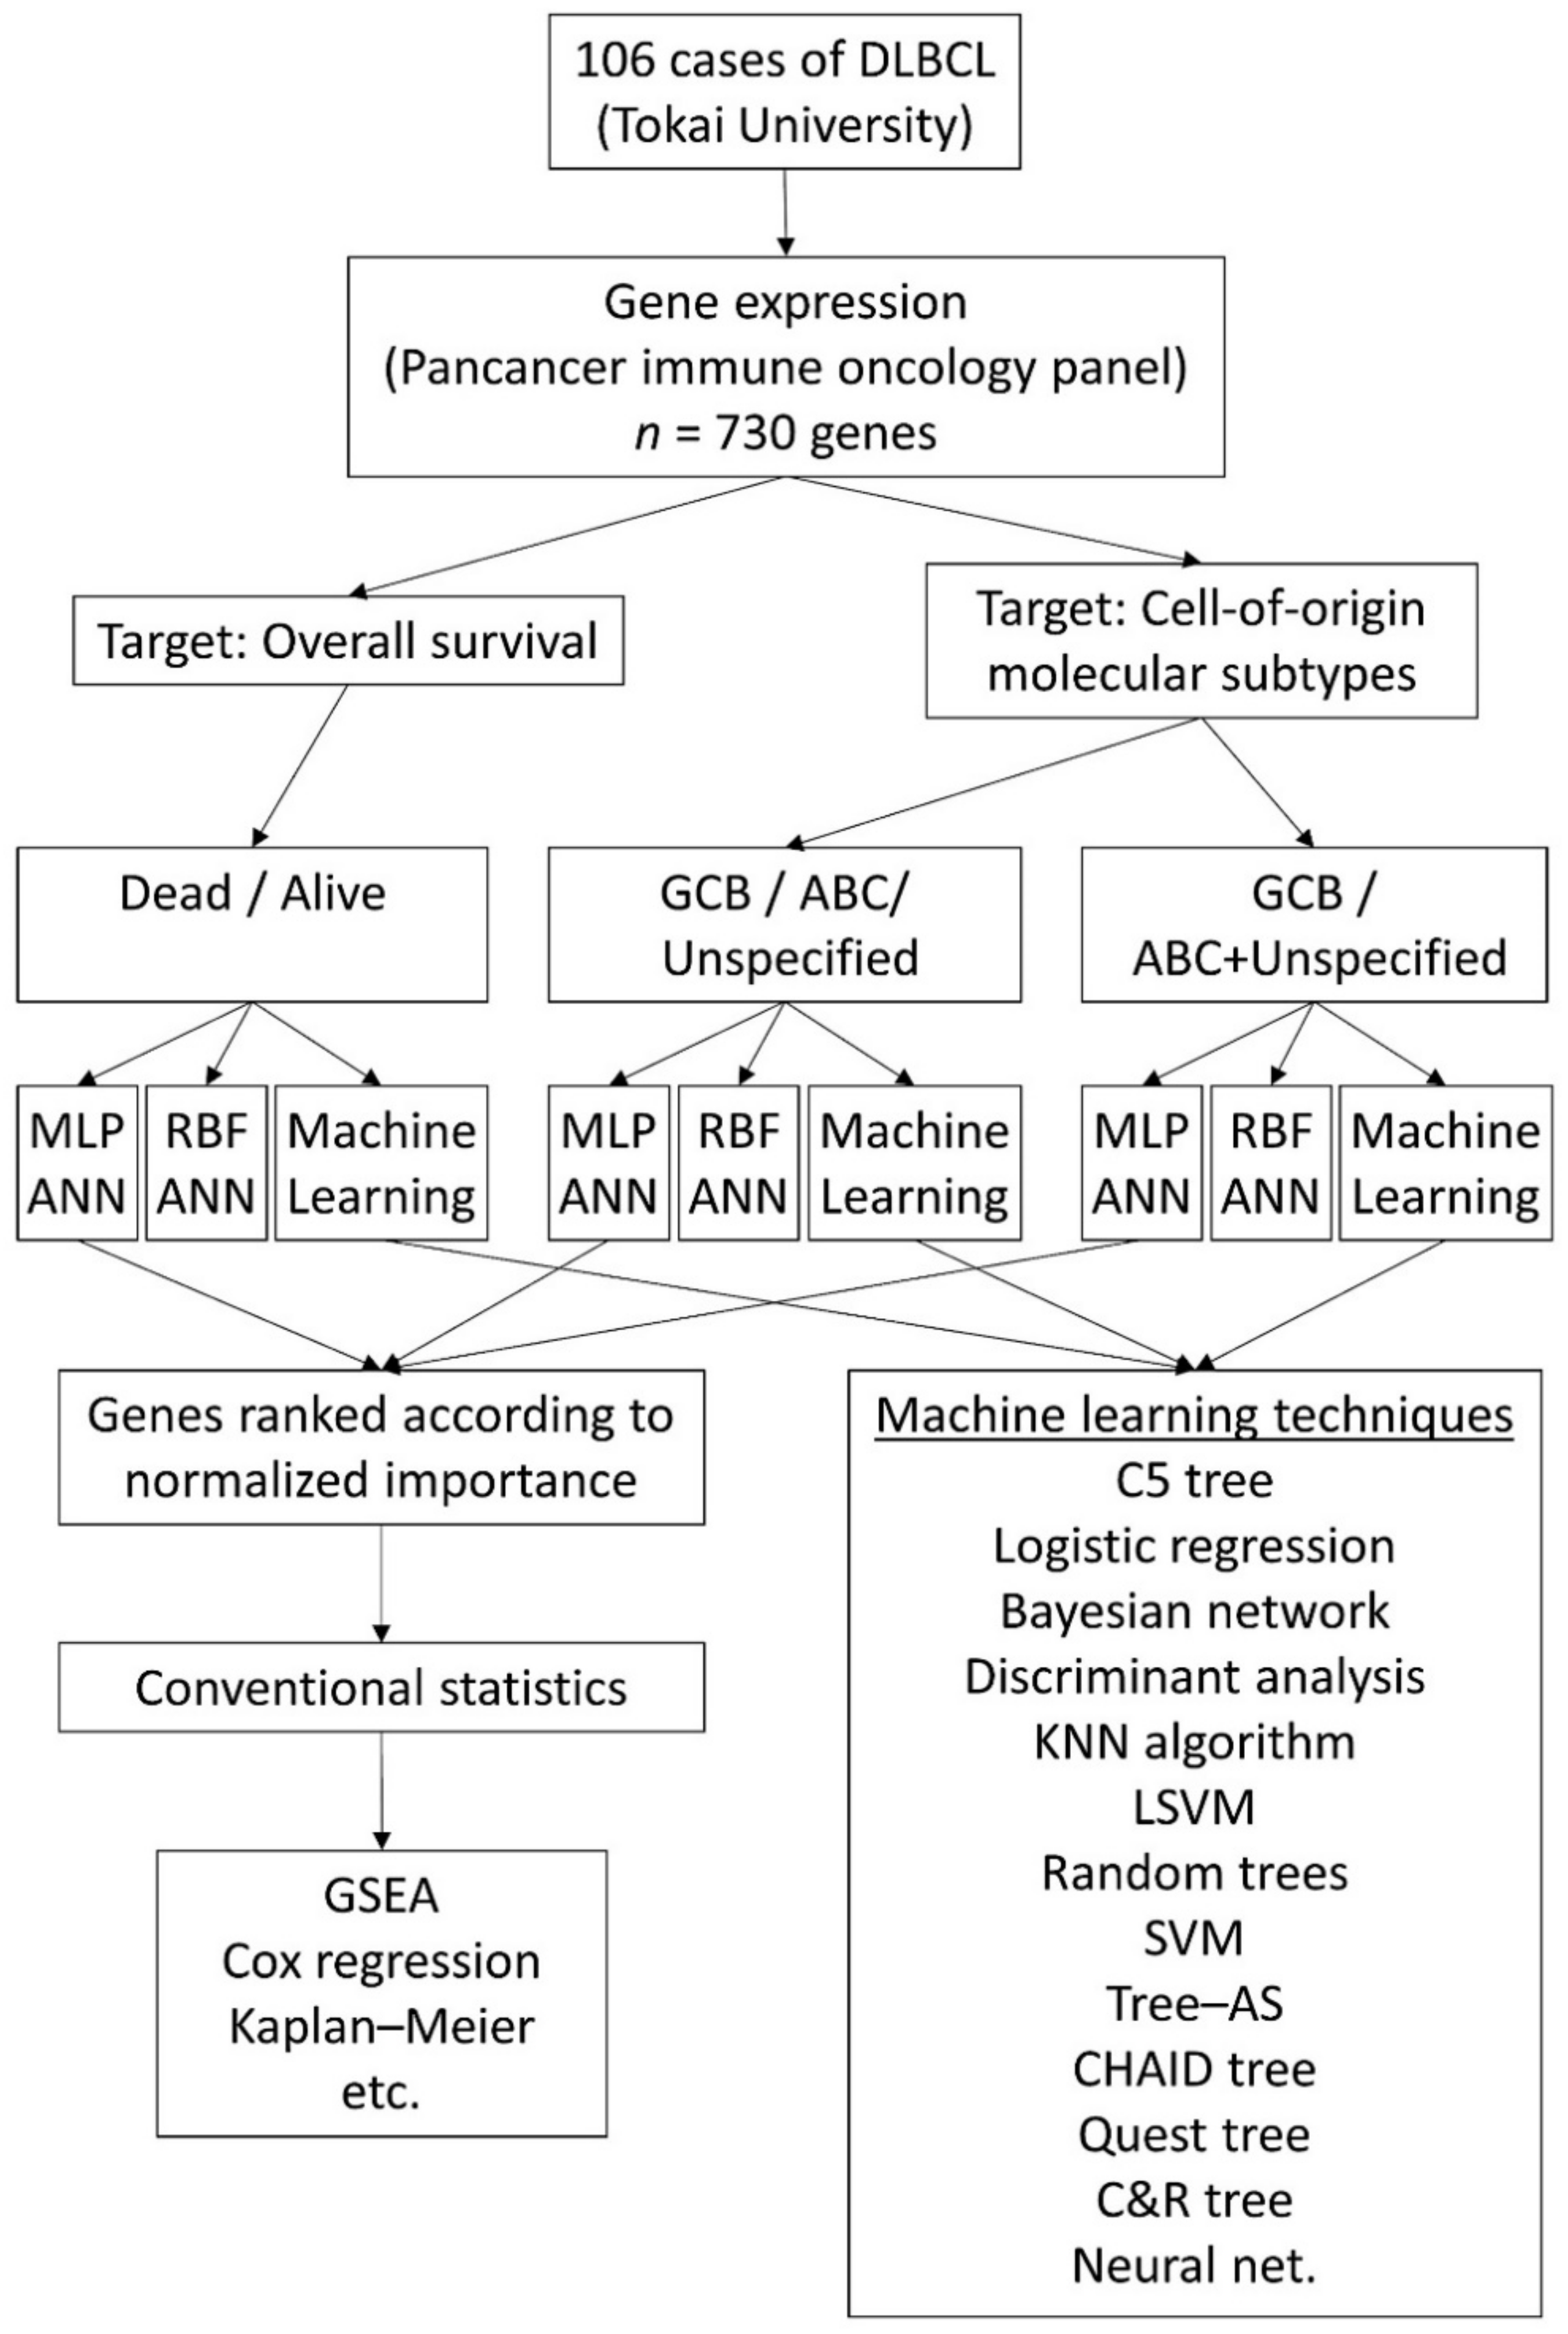
2.1. Patients, Samples and Gene Expression Data
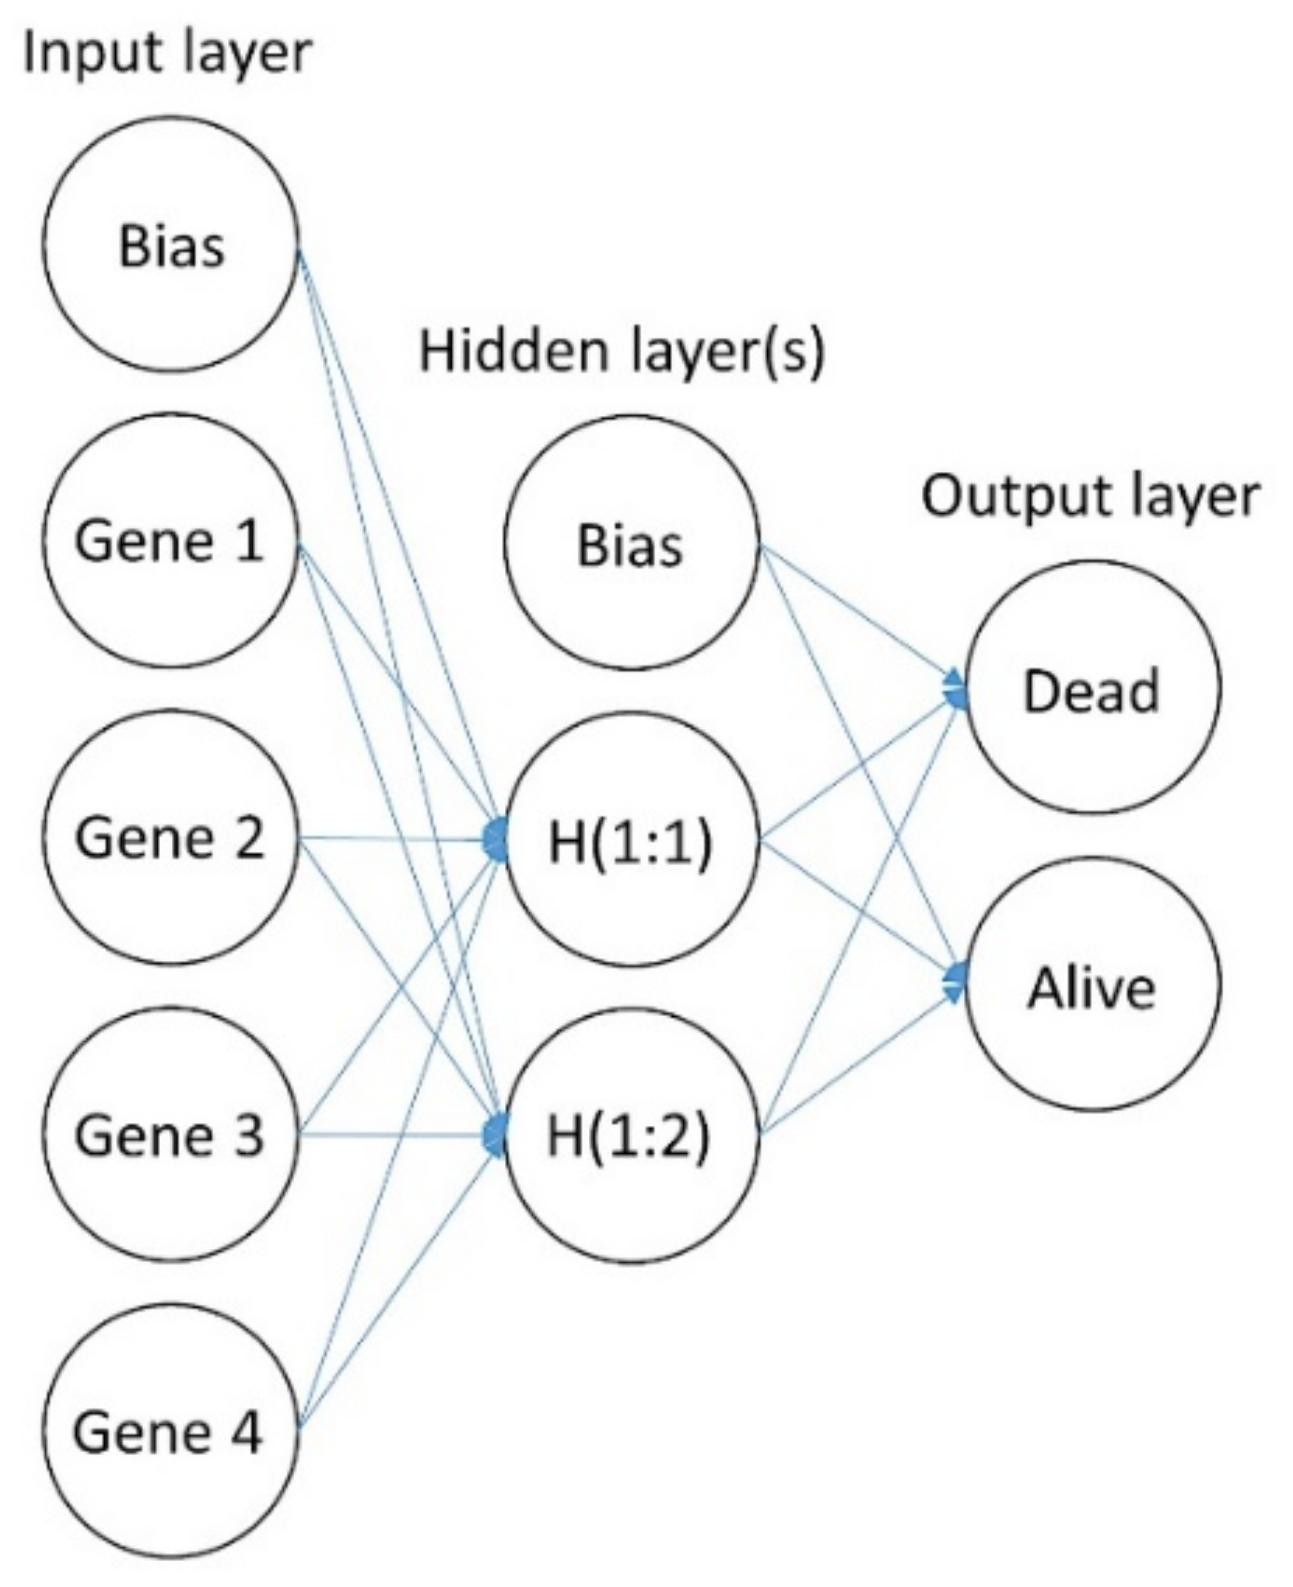
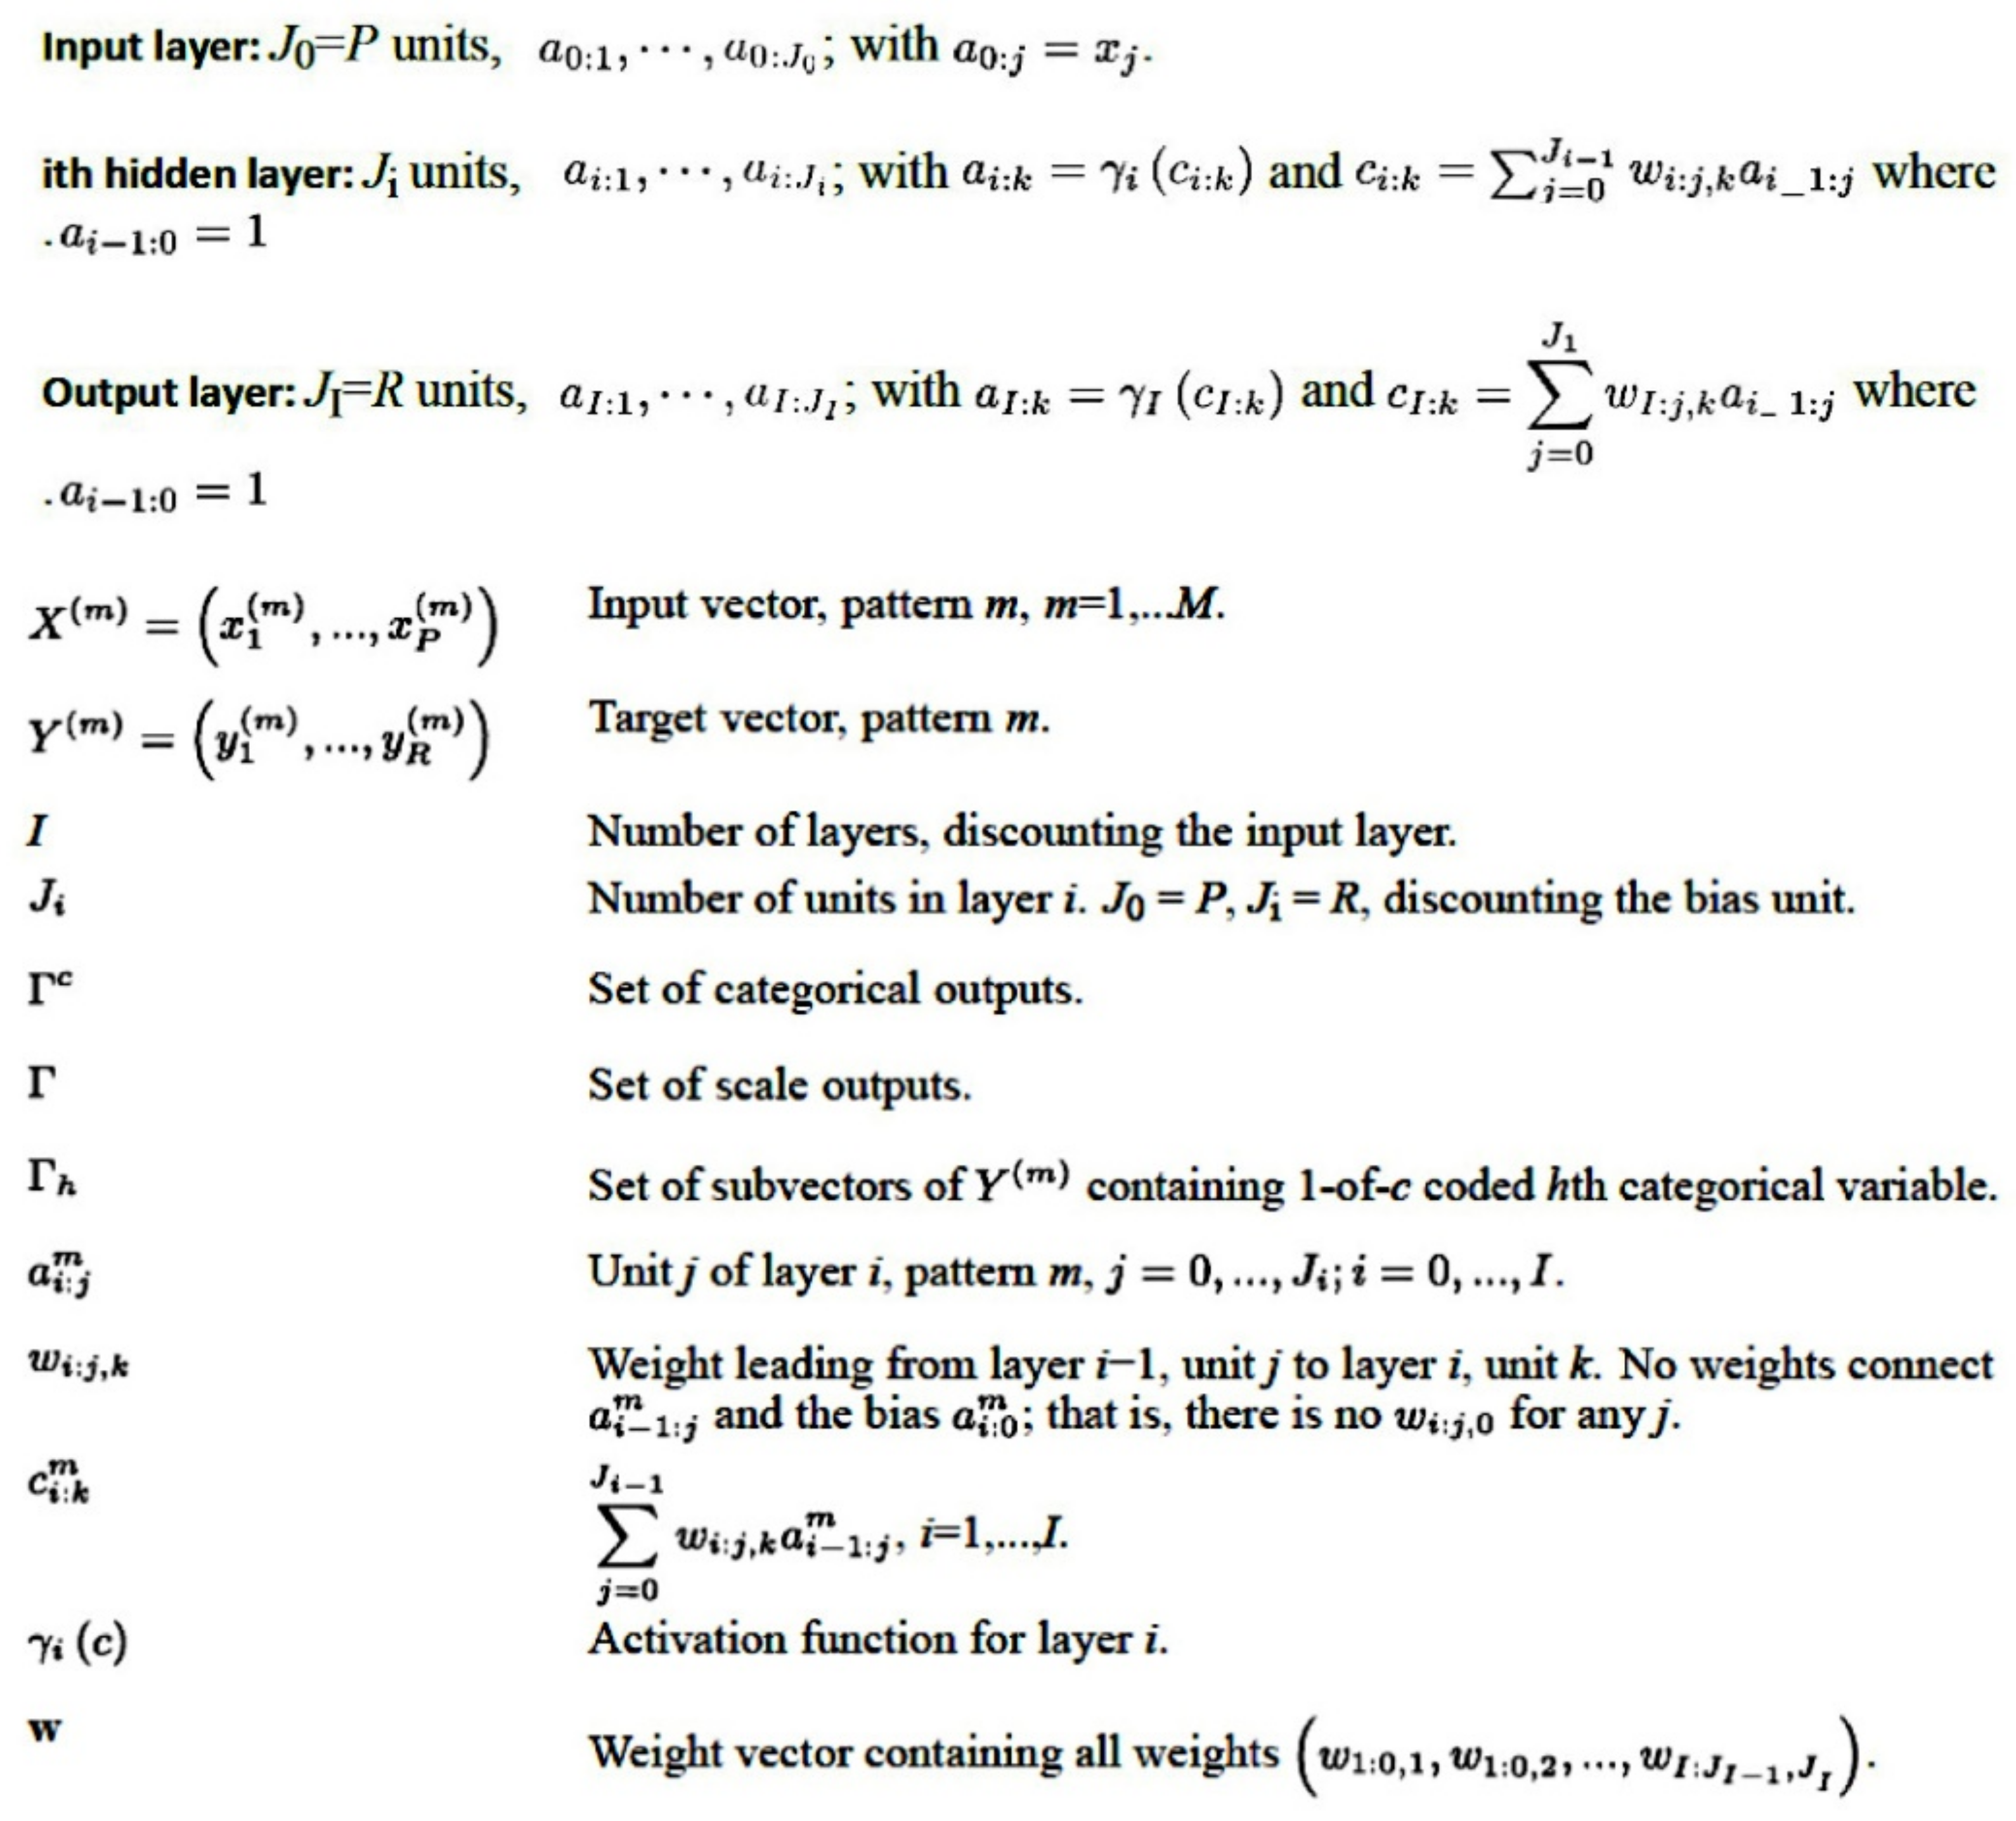
2.2. Artificial Neural Network Analysis
2.3. Statistical Analyses and Software
- NSolver (version 4.0, NanoString, Seattle, Washington, USA); https://www.nanostring.com/products/analysis-solutions/ncounter-analysis-solutions/ (accessed on 29 November 2021);
- R (version 3.6.3) and R Studio (version 1.3.959, RStudio, Boston, MA, USA); https://www.rstudio.com/ (accessed on 29 November 2021);
- Excel (version 16, Microsoft, Redmond, WA, USA);
- EditPad Lite (version 8, Just Great Software Co. Ltd., Rawai Phuket, Thailand);
- JMP Statistical Discovery (version 14, SAS, Cary, NC, USA); https://www.jmp.com/ja_jp/home.html (accessed on 29 November 2021);
- IBM SPSS 26 and Modeler 18 (IBM, Armonk, NY, USA); https://www.ibm.com/jp-ja/products/spss-statistics (accessed on 29 November 2021).
- Gene Set Enrichment Analysis (GSEA) software (version 4.1.0, Broad Institute, UC San Diego, USA) [17,18]; https://www.gsea-msigdb.org/gsea/index.jsp (accessed on 29 November 2021); https://github.com/GSEA-MSigDB/gsea-desktop (accessed on 8 December 2021).
- Morpheus matrix visualization and analysis software (Broad Institute, Morpheus), https://software.broadinstitute.org/morpheus) (accessed on 29 November 2021);
- String (version 11, String consortium 2020) [19]; https://string-db.org/ (accessed on 29 November 2021).
2.4. Immunohistochemistry
3. Results
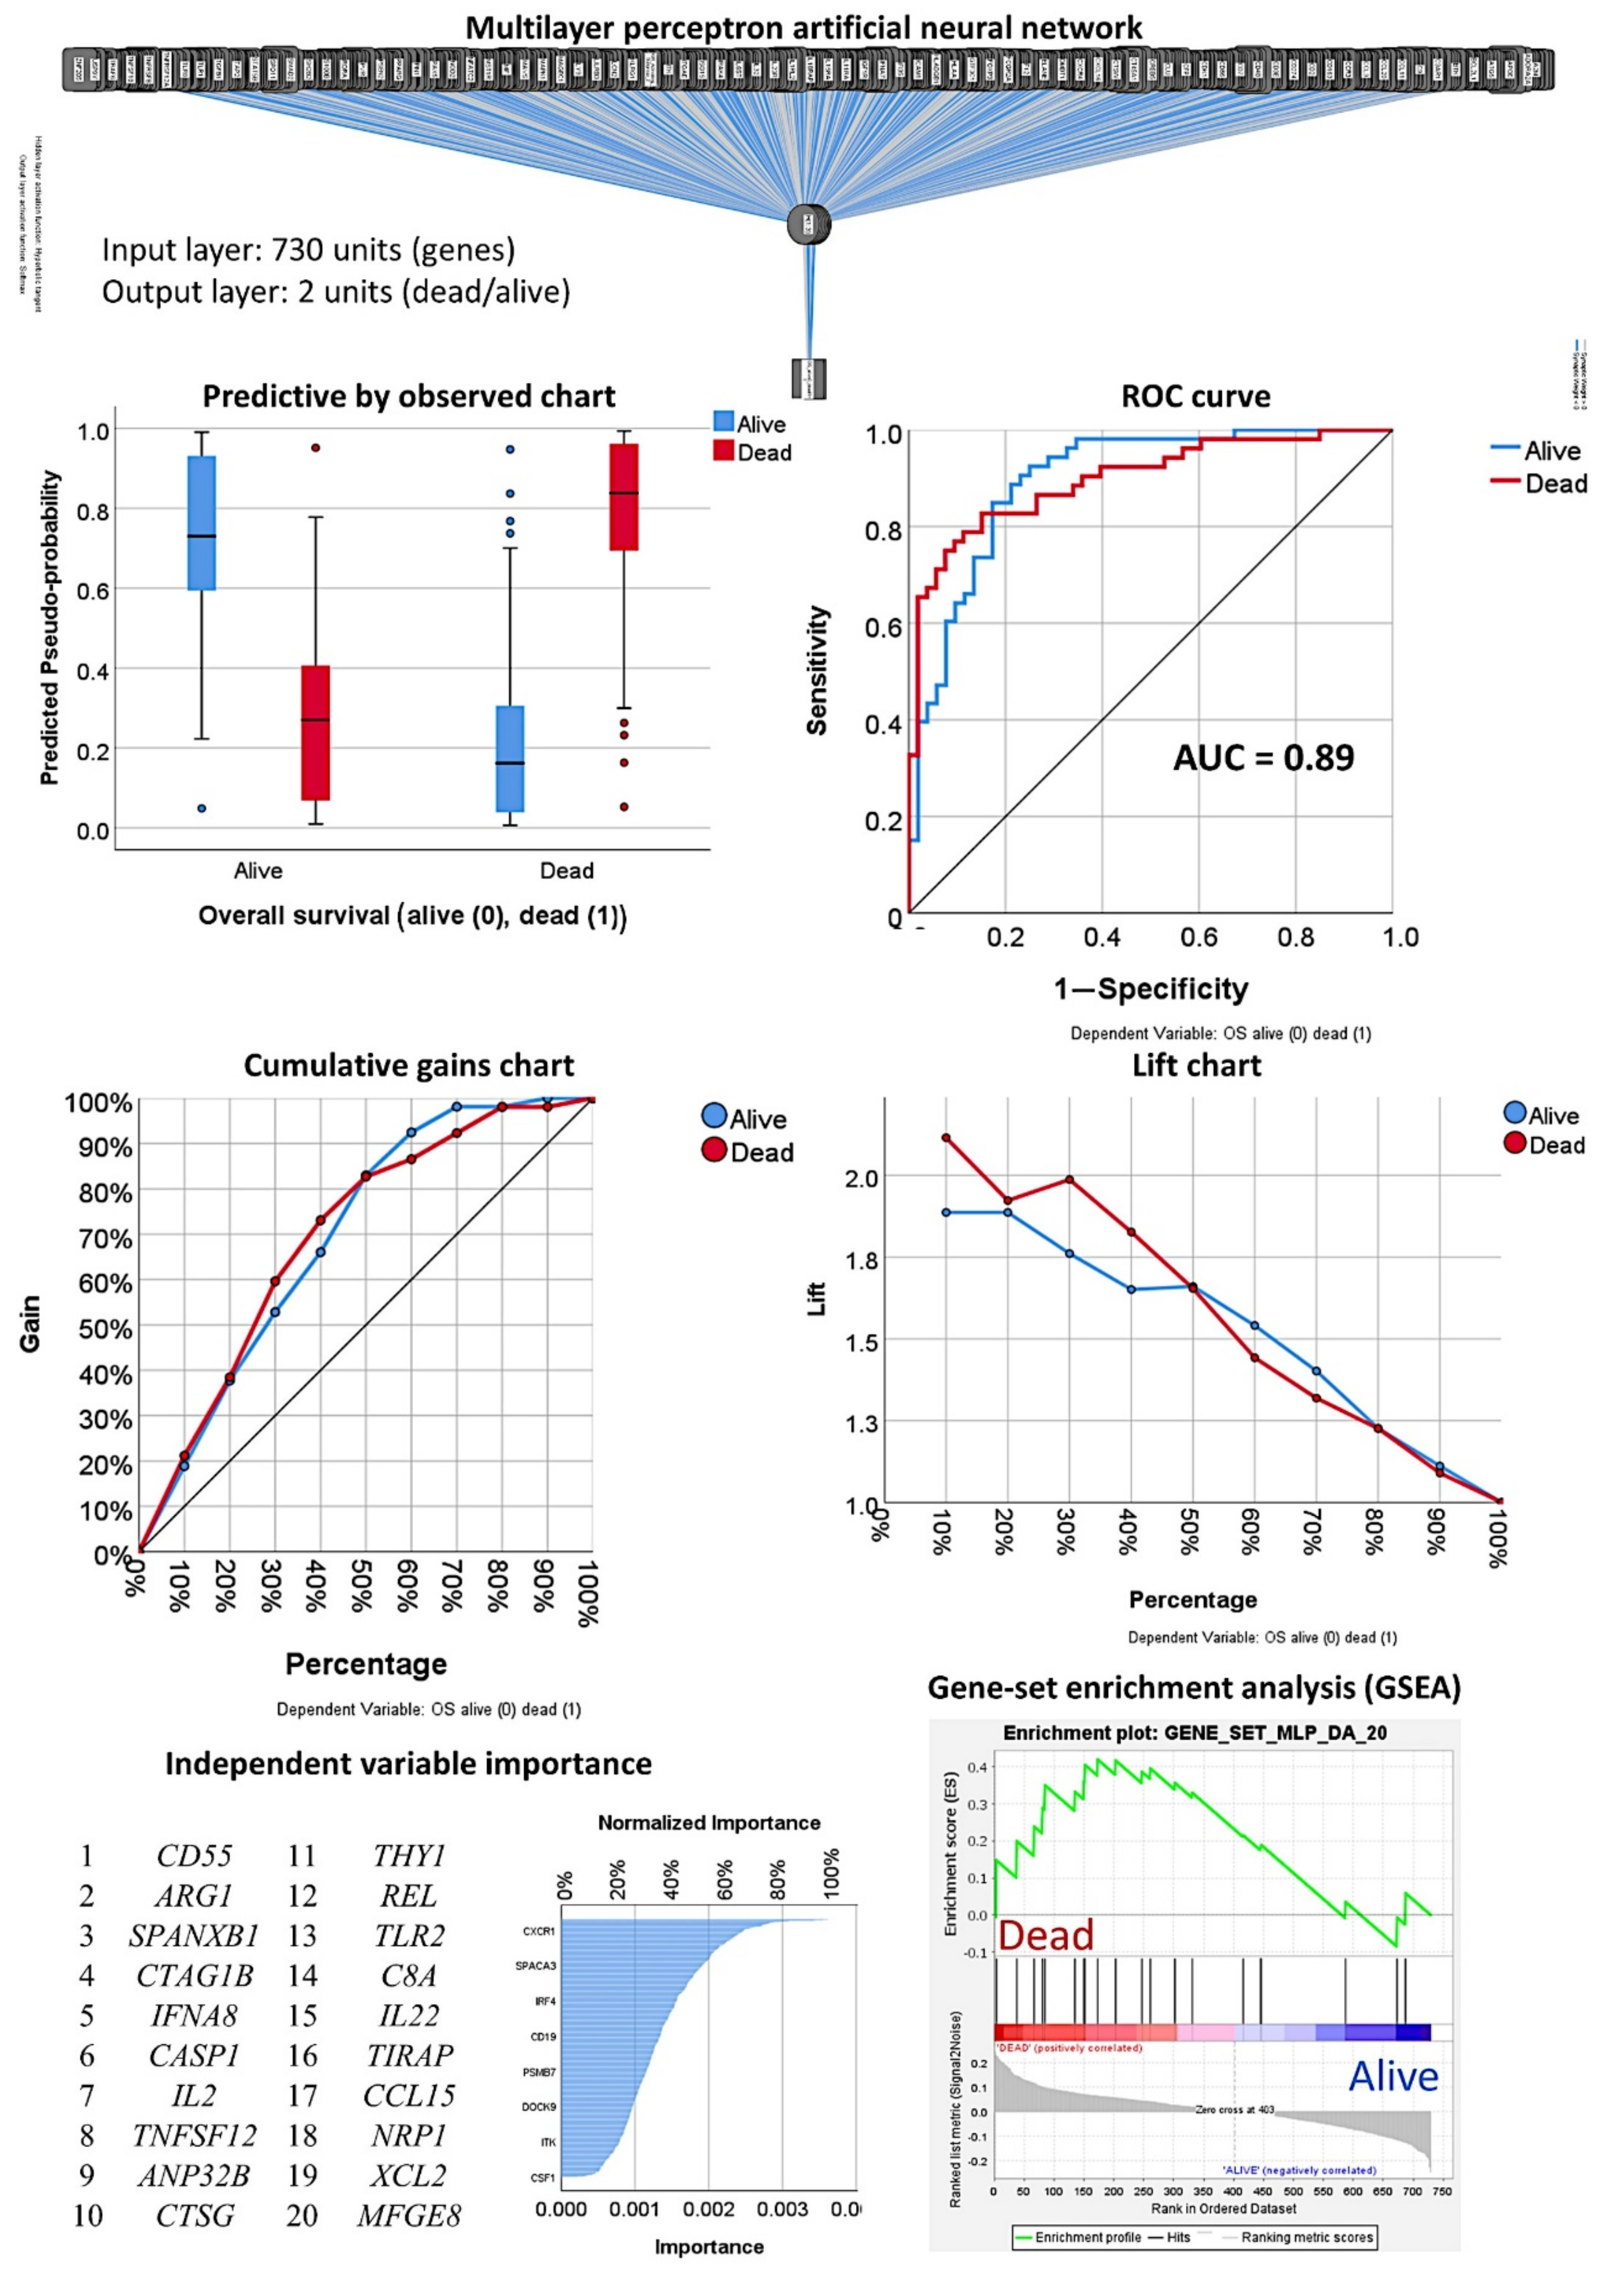
3.1. Prediction of the Overall Survival Outcome (Dead/Alive)
3.1.1. Analysis Using the 730 Genes of the Pancancer Panel
3.1.2. Analysis Using the Top 20 Genes of the MLP
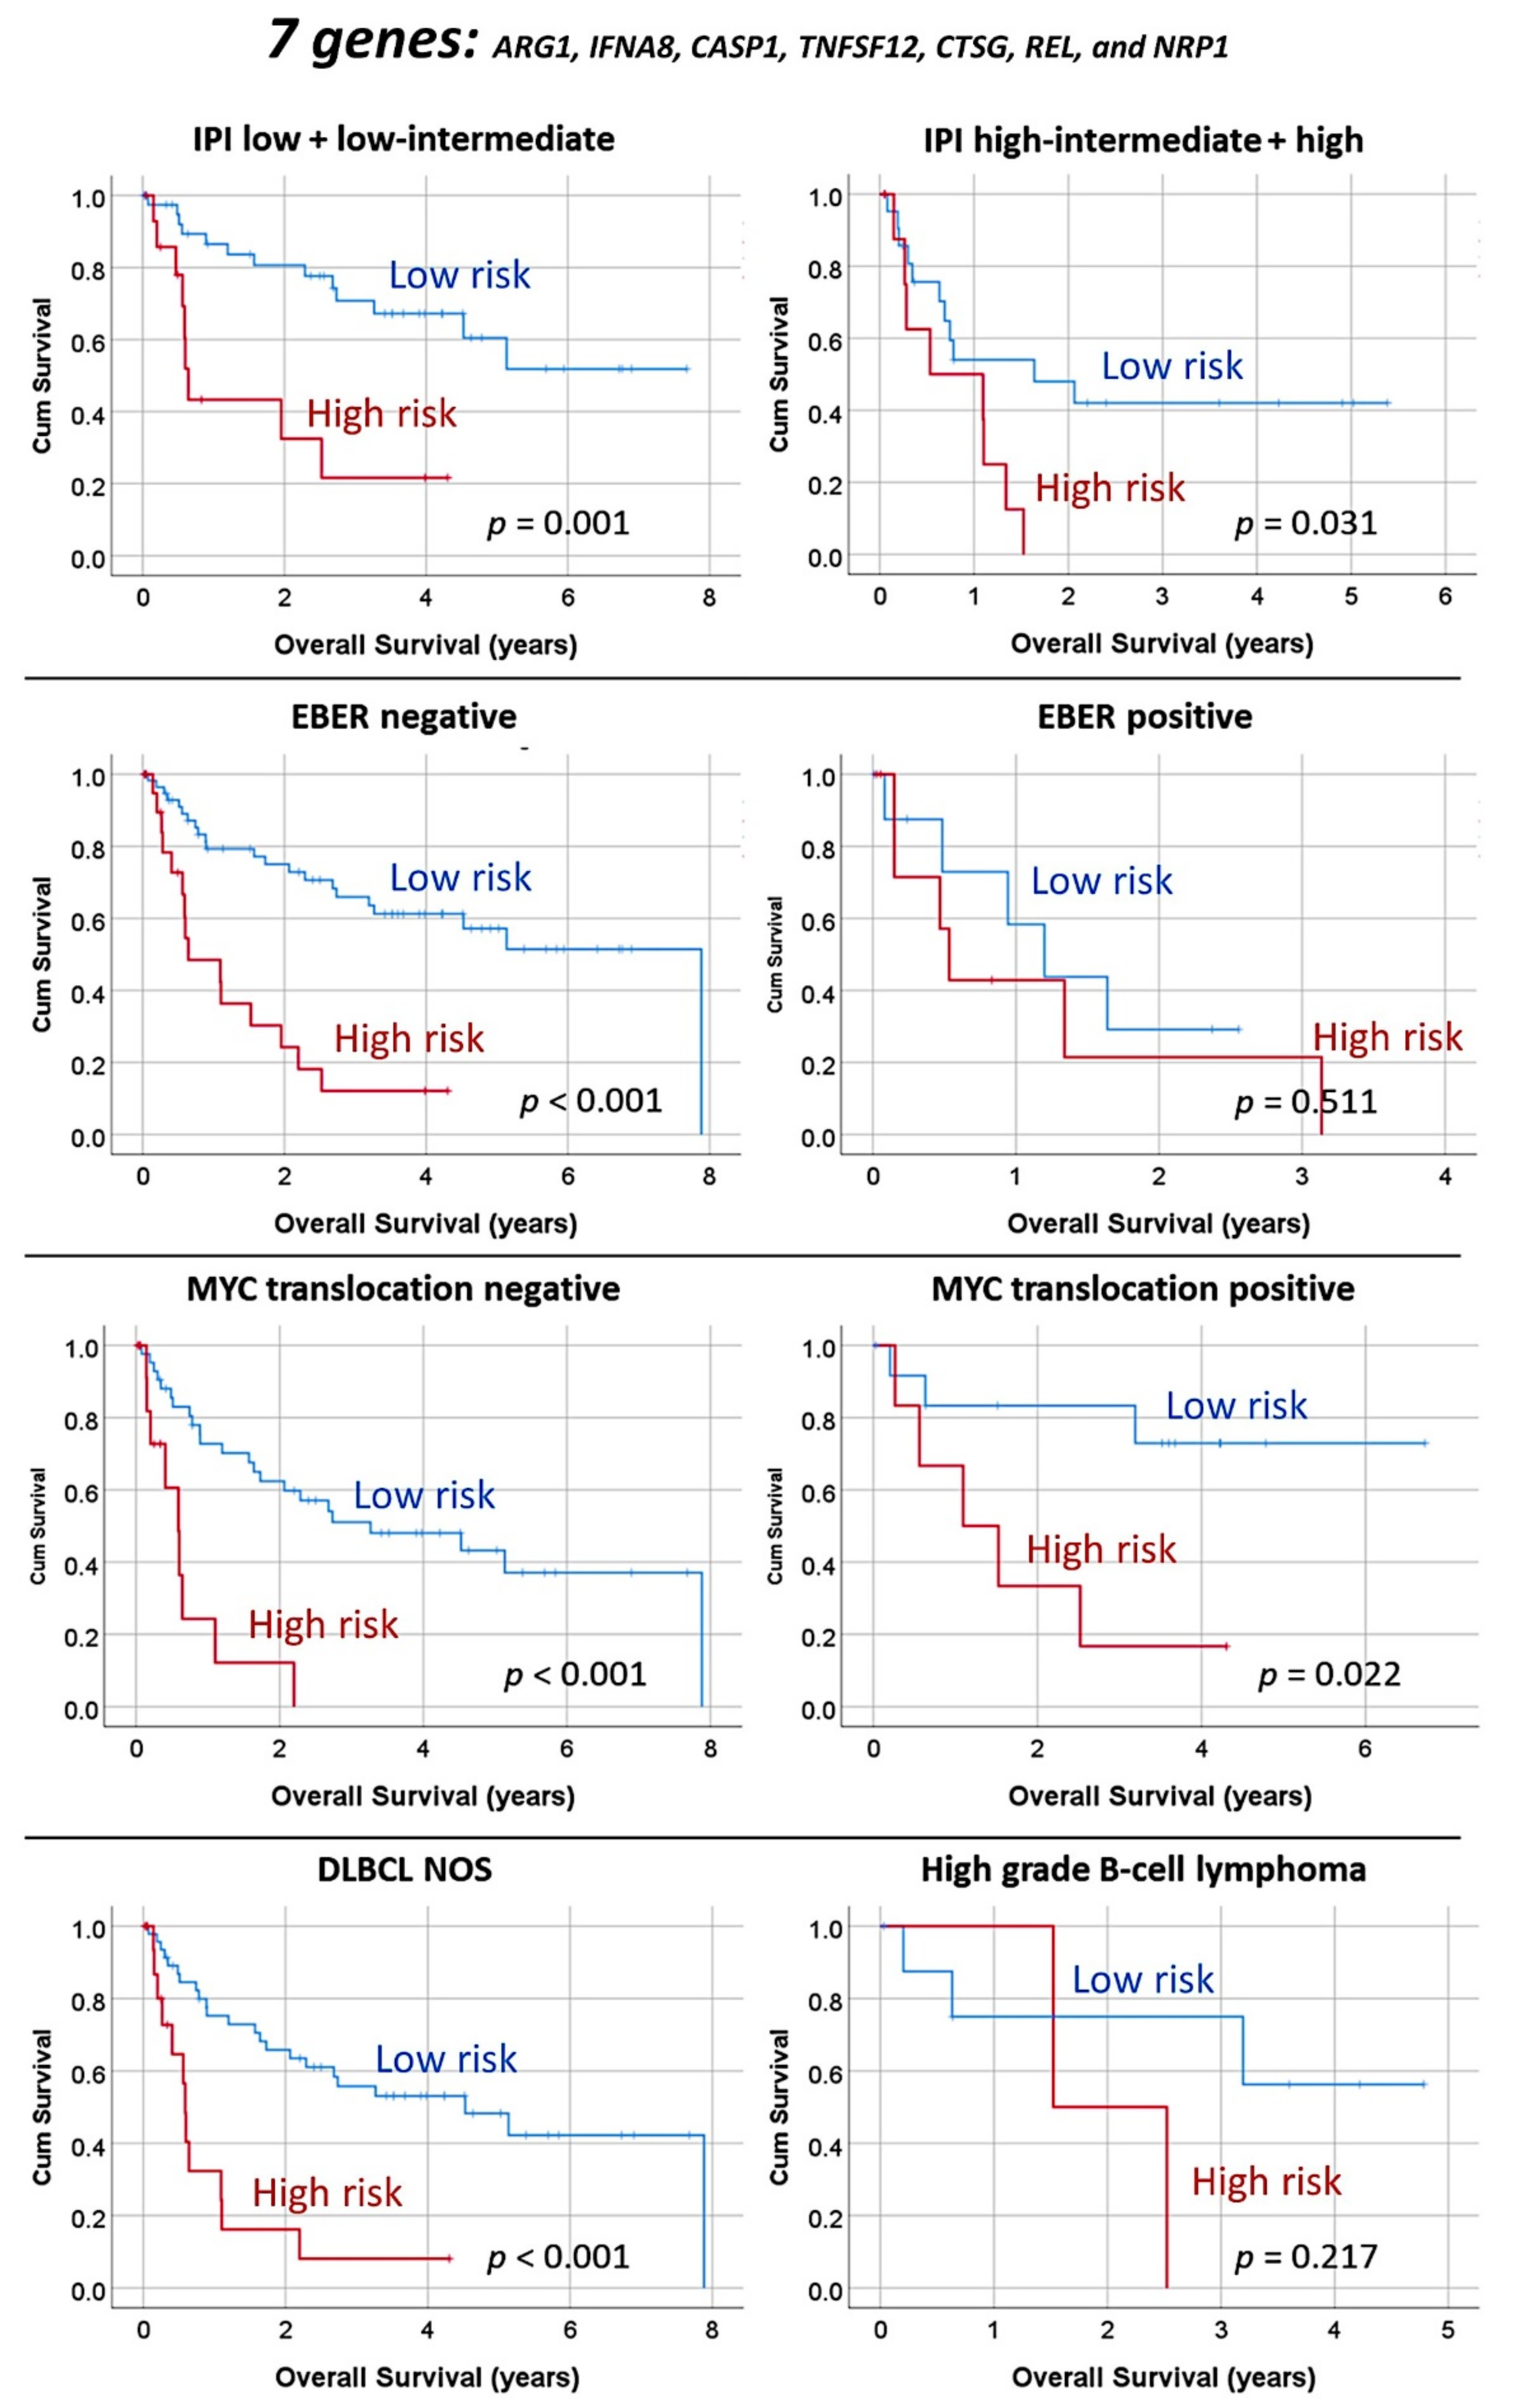
3.1.3. Multivariate Analysis Using the Set of Seven Genes and Clinicopathological Variables
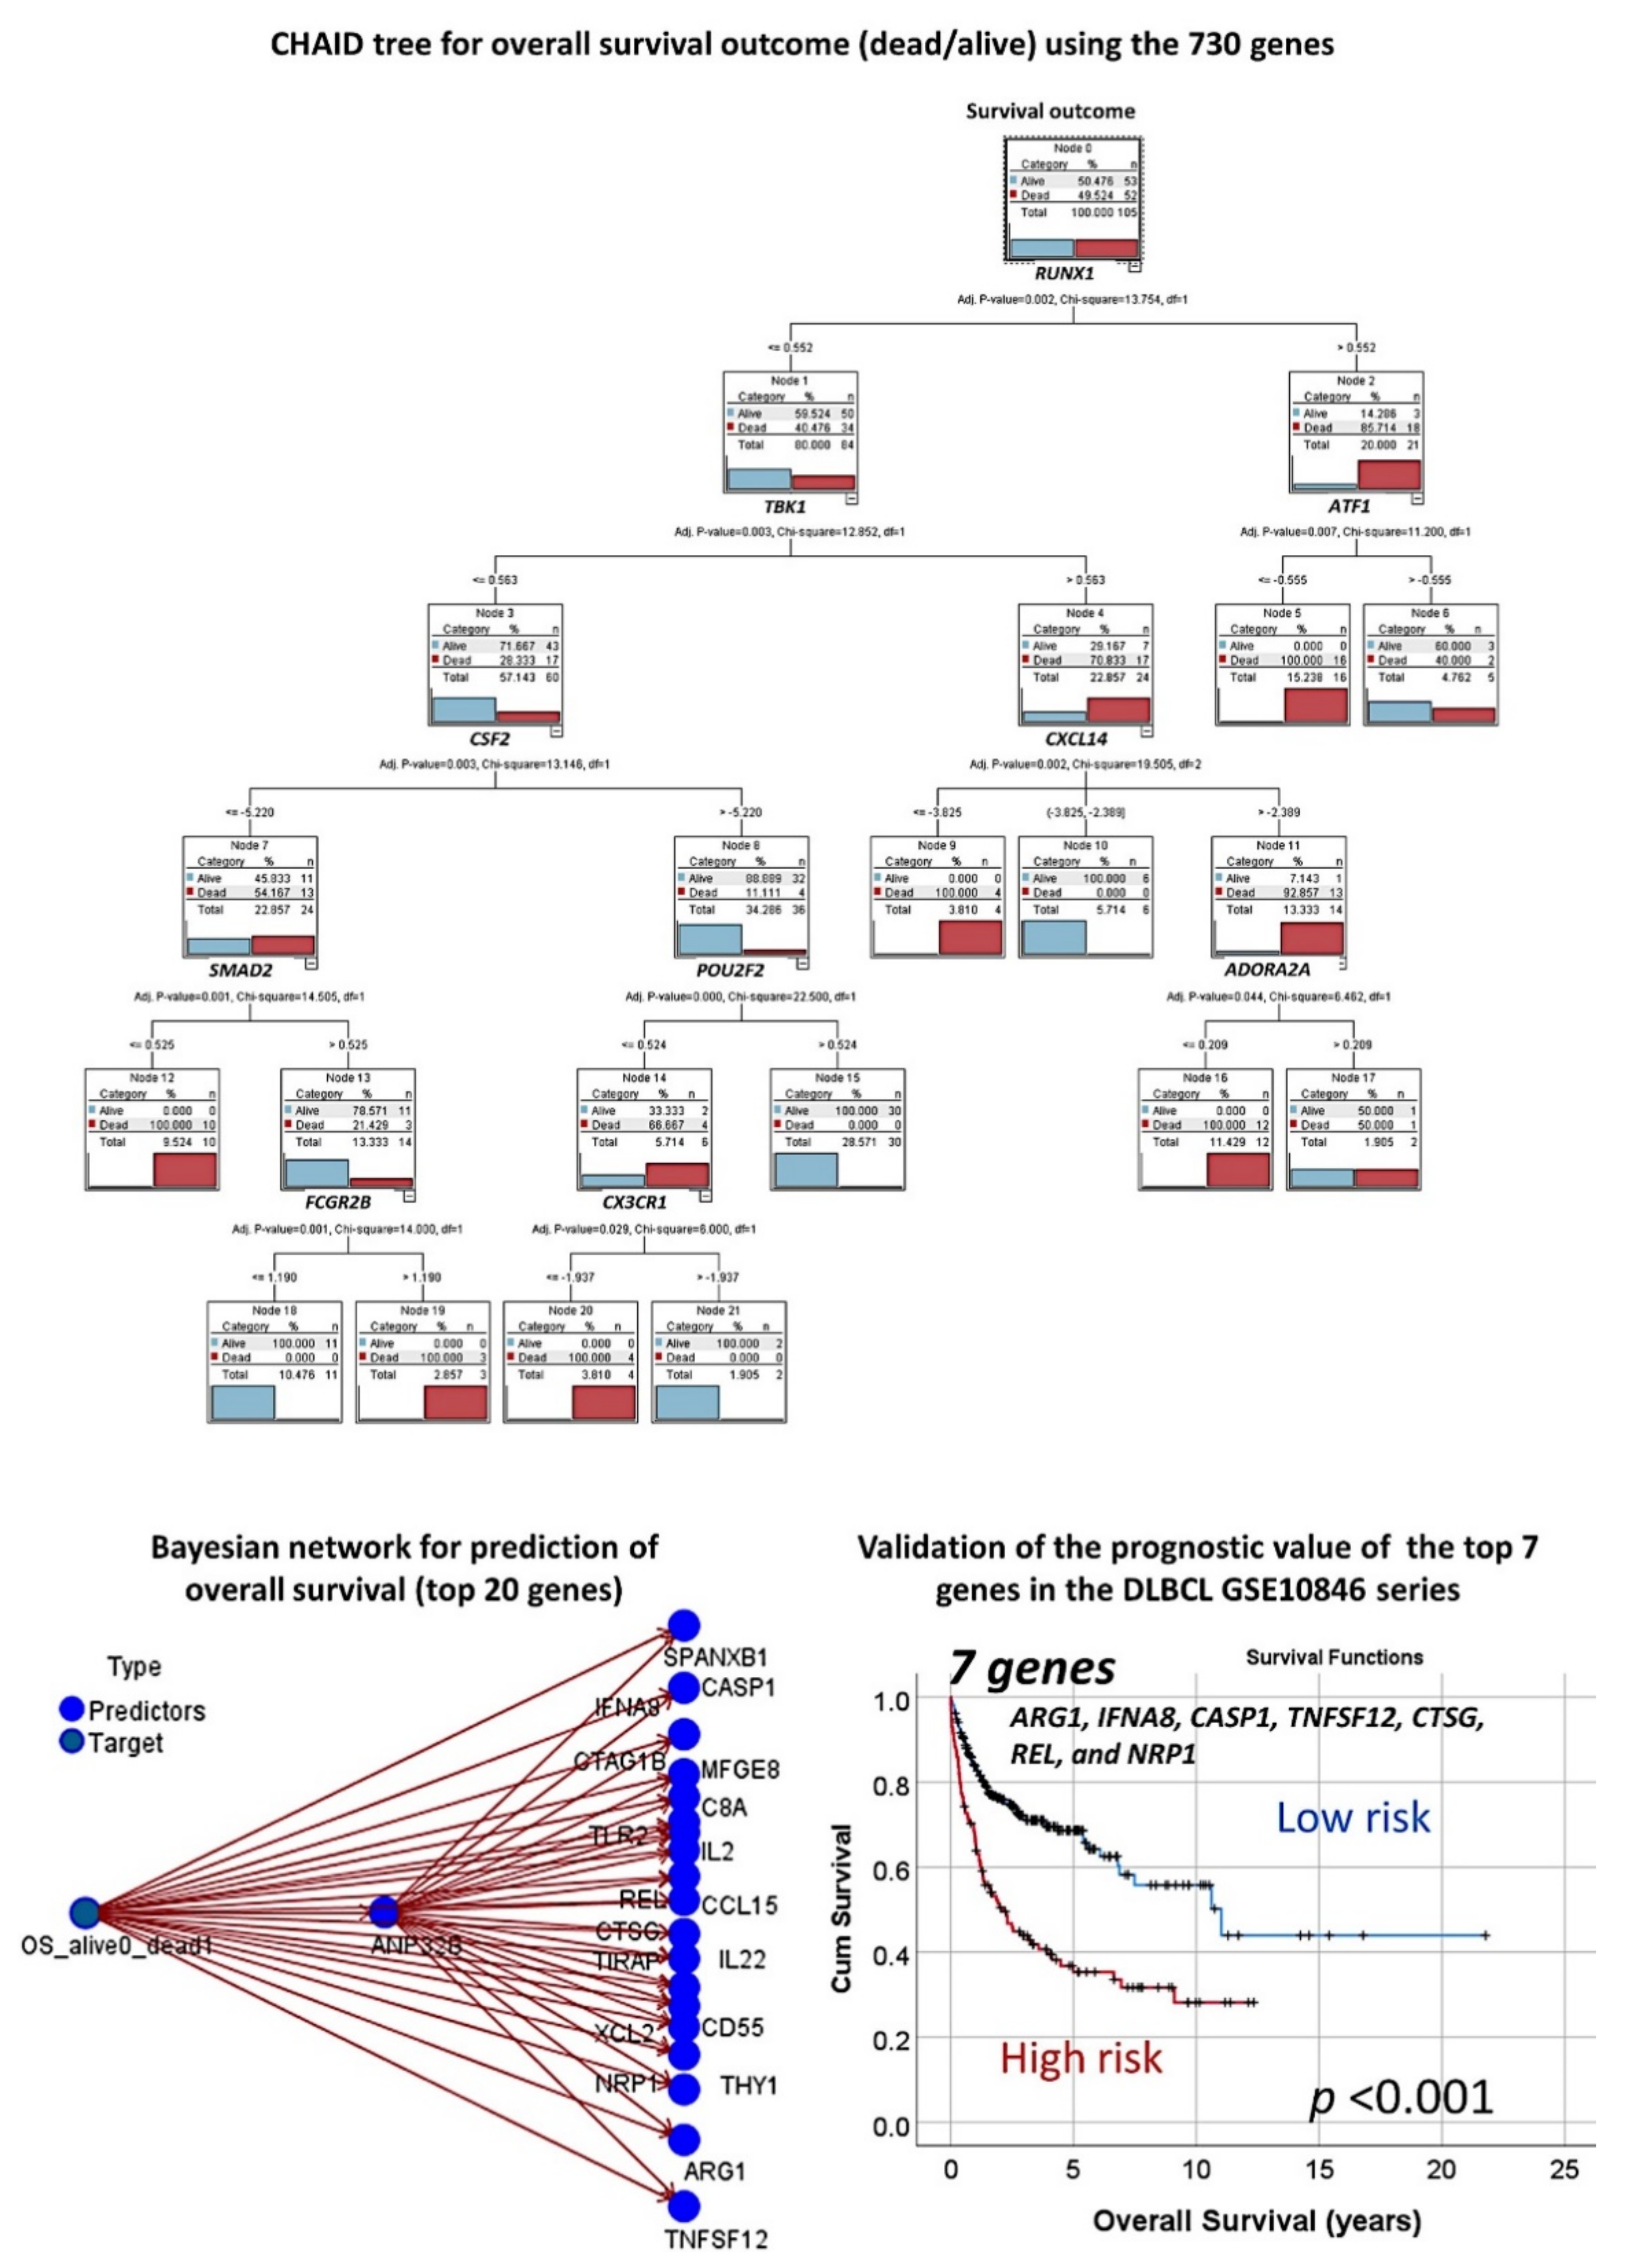
3.1.4. Additional Machine Learning Analyses
3.1.5. Validation in an Independent Series of DLBCL
3.2. Prediction of the Three Molecular Subtypes (GCB, ABC, and Unspecified)
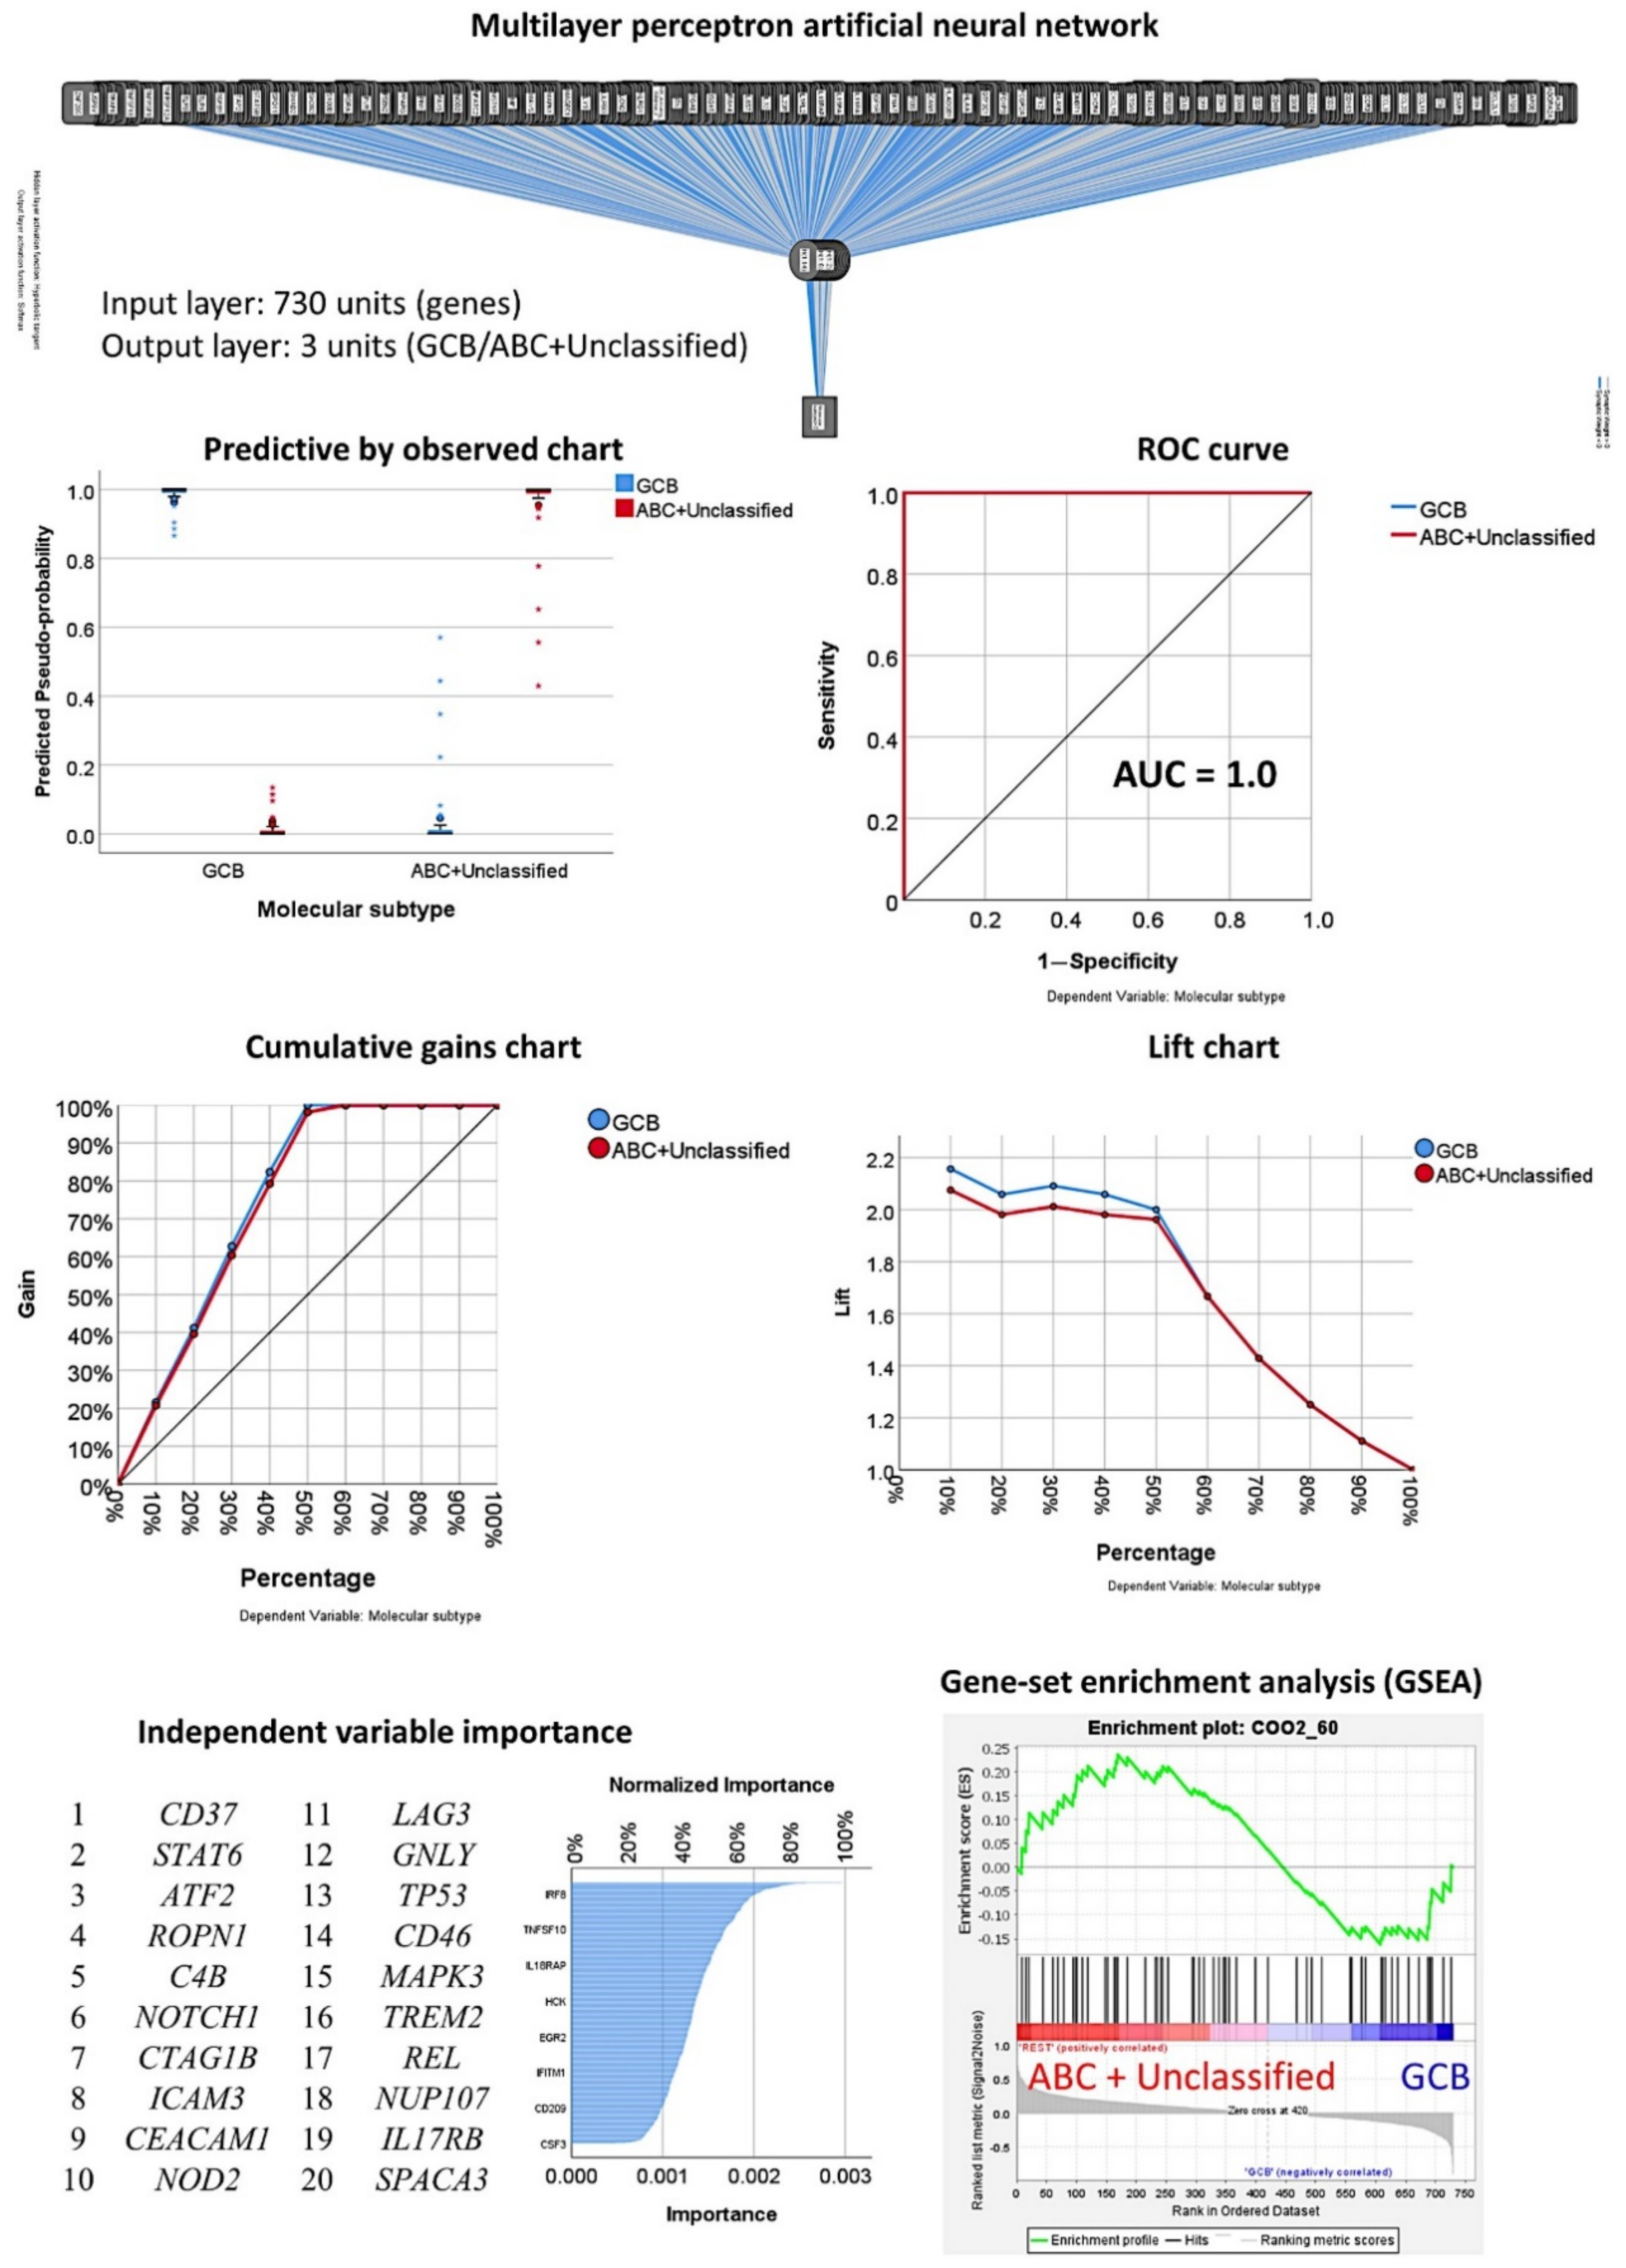
3.3. Prediction of the Two Molecular Subtypes (GCB, ABC+Unspecified)
3.3.1. Analysis Using the 730 Genes of the Pancancer Panel
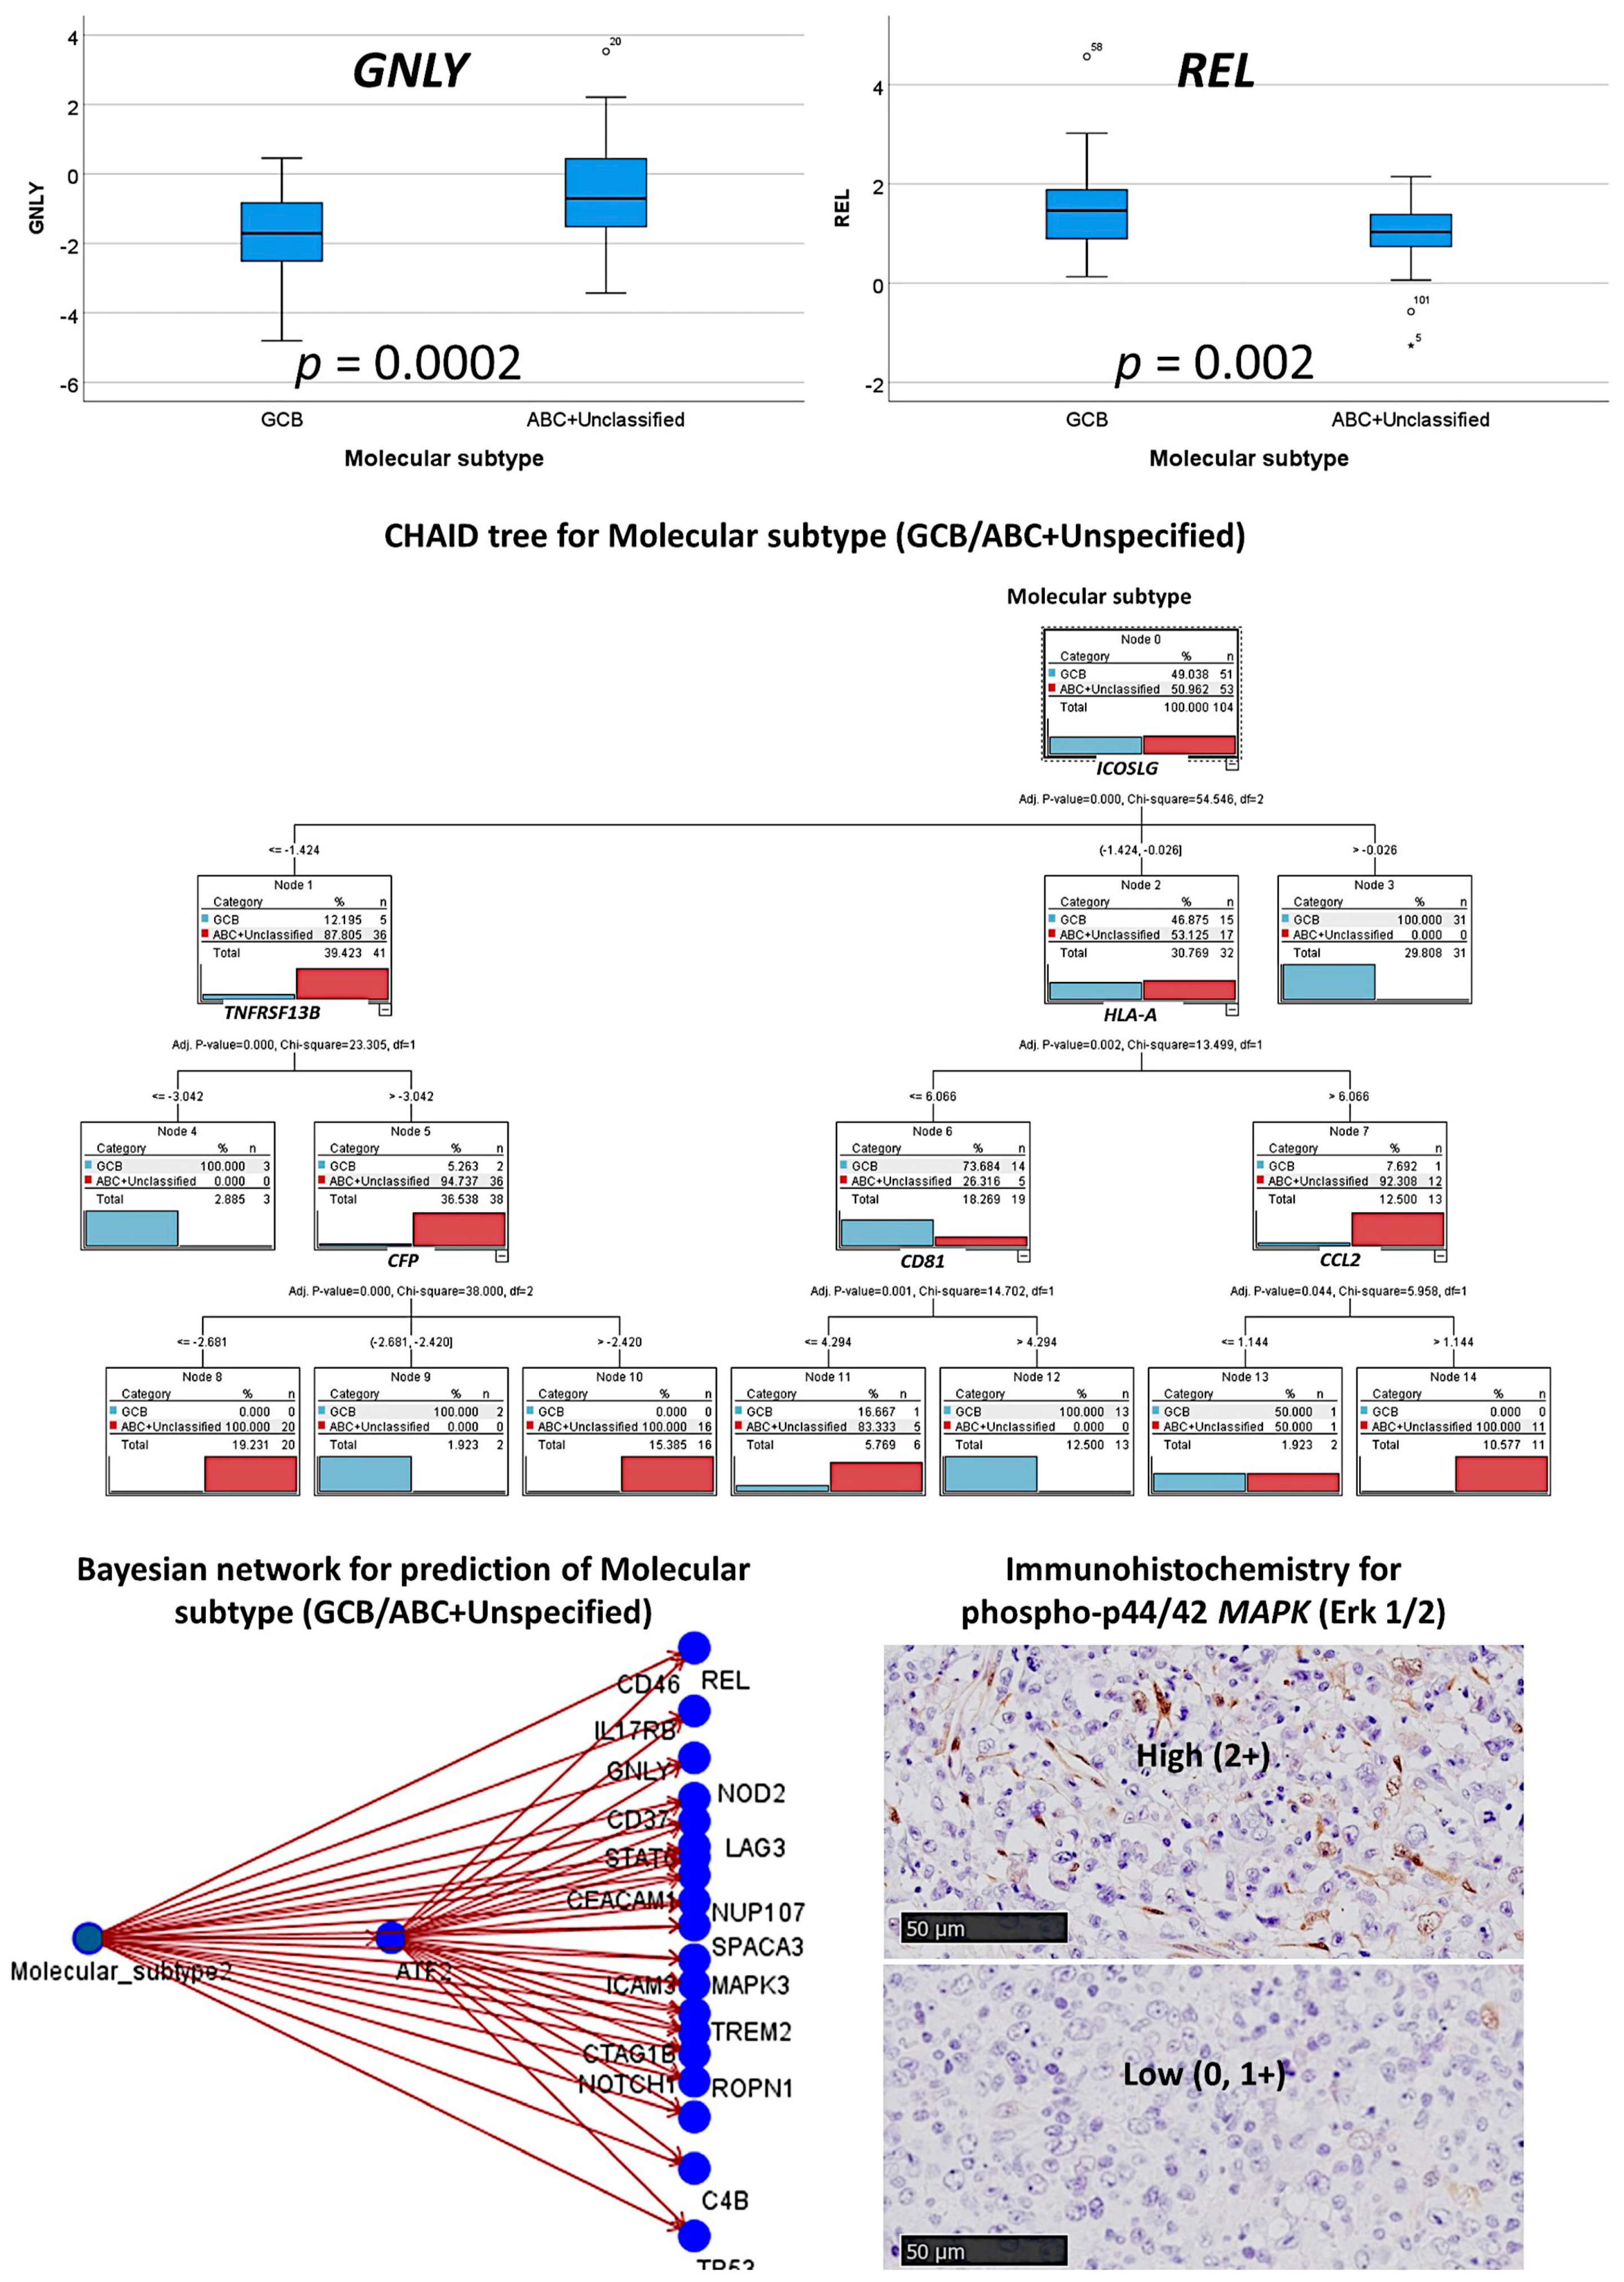
3.3.2. Analysis Using the Top 20 Genes of the MLP
3.3.3. Additional Machine Learning Analyses
3.4. Artificial Neural Network Analysis Using the Radial Basis Function
4. Discussion
5. Conclusions
Supplementary Materials
Author Contributions
Funding
Institutional Review Board Statement
Informed Consent Statement
Data Availability Statement
Conflicts of Interest
Appendix A

| Order | Gene | Beta | SE | Wald | df | p | Hazard Risk | 95.0% CI for HR | |
|---|---|---|---|---|---|---|---|---|---|
| Lower | Upper | ||||||||
| 1 | CD55 | −0.12 | 0.22 | 0.31 | 1 | 0.577 | 0.9 | 0.6 | 1.4 |
| 2 | ARG1 | 0.12 | 0.09 | 1.56 | 1 | 0.211 | 1.1 | 0.9 | 1.3 |
| 3 | SPANXB1 | 0.14 | 0.13 | 1.15 | 1 | 0.283 | 1.2 | 0.9 | 1.5 |
| 4 | CTAG1B | 0.06 | 0.12 | 0.22 | 1 | 0.641 | 1.1 | 0.8 | 1.3 |
| 5 | IFNA8 | 0.17 | 0.14 | 1.49 | 1 | 0.222 | 1.2 | 0.9 | 1.5 |
| 6 | CASP1 | 0.45 | 0.20 | 5.24 | 1 | 0.022 | 1.6 | 1.1 | 2.3 |
| 7 | IL2 | 0.04 | 0.15 | 0.09 | 1 | 0.767 | 1.0 | 0.8 | 1.4 |
| 8 | TNFSF12 | −0.05 | 0.16 | 0.11 | 1 | 0.74 | 0.9 | 0.7 | 1.3 |
| 9 | ANP32B | 0.06 | 0.31 | 0.04 | 1 | 0.851 | 1.1 | 0.6 | 1.9 |
| 10 | CTSG | 0.10 | 0.06 | 2.75 | 1 | 0.097 | 1.1 | 1.0 | 1.3 |
| 11 | THY1 | −0.08 | 0.14 | 0.30 | 1 | 0.586 | 0.9 | 0.7 | 1.2 |
| 12 | REL | −0.40 | 0.20 | 3.83 | 1 | 0.05 | 0.7 | 0.5 | 1.0 |
| 13 | TLR2 | 0.24 | 0.16 | 2.20 | 1 | 0.138 | 1.3 | 0.9 | 1.7 |
| 14 | C8A | 0.06 | 0.19 | 0.10 | 1 | 0.752 | 1.1 | 0.7 | 1.6 |
| 15 | IL22 | 0.06 | 0.13 | 0.17 | 1 | 0.677 | 1.1 | 0.8 | 1.4 |
| 16 | TIRAP | −0.01 | 0.28 | 0.00 | 1 | 0.967 | 1.0 | 0.6 | 1.7 |
| 17 | CCL15 | −0.03 | 0.22 | 0.02 | 1 | 0.901 | 1.0 | 0.6 | 1.5 |
| 18 | NRP1 | −0.08 | 0.18 | 0.19 | 1 | 0.663 | 0.9 | 0.7 | 1.3 |
| 19 | XCL2 | 0.12 | 0.12 | 0.97 | 1 | 0.324 | 1.1 | 0.9 | 1.4 |
| 20 | MFGE8 | −0.11 | 0.13 | 0.68 | 1 | 0.41 | 0.9 | 0.7 | 1.2 |
| Order | Gene | Beta | SE | Wald | df | p | Hazard Risk | 95.0% CI for HR | |
|---|---|---|---|---|---|---|---|---|---|
| Lower | Upper | ||||||||
| 1 | CD37 | 0.16 | 0.19 | 0.67 | 1 | 0.413 | 1.2 | 0.8 | 1.7 |
| 2 | STAT6 | −0.84 | 0.48 | 3.07 | 1 | 0.080 | 0.4 | 0.2 | 1.1 |
| 3 | ATF2 | −0.64 | 0.65 | 0.96 | 1 | 0.327 | 0.5 | 0.1 | 1.9 |
| 4 | ROPN1 | 0.47 | 0.33 | 2.09 | 1 | 0.149 | 1.6 | 0.8 | 3.0 |
| 5 | C4B | 0.22 | 0.14 | 2.65 | 1 | 0.103 | 1.2 | 1.0 | 1.6 |
| 6 | NOTCH1 | −0.18 | 0.32 | 0.32 | 1 | 0.575 | 0.8 | 0.4 | 1.6 |
| 7 | CTAG1B | 0.28 | 0.24 | 1.32 | 1 | 0.250 | 1.3 | 0.8 | 2.1 |
| 8 | ICAM3 | 0.44 | 0.28 | 2.55 | 1 | 0.111 | 1.6 | 0.9 | 2.7 |
| 9 | CEACAM1 | 0.38 | 0.18 | 4.36 | 1 | 0.037 | 1.5 | 1.0 | 2.1 |
| 10 | NOD2 | 0.27 | 0.18 | 2.26 | 1 | 0.133 | 1.3 | 0.9 | 1.9 |
| 11 | LAG3 | 0.35 | 0.14 | 6.22 | 1 | 0.013 | 1.4 | 1.1 | 1.9 |
| 12 | GNLY | 0.62 | 0.17 | 13.10 | 1 | 0.000 | 1.9 | 1.3 | 2.6 |
| 13 | TP53 | −0.97 | 0.39 | 6.02 | 1 | 0.014 | 0.4 | 0.2 | 0.8 |
| 14 | CD46 | 0.39 | 0.34 | 1.30 | 1 | 0.254 | 1.5 | 0.8 | 2.9 |
| 15 | MAPK3 | −0.49 | 0.49 | 0.99 | 1 | 0.319 | 0.6 | 0.2 | 1.6 |
| 16 | TREM2 | −0.19 | 0.22 | 0.76 | 1 | 0.383 | 0.8 | 0.5 | 1.3 |
| 17 | REL | −1.16 | 0.36 | 10.61 | 1 | 0.001 | 0.3 | 0.2 | 0.6 |
| 18 | NUP107 | −0.59 | 0.58 | 1.04 | 1 | 0.309 | 0.6 | 0.2 | 1.7 |
| 19 | IL17RB | 0.17 | 0.10 | 2.94 | 1 | 0.087 | 1.2 | 1.0 | 1.5 |
| 20 | SPACA3 | 0.14 | 0.22 | 0.39 | 1 | 0.530 | 1.1 | 0.7 | 1.8 |
| Order | Gene | Gene Class | Immune Response Category | Annotation |
|---|---|---|---|---|
| 1 | CD55 | Immune Response | N/A | CD molecules, innate immune response |
| 2 | ARG1 | Immune Response | N/A | Response to drug |
| 3 | SPANXB1 | CT Antigen | N/A | N/A |
| 4 | CTAG1B | CT Antigen | N/A | N/A |
| 5 | IFNA8 | Immune Response | Interleukins | Innate immune response, interleukins |
| 6 | CASP1 | Immune Response | N/A | Innate immune response |
| 7 | IL2 | Immune Response | Cytokines, T-Cell Functions, Regulation | Adaptive immune response, anti-inflammatory cytokines, B-cell activation, cytokines and receptors, innate immune response, interleukins, Th1 and Th2 differentiation, T-cell differentiation, T-cell polarization, T-cell regulators |
| 8 | TNFSF12 (TWEAK) | Immune Response | Chemokines, TNF Superfamily | Chemokines and receptors, TNF superfamily members and their receptors |
| 9 | ANP32B (APRIL) | Immune Response—Cell Type Specific (Th) | Cell Functions | Basic cell functions, cell type specific |
| 10 | CTSG | Immune Response—Cell Type Specific (Mast cell) | Regulation, Pathogen Defense | Cell type specific, defense response to fungus, positive regulation of immune response |
| 11 | THY1 | Immune Response | N/A | CD molecules |
| 12 | REL | Immune Response | Regulation | Transcription factors |
| 13 | TLR2 | Immune Response | TLR | CD molecules, innate immune response, toll-like receptor |
| 14 | C8A | Immune Response | Complement | Complement pathway, innate immune response |
| 15 | IL22 | Immune Response | Cytokines | Acute-phase response, anti-inflammatory cytokines, interleukins |
| 16 | TIRAP | Immune Response | N/A | Innate immune response |
| 17 | CCL15 | Immune Response | Chemokines | Adaptive immune response, chemokines and receptors, inflammatory response |
| 18 | NRP1 | Immune Response | Cell Functions | Basic cell functions, CD molecules |
| 19 | XCL2 | Immune Response | Chemokines | Chemokines and receptors |
| 20 | MFGE8 | Immune Response | Transporter Functions | Receptors involved in phagocytosis |
| Order | Gene | Gene Class | Immune Response Category | Annotation |
|---|---|---|---|---|
| 1 | CD37 | Immune Response | N/A | Adaptive immune response, CD molecules |
| 2 | STAT6 | Immune Response—Cell Type Specific (Th2 cell) | Chemokines, Regulation, T-Cell Functions | Adaptive immune response, cytokines and receptors, cell type specific, Th2 orientation, transcription factors, transcriptional regulators |
| 3 | ATF2 | Immune Response | N/A | Innate immune response |
| 4 | ROPN1 | CT Antigen | N/A | N/A |
| 5 | C4B | Immune Response | Complement | Complement pathway, innate immune response |
| 6 | NOTCH1 | Immune Response | Regulation | Transcriptional regulators |
| 7 | CTAG1B | CT Antigen | N/A | N/A |
| 8 | ICAM3 | Immune Response | Adhesion, Regulation | Adhesion, CD molecules, regulation of immune response |
| 9 | CEACAM1 | Immune Response | Adhesion | Adhesion, CD molecules |
| 10 | NOD2 | Immune Response | Cytokines | Innate immune response, cytokines and receptors |
| 11 | LAG3 | Immune Response—Checkpoint | Regulation, T-Cell Functions | Adaptive immune response, CD molecules, negative regulation of immune response, T-cell activation |
| 12 | GNLY | Immune Response—Cell Type Specific (Cytotoxic cells) | Cell Functions, Cytotoxicity | Adaptive immune response, basic cell functions, cell type specific, cytotoxicity |
| 13 | TP53 | Immune Response | T-Cell Functions | T-cell proliferation |
| 14 | CD46 | Immune Response | N/A | CD molecules, innate immune response |
| 15 | MAPK3 | Immune Response | N/A | Innate immune response |
| 16 | TREM2 | Immune Response | N/A | Humoral immune response |
| 17 | REL | Immune Response | Regulation | Transcription factors |
| 18 | NUP107 | Immune Response—Cell Type Specific (Th cell) | Cell Cycle | Cell type specific, M phase of mitotic cell cycle |
| 19 | IL17RB | Immune Response | Chemokines | Chemokines and receptors |
| 20 | SPACA3 | CT Antigen | N/A | N/A |
| Variable | Frequency (%) | Univariate Cox Regression for Overall Survival | |||
|---|---|---|---|---|---|
| p | Hazard R. | Lower | Upper | ||
| Male | 54/97 (55.7) | 0.941 | 1 | 0.5 | 1.9 |
| Age > 60 | 67/97 (69.1) | 0.004 | 4 | 1.6 | 10.3 |
| Ann Arbor stage III–IV | 42/89 (47.2) | 0.06 | 1.9 | 0.9 | 3.7 |
| ECOG performance status ≥2 | 13/78 (16.7) | 0.0002 | 4.3 | 1.9 | 9.4 |
| Serum LDH high (>219) | 58/96 (60.4) | 0.004 | 3.1 | 1.4 | 6.8 |
| Extranodal sites >1 | 18/73 (24.7) | 0.003 | 3.1 | 1.5 | 6.4 |
| IPI | |||||
| Low | 31/81 (38.3) | Reference | - | - | - |
| Low–intermediate | 25/81 (30.9) | 0.008 | 3.7 | 1.4 | 9.8 |
| High–intermediate | 14/81 (17.3) | 0.033 | 3.3 | 1.1 | 9.9 |
| High | 11/81 (13.6) | 0.004 | 5.3 | 1.7 | 16.5 |
| sIL2R high (>530) | 70/91 (76.9) | 0.017 | 4.2 | 1.3 | 13.7 |
| B symptoms | 19/80 (23.8) | 0.395 | 1.4 | 0.7 | 3 |
| Location | |||||
| Nodal (+spleen) | 53/97 (54.6) | Reference | - | - | - |
| Waldeyer’s ring | 9/97 (9.3) | 0.167 | 0.2 | 0 | 1.8 |
| Gastrointestinal | 10/97 (10.3) | 0.748 | 0.8 | 0.2 | 2.8 |
| Other extranodal | 25/97 (25.8) | 0.216 | 1.5 | 0.8 | 2.9 |
| Treatment | |||||
| RCHOP | 65/91 (71.4) | Reference | - | - | - |
| RCHOP-like | 20/91 (22.0) | 0.136 | 1.7 | 0.8 | 3.6 |
| Others | 6/91 (6.6) | 0.133 | 2.5 | 0.8 | 8.5 |
| Response to treatment | |||||
| CR | 64/86 (74.4) | Reference | - | - | - |
| PD | 11/86 (12.8) | 6.5 × 10⁻¹¹ | 26.3 | 9.8 | 70.2 |
| PR | 11/86 (12.8) | 1.7 × 10⁻⁸ | 12.7 | 5.3 | 30.9 |
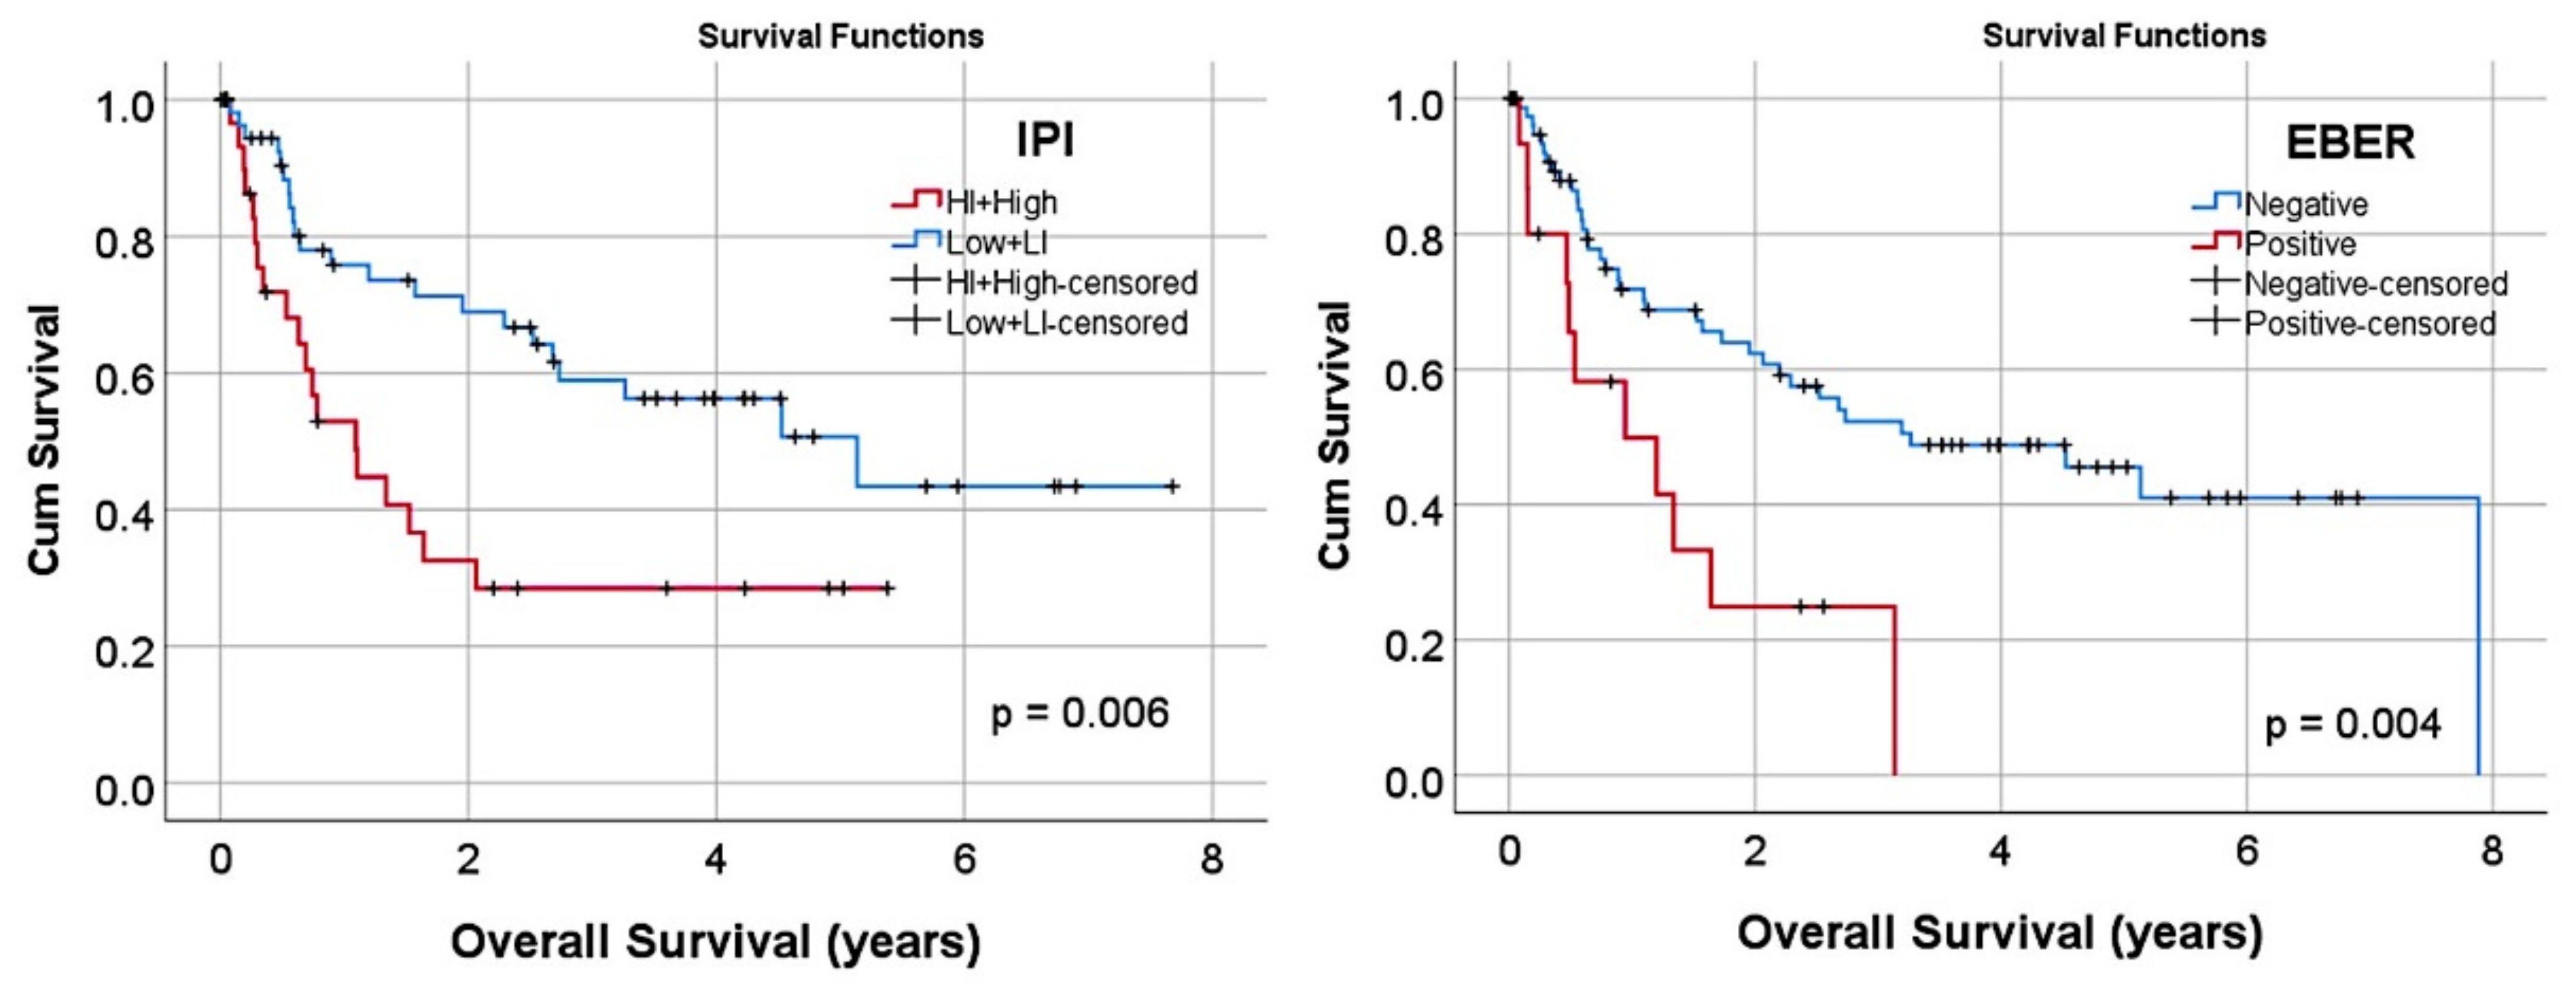
| Epstein–Barr virus (EBER+) | 12/95 (15.8) | 0.004 | 3 | 1.4 | 6.4 |
| Hans classifier | |||||
| GCB | 31/95 (32.6) | Reference | - | - | - |
| Non-GCB | 64/95 (67.4) | 0.013 | 2.8 | 1.3 | 6.4 |
| Immune phenotype | |||||
| CD3+ | 0/97 (0) | N/A | - | - | - |
| CD5+ | 14/96 (14.6) | 0.736 | 0.9 | 0.4 | 2.1 |
| CD20+ | 93/97 (95.9) | 0.417 | 0.6 | 0.1 | 2.3 |
| CD10+ | 29/96 (30.2) | 0.011 | 0.3 | 0.1 | 0.8 |
| MUM1+ (IRF4) | 76/96 (79.2) | 0.193 | 1.7 | 0.8 | 3.9 |
| BCL2+ | 76/96 (79.2) | 0.054 | 2.8 | 0.9 | 7.8 |
| BCL6+ | 64/96 (66.7) | 0.821 | 0.9 | 0.5 | 1.8 |
| RGS1 high (>3%) | 51/95 (53.7) | 0.013 | 2.5 | 1.2 | 5.2 |
| Molecular analysis | |||||
| MYD88 L265P mutation | 3/39 (7.7) | 0.542 | 0.5 | 0.1 | 4 |
| BCL2 translocation | 2/42 (4.8) | 0.993 | 0.9 | 0.1 | 7.4 |
| MYC translocation | 7/46 (15.2) | 0.814 | 0.9 | 0.3 | 2.9 |
| BCL2/MYC double hit | 1/42 (2.4) | 0.321 | 2.8 | 0.4 | 21.6 |
References
- Brown, J.R.; Freedman, A.S.; Aster, J.C. Pathobiology of Diffuse Large B Cell Lymphoma and Primary Mediastinal Large B Cell Lymphoma; UpToDate: Waltham, MA, USA, 2021. [Google Scholar]
- Aster, J.C.; Freedman, A.S. Prognosis of Diffuse Large B Cell Lymphoma; UpToDate: Waltham, MA, USA, 2021. [Google Scholar]
- Swerdlow, S.H.; Campo, E.; Pileri, S.A.; Harris, N.L.; Stein, H.; Siebert, R.; Advani, R.; Ghielmini, M.; Salles, G.A.; Zelenetz, A.D.; et al. The 2016 revision of the World Health Organization classification of lymphoid neoplasms. Blood 2016, 127, 2375–2390. [Google Scholar] [CrossRef] [Green Version]
- Smith, A.; Crouch, S.; Howell, D.; Burton, C.; Patmore, R.; Roman, E. Impact of age and socioeconomic status on treatment and survival from aggressive lymphoma: A UK population-based study of diffuse large B-cell lymphoma. Cancer Epidemiol. 2015, 39, 1103–1112. [Google Scholar] [CrossRef] [Green Version]
- Cho, I.; Yoon, N.; Hyeon, J.; Sim, J.; Yoo, H.Y.; Kim, S.J.; Kim, W.S.; Ko, Y.H. Comparison of the Lymph2Cx Assay and Hans Algorithm in Determining the Cell-of-Origin of Diffuse Large B-Cell Lymphomas, Not Otherwise Specified. Appl. Immunohistochem. Mol. Morphol. 2020, 28, 731–740. [Google Scholar] [CrossRef]
- Choi, W.W.L.; Weisenburger, D.D.; Greiner, T.C.; Piris, M.A.; Banham, A.H.; Delabie, J.; Braziel, R.M.; Geng, H.; Iqbal, J.; Lenz, G.; et al. A New Immunostain Algorithm Classifies Diffuse Large B-Cell Lymphoma into Molecular Subtypes with High Accuracy. Clin. Cancer Res. 2009, 15, 5494–5502. [Google Scholar] [CrossRef] [Green Version]
- Hans, C.P.; Weisenburger, D.D.; Greiner, T.C.; Gascoyne, R.D.; Delabie, J.; Ott, G.; Müller-Hermelink, H.K.; Campo, E.; Braziel, R.M.; Jaffe, E.S.; et al. Confirmation of the molecular classification of diffuse large B-cell lymphoma by immunohistochemistry using a tissue microarray. Blood 2004, 103, 275–282. [Google Scholar] [CrossRef] [PubMed]
- Rosenwald, A.; Wright, G.; Chan, W.C.; Connors, J.M.; Campo, E.; Fisher, R.I.; Gascoyne, R.D.; Muller-Hermelink, H.K.; Smeland, E.B.; Giltnane, J.M.; et al. The Use of Molecular Profiling to Predict Survival after Chemotherapy for Diffuse Large-B-Cell Lymphoma. N. Engl. J. Med. 2002, 346, 1937–1947. [Google Scholar] [CrossRef] [PubMed]
- Scott, D.W.; Mottok, A.; Ennishi, D.; Wright, G.W.; Farinha, P.; Ben-Neriah, S.; Kridel, R.; Barry, G.S.; Hother, C.; Abrisqueta, P.; et al. Prognostic Significance of Diffuse Large B-Cell Lymphoma Cell of Origin Determined by Digital Gene Expression in Formalin-Fixed Paraffin-Embedded Tissue Biopsies. J. Clin. Oncol. 2015, 33, 2848–2856. [Google Scholar] [CrossRef] [PubMed]
- Carreras, J.; Kikuti, Y.Y.; Miyaoka, M.; Hiraiwa, S.; Tomita, S.; Ikoma, H.; Kondo, Y.; Ito, A.; Nakamura, N.; Hamoudi, R. Artificial Intelligence Analysis of the Gene Expression of Follicular Lymphoma Predicted the Overall Survival and Correlated with the Immune Microenvironment Response Signatures. Mach. Learn. Knowl. Extr. 2020, 2, 35. [Google Scholar] [CrossRef]
- Carreras, J.; Kikuti, Y.; Miyaoka, M.; Hiraiwa, S.; Tomita, S.; Ikoma, H.; Kondo, Y.; Ito, A.; Nakamura, N.; Hamoudi, R. A Combination of Multilayer Perceptron, Radial Basis Function Artificial Neural Networks and Machine Learning Image Segmentation for the Dimension Reduction and the Prognosis Assessment of Diffuse Large B-Cell Lymphoma. AI 2021, 2, 8. [Google Scholar] [CrossRef]
- Carreras, J.; Kikuti, Y.Y.; Miyaoka, M.; Hiraiwa, S.; Tomita, S.; Ikoma, H.; Kondo, Y.; Ito, A.; Shiraiwa, S.; Hamoudi, R.; et al. A Single Gene Expression Set Derived from Artificial Intelligence Predicted the Prognosis of Several Lymphoma Subtypes; and High Immunohistochemical Expression of TNFAIP8 Associated with Poor Prognosis in Diffuse Large B-Cell Lymphoma. AI 2020, 1, 23. [Google Scholar] [CrossRef]
- Carreras, J.; Kikuti, Y.; Miyaoka, M.; Roncador, G.; Garcia, J.; Hiraiwa, S.; Tomita, S.; Ikoma, H.; Kondo, Y.; Ito, A.; et al. Integrative Statistics, Machine Learning and Artificial Intelligence Neural Network Analysis Correlated CSF1R with the Prognosis of Diffuse Large B-Cell Lymphoma. Hemato 2021, 2, 11. [Google Scholar] [CrossRef]
- NanoString Technologies. 530 Fairview Ave N, S., WA 98109, USA. Immune Cell Type Gene Coverage. Available online: https://www.nanostring.com/products/ncounter-assays-panels/oncology/pancancer-immune-profiling/ (accessed on 7 September 2021).
- Intro to Machine Learning. Available online: https://www.kaggle.com/learn/intro-to-machine-learning (accessed on 7 September 2021).
- Global, I. What Is Artificial Neural Network (ANN). Available online: https://www.igi-global.com/dictionary/artificial-neural-network-ann/1518 (accessed on 7 September 2021).
- IBM Corporation. IBM SPSS Neural Networks. New Tools for Building Predictive Models; IBM: Armonk, NY, USA, 2011. [Google Scholar]
- IBM Corporation. Neural Networks; IBM: Armonk, NY, USA, 2021. [Google Scholar]
- Carreras, J.; Hamoudi, R. Artificial Neural Network Analysis of Gene Expression Data Predicted Non-Hodgkin Lymphoma Subtypes with High Accuracy. Mach. Learn. Knowl. Extr. 2021, 3, 36. [Google Scholar] [CrossRef]
- Carreras, J.; Hamoudi, R.; Nakamura, N. Artificial Intelligence Analysis of Gene Expression Data Predicted the Prognosis of Patients with Diffuse Large B-Cell Lymphoma. Tokai J. Exp. Clin. Med. 2020, 45, 37–48. [Google Scholar] [PubMed]
- Carreras, J.; Kikuti, Y.; Roncador, G.; Miyaoka, M.; Hiraiwa, S.; Tomita, S.; Ikoma, H.; Kondo, Y.; Ito, A.; Shiraiwa, S.; et al. High Expression of Caspase-8 Associated with Improved Survival in Diffuse Large B-Cell Lymphoma: Machine Learning and Artificial Neural Networks Analyses. BioMedInformatics 2021, 1, 3. [Google Scholar] [CrossRef]
- Holzinger, A.; Langs, G.; Denk, H.; Zatloukal, K.; Müller, H. Causability and explainability of artificial intelligence in medicine. Wiley Interdiscip. Rev. Data Min. Knowl. Discov. 2019, 9, e1312. [Google Scholar] [CrossRef] [Green Version]
- Gershman, S.J.; Horvitz, E.J.; Tenenbaum, J.B. Computational rationality: A converging paradigm for intelligence in brains, minds, and machines. Science 2015, 349, 273–278. [Google Scholar] [CrossRef] [PubMed]
- IBM Corporation. IBM SPSS Statistics Algorithms; IBM: Armonk, NY, USA, 2020; p. 1265. [Google Scholar]
- Carreras, J.; Kikuti, Y.Y.; Hiraiwa, S.; Miyaoka, M.; Tomita, S.; Ikoma, H.; Ito, A.; Kondo, Y.; Itoh, J.; Roncador, G.; et al. High PTX3 expression is associated with a poor prognosis in diffuse large B-cell lymphoma. Cancer Sci. 2021. [Google Scholar] [CrossRef]
- Fujisawa, M.; Matushima, M.; Carreras, J.; Hirabayashi, K.; Kikuti, Y.Y.; Ueda, T.; Kaneko, M.; Fujimoto, R.; Sano, M.; Teramura, E.; et al. Whole-genome copy number and immunohistochemical analyses on surgically resected intracholecystic papillary neoplasms. Pathol. Int. 2021. [Google Scholar] [CrossRef] [PubMed]
- Susanibar-Adaniya, S.; Barta, S.K. 2021 Update on Diffuse large B cell lymphoma: A review of current data and potential applications on risk stratification and management. Am. J. Hematol. 2021, 96, 617–629. [Google Scholar] [CrossRef] [PubMed]
- Baptista, M.J.; Tapia, G.; Morgades, M.; Muncunill, J.; Muñoz-Marmol, A.-M.; Montoto, S.; Gribben, J.G.; Calaminici, M.; Martinez, A.; Gonzalez-Farre, B.; et al. Using the Lymph2Cx assay for assessing cell-of-origin subtypes of HIV-related diffuse large B-cell lymphoma. Leuk. Lymphoma 2018, 60, 1087–1091. [Google Scholar] [CrossRef] [PubMed]
- Schmitz, R.; Wright, G.W.; Huang, D.W.; Johnson, C.A.; Phelan, J.D.; Wang, J.Q.; Roulland, S.; Kasbekar, M.; Young, R.M.; Shaffer, A.L.; et al. Genetics and Pathogenesis of Diffuse Large B-Cell Lymphoma. N. Engl. J. Med. 2018, 378, 1396–1407. [Google Scholar] [CrossRef]
- Buhrmester, V.; Munch, D.; Arens, M. Analysis of Explainers of Black Box Deep Neural Networks for Computer Vision: A Survey. Mach. Learn. Knowl. Extr. 2021, 3, 48. [Google Scholar] [CrossRef]
- Shi, J.; Zhao, Y.; Wang, K.; Shi, X.; Wang, Y.; Huang, H.; Zhuang, Y.; Cai, T.; Wang, F.; Shao, F. Cleavage of GSDMD by inflammatory caspases determines pyroptotic cell death. Nature 2015, 526, 660–665. [Google Scholar] [CrossRef] [PubMed]
- The UniProt Consortium. UniProt: The universal protein knowledgebase in 2021. Nucleic Acids Res. 2021, 49, D480–D489. [Google Scholar] [CrossRef] [PubMed]
- Huang, G.-Z.; Wu, Q.-Q.; Zheng, Z.-N.; Shao, T.-R.; Li, F.; Lu, X.-Y.; Ye, H.-Y.; Chen, G.-X.; Song, Y.-X.; Zeng, W.-S.; et al. Bioinformatics Analyses Indicate That Cathepsin G (CTSG) is a Potential Immune-Related Biomarker in Oral Squamous Cell Carcinoma (OSCC). OncoTargets Ther. 2021, 14, 1275–1289. [Google Scholar] [CrossRef] [PubMed]
- Alatrash, G.; Garber, H.R.; Zhang, M.; Sukhumalchandra, P.; Qiu, Y.; Jakher, H.; Perakis, A.A.; Becker, L.; Yoo, S.Y.; Dwyer, K.C.; et al. Cathepsin G is broadly expressed in acute myeloid leukemia and is an effective immunotherapeutic target. Leukemia 2016, 31, 234–237. [Google Scholar] [CrossRef] [Green Version]
- Miyaoka, M.; Kikuti, Y.Y.; Carreras, J.; Itou, A.; Ikoma, H.; Tomita, S.; Shiraiwa, S.; Ando, K.; Nakamura, N. AID is a poor prognostic marker of high-grade B-cell lymphoma with MYC and BCL2 and/or BCL6 rearrangements. Pathol. Int. 2021. [Google Scholar] [CrossRef]


| Dependent Variable | OS Outcome | Molecular Subtype (GCB, ABC, Unspecified) | Molecular Subtype (GCB, ABC+Unspecified) |
|---|---|---|---|
| Case processing | |||
| Training set | 72/105 (68.6%) | 77/104 (74.0%) | 76/104 (73.1%) |
| Testing set | 33/105 (31.4%) | 27/106 (26.0%) | 28/104 (26.9%) |
| Input layer | |||
| Covariates | 730 | 730 | 730 |
| Units | 730 | 730 | 730 |
| Rescaling | Standardized | Standardized | Standardized |
| Hidden Layer | |||
| Number | 1 | 1 | 1 |
| Units | 6 | 11 | 14 |
| Activation function | Hyperbolic tangent | Hyperbolic tangent | Hyperbolic tangent |
| Output layer | |||
| Num. Dependent variables | 1 | 1 | 1 |
| Units | 2 | 3 | 2 |
| Activation function | Softmax | Softmax | Softmax |
| Error function | Cross-entropy | Cross-entropy | Cross-entropy |
| Model summary | |||
| Training | |||
| Cross-entropy error | 27.884 | 5.061 | 0.594 |
| Incorrect predictions % | 15.3 | 1.3 | <0.0001 |
| Stopping rule used | 1 consecutive step(s) with no decrease in error | 1 consecutive step(s) with no decrease in error | 1 consecutive step(s) with no decrease in error |
| Training time | 00:01.4 | 00:01.1 | 00:00.6 |
| Testing | |||
| Cross-entropy error | 13.847 | 12.155 | 2.662 |
| Incorrect predictions % | 18.20 | 18.5 | 3.6 |
| Classification (% correct) | |||
| Training | 84.7 | 98.7 | 100 |
| Testing | 81.8 | 81.5 | 96.4 |
| Area under the curve | |||
| 0.898 (Alive) | 0.995 (GCB) | 1.0 (GCB) | |
| 0.898 (Dead) | 0.994 (ABC) | 1.0 (ABC+Unspecified) | |
| 0.989 (Unspecified) | |||
| Overall Survival Outcome | Molecular Subtype | |||||
|---|---|---|---|---|---|---|
| Dead/Alive | GCB/ABC/Unspecified | GCB/ABC+Unspecified | ||||
| Order | Gene | Normalized Importance | Gene | Normalized Importance | Gene | Normalized Importance |
| 1 | CD55 | 1.000 | ARG1 | 1.000 | CD37 | 1.000 |
| 2 | ARG1 | 0.982 | CTAG1B | 0.959 | STAT6 | 0.867 |
| 3 | SPANXB1 | 0.949 | CD55 | 0.950 | ATF2 | 0.830 |
| 4 | CTAG1B | 0.946 | IL22 | 0.915 | ROPN1 | 0.819 |
| 5 | IFNA8 | 0.853 | PRG2 | 0.903 | C4B | 0.814 |
| 6 | CASP1 | 0.851 | SSX1 | 0.895 | NOTCH1 | 0.805 |
| 7 | IL2 | 0.834 | JAK3 | 0.877 | CTAG1B | 0.797 |
| 8 | TNFSF12 | 0.819 | PPBP | 0.869 | ICAM3 | 0.796 |
| 9 | ANP32B | 0.795 | APP | 0.851 | CEACAM1 | 0.783 |
| 10 | CTSG | 0.784 | TAL1 | 0.839 | NOD2 | 0.773 |
| 11 | THY1 | 0.780 | IL4R | 0.831 | LAG3 | 0.773 |
| 12 | REL | 0.779 | F12 | 0.815 | GNLY | 0.767 |
| 13 | TLR2 | 0.775 | MAP2K2 | 0.810 | TP53 | 0.762 |
| 14 | C8A | 0.767 | MAP4K2 | 0.798 | CD46 | 0.755 |
| 15 | IL22 | 0.760 | MAPK14 | 0.797 | MAPK3 | 0.747 |
| 16 | TIRAP | 0.755 | A2M | 0.795 | TREM2 | 0.739 |
| 17 | CCL15 | 0.754 | LILRA4 | 0.791 | REL | 0.736 |
| 18 | NRP1 | 0.753 | MAPK1 | 0.789 | NUP107 | 0.722 |
| 19 | XCL2 | 0.750 | DMBT1 | 0.786 | IL17RB | 0.718 |
| 20 | MFGE8 | 0.749 | NT5E | 0.781 | SPACA3 | 0.714 |
| Gene | Beta | SE | Wald | Df | p | Hazard Risk | 95.0% CI for HR | |
|---|---|---|---|---|---|---|---|---|
| Lower | Upper | |||||||
| Step 1 | ||||||||
| CD55 | −0.06 | 0.29 | 0.04 | 1 | 0.851 | 0.9 | 0.5 | 1.7 |
| ARG1 | −0.54 | 0.22 | 6.00 | 1 | 0.014 | 0.6 | 0.4 | 0.9 |
| SPANXB1 | 0.28 | 0.24 | 1.34 | 1 | 0.246 | 1.3 | 0.8 | 2.1 |
| CTAG1B | −0.02 | 0.17 | 0.01 | 1 | 0.903 | 1.0 | 0.7 | 1.4 |
| IFNA8 | 0.47 | 0.26 | 3.22 | 1 | 0.073 | 1.6 | 1.0 | 2.7 |
| CASP1 | 1.42 | 0.37 | 14.51 | 1 | 0.000 | 4.1 | 2.0 | 8.6 |
| IL2 | −0.04 | 0.28 | 0.03 | 1 | 0.874 | 1.0 | 0.6 | 1.7 |
| TNFSF12 | −1.00 | 0.37 | 7.28 | 1 | 0.007 | 0.4 | 0.2 | 0.8 |
| ANP32B | 0.06 | 0.53 | 0.01 | 1 | 0.907 | 1.1 | 0.4 | 3.0 |
| CTSG | 0.45 | 0.14 | 10.11 | 1 | 0.001 | 1.6 | 1.2 | 2.1 |
| THY1 | 0.42 | 0.32 | 1.74 | 1 | 0.188 | 1.5 | 0.8 | 2.9 |
| REL | −0.32 | 0.25 | 1.60 | 1 | 0.205 | 0.7 | 0.4 | 1.2 |
| TLR2 | 0.51 | 0.29 | 3.13 | 1 | 0.077 | 1.7 | 0.9 | 2.9 |
| C8A | −0.18 | 0.33 | 0.29 | 1 | 0.593 | 0.8 | 0.4 | 1.6 |
| IL22 | −0.10 | 0.17 | 0.31 | 1 | 0.580 | 0.9 | 0.6 | 1.3 |
| TIRAP | −0.32 | 0.39 | 0.69 | 1 | 0.406 | 0.7 | 0.3 | 1.6 |
| CCL15 | −0.17 | 0.33 | 0.29 | 1 | 0.593 | 0.8 | 0.4 | 1.6 |
| NRP1 | −0.78 | 0.35 | 5.07 | 1 | 0.024 | 0.5 | 0.2 | 0.9 |
| XCL2 | −0.09 | 0.16 | 0.31 | 1 | 0.579 | 0.9 | 0.7 | 1.3 |
| MFGE8 | −0.04 | 0.30 | 0.02 | 1 | 0.888 | 1.0 | 0.5 | 1.7 |
| Step 14 (last) | ||||||||
| ARG1 | −0.46 | 0.19 | 5.84 | 1 | 0.016 | 0.6 | 0.4 | 0.9 |
| IFNA8 | 0.37 | 0.20 | 3.64 | 1 | 0.056 | 1.5 | 1.0 | 2.1 |
| CASP1 | 1.34 | 0.31 | 18.59 | 1 | 0.000 | 3.8 | 2.1 | 7.1 |
| TNFSF12 | −0.78 | 0.27 | 8.42 | 1 | 0.004 | 0.5 | 0.3 | 0.8 |
| CTSG | 0.37 | 0.13 | 8.00 | 1 | 0.005 | 1.4 | 1.1 | 1.9 |
| REL | −0.33 | 0.19 | 3.20 | 1 | 0.074 | 0.7 | 0.5 | 1.0 |
| NRP1 | −0.53 | 0.28 | 3.67 | 1 | 0.055 | 0.6 | 0.3 | 1.0 |
| Dependent Variable (Target Variable) | Model | Overall Accuracy (%) | Num. of Fields (Genes) |
|---|---|---|---|
| Overall survival outcome (Dead/Alive) | Logistic regression | 100 | 730 |
| Discriminant | 100 | 730 | |
| SVM | 100 | 730 | |
| CHAID tree | 97.1 | 10 | |
| C5 tree | 96.2 | 12 | |
| C&R tree | 86.7 | 36 | |
| Neural net. | 69.6 | 730 | |
| KNN algorithm | 60.9 | 730 | |
| Bayesian net. | 26.4 | 730 | |
| Molecular subtype (GCB/ABC/Unspecified) | Logistic regression | 100 | 730 |
| Discriminant | 100 | 730 | |
| SVM | 100 | 730 | |
| C5 tree | 96.2 | 7 | |
| CHAID tree | 96.2 | 8 | |
| Neural net. | 92.3 | 730 | |
| Quest | 75.9 | 12 | |
| C&R tree | 75 | 6 | |
| KNN algorithm | 71.2 | 730 | |
| Bayesian net. | 0.9 | 730 | |
| Molecular subtype (GCB/ABC+Unspecified) | Logistic regression | 100 | 730 |
| Discriminant | 100 | 730 | |
| SVM | 100 | 730 | |
| Neural net. | 99 | 730 | |
| CHAID tree | 99.1 | 6 | |
| C5 tree | 97.1 | 5 | |
| KNN algorithm | 84.6 | 730 | |
| Quest | 83.6 | 6 | |
| C&R tree | 50.9 | 730 | |
| Bayesian net. | 0 | 730 |
| Gene | Beta | SE | Wald | df | p | Odds Ratio (OR) | 95.0% CI for OR | |
|---|---|---|---|---|---|---|---|---|
| Lower | Upper | |||||||
| Step 1 | ||||||||
| CD37 | 1.59 | 0.52 | 9.41 | 1 | 0.002 | 4.9 | 1.8 | 13.4 |
| STAT6 | −2.50 | 0.93 | 7.20 | 1 | 0.007 | 0.1 | 0.0 | 0.5 |
| ATF2 | 0.02 | 1.27 | 0.00 | 1 | 0.990 | 1.0 | 0.1 | 12.2 |
| ROPN1 | 0.33 | 0.49 | 0.45 | 1 | 0.503 | 1.4 | 0.5 | 3.6 |
| C4B | −0.15 | 0.34 | 0.20 | 1 | 0.654 | 0.9 | 0.4 | 1.7 |
| NOTCH1 | −0.42 | 0.80 | 0.27 | 1 | 0.605 | 0.7 | 0.1 | 3.2 |
| CTAG1B | 0.46 | 0.62 | 0.56 | 1 | 0.453 | 1.6 | 0.5 | 5.3 |
| ICAM3 | 0.07 | 0.53 | 0.02 | 1 | 0.897 | 1.1 | 0.4 | 3.0 |
| CEACAM1 | 0.30 | 0.28 | 1.12 | 1 | 0.291 | 1.3 | 0.8 | 2.4 |
| NOD2 | −0.01 | 0.42 | 0.00 | 1 | 0.990 | 1.0 | 0.4 | 2.3 |
| LAG3 | 0.61 | 0.40 | 2.32 | 1 | 0.128 | 1.8 | 0.8 | 4.0 |
| GNLY | 0.78 | 0.34 | 5.35 | 1 | 0.021 | 2.2 | 1.1 | 4.2 |
| TP53 | −0.93 | 0.65 | 2.01 | 1 | 0.156 | 0.4 | 0.1 | 1.4 |
| CD46 | 1.04 | 0.65 | 2.57 | 1 | 0.109 | 2.8 | 0.8 | 10.1 |
| MAPK3 | −0.87 | 1.05 | 0.70 | 1 | 0.404 | 0.4 | 0.1 | 3.2 |
| TREM2 | −0.82 | 0.42 | 3.77 | 1 | 0.052 | 0.4 | 0.2 | 1.0 |
| REL | −0.96 | 0.55 | 3.10 | 1 | 0.079 | 0.4 | 0.1 | 1.1 |
| NUP107 | 0.59 | 1.03 | 0.33 | 1 | 0.568 | 1.8 | 0.2 | 13.7 |
| IL17RB | 0.31 | 0.19 | 2.70 | 1 | 0.100 | 1.4 | 0.9 | 2.0 |
| SPACA3 | −0.23 | 0.45 | 0.25 | 1 | 0.618 | 0.8 | 0.3 | 1.9 |
| Constant | 6.82 | 3.86 | 3.12 | 1 | 0.077 | 917.1 | ||
| Step 14 (last) | ||||||||
| CD37 | 1.05 | 0.37 | 8.17 | 1 | 0.004 | 2.9 | 1.4 | 5.9 |
| STAT6 | −1.96 | 0.75 | 6.76 | 1 | 0.009 | 0.1 | 0.0 | 0.6 |
| GNLY | 1.01 | 0.25 | 15.70 | 1 | 0.000 | 2.7 | 1.7 | 4.5 |
| CD46 | 0.78 | 0.46 | 2.86 | 1 | 0.091 | 2.2 | 0.9 | 5.4 |
| TREM2 | −0.55 | 0.33 | 2.76 | 1 | 0.097 | 0.6 | 0.3 | 1.1 |
| REL | −1.13 | 0.49 | 5.28 | 1 | 0.022 | 0.3 | 0.1 | 0.8 |
| IL17RB | 0.38 | 0.15 | 6.35 | 1 | 0.012 | 1.5 | 1.1 | 2.0 |
| Constant | 4.67 | 2.53 | 3.41 | 1 | 0.065 | 107.0 | ||
Publisher’s Note: MDPI stays neutral with regard to jurisdictional claims in published maps and institutional affiliations. |
© 2021 by the authors. Licensee MDPI, Basel, Switzerland. This article is an open access article distributed under the terms and conditions of the Creative Commons Attribution (CC BY) license (https://creativecommons.org/licenses/by/4.0/).
Share and Cite
Carreras, J.; Hiraiwa, S.; Kikuti, Y.Y.; Miyaoka, M.; Tomita, S.; Ikoma, H.; Ito, A.; Kondo, Y.; Roncador, G.; Garcia, J.F.; et al. Artificial Neural Networks Predicted the Overall Survival and Molecular Subtypes of Diffuse Large B-Cell Lymphoma Using a Pancancer Immune-Oncology Panel. Cancers 2021, 13, 6384. https://doi.org/10.3390/cancers13246384
Carreras J, Hiraiwa S, Kikuti YY, Miyaoka M, Tomita S, Ikoma H, Ito A, Kondo Y, Roncador G, Garcia JF, et al. Artificial Neural Networks Predicted the Overall Survival and Molecular Subtypes of Diffuse Large B-Cell Lymphoma Using a Pancancer Immune-Oncology Panel. Cancers. 2021; 13(24):6384. https://doi.org/10.3390/cancers13246384
Chicago/Turabian StyleCarreras, Joaquim, Shinichiro Hiraiwa, Yara Yukie Kikuti, Masashi Miyaoka, Sakura Tomita, Haruka Ikoma, Atsushi Ito, Yusuke Kondo, Giovanna Roncador, Juan F. Garcia, and et al. 2021. "Artificial Neural Networks Predicted the Overall Survival and Molecular Subtypes of Diffuse Large B-Cell Lymphoma Using a Pancancer Immune-Oncology Panel" Cancers 13, no. 24: 6384. https://doi.org/10.3390/cancers13246384
APA StyleCarreras, J., Hiraiwa, S., Kikuti, Y. Y., Miyaoka, M., Tomita, S., Ikoma, H., Ito, A., Kondo, Y., Roncador, G., Garcia, J. F., Ando, K., Hamoudi, R., & Nakamura, N. (2021). Artificial Neural Networks Predicted the Overall Survival and Molecular Subtypes of Diffuse Large B-Cell Lymphoma Using a Pancancer Immune-Oncology Panel. Cancers, 13(24), 6384. https://doi.org/10.3390/cancers13246384