Article

Identification of Genetic Variants Associated with Sex-Specific Lung-Cancer Risk

Harry Perkins Institute of Medical Research, QEII Medical Centre and Centre for Medical Research, The University of Western Australia, 6 Verdun Street, Nedlands, Perth, WA 6009, Australia
*
Author to whom correspondence should be addressed.
Cancers 2021, 13(24), 6379; https://doi.org/10.3390/cancers13246379
Submission received: 15 October 2021 / Revised: 26 November 2021 / Accepted: 29 November 2021 / Published: 20 December 2021
(This article belongs to the Special Issue Bioinformatics, Big Data and Cancer)

Abstract

:

Simple Summary

The incidence of lung cancer differs between men and women, suggesting the potential role of sex-specific influences in susceptibility to this cancer. While behavioural differences, such as smoking rates, may account for much of the risk, another possibility is that X chromosome susceptibility genes may have an effect. Therefore, in this study, we tested specifically for the influence of X chromosome single-nucleotide polymorphisms (SNPs) in male lung cancer cases, and found 24 that were significantly associated with male, but not female, lung cancer cases. Examining these in detail, we observed these SNPs resided in blocks near the annotated genes DMD, PTCHD1-AS, and AL008633.1. We also observed that DMD was differentially expressed in lung cancer subtypes curated in the Cancer Genome Atlas database. Examining this gene further, we found that expression and mutation of DMD may have effects on immune function. This work defines potential targets for sex-specific lung cancer prevention.

Abstract

Background: The incidence of lung cancer differs between men and women, suggesting the potential role of sex-specific influences in susceptibility to this cancer. While behavioural differences may account for some of the risk, another possibility is that X chromosome susceptibility genes may have an effect. Little is known about genetic variants on the X chromosome that contribute to sex-specific lung-cancer risk, so we investigated this in a previously characterized cohort. Methods: We conducted a genetic association reanalysis of 518 lung cancer patients and 844 controls to test for lung cancer susceptibility variants on the X chromosome. Annotated gene expression, co-expression analysis, pathway, and immune infiltration analyses were also performed. Results: 24 SNPs were identified as significantly associated with male, but not female, lung cancer cases. These resided in blocks near the annotated genes DMD, PTCHD1-AS, and AL008633.1. Of these, DMD was differentially expressed in lung cancer cases curated in The Cancer Genome Atlas. A functional enrichment and a KEGG pathway analysis of co-expressed genes revealed that differences in immune function could play a role in sex-specific susceptibility. Conclusions: Our analyses identified potential genetic variants associated with sex-specific lung cancer risk. Integrating GWAS and RNA-sequencing data revealed potential targets for lung cancer prevention.

Graphical Abstract

1. Introduction

Consecutive epidemiological studies have found that the estimated new lung and bronchus case rate is higher in males than in females [1,2,3], suggesting that gender differences contribute to the incidence of lung cancer. Tobacco is a carcinogen that increases the risk of lung cancer. However, it is controversial whether the difference in lung cancer susceptibility in smokers is greater in women than in men compared with non-smokers [4,5]. Beyond smoking exposure, we hypothesized there could be a genetic effect on increased susceptibility in men. Many lung cancer susceptibility loci have been identified by genome-wide association studies (GWAS) [6]. X-linked genetic variants could affect susceptibility in males, but none of the reported SNPs were X-linked, because such associations were not specifically tested. Cancer sex disparity at the molecular level has been reported from somatic mutations in the TCGA database [7] and some studies proposed this disparity was associated with genes on the X chromosome [8,9]. However, these studies did not analyse germline variants, nor did they examine the sexes separately nor focused on somatic mutation, so did not consider the contribution of inherited X chromosome SNPs to gender differences in lung cancer.
Gender differences in susceptibility to various other types of cancer have been reported. A sex-stratified analysis of brain cancer GWAS data indicated that rs11979158 (7p11.2) was only associated with glioma in males [10]. In nasopharyngeal carcinoma, different genetic effects on males and females were revealed by studying susceptibility loci on the X chromosome [11]. Association analysis between genetic variants with obesity or colorectal cancer revealed that variants in the (autosomal) leptin gene harboured sex-specific associations with CRC risk [12]. Therefore, a deeper insight into lung cancer X chromosome SNPs could provide a better understanding of the genetic basis of sex predisposition difference. In this study, we performed an association analysis to test whether significant X chromosome SNPs were associated with lung cancer in men but not in women.

2. Materials and Methods

2.1. Data Accession and Categorization

The GWAS dataset in this analysis was downloaded with appropriate approvals from the dbGaP database (phs000093.v2. p2). A total of 513 lung cancer cases and 834 controls were retrieved based on phenotype document. The samples were subgrouped based on gender, resulting in 54 male SCLC cases, 27 female SCLC cases, 259 male NSCLC cases, and 173 female NSCLC cases. The age and family history groups in the 313 male lung cancer patients were defined based on the phenotype files in the dbGAP data set. We defined “younger age” as 64 or less (code 0–1) and “older age” as 65 or more (code 2–3). Twenty male patients had an incomplete family history, so only 293 patients were included for analysis of peak SNPs by family history. The genetic data were imputed by the fcGENE [13]. As part of our quality control procedure, we excluded samples and SNPs based on the following criteria: a. any SNP that had >5% heterozygous genotypes in all male samples; b. any male sample with >5% heterozygosity across all SNPs; c. SNPs in the pseudo-autosomal region (PAR) were removed; d. any designated female samples that were homozygous for >90% of the SNPs.
A list of pathogenic DMD SNPs was accessed from the Catalogue of Somatic Mutations in Cancer (COSMIC, https://cancer.sanger.ac.uk/cosmic) (accessed on 4 March 2021) and the Single Nucleotide Polymorphism Databases (dbSNP, https://www.ncbi.nlm.nih.gov/snp/) (accessed on 12 March 2021).

2.2. Association Analysis

The case against control association test on each subgroup, linkage disequilibrium (LD) analysis, haplotype analysis, and SNP annotation were conducted using Plink v1.07 with default settings. All significant SNPs were annotated using information from dbSNP (GRCh38.p12, https://www.ncbi.nlm.nih.gov/snp/) (accessed on 12 March 2021). Population-specific haplotype frequencies were analysed and visualized by LDhap (https://ldlink.nci.nih.gov/?tab=ldhap) (accessed on 25 April 2021) with reference to the “British in England and Scotland” and “Utah residents from North and West Europe” datasets.

2.3. Bioinformatics Analysis for DMD Expression and Mutation

We analysed the expression level of the DMD gene with associated clinicopathological features and obtained co-expressed genes in lung adenocarcinoma and squamous cell carcinoma of the lung by the UALCAN online tool (http://ualcan.path.uab.edu/index.html) (accessed on 25 February 2021) [14], visualizing by GEPIA2 (http://gepia2.cancer-pku.cn/#index) (accessed on 25 February 2021). [15]. The gene mutation profile data were analysed using the cBioportal (https://www.cbioportal.org/) (accessed on 25 February 2021). Survival data from microarray studies were accessed from PrognoScan (http://dna00.bio.kyutech.ac.jp/PrognoScan/index.html) (accessed on 26 February 2021). The relationship between immune infiltration and DMD mutations was analysed using TIMER2.0 (http://timer.cistrome.org/) (accessed on 25 February 2021).

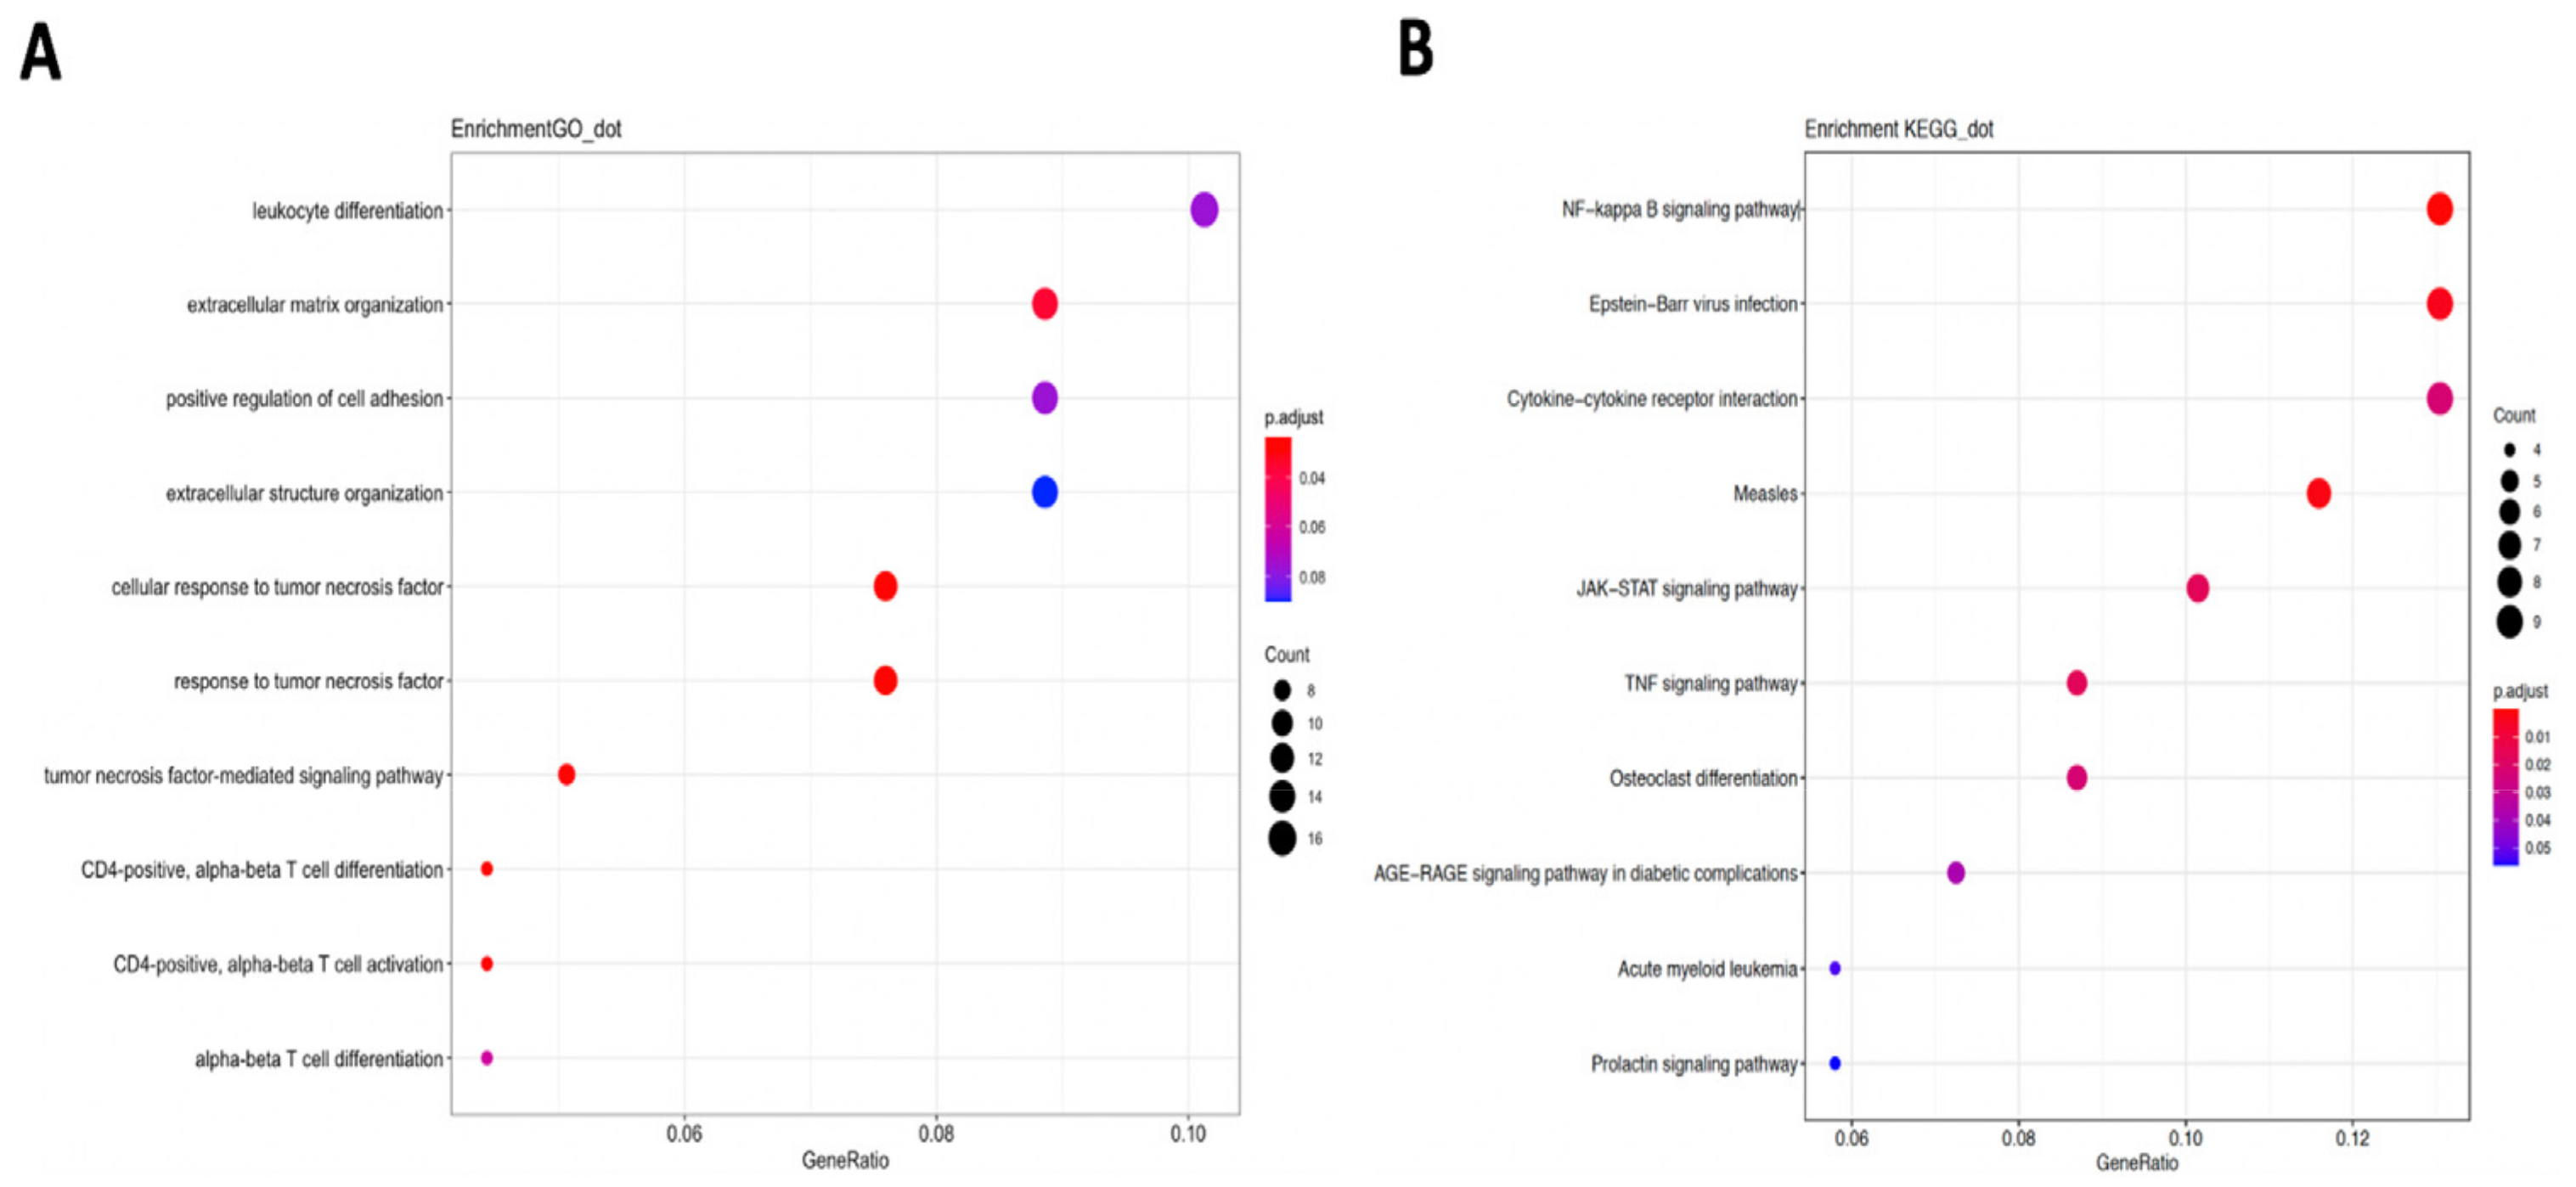
2.4. GO/KEGG Pathway Enrichment Analysis

We applied the clusterProfiler package in R for the gene cluster analysis [16]. The unified positively co-expressed genes of DMD from both LUAD and LUSC were used for the Kyoto Encyclopedia of Genes and Genomes (KEGG) Gene Ontology (GO) enrichment analysis, including biological process (BP), cellular components (CC), and molecular function (MF). p-values < 0.05 were considered to indicate significantly enriched pathways.

2.5. Statistical Analysis

Fisher’s exact test was performed to calculate the significance of SNP genotype associations; the Kaplan–Meier method was used to estimate the impact of gene expression on survival; and P-values less than 0.05 were considered as statistically significant, except for GWAS SNP association, in which case, correction was made for testing of all the X chromosome SNPs.

3. Results

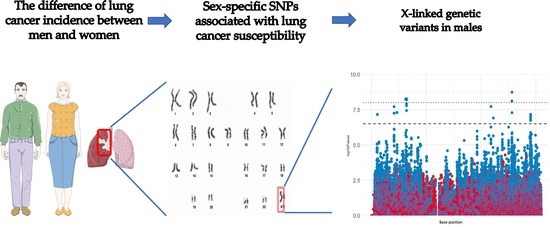
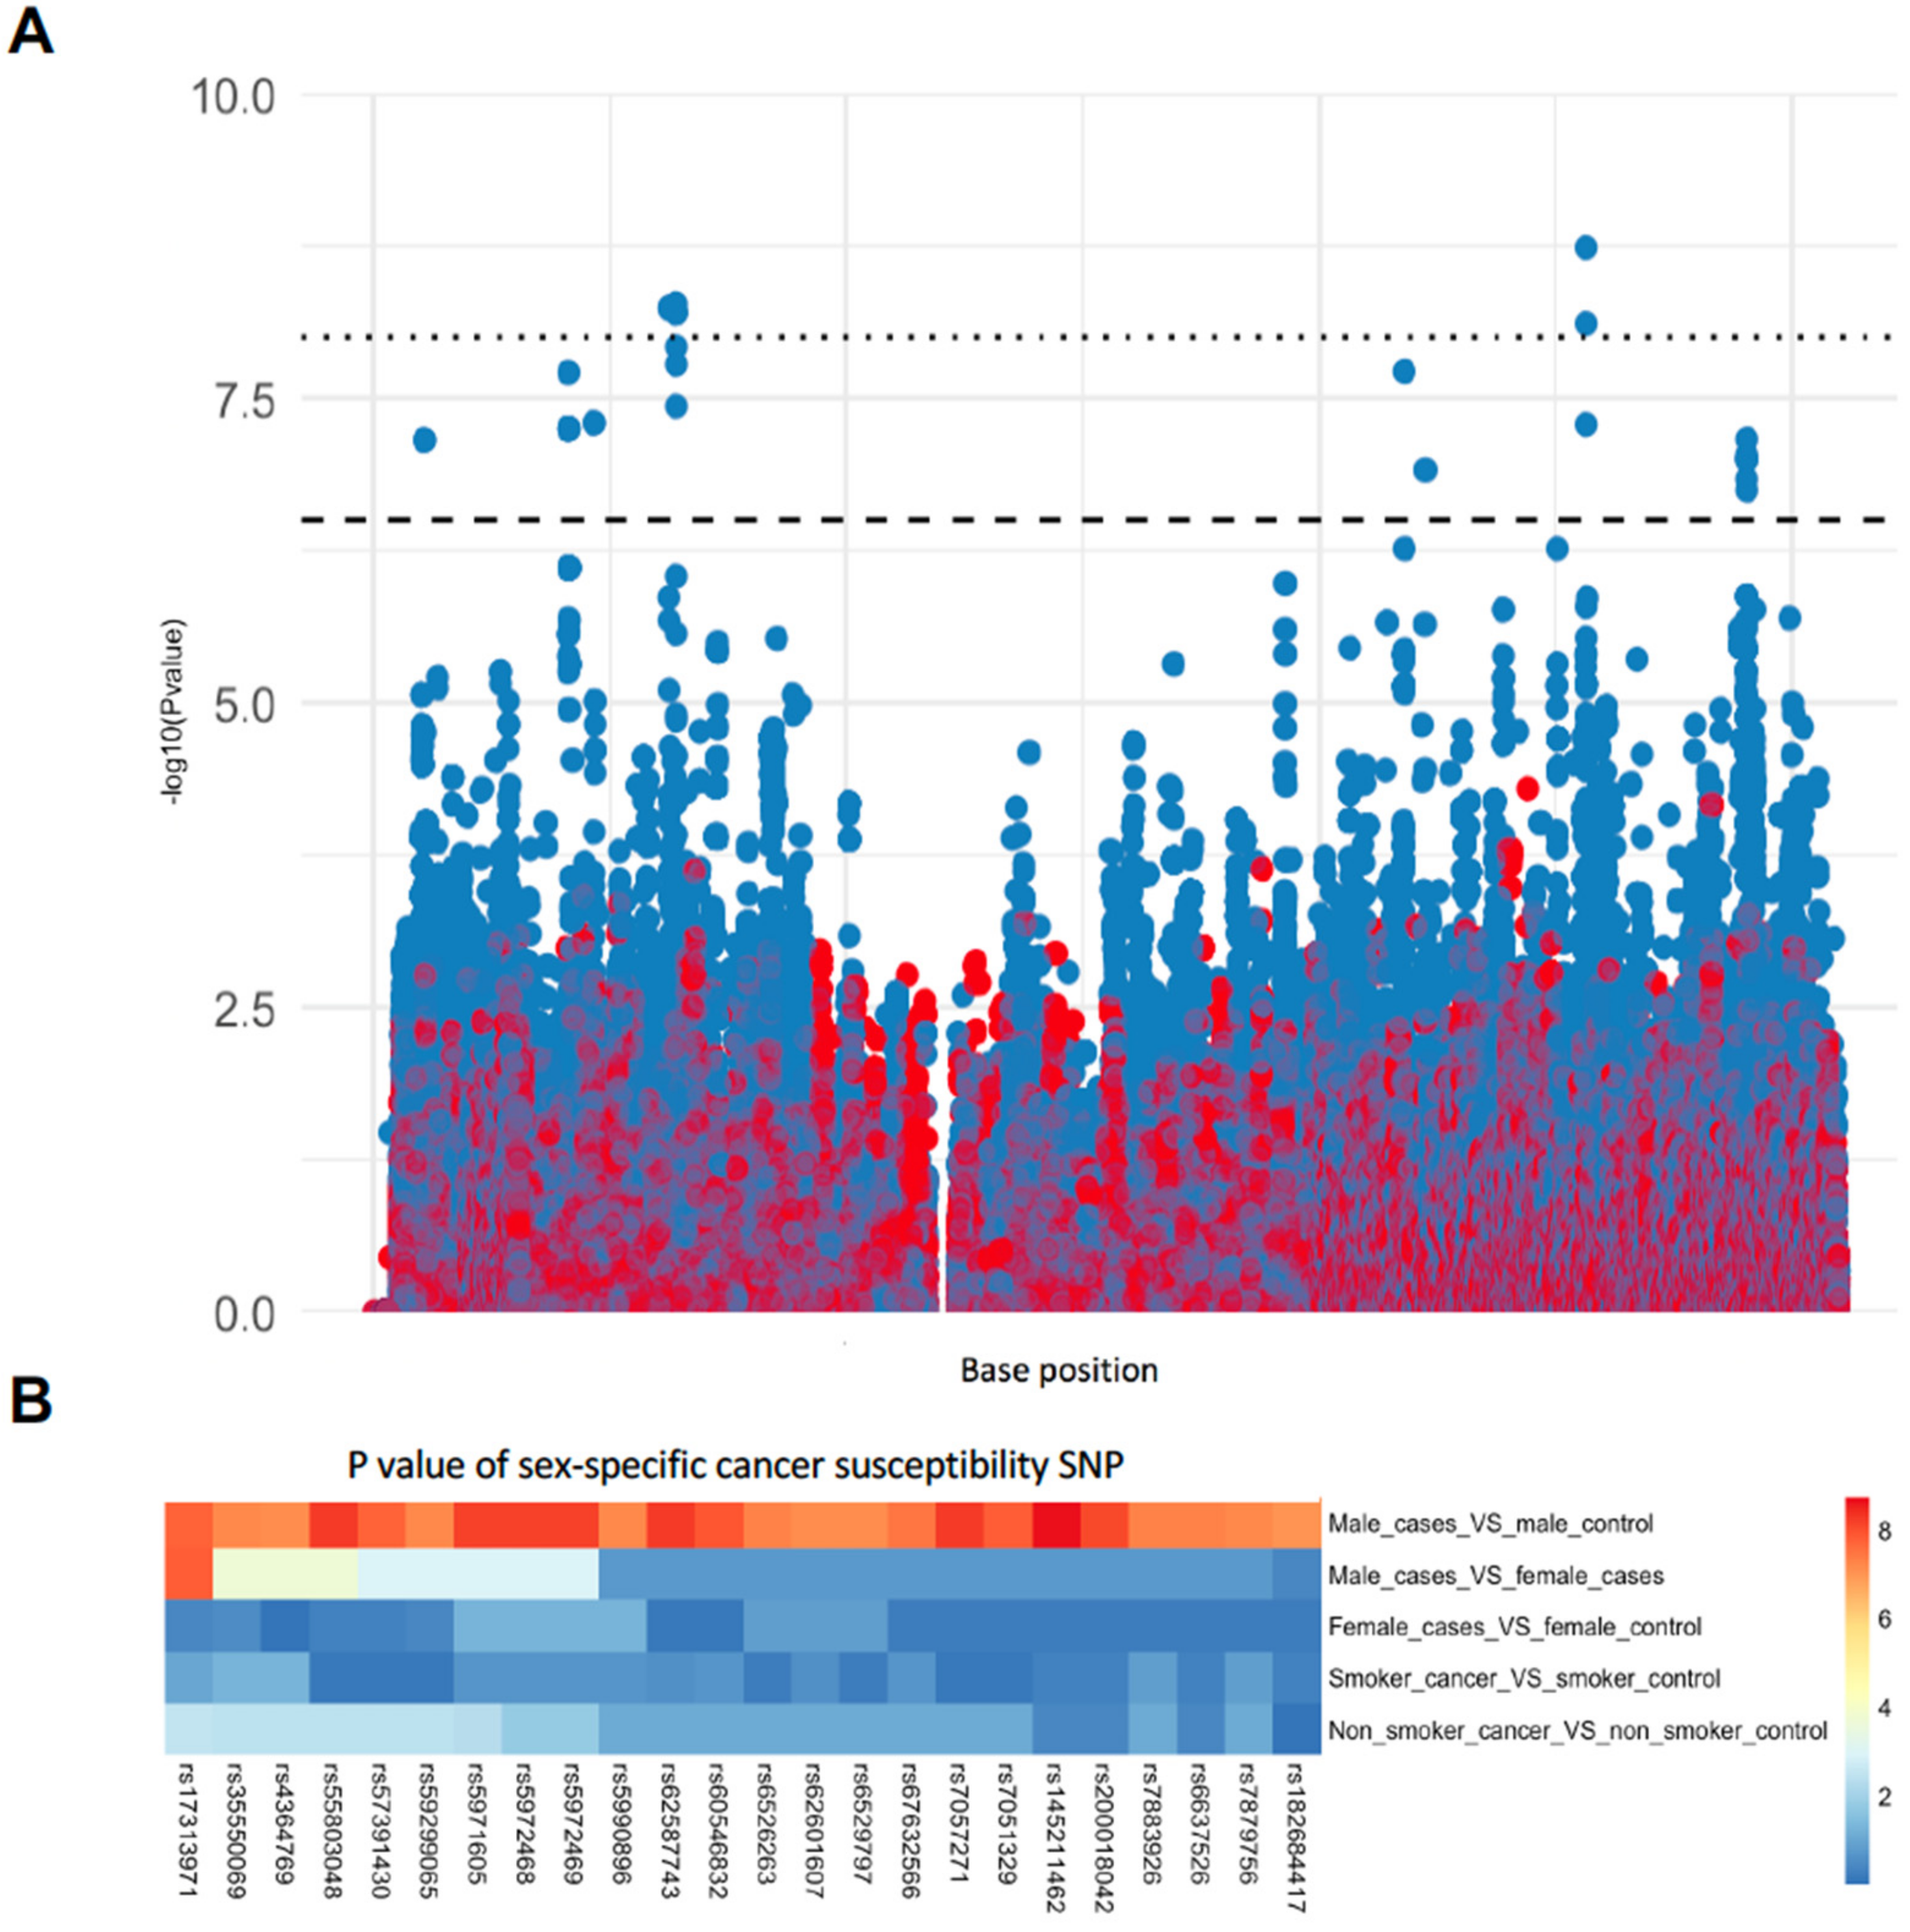
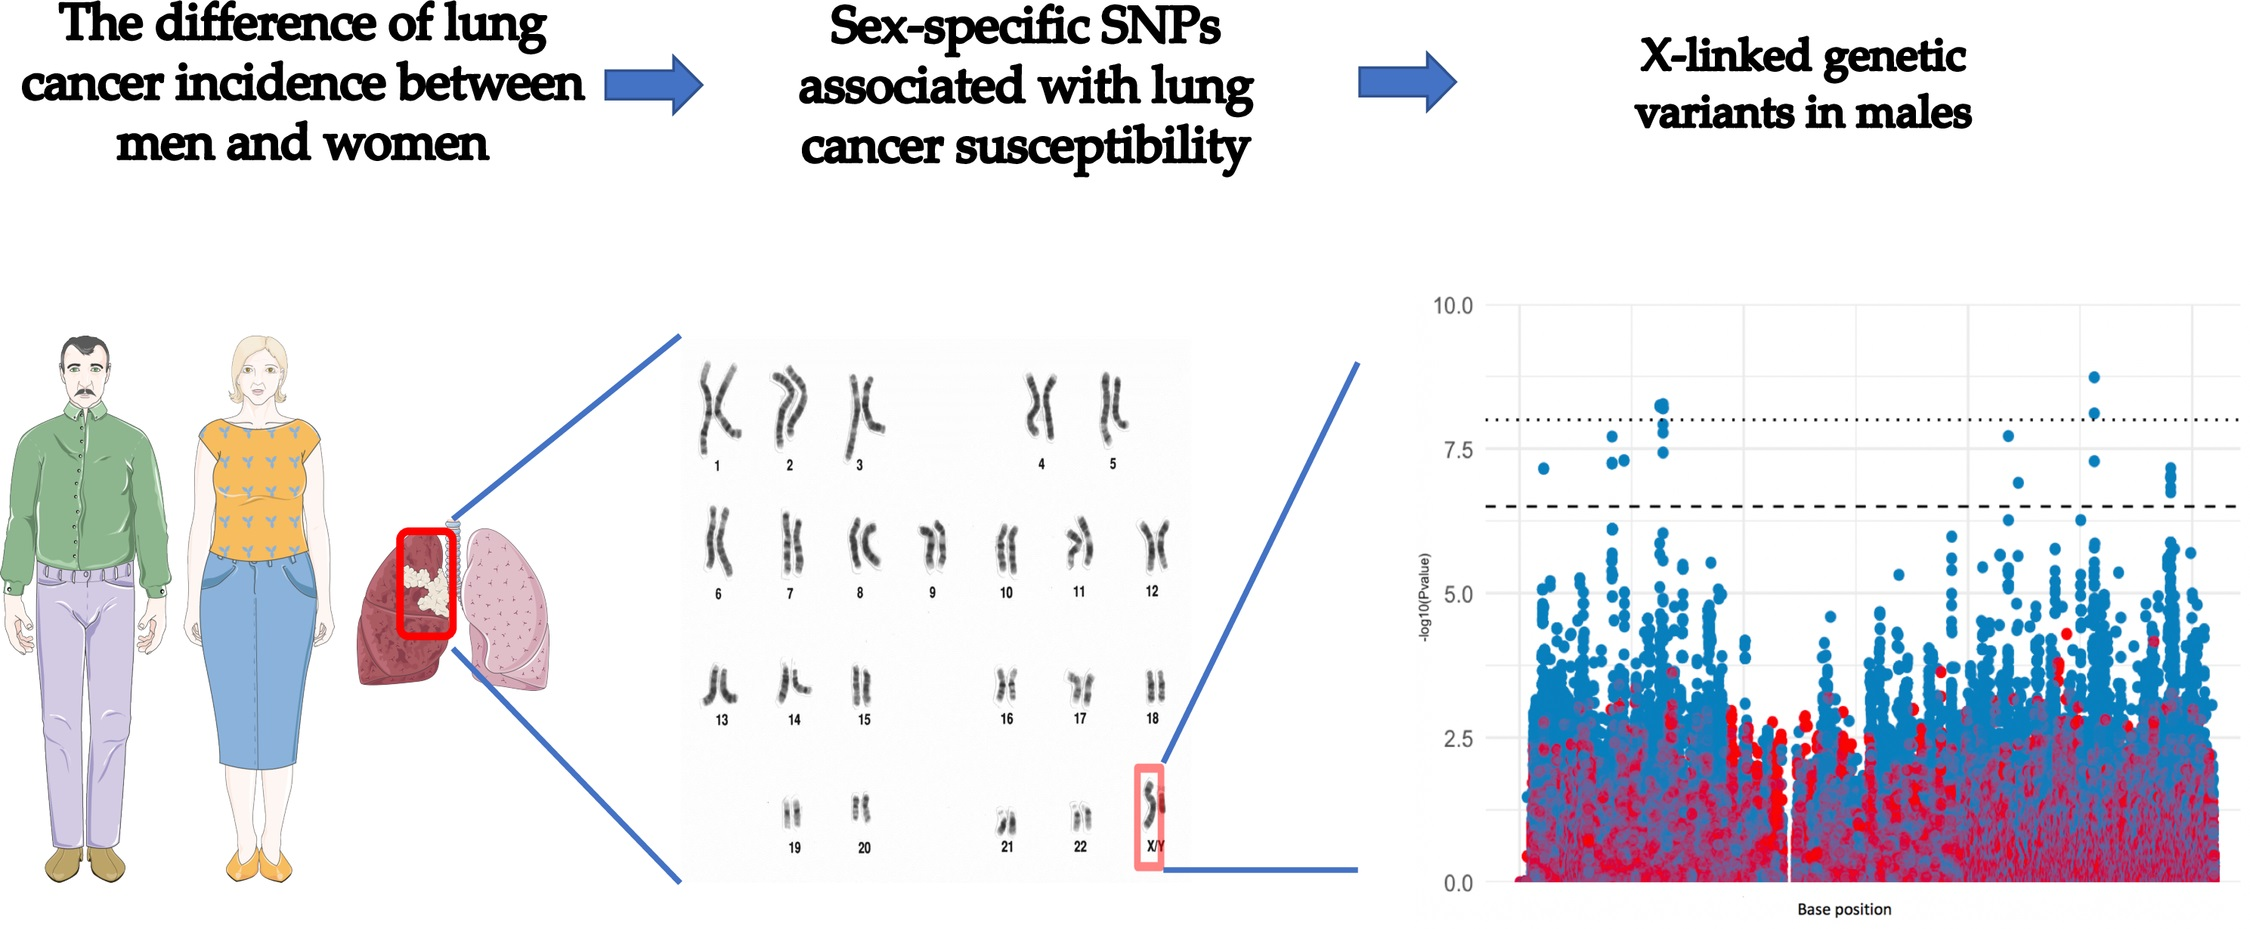
3.1. Identification of Sex-Specific SNPs Associated with Lung Cancer Susceptibility

To find potential X chromosome lung cancer susceptibility genes, we compared male lung cancer cases with male controls using data from a previously characterised cohort derived from the Environment and Genetics in Lung Cancer Etiology Study (EAGLE) [17] and the Prostate, Lung, Colon and Ovary Study (PLCO) [18] Cancer Screening Trial. Access to these data was approved via dbGAP (phs000093.v2.p2). We identified a total of 24 significantly associated SNPs (Figure 1A and Table 1); all of these were outside the pseudo-autonomous (PAR) region. The genotypes of the most strongly associated SNPs that were over-represented in male lung cancer cases were the C alleles of rs145211462 and rs62587743, suggesting that the alleles of these SNPs contributed significantly to lung cancer susceptibility in males (Fisher’s Exact Test, Table 2). The genes that are located nearest to these SNPs are AL008633.1 and DMD.
We tested whether the peak SNPs were associated with cancer in females. As shown in Figure 1A, there were no significantly associated SNPs considering only female cases versus female controls. Since X chromosome SNPs are obligatory homozygote in males, we also considered homozygosity at these SNPs in females by excluding heterozygotes from the analyses. As shown in Table 3, there was no significant difference in females who were homozygous for the SNP alleles (Fisher’s Exact Test), suggesting that the alleles of these SNPs contributed specifically to susceptibility only in males. This does not exclude potential gene dosage effects. Next, we compared the p values of the 24 significant SNPs in males to other groups, including male lung cancer versus female lung cancer, smokers with lung cancer cases versus smokers without lung cancer, and non-smokers with lung cancer cases versus non-smokers without lung cancer. As shown in Figure 1B, the identified SNPs that contributed specifically to lung cancer susceptibility in males were not associated with smoking behaviour, which is a known cancer predisposition risk. Since males inherit X-linked alleles from their mothers, we reasoned that the X-linked male lung cancer risk SNPs would not be associated with disease in men with a family history of lung cancer. This was found to be the case (Table S1). We also asked whether these SNPs were associated with a later age of cancer onset. Some of the identified SNPs were weakly associated with a later age of diagnosis (Table 4), but these results should be confirmed in a larger cohort. Together, these results further supported the argument that X-linked cancer susceptibility genes contribute to lung cancer in males, regardless of smoking status and family history of lung cancer.

3.2. Interactions between X Chromosome SNPs in Male Lung Cancer Risk

Next, we performed a haplotype-trait association analysis on pairs of SNPs from each peak. Significant associations between SNPs in different peaks were found, suggesting that these SNPs defined chromosome regions that were associated with male-specific lung cancer susceptibility. SNP–SNP interaction analyses of the genotypes in the peak SNPs was performed. Based on the results of the Chi-squared test of the risk alleles of these SNPs, we observed that some of the risk alleles may have an additive effect on lung cancer risk. The odds of these risk alleles to lung cancer risk were compared between men and women. In two-by-two combination analysis, the risk allele combinations that were significant for male cancer were not detected in female cases (Table 5). Similarly, most three-by-three risk allele combinations contributing to the risk of male lung cancer were not found in female lung cancer cases (Table 6). This further supports the notion that the X-linked SNPs were associated with the risk of lung cancer in males.

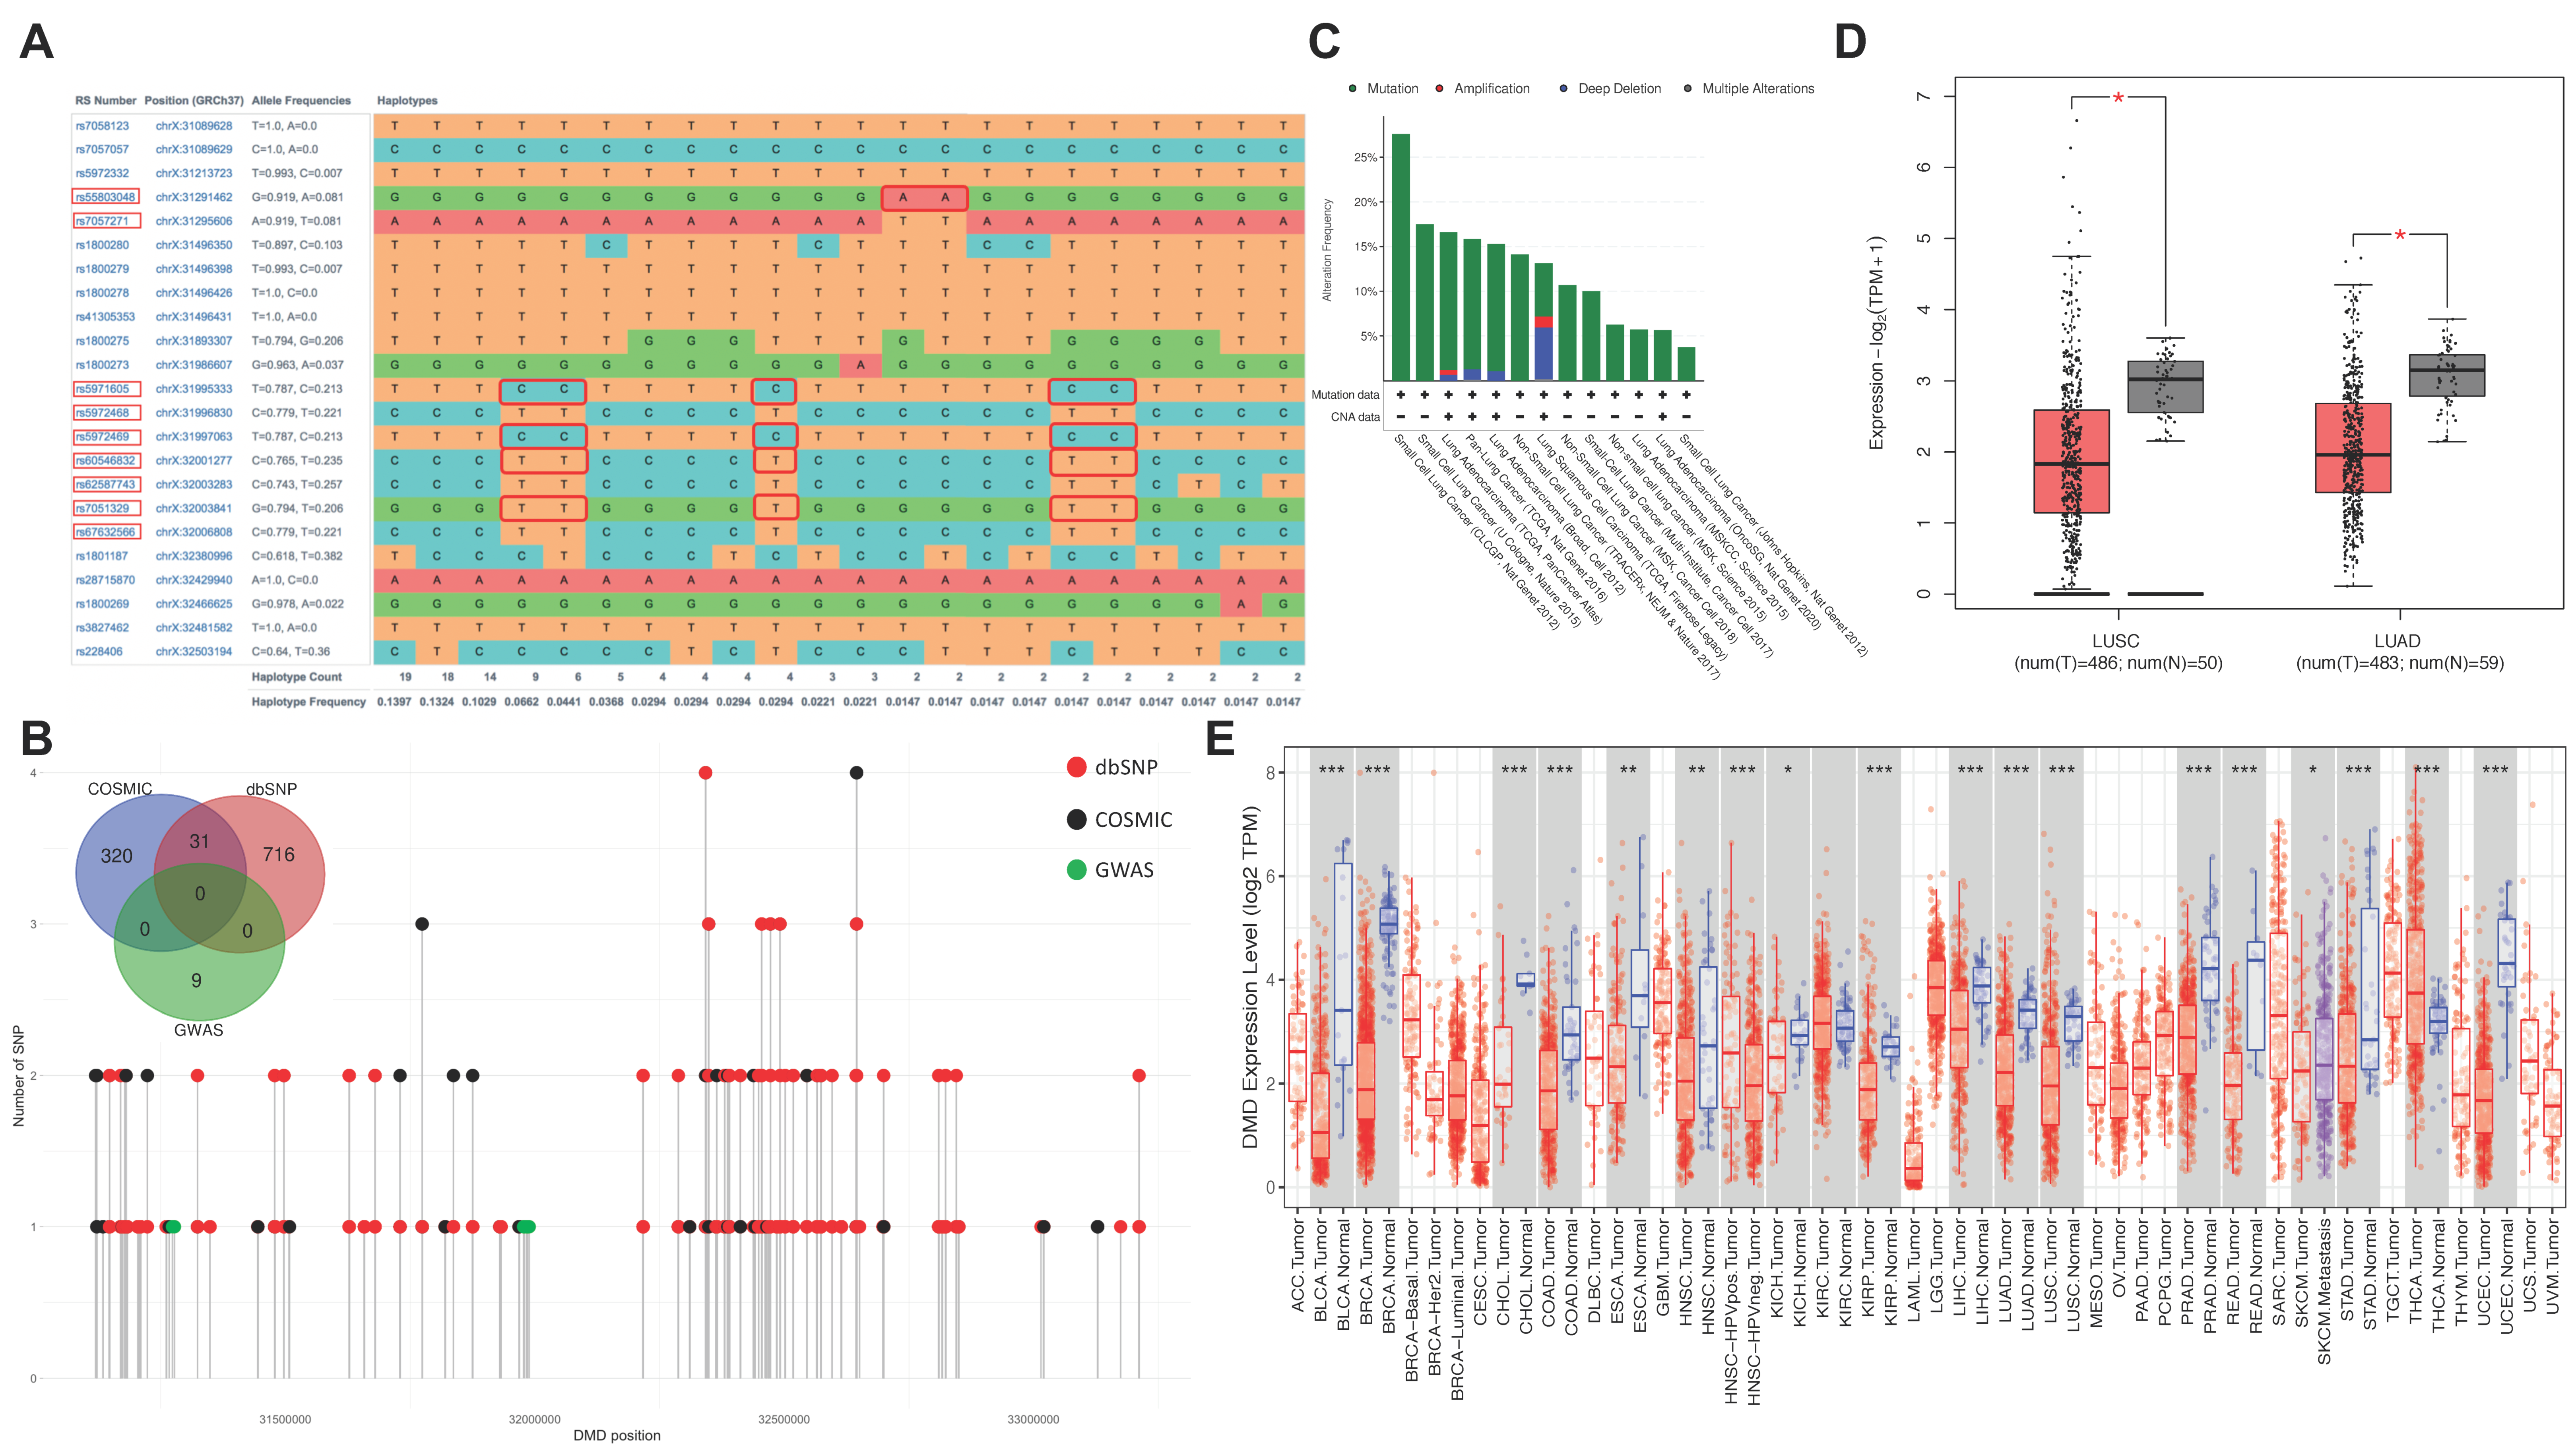
3.3. Effect of Sex-Specific Lung Cancer Risk SNPs on DMD Expression

The gene with the most annotated SNPs in this study was DMD, a very large gene that encodes the muscle protein, dystrophin. However, PTCHD1-AS and AL008633.1, the other two genes closely associated SNPs, were either not detected or not included in the relevant databases. Therefore, we focused on investigating the potential effect of DMD expression on lung cancer. We observed a haplotype pattern in these SNPs (Figure 2A), and their genomic position was close to SNPs identified as pathogenic in cancer and Duchenne muscular dystrophy (Figure 2B). The mutation profile in exons of the DMD gene in 3163 lung cancer samples was analysed in data from the cBioPortal for Cancer Genomics. A total of 14% of samples harboured DMD mutations, ranging from 3.75% to 27.59% in different cohorts (Figure 2C).
We next checked the gene expression of DMD in the TCGA—Lung adenocarcinoma (LUAD) and TCGA—Lung squamous cell carcinoma (LUSC) cohorts. The results showed that the mRNA expression levels of DMD were significantly decreased in the lung cancer tissues compared with the control tissues (Figure 2D). The differential expression of DMD between pan-cancer and corresponding control tissues was also investigated (Figure 2E), revealing that 55% (18 out of 33) of cancer types had abnormal DMD expression.
The impact of DMD on lung cancer survival was investigated, but its expression was not associated with either overall or disease-free survival in the lung cancer cohorts studied (Figure S1). We further analysed the effect of the differential expression of DMD on 1424 lung cancer patients in 13 microarray datasets (Table 7). We identified that DMD expression was associated with lung cancer survival in 4 out of 13 unified cohorts (30%), in which gene probes of different microarrays, such as 203881_s_at (GSE31210, p = 0.00004, relapse free survival of adenocarcinoma), A_24_P185854 (GSE13213, p = 0.00047, overall survival of adenocarcinoma), 203881_s_at (GSE31210, p = 0.00199061, overall survival of adenocarcinoma), 207660_at (GSE31210, p = 0.00427137, relapse-free survival of adenocarcinoma), 203881_s_at (jacob-00182-UM, p = 0.0116482, overall survival of adenocarcinoma), 234752_x_at (GSE8894,p= 0.0379615, and relapse-free survival of non-small cell lung cancer). This result suggested that DMD expression may play a minor role in lung cancer survival.
Genes that were co-expressed with DMD were identified by UALCAN online analysis [14]. A total of 5 genes in the TCGA-LUAD dataset and 180 genes in the TCGA-LUSC dataset with Spearman correlation coefficients greater than or equal to 0.4 were retrieved. No gene in either dataset was negatively co-expressed with DMD (with Pearson correlation coefficient <−0.3). We merged the positively co-expressed genes and performed in-silico analyses to explore the effects of expression DMD affected by X chromosome susceptibility SNPs in NSCLC. The enriched GO pathways for the co-expressed genes with DMD included “extracellular matrix organization” and “response to tumor necrosis factor” (Figure 3A), while the KEGG analysis implicated the NF−kappa B signaling pathway (Figure 3B).

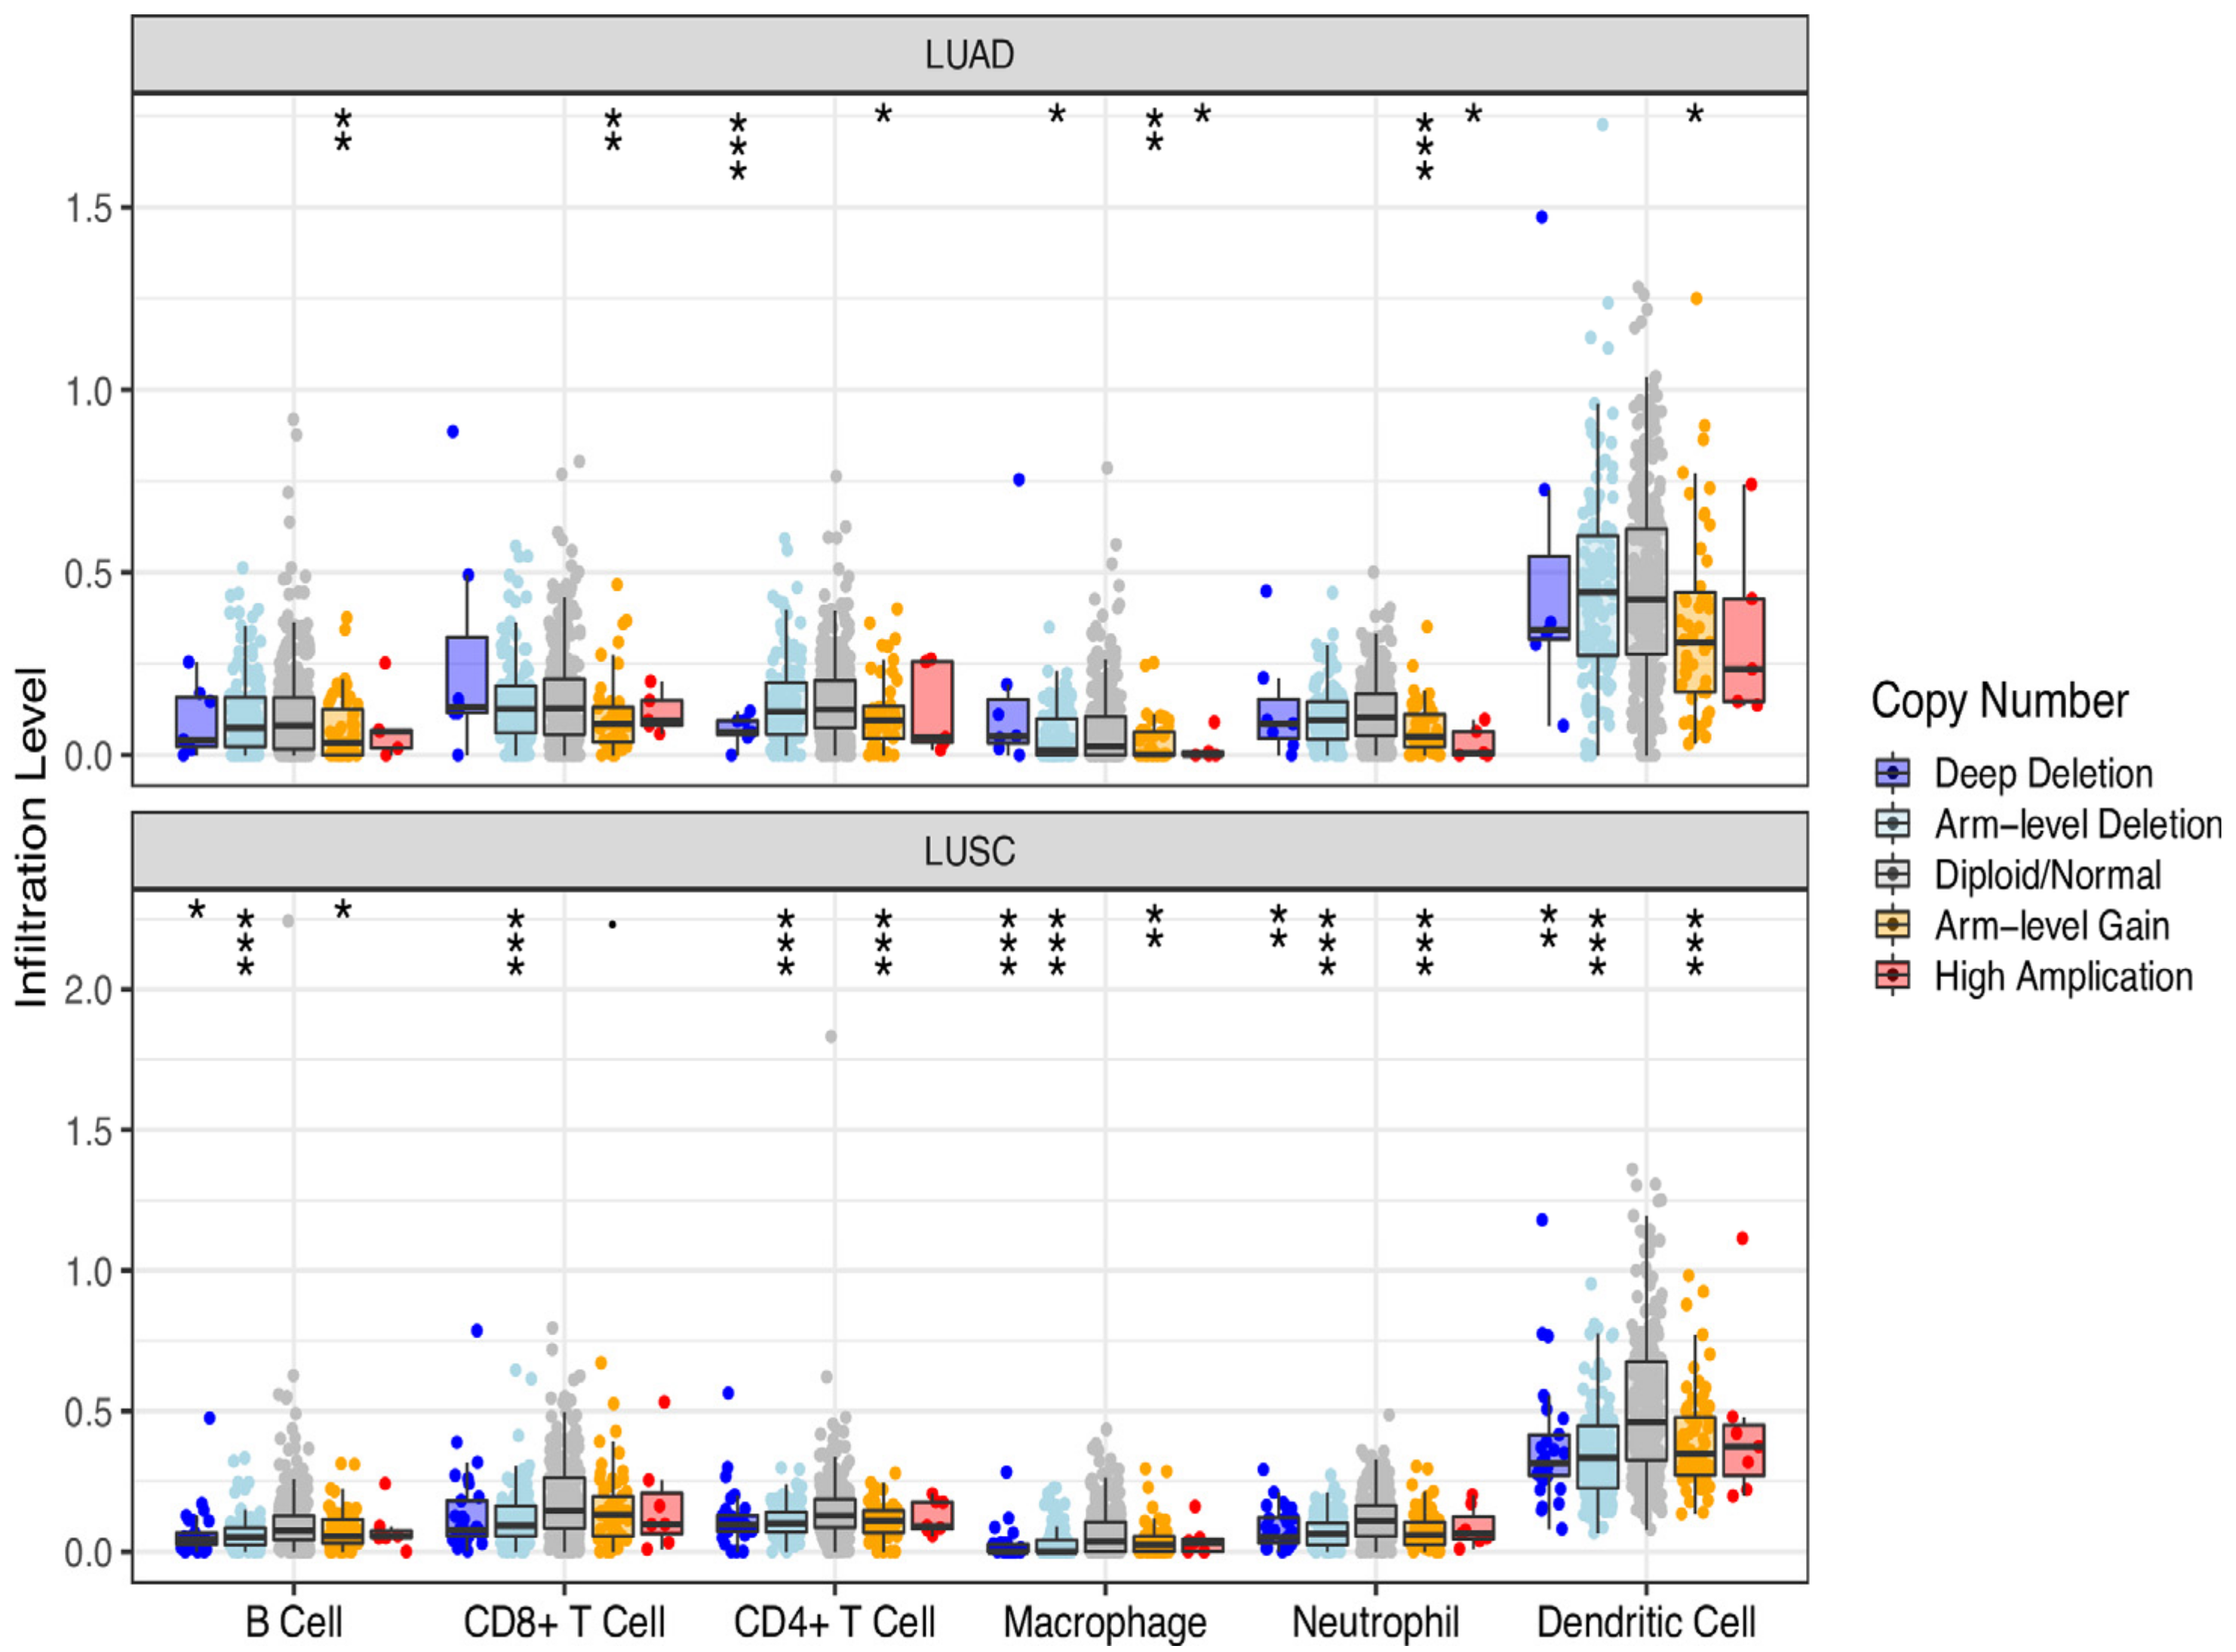
3.4. DMD Could Affect CD4+ T Cell Infiltration in LUSC

Copy number variation (CNV) has been observed in many studies to participate in the occurrence and development of cancer, and the number and complexity of CNVs are associated with the prognosis of many cancer types. Somatic copy-number alterations (SCNAs) affect a larger fraction of the genome, which can potentially activate an oncogene or inactivate a tumor suppressor gene. SCNAs can be further divided into focal SCNAs (shorter than one chromosome arm) and arm-level SCNAs (chromosome-arm length or longer) [19,20]. The SCNA subtypes, including deep deletion, arm-level deletion, diploid/normal, arm-level gain, and high amplification, can be defined by GISTIC 2.0 [20]. Studies of the correlation of gene mutation with immune infiltration levels in cancer facilitated the understanding of the interaction between malignant cells and the host immune system [21]. Therefore, we investigated the correlation of SCNA and tumor infiltration levels in LUAD and LUSC. As indicated in Figure 4, more tumor infiltrating cells were associated with DMD somatic copy-number alterations in LUSC than in LUAD. Of note, significant arm-level DMD deletion occurred in LUSC samples with CD4+ T cells infiltration (Figure 4), supporting the hypothesis that decreased expression of DMD caused by mutation may affect CD4+ T cell infiltration in LUSC.

4. Discussion

Genome-wide association testing is an important approach for the identification of genetic factors associated with complex genetic diseases such as lung cancer [6]. However, previous lung cancer GWA studies did not specifically test for potentially susceptible SNPs on the X chromosome. In this study, we performed an X chromosome-wide association study to identify susceptibility loci for lung cancer risk. We identified 24 significant SNPs in two X chromosomes that were associated with lung cancer in male patients. Based on the genome annotation, these SNPs mapped near the genes DMD, PTCHD1-AS, and AL008633.1.
Previous sex-specificity differences in lung cancer risk have been focused on tobacco-derived carcinogens, sex hormones, and carcinogen metabolism [22]. However, the intrinsic influence of genetic variants on sex-specific lung cancer risk should not be neglected. In the present study, we identified genetic variants on the X chromosome that were associated with lung cancer risk regardless of smoking, suggesting some male individuals who bear risk alleles of these X-linked genes are more susceptible to lung cancer. The synergistic interaction of SNPs could be associated with cancer susceptibility [23,24]. In this study, we identified that interactions between SNPs in different regions increase lung cancer risk. Further studies of genes in these regions could identify novel targets for lung cancer prevention.
DMD is a very large gene (greater than 2 Mb), and its mutations are known to be pathogenic in causing Duchenne and Becker muscular dystrophy. Recently, increasing evidence has suggested the role of DMD abnormality in cancer development. Leanne et al. summarized DMD mutations in major cancer types, including soft tissue sarcomas, tumours of the nervous system, carcinomas, and haematological malignancies [25]. Our study revealed that genetic variation in DMD (either as germline variants or as somatic mutations) could be associated with sex-specific risk of lung cancer. Consistent with previous findings, abnormal DMD expression was found in lung cancer compared with control tissues. However, the contribution of DMD to lung cancer susceptibility remains unclear. The pathway analysis of DMD co-expressed genes identified response to tumour necrosis factor in the GO and NF−kappa B signalling pathway in the KEGG pathways. Moreover, an association of the levels of immune infiltrates with DMD mutation was observed, suggesting that DMD may affect tumour development through abnormal immune processes. Altogether, DMD could be a molecular target for the prevention of some cases of male-specific lung cancer.
There are some limitations to this study. First, the dataset we used does not provide protein data, making a direct SNP–protein association analysis impossible. Second, the data were derived from subjects of European descent. Further investigation in other ethnic groups is needed. Third, it could be interesting to test whether these or other X-linked SNPs affected other cancer types. Fourth, collecting further DNA samples for X chromosome sequencing could validate our SNPs or provide novel SNPs associated with sex-specific lung cancer risk.

5. Conclusions

In this study, we performed analyses of GWAS data to identify sex-specific SNPs, located on chromosome X, associated with lung cancer. Based on gene annotation, expression analysis, co-expression analysis, and functional analyses, our findings support the hypothesis that DMD is abnormally expressed in cancer tissue and DMD-induced immune dysregulation may be responsible for the etiology of lung cancer. Further biomolecular experiments are needed to understand the interaction of these SNPs with DMD. Finally, it is well known that some simple single-gene diseases are more common in males due to inherited mutations in X-liked genes; our results may provide a paradigm for inherited X-linked variants contributing to susceptibility to other cancers and in other common complex genetic diseases.

Supplementary Materials

The following are available online at https://www.mdpi.com/article/10.3390/cancers13246379/s1. Figure S1: Impact of DMD on lung cancer overall or disease-free survival. Table S1: Genotype of peak SNPs by family history.

Author Contributions

Conceptualization, G.M.; methodology, G.M.; validation, S.Y.; formal analysis, X.S., G.M. and S.Y.; investigation, G.M. and S.Y.; resources, G.M.; data curation, S.Y.; writing—original draft preparation, X.S.; writing—review and editing, G.M. and X.S.; visualization, X.S.; supervision, G.M.; project administration, G.M. and S.Y.; funding acquisition, G.M. All authors have read and agreed to the published version of the manuscript.

Funding

Xiaoshun Shi’s PhD scholarship was provided by the China Scholarship Council and The University of Western Australia. We thank the Diabetes Research Foundation of Western Australia for supporting Grant Morahan and Sylvia Young.

Institutional Review Board Statement

We obtained ethical approval from the UWA Human Research Ethics Committee (HREC, 2020/ET000284) to analyse the data.

Informed Consent Statement

Not applicable for studies involving public anonymous data that was generated under appropriate ethics approval by the original investigators’ IRB.

Data Availability Statement

The GWAS dataset in this analysis was downloaded with appropriate approvals from the dbGaP database (phs000093.v2. p2). Other databases used in this study are listed in Materials and Methods section.

Acknowledgments

Some of the figures in the graphic abstract were accessed from Servier Medical Art (https://smart.servier.com/) (accessed on 1 October 2021). We thank the original investigators whose work generated the data we accessed via dbGAP.

Conflicts of Interest

The authors declare no conflict of interest.

References

  1. Siegel, R.L.; Miller, K.D.; Jemal, A. Cancer Statistics, 2017. CA Cancer J. Clin. 2017, 67, 7–30. [Google Scholar] [CrossRef] [PubMed] [Green Version]
  2. Siegel, R.L.; Miller, K.D.; Jemal, A. Cancer statistics, 2018. CA Cancer J. Clin. 2018, 68, 7–30. [Google Scholar] [CrossRef] [PubMed]
  3. Siegel, R.L.; Miller, K.D.; Jemal, A. Cancer statistics, 2019. CA Cancer J. Clin. 2019, 69, 7–34. [Google Scholar] [CrossRef] [PubMed] [Green Version]
  4. Bain, C.; Feskanich, D.; Speizer, F.E.; Thun, M.; Hertzmark, E.; Rosner, B.A.; Colditz, G.A. Lung cancer rates in men and women with comparable histories of smoking. J. Natl. Cancer Inst. 2004, 96, 826–834. [Google Scholar] [CrossRef] [Green Version]
  5. Zang, E.A.; Wynder, E.L. Differences in lung cancer risk between men and women: Examination of the evidence. J. Natl. Cancer Inst. 1996, 88, 183–192. [Google Scholar] [CrossRef]
  6. Bosse, Y.; Amos, C.I. A Decade of GWAS Results in Lung Cancer. Cancer Epidemiol. Biomark. Prev. 2018, 27, 363–379. [Google Scholar] [CrossRef] [Green Version]
  7. Li, C.H.; Prokopec, S.D.; Sun, R.X.; Yousif, F.; Schmitz, N.; Subtypes, P.T.; Clinical, T.; Boutros, P.C.; Consortium, P. Sex differences in oncogenic mutational processes. Nat. Commun. 2020, 11, 4330. [Google Scholar] [CrossRef]
  8. Dunford, A.; Weinstock, D.M.; Savova, V.; Schumacher, S.E.; Cleary, J.P.; Yoda, A.; Sullivan, T.J.; Hess, J.M.; Gimelbrant, A.A.; Beroukhim, R.; et al. Tumor-suppressor genes that escape from X-inactivation contribute to cancer sex bias. Nat. Genet. 2017, 49, 10–16. [Google Scholar] [CrossRef] [Green Version]
  9. Haupt, S.; Caramia, F.; Herschtal, A.; Soussi, T.; Lozano, G.; Chen, H.; Liang, H.; Speed, T.P.; Haupt, Y. Identification of cancer sex-disparity in the functional integrity of p53 and its X chromosome network. Nat. Commun. 2019, 10, 5385. [Google Scholar] [CrossRef]
  10. Ostrom, Q.T.; Kinnersley, B.; Wrensch, M.R.; Eckel-Passow, J.E.; Armstrong, G.; Rice, T.; Chen, Y.; Wiencke, J.K.; McCoy, L.S.; Hansen, H.M.; et al. Sex-specific glioma genome-wide association study identifies new risk locus at 3p21.31 in females, and finds sex-differences in risk at 8q24.21. Sci. Rep. 2018, 8, 7352. [Google Scholar] [CrossRef] [Green Version]
  11. Zuo, X.Y.; Feng, Q.S.; Sun, J.; Wei, P.P.; Chin, Y.M.; Guo, Y.M.; Xia, Y.F.; Li, B.; Xia, X.J.; Jia, W.H.; et al. X-chromosome association study reveals genetic susceptibility loci of nasopharyngeal carcinoma. Biol. Sex Differ. 2019, 10, 13. [Google Scholar] [CrossRef]
  12. Chun, K.A.; Kocarnik, J.M.; Hardikar, S.S.; Robinson, J.R.; Berndt, S.I.; Chan, A.T.; Figueiredo, J.C.; Lindor, N.M.; Song, M.; Schoen, R.E.; et al. Leptin gene variants and colorectal cancer risk: Sex-specific associations. PLoS ONE 2018, 13, e0206519. [Google Scholar] [CrossRef]
  13. Roshyara, N.R.; Scholz, M. fcGENE: A versatile tool for processing and transforming SNP datasets. PLoS ONE 2014, 9, e97589. [Google Scholar] [CrossRef]
  14. Chandrashekar, D.S.; Bashel, B.; Balasubramanya, S.A.H.; Creighton, C.J.; Ponce-Rodriguez, I.; Chakravarthi, B.; Varambally, S. UALCAN: A Portal for Facilitating Tumor Subgroup Gene Expression and Survival Analyses. Neoplasia 2017, 19, 649–658. [Google Scholar] [CrossRef]
  15. Tang, Z.; Kang, B.; Li, C.; Chen, T.; Zhang, Z. GEPIA2: An enhanced web server for large-scale expression profiling and interactive analysis. Nucleic Acids Res. 2019, 47, W556–W560. [Google Scholar] [CrossRef] [Green Version]
  16. Yu, G.; Wang, L.G.; Han, Y.; He, Q.Y. clusterProfiler: An R package for comparing biological themes among gene clusters. OMICS 2012, 16, 284–287. [Google Scholar] [CrossRef]
  17. Landi, M.T.; Consonni, D.; Rotunno, M.; Bergen, A.W.; Goldstein, A.M.; Lubin, J.H.; Goldin, L.; Alavanja, M.; Morgan, G.; Subar, A.F.; et al. Environment and Genetics in Lung cancer Etiology (EAGLE) study: An integrative population-based case-control study of lung cancer. BMC Public Health 2008, 8, 203. [Google Scholar] [CrossRef] [Green Version]
  18. Prorok, P.C.; Andriole, G.L.; Bresalier, R.S.; Buys, S.S.; Chia, D.; Crawford, E.D.; Fogel, R.; Gelmann, E.P.; Gilbert, F.; Hasson, M.A.; et al. Design of the Prostate, Lung, Colorectal and Ovarian (PLCO) Cancer Screening Trial. Control. Clin. Trials 2000, 21, 273S–309S. [Google Scholar] [CrossRef]
  19. Zack, T.I.; Schumacher, S.E.; Carter, S.L.; Cherniack, A.D.; Saksena, G.; Tabak, B.; Lawrence, M.S.; Zhsng, C.Z.; Wala, J.; Mermel, C.H.; et al. Pan-cancer patterns of somatic copy number alteration. Nat. Genet. 2013, 45, 1134–1140. [Google Scholar] [CrossRef] [Green Version]
  20. Mermel, C.H.; Schumacher, S.E.; Hill, B.; Meyerson, M.L.; Beroukhim, R.; Getz, G. GISTIC2.0 facilitates sensitive and confident localization of the targets of focal somatic copy-number alteration in human cancers. Genome Biol. 2011, 12, R41. [Google Scholar] [CrossRef] [Green Version]
  21. Li, T.; Fan, J.; Wang, B.; Traugh, N.; Chen, Q.; Liu, J.S.; Li, B.; Liu, X.S. TIMER: A Web Server for Comprehensive Analysis of Tumor-Infiltrating Immune Cells. Cancer Res. 2017, 77, e108–e110. [Google Scholar] [CrossRef] [PubMed] [Green Version]
  22. Stapelfeld, C.; Dammann, C.; Maser, E. Sex-specificity in lung cancer risk. Int. J. Cancer 2020, 146, 2376–2382. [Google Scholar] [CrossRef] [PubMed]
  23. Lee, S.W.; Park, D.Y.; Kim, M.Y.; Kang, C. Synergistic triad epistasis of epigenetic H3K27me modifier genes, EZH2, KDM6A, and KDM6B, in gastric cancer susceptibility. Gastric Cancer 2019, 22, 640–644. [Google Scholar] [CrossRef] [PubMed] [Green Version]
  24. Huang, S.J.; Tseng, Y.K.; Lo, Y.H.; Wu, P.C.; Lee, J.H.; Liou, H.H.; Liang, C.C.; Yang, C.M.; Wang, C.C.; Yen, L.M.; et al. Association of SDF-1 and CXCR4 Polymorphisms with Susceptibility to Oral and Pharyngeal Squamous Cell Carcinoma. Anticancer Res. 2019, 39, 2891–2902. [Google Scholar] [CrossRef]
  25. Jones, L.; Naidoo, M.; Machado, L.R.; Anthony, K. The Duchenne muscular dystrophy gene and cancer. Cell Oncol. (Dordr.) 2021, 44, 19–32. [Google Scholar] [CrossRef]
Figure 1. Identification of lung cancer risk sex-specific SNPs. (A) Manhattan plots of tested X chromosome SNPs. The distribution of the P-values of the X chromosome SNPs was plotted for the male (blue) and female (red) analyses. SNPs in the pseudo-autosomal regions, both PAR1 and PAR2, were not considered. The dashed line indicates the threshold for significant association as calculated by −log [0.05/171,804] where 171,804 was the number of X chromosome SNPs tested. The dotted line indicates the accepted threshold for analyses involving SNPs over the whole genome. (B) Heatmap showing p values of identified SNPs in subgroup association analysis. The cells in red indicate the SNPs whose p-values were significant.
Cancers 13 06379 g001
Figure 2. Genetic alteration and gene expression of DMD. (A) Haplotype analysis of identified SNPs in DMD. (B) Genomic position of identified SNPs, pathogenic SNPs in cancer and Duchenne muscular dystrophy in DMD. (C) The alteration profile of DMD in 3163 lung cancer samples reported in cBioportal. (D) Expression of DMD in TCGA-LUAD and TCGA-LUSC cohort. (E) Pan-cancer analysis of differential DMD expression. The significant p value was indicated as 0 ≤ *** < 0.001 ≤ ** < 0.01 ≤ * < 0.05.
Cancers 13 06379 g002
Figure 3. Gene ontology (GO) and KEGG pathway enrichment of DMD co-expressed genes in lung cancer. (A) All biological process enrichments of DMD co-expressed genes in lung cancer. (B) Kyoto Encyclopedia of Genes and Genomes analysis of the functional meanings of DMD co-expressed genes in lung cancer.
Cancers 13 06379 g003
Figure 4. Correlation of DMD somatic copy-number alterations with immune infiltration levels in LUAD and LUSC. Box plots present the distributions of each immune subset based on each copy number status in LUAD and LUSC. The infiltration level for each SCNA category was compared with the control using a two-sided Wilcoxon rank-sum test. Significant p values are indicated as follows: 0 ≤ *** < 0.001 ≤ ** < 0.01 ≤ * < 0.05.
Cancers 13 06379 g004
Table 1. Significant X chromosome SNPs associated with lung cancer in males.
SNPBPA1F_AF_UA2CHISQP *ORGene
rs65297975454436T0.17090.08176G29.077 × 10−82.315-
rs43647695462201T0.17090.08176G29.077 × 10−82.315-
rs1731397120597131G0.12620.04822T31.552 × 10−82.851-
rs5929906520600981G0.11820.04507C29.495.6 × 10−82.84-
rs787975620601076A0.11820.04507C29.495.6 × 10−82.84-
rs3555006920602845C0.11820.04507T29.495.6 × 10−82.84-
rs599089620603703G0.11820.04507A29.495.6 × 10−82.84-
rs788392623285507C00.04612A29.75.1 × 10−80PTCHD1-AS
rs652626323286674G00.04612T29.75.1 × 10−80PTCHD1-AS
rs5580304831273345A0.18210.08386G33.885.9 × 10−92.433DMD
rs705727131277489T0.18370.08491A33.965.6 × 10−92.426DMD
rs597160531977216C0.30350.1782T33.746.3 × 10−92.01DMD
rs597246831978713T0.30350.1782C33.746.3 × 10−92.01DMD
rs597246931978946C0.30350.1782T33.746.3 × 10−92.01DMD
rs6054683231983160T0.30350.1803C32.491.2 × 10−81.981DMD
rs6258774331985166T0.35140.218C34.065.3 × 10−91.943DMD
rs705132931985724T0.29710.1761G31.841.7 × 10−81.978DMD
rs6763256631988691T0.29390.1761C30.313.7 × 10−81.948DMD
rs57391430109757735G0.28120.4203A31.591.9 × 10−80.5394-
rs145211462129041862T0.038340.1279C36.141.8 × 10−90.2719AL008633.1
rs200018042129048102G0.15650.282C33.347.7 × 10−90.4726AL008633.1
rs6637526129048867G0.26040.3931A29.645.2 × 10−80.5436AL008633.1
rs182684417146125695G0.17570.08595A28.539.2 × 10−82.267-
rs62601607146134454T0.15340.06918C29.16.9 × 10−82.437-
* In this table, p values less than or equal to 9.2 × 10⁻⁸ were considered significant. SNP: single-nucleotide polymorphism ID; BP: physical base-pair position; A1: minor allele (based on whole sample); F_A: frequency of this allele in cases; F_U: frequency of this allele in controls; A2: major allele; CHISQ: basic allelic test chi-square (1df); P: asymptotic p-value for this test; OR: estimated odds ratio; Gene: annotated genes near the SNPs.
Table 2. Genotype of peak SNPs in males.
Peak SNPsGenotypeCases
(n = 313)
Controls
(n = 477)
OR *P
rs6529797T54391.56<0.01
G259438
rs17313971G44271.65<0.01
T269450
rs7883926A313455NA<0.01
C022
rs55803048A57401.59<0.01
G256437
rs145211462C3014162.55<0.01
T1261
rs62601607T48331.59<0.01
C265444
* OR: odds ratio; P: p value.
Table 3. Genotype of peak SNPs in females.
SNPGenotypeCasesControlsOR *P
rs6529797T51711.140.31
G164282
rs17313971G25391.040.83
T190314
rs7883926A2023211.340.19
C1332
rs55803048A47691.090.51
G168284
rs145211462C1893041.110.54
T2649
rs62601607T47741.030.8
C168279
* OR: odds ratio; P: p value.
Table 4. Genotype of peak SNPs by age.
SNP *AgeResistance AlleleRisk AlleleP
rs6529797Under 65134190.04
Over 6512535
rs17313971Under 65129240.52
Over 6514020
rs55803048Under 65129240.31
Over 6512733
rs145211462Under 65101430.02
Over 652158
rs62601607Under 65125280.16
Over 6514020
* The minor allele of rs7883926 was not present in any of the cases; therefore, this SNP was not included. Number of male cases is 313.
Table 5. Risk alleles pairwise combination analysis.
Combination *Genotype2 by 2 Risk Alleles Combination
MaleFemale
CancerControlOddsCancerControlOdds
X1_2G_T2204110.531903140.61
X1_3T_A54391.38None
X1_4T_A1226None
X1_5T_C52311.68None
X1_6T_T522.5None
X2_3G_A44261.70None
X2_4G_A1025None
X2_5G_C42261.62None
X2_6G_T623None
X3_4A_A57391.4647690.68
X3_5A_C3013970.761893040.62
X3_6A_T48311.5547740.64
X4_5A_C57331.73None
X4_6A_T842None
X5_6C_T47281.68None
* The risk alleles of representative SNPs in each peak were retrieved. The number of samples with the combination of these risk alleles were calculated. Each combination was labelled as “X risk allele in peak number_ allele in peak number”.
Table 6. Risk alleles three-by-three combination analysis.
Combination *GenotypeCancerControlOdds
X1_2_3T_G_A50NA
X1_2_4T_G_A10NA
X1_2_5T_G_C50NA
X1_2_6----
X1_3_4T_A_A1226
X1_3_5T_A_C52311.68
X1_3_6T_A_T52312.5
X1_4_5T_A_C1226
X1_4_6----
X1_5_6T_C_T522.5
X2_3_4G_A_A525
X2_3_5G_A_C42251.68
X2_3_6G_A_T623
X3_4_5A_A_C57321.78
X3_4_6----
X4_5_6A_C_T832.67
* The risk allele of representative SNPs in each peak were retrieved. Next, the number of samples with the combination of these risk alleles were calculated. Each combination was labelled as “X risk allele in peak number_ allele in peak number”. None of these combinations were identified in female.
Table 7. Survival analysis of DMD in lung cancer microarray cohorts.
DatasetLung Cancer SubtypeEndpointProbe IDNCOX p-ValueHR,95% CI
[Lower-Upper Bound] *
GSE31210AdenocarcinomaRelapse-free survival203881_s_at204<0.010.46 [0.32–0.67]
GSE13213AdenocarcinomaOverall survivalA_24_P185854117<0.010.64 [0.50–0.82]
GSE31210AdenocarcinomaOverall survival203881_s_at204<0.010.46 [0.29–0.75]
GSE31210AdenocarcinomaRelapse-free survival207660_at204<0.010.53 [0.34–0.82]
jacob-00182-UMAdenocarcinomaOverall survival203881_s_at1780.010.76 [0.61–0.94]
GSE8894# NSCLCRelapse-free survival234752_x_at1380.040.17 [0.03–0.91]
GSE31210AdenocarcinomaRelapse-free survival208086_s_at2040.060.62 [0.37–1.01]
GSE8894NSCLCRelapse-free survival207660_at1380.080.00 [0.00–3.61]
GSE3141NSCLCOverall survival203881_s_at1110.110.78 [0.58–1.06]
jacob-00182-MSKAdenocarcinomaOverall survival203881_s_at1040.160.78 [0.55–1.10]
jacob-00182-CANDFAdenocarcinomaOverall survival203881_s_at820.160.75 [0.50–1.13]
GSE13213AdenocarcinomaOverall survivalA_24_P341861170.170.76 [0.51–1.13]
GSE31210AdenocarcinomaOverall survival208086_s_at2040.180.64 [0.33–1.23]
GSE3141NSCLCOverall survival207660_at1110.200.76 [0.50–1.15]
jacob-00182-MSKAdenocarcinomaOverall survival208086_s_at1040.220.82 [0.60–1.12]
GSE31210AdenocarcinomaOverall survival207660_at2040.260.69 [0.36–1.32]
MICHIGAN-LCAdenocarcinomaOverall survivalM18533_at860.280.76 [0.46–1.25]
jacob-00182-UMAdenocarcinomaOverall survival207660_at1780.280.69 [0.35–1.35]
GSE17710Squamous cell carcinomaRelapse-free survival26567560.281.70 [0.65–4.47]
GSE17710Squamous cell carcinomaOverall survival26567560.311.69 [0.62–4.64]
GSE17710Squamous cell carcinomaRelapse-free survival3354560.321.53 [0.67–3.50]
GSE14814NSCLCDisease-specific survival208086_s_at900.352.10 [0.44–9.94]
jacob-00182-MSKAdenocarcinomaOverall survival207660_at1040.360.62 [0.22–1.75]
GSE17710Squamous cell carcinomaRelapse-free survival11043560.371.15 [0.85–1.56]
jacob-00182-HLMAdenocarcinomaOverall survival207660_at790.380.64 [0.24–1.73]
GSE4573Squamous cell carcinomaOverall survival208086_s_at1290.400.83 [0.55–1.28]
GSE17710Squamous cell carcinomaOverall survival3354560.451.39 [0.58–3.34]
GSE31210AdenocarcinomaOverall survival234752_x_at2040.460.88 [0.63–1.24]
GSE3141NSCLCOverall survival234752_x_at1110.471.07 [0.89–1.29]
MICHIGAN-LCAdenocarcinomaOverall survivalS81419_at860.500.73 [0.29–1.84]
GSE17710Squamous cell carcinomaOverall survival8673560.530.80 [0.39–1.63]
jacob-00182-CANDFAdenocarcinomaOverall survival207660_at820.530.77 [0.35–1.74]
jacob-00182-HLMAdenocarcinomaOverall survival203881_s_at790.540.92 [0.69–1.21]
GSE4716-GPL3696NSCLCOverall survival3336500.540.80 [0.40–1.62]
GSE3141NSCLCOverall survival208086_s_at1110.600.89 [0.58–1.37]
GSE4573Squamous cell carcinomaOverall survival207660_at1290.611.17 [0.63–2.16]
GSE14814NSCLCOverall survival208086_s_at900.631.48 [0.30–7.36]
GSE17710Squamous cell carcinomaRelapse-free survival8673560.640.85 [0.41–1.73]
GSE17710Squamous cell carcinomaOverall survival11043560.671.06 [0.80–1.41]
GSE31210AdenocarcinomaRelapse-free survival234752_x_at2040.680.94 [0.71–1.25]
GSE4573Squamous cell carcinomaOverall survival203881_s_at1290.720.95 [0.72–1.25]
GSE8894NSCLCRelapse-free survival208086_s_at1380.740.87 [0.38–1.99]
GSE14814NSCLCDisease-specific survival203881_s_at900.771.10 [0.58–2.07]
GSE14814NSCLCOverall survival207660_at900.820.88 [0.28–2.78]
GSE8894NSCLCRelapse-free survival203881_s_at1380.870.99 [0.83–1.17]
GSE14814NSCLCDisease-specific survival207660_at900.931.06 [0.29–3.90]
jacob-00182-UMAdenocarcinomaOverall survival208086_s_at1780.961.00 [0.83–1.20]
GSE14814NSCLCOverall survival203881_s_at900.961.01 [0.57–1.79]
jacob-00182-HLMAdenocarcinomaOverall survival208086_s_at790.991.00 [0.78–1.29]
* HR: hazard ratio, 95% CI (lower and upper bounds]) # NSCLC: non-small cell lung cancer.
Publisher’s Note: MDPI stays neutral with regard to jurisdictional claims in published maps and institutional affiliations.

