Article

Epigenetic Deregulation of Telomere-Related Genes in Newly Diagnosed Multiple Myeloma Patients

1
Pediatric Hematology-Oncology, Arkansas Children’s Research Institute, University of Arkansas for Medical Sciences, Little Rock, AR 72202, USA
2
Department of Biomedical Informatics, University of Arkansas for Medical Sciences, Little Rock, AR 72205, USA
3
Myeloma Center, Department of Internal Medicine, University of Arkansas for Medical Sciences, Little Rock, AR 72205, USA
*
Author to whom correspondence should be addressed.
Cancers 2021, 13(24), 6348; https://doi.org/10.3390/cancers13246348
Submission received: 8 November 2021 / Revised: 10 December 2021 / Accepted: 12 December 2021 / Published: 17 December 2021
(This article belongs to the Section Cancer Biomarkers)

Abstract

:

Simple Summary

Aberrant expression of telomere-related genes (TRGs) and telomere-shortening facilitates development of different types of cancer. Given the fact that high-risk multiple myeloma (MM) patients harbor critically shortened telomeres, we investigated the epigenetic basis of TRG-expression in newly diagnosed MM patients. We demonstrated that DNA methylation alone or in cooperation with overlapping chromatin marks and underlying genomic sequence build up an epigenetic network of aberrant gene expression in TRGs. Furthermore, we identified five TRGs, which are epigenetically controlled and consistently deregulated across the major molecular subgroups of MM, identifiable at the early stage of the disease.

Abstract

High-risk Multiple Myeloma (MM) patients were found to maintain telomere length (TL), below the margin of short critical length, consistent with proactive overexpression of telomerase. Previously, DNA methylation has been shown as a determinant of telomere-related gene (TRG) expression and TL to assess risk in different types of cancer. We mapped genome-wide DNA methylation in a cohort of newly diagnosed MM (NDMM; n = 53) patients of major molecular subgroups, compared to age-matched healthy donors (n = 4). Differential methylation and expression at TRG-loci were analyzed in combination with overlapping chromatin marks and underlying DNA-sequences. We observed a strong correlation (R2 ≥ 0.5) between DNA methylation and expression amongst selective TRGs, such that demethylation at the promoters of DDX1 and TERF1 were associated to their oncogenic upregulation, while demethylation at the bodies of two key tumor suppressors ZNF208 and RAP1A led to downregulation of the genes. We demonstrated that TRG expression may be controlled by DNA methylation alone or in cooperation with chromatin modifications or CCCTC-binding factor at the regulatory regions. Additionally, we showed that hypomethylated DMRs of TRGs in NDMM are stabilized with G-quadruplex forming sequences, suggesting a crucial role of these epigenetically vulnerable loci in MM pathogenesis. We have identified a panel of five TRGs, which are epigenetically deregulated in NDMM patients and may serve as early detection biomarkers or therapeutic targets in the disease.

1. Background

Multiple Myeloma (MM) is a B-cell neoplasm, manifested with abnormal infiltration of plasma cells (PCs) in the bone marrow matrix, which leads to the development of lytic bone lesions and myelosuppression [1]. The underlying polymorphic genetic and epigenetic variants in tumor cells strongly influence MM development and survival outcome [2,3,4,5]. In addition to etiological genetic and epigenetic features, telomere length (TL) has been identified as a crucial determinant of survival in patients with MM.
Telomeres are TTAGGG-repeat enriched nucleoprotein complexes positioned at the termini of eukaryotic chromosomes and contribute to the maintenance of genomic stability and controlled cell-proliferation [6]. In contrast, cancer cells typically maintain shortened telomeres, favored by proactive catalytic activities of defective telomerase or through an alternative lengthening of telomere mechanism [7,8,9]. Previous studies have demonstrated a strong correlation between the shortening in leukocyte telomere length and the predisposition of developing different types of cancer, including hematological malignancies [10,11,12,13]. Particularly, patients with MM harboring high telomerase activity and short TL were marked as a ‘high-risk’ group, having significantly (p < 0.0001; hazard ratio = 3.4) shorter overall survival [14,15]. A progressive shortening in TL was also observed in patients with MM when compared to the patients at the stage defined as premalignant monoclonal gammopathy of undetermined significance (MGUS) [16]. Thus, an increased number of telomere aggregates were ascribed as a prognostic biomarker for high-risk in the smoldering multiple myeloma (SMM) patients, consistent with their poor drug susceptibility and short-term survival [17]. While TL maintenance is found to be crucially linked to the prognosis and survival of the disease, both long- and short-term inhibition of telomerase resulted in reduced growth of MM cells [18,19].
The regulation of telomerase activity and the maintenance of TL in MM could be influenced by a set of extrinsic and intrinsic factors. For instance, cytokines such as interleukin 6 and insulin-like growth factor 1 were reported to increase telomerase activity in MM cells without alterations to the human telomerase encoding gene, telomerase reverse transcriptase (hTERT) [20]. In contrast, bortezomib, the anticancer medication used to treat MM, consistently reduced both hTERT expression and telomerase activity in MM cell lines [21]. Intrinsic factors such as genetic mutations or DNA methylation at subtelomeres and telomere-related genes (TRGs) were also reported to have a strong association with TL maintenance in different types of cancer [22,23,24,25,26]. A few previous studies have attempted to establish the relationship between differential expression of TRGs and TL maintenance in MM [27,28]. However, to our knowledge, no previous study had been reported to investigate the epigenetic basis of differential TRG expression in the disease.
To address this deficiency, we have combined epigenetic modifications, such as DNA methylation and chromatin marks, to determine their impact on the expression of a complete catalog of TRGs [29]. For the present study, we selected a cohort of patients with NDMM belonging to six major molecular subgroups, categorized based on immunoglobulin heavy chain locus (IgH) translocation (TC) with a number of oncogenes such as FGFR3/MMSET, t(4;14); CCND1, t(11;14); MAF, t(14;16); or MAFB, t(14;20); and non-TC hyperdiploid (HY) subgroups with oncogenic overexpression of multiple copies of CCND1 (D1) or CCND2 (D2). We also investigated overlaps of G-quadruplex forming sequences (G4FS) to the epigenetic risk-loci spanning the TRGs in patients with NDMM and in representative MM cell lines.

2. Methods

2.1. Sample Information and Genomic DNA/RNA Preparation

After approval by the institutional review board, CD138-positive bone marrow PCs were collected from a cohort of consented patients with NDMM (n = 53) and compared to pools of age-matched healthy donors (controls; n = 4). Bone marrow aspirates were enriched for >90% tumor cells using RoboSep automated cell separation techniques (Stemcell Technologies, Vancouver, British Columbia, Canada). We included patients with NDMM from the t(4;14), n = 8; t(11;14), n = 10; t(14;16), n = 9; and t(14;20), n = 7, TC subgroups and the D1, n = 12, and D2, n = 7, HY subgroups. Demographic information of the enrolled subjects is summarized in Table S1. We have also included MM cell lines, representative of the major IgH translocations found in MM patients, such as H929 for t(4;14), U266 for t(11;14), MM.1S for t(14;16), and SACHI for t(14;20) subgroups. MM cell lines were maintained in RPMI 1640 with 20% fetal bovine serum, 1% L-glutamine, and 1% penicillin-streptomycin. Authenticity of the cell lines were checked with short tandem repeat analysis of non-coding DNA, while possibilities of microbial contaminations were nullified with mycoplasma check. Genomic DNA and RNA samples were extracted using AllPrep DNA/RNA/Protein Mini Kit (Qiagen, Hilden, Germany) or Puregene DNA Extraction Kit (Qiagen, Hilden, Germany).

2.2. Library Preparation and Sequence Annotations for Reduced Representation Bisulfite Sequencing

We prepared libraries for reduced representation bisulfite sequencing (RRBS), following our previously published protocol [30]. Briefly, 100 ng of genomic DNA from MM cell lines or patient-derived samples were digested with MspI overnight to generate ~5-kb fragments along the enzyme cut sites across genome. Next, we performed the end-repair and A-tailing of DNA fragments using the KAPA HyperPlus Kit (Roche, Basel, Switzerland) followed by ligation of methylated adaptors (NEBNext Multiplex Oligos for Illumina; Methylated Adaptor, Index Primers Set; New England BioLabs Inc., Ipswich, MA, USA), bisulfite-conversion (EZ DNA Methylation Kit; Zymo Research, Irvine, CA, USA), and amplification of the barcoded libraries (EpiMark Hot Start Taq DNA Polymerase, New England BioLabs Inc., Ipswich, MA, USA). RRBS libraries were then selected based on fragment sizes of 150–250 bp and 250–450 bp. Quality control of the libraries was performed by determining the concentration, using a high-sensitivity DNA assay kit on the Qubit spectrometer (Thermo-Fisher, Waltham, MA, USA), and for size, using the 2200 TapeStation System (Agilent Technologies, Santa Clara, CA, USA), before sequencing with 75 bp single-end reads on the NextSeq 500 System (Illumina, San Diego, CA, USA). Genome sequencing of the raw data (binary alignment/map files) was processed, filtered, and the genome (hg38/GRCh38) annotated using our previously published guidelines [3]. Briefly, differentially methylated regions (DMRs) were annotated by identifying the closest transcription start site (TSS) of a gene based on the National Center for Biotechnology Information Reference Sequence Database. DMRs located from 5 kb upstream to 200 bp downstream of TSS were marked as the promoters, while DMRs spanning up to the 3′-end of the corresponding genes were marked as the body. DMRs having a methylation difference (at a false discovery rate [FDR]-adjusted p value < 0.05) of >20% increase (hypermethylation) or decrease (hypomethylation) between NDMM subgroups and controls) were considered significant for all the downstream analyses. The difference of mean DMR-methylation (MDM) at the promoters and the bodies were determined in NDMM subgroups and MM cell lines in comparison to control.

2.3. Gene Expression Analysis

Gene expression profiling was performed using Affymetrix GeneChip Human Genome U133 Plus 2.0 Array (Thermo-Fisher, Waltham, MA, USA). The raw files were processed with Transcriptome Analysis Console v4.0 Software (Thermo-Fisher, Waltham, MA, USA). The signal intensity values of multiple transcripts (whenever applicable) were averaged, while the difference in the median expression of samples between NDMM subgroups and control less than 1-fold with adjusted p < 0.05 (using log2 scale) were filtered out. Venn intersection analyses were performed using Venny v2.1 (BioinfoGP, Madrid, Spain) to determine the genes that have an inverse methylation-expression relationship at the promoters or a direct methylation-expression relationship at the bodies. A regression analysis was performed to determine the coefficient of correlation (R2) between DNA methylation and expression.

2.4. Analysis of Chromatin Modifications

We have analyzed the enrichment of four activating histones (H3K27ac, H3K4me1, H3K4me3, and H3K36me3) and one repressive histone (H3K27me3), overlapped to DMRs of the differentially expressed TRGs using chromatin immunoprecipitation sequencing (ChIP-seq) in reference to H929 t(4;14) MM cells. The enrichment of CCCTC binding factor (CTCF)-transcription factor (TF) to the overlapping DMRs was also determined in reference to the ChIP-seq data in H929 cell line. Additionally, open chromatin states on or adjacent to the DMRs were determined with DNAse sequencing (DNAse-seq). Both the ChIP-seq and DNAse-seq data were obtained from the Encyclopedia of DNA Elements (ENCODE) epigenomics data (as uploaded by the Noble Laboratory at University of Washington using avocado:encode2018core) for H929 cells [31]. The chromatin enrichment and position of DMRs were visualized with the Integrated Genomics Viewer (IGV), followed by loading bigwig and customized bed files onto the IGV respectively [32].

2.5. Determine G-Quadruplex–DMR Overlaps

The G4FS, overlapped with the DMRs of TRGs, were analyzed using a web-based server that predicts quadruplex forming G-rich sequences (QGRS), the QGRS Mapper [33].

2.6. Statistical Analysis

Methylation and expression data were prepared and presented with Prism v8.0 software (GraphPad, San Diego, CA, USA). A two-way ANOVA test was used to compare pair-wise differential methylation at DMRs between NDMM subgroups and controls. A one-way ANOVA with multiple comparison was performed for expression analysis, and an adjusted p value < 0.05 was considered significant.

3. Results

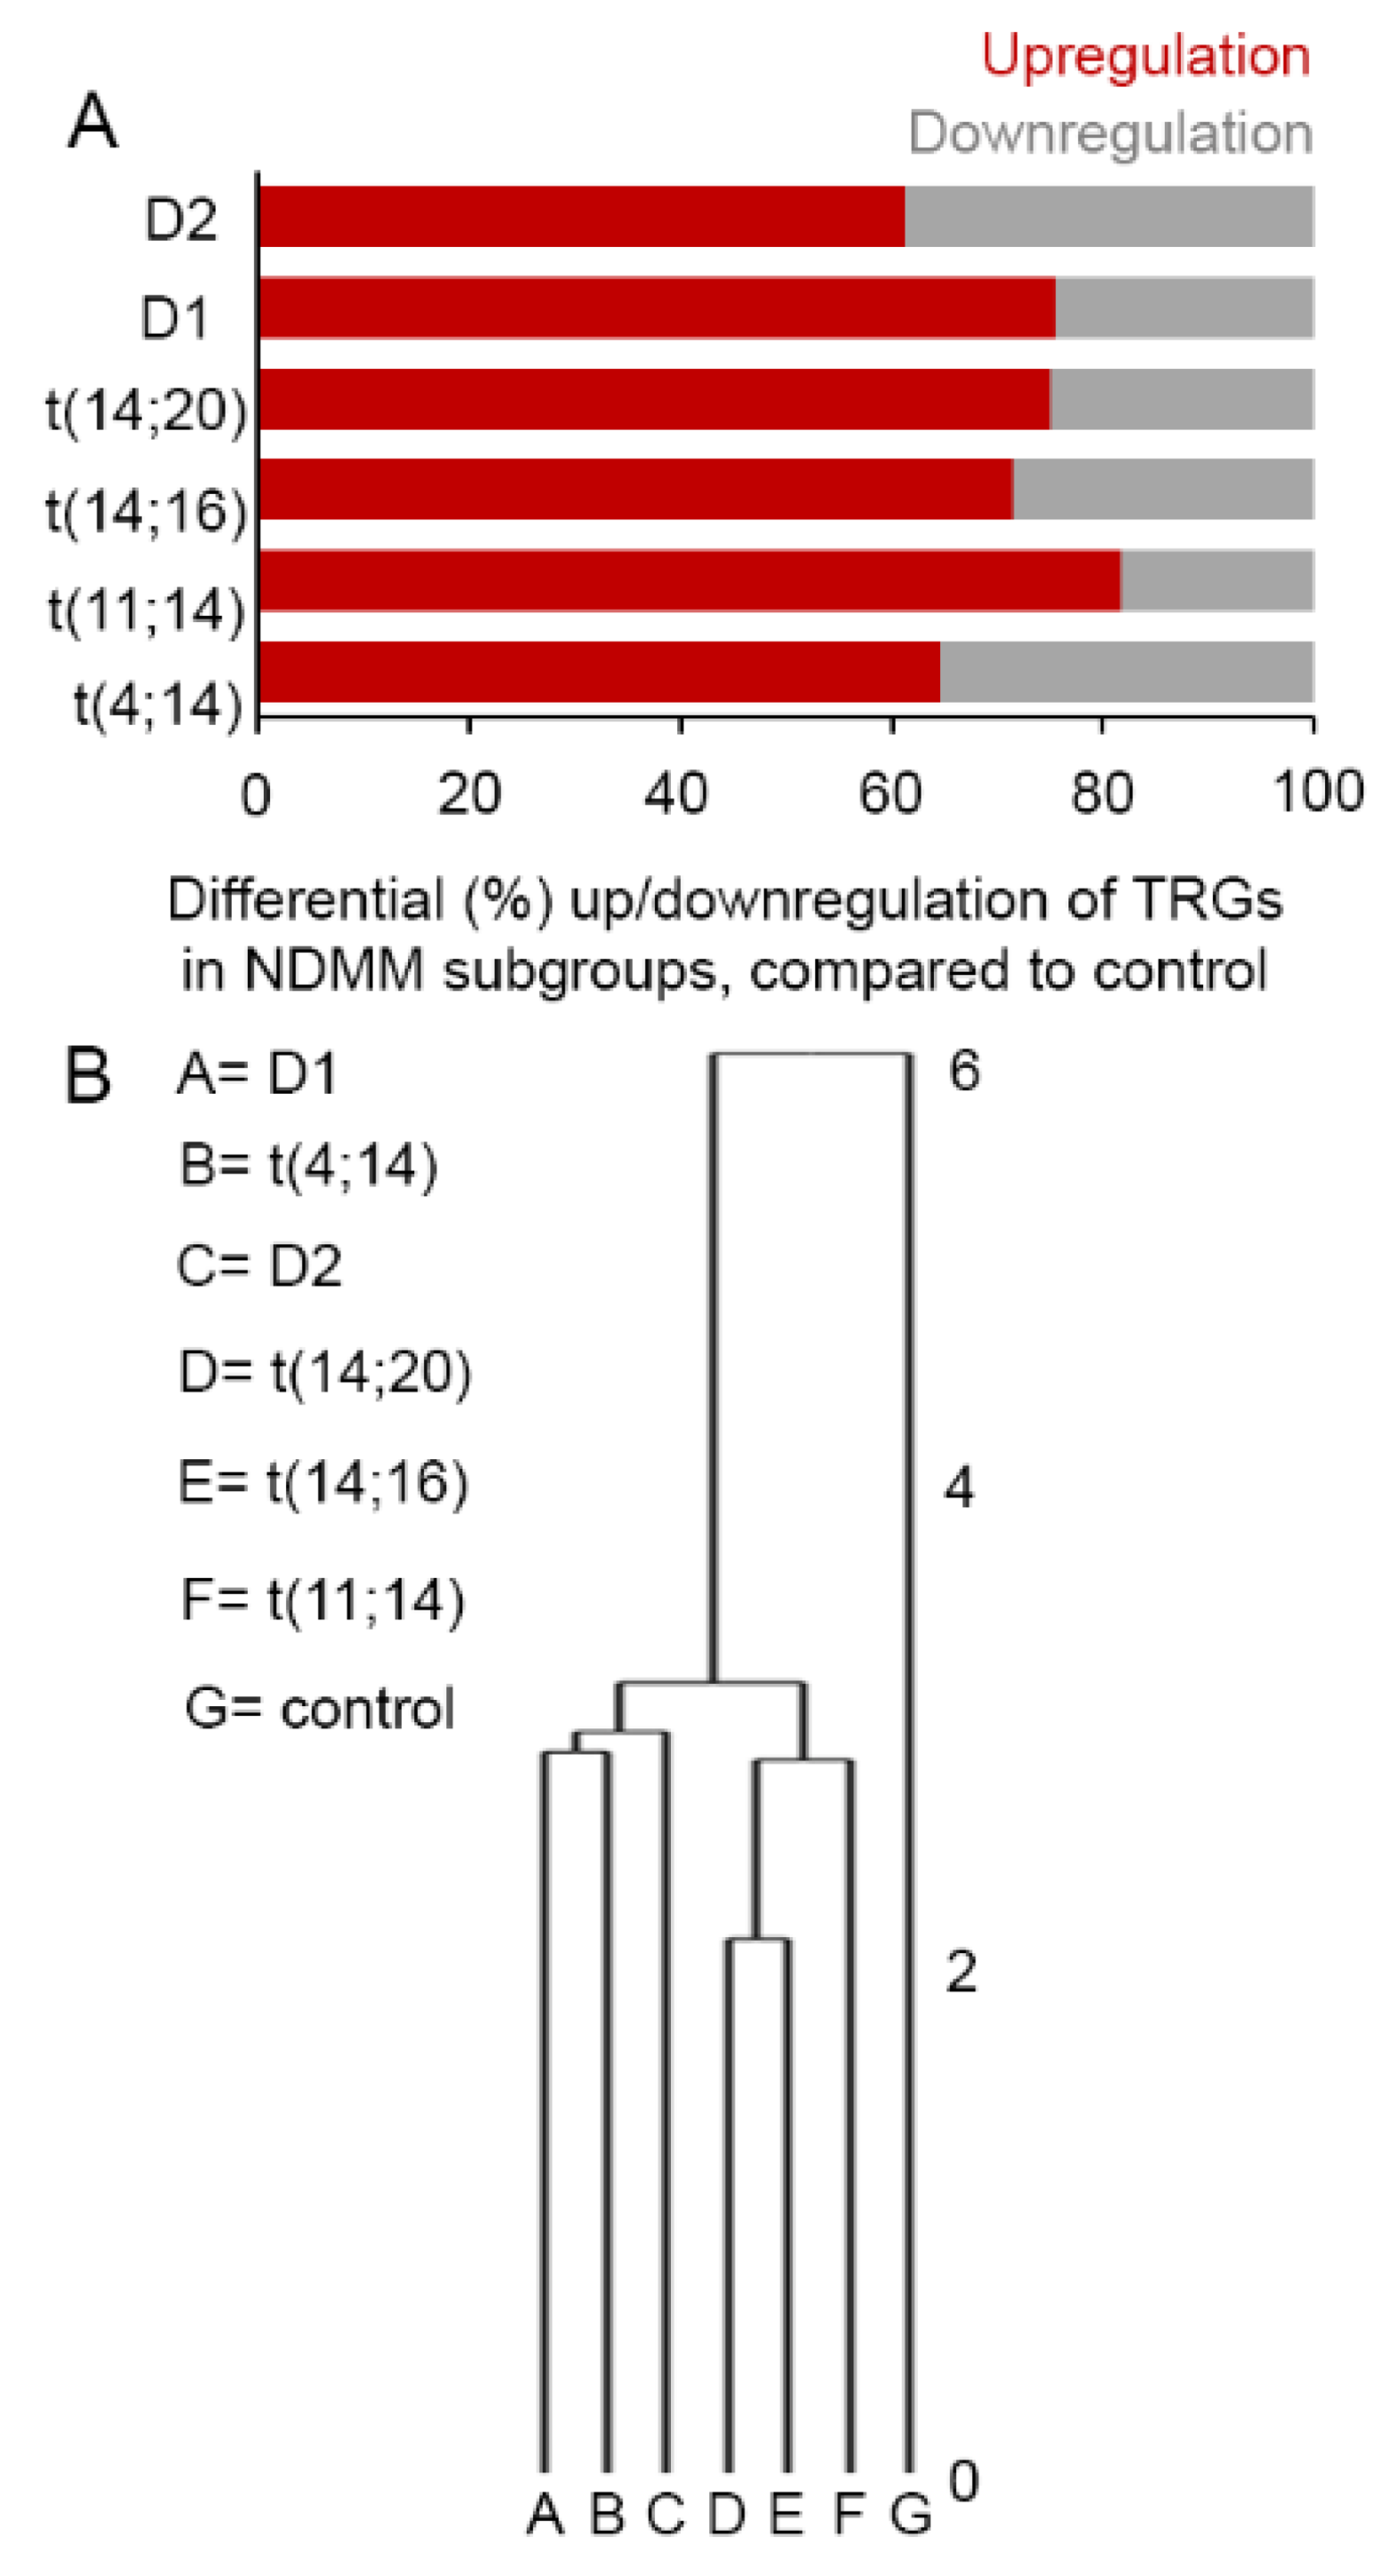
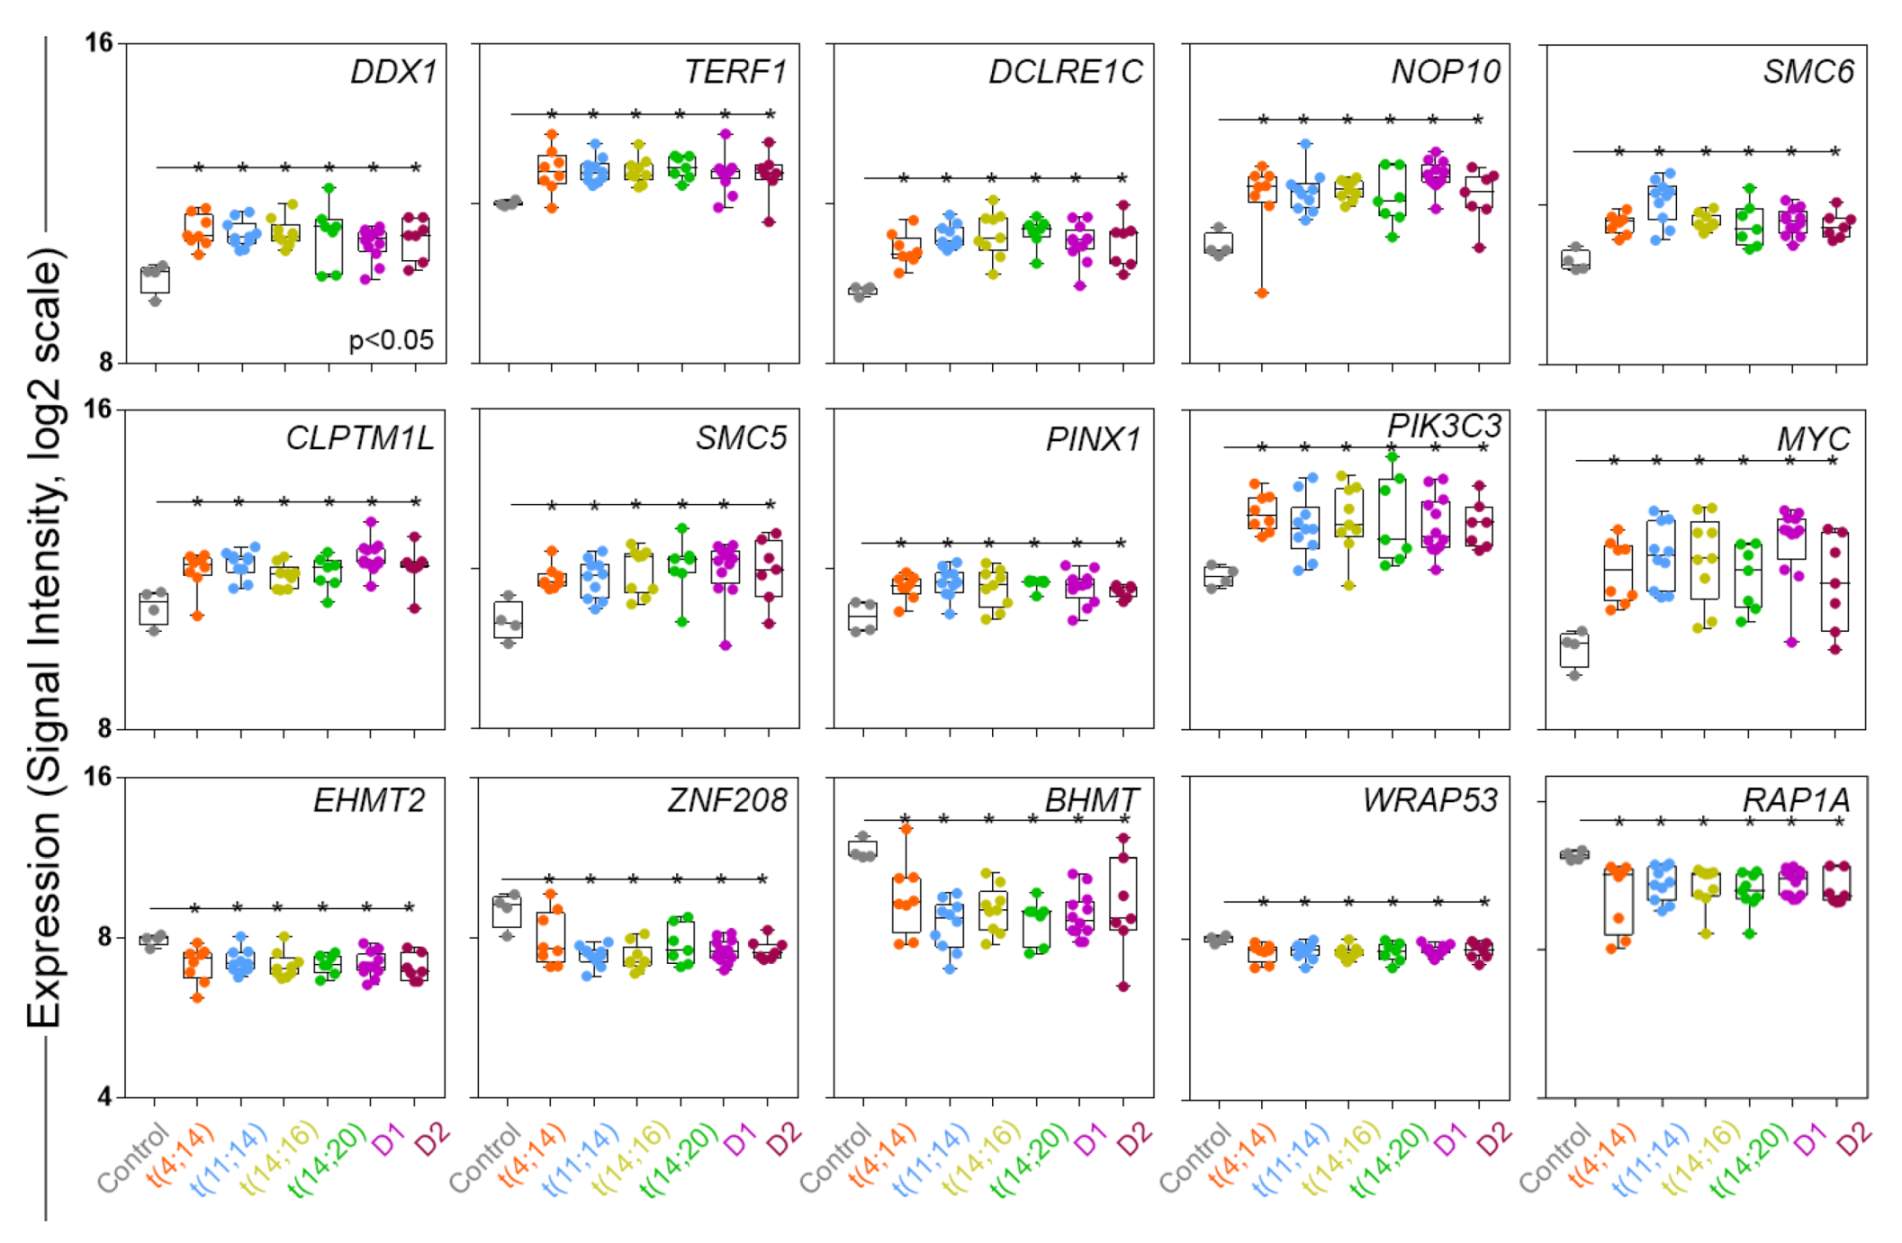
3.1. Selective TRGs Are Differentially Expressed in NDMM

First, we assessed differentially expressed TRGs (NDMM subgroups vs. control), which are involved in a multitude of intrinsic biological pathways including helicase, telomerase, shelterin-complex, DNA-repair, or related biosynthetic activities, as summarized elsewhere [29]. Differential expression of epigenetically regulated TRGs have also been reported in relation to their importance to the development of different types of cancer [34,35]. We aimed to evaluate the impact of 70 known TRGs in MM and observed a subgroup-specific differential expression pattern among the NDMM subgroups. [29]. For instance, we observed 65% (40/62) upregulated and 35% (22/62) downregulated TRGs in t(4;14), 82% (49/60) upregulated and 18% (11/60) downregulated TRGs in t(11;14), 71% (45/63) upregulated and 29% (19/63) downregulated TRGs in t(14;16), 75% (45/60) upregulated and 25% (15/60) downregulated TRGs in t(14;20), 75% (43/57) upregulated and 25% (14/57) downregulated TRGs in D1, and 61% (38/62) upregulated and 39% (24/62) downregulated TRGs in D2 subgroup (Figure 1A, Table S2). An unsupervised hierarchical clustering based on TRG-expression in NDMM subgroups revealed closest neighboring clusters between D1 and t(4;14) and between t(14;16) and t(14;20). The D2 remains equidistant to D1 and t(4;14), while t(11;14) remains equidistant to the t(14;16) and t(14;20) subgroups. In contrast, the control group formed a significantly distant cluster to all the NDMM subgroups (Figure 1B).
Next, we narrowed down a panel of TRGs, based on their significant (p < 0.05) and consistent differential expression across the NDMM subgroups compared to control. For instance, we observed an upregulation of helicase associated DEAD-box helicase 1, DDX1 (mean differential expression [DE] between NDMM subgroups and control, DE: 0.75, log2); shelterin-bound telomerase repeat binding factor 1, TERF1 (DE: 1.2, log2); NOP10 ribonucleoprotein, NOP10 (DE: 1.42, log2); DNA-repair related DNA cross-link repair 1C, DCLRE1C (DE: 1.32, log2); structural maintenance of chromosomes 5 and 6, SMC5 (DE: 1.73, log2) and SMC6 (DE: 1.34, log2); and other biological process related TRGs such as CLPTM1-like, CLPTM1L (DE: 0.87, log2); PIN2 (TERF1) interacting telomerase inhibitor 1, PINX1 (DE: 0.96, log2); phosphatidylinositol 3-kinase catalytic subunit type 3, PIK3C3 (DE: 0.61, log2); and MYC Proto-Oncogene, MYC (DE: 1.89, log2). In contrast, we observed downregulation of five TRGs across the NDMM subgroups, compared to control. For example, shelterin bound Ras-related protein 1A, RAP1A (DE: −0.7, log2); telomerase-associated WD repeat containing antisense to TP53, WRAP53 (DE: −0.37, log2); other TRGs such as euchromatic histone lysine methyltransferase 2, EHMT2 (DE: −0.9, log2); betaine-homocysteine S-methyltransferase, BHMT1 (DE: 0.79, log2); and zinc finger protein 208, ZNF208 (DE: −0.6, log2) were downregulated (Figure 2).
In summary, while TRG expression was typically variable across molecular NDMM subgroups, a cluster of TRGs was consistently differentially expressed in the major molecular subgroups of NDMM discussed here.

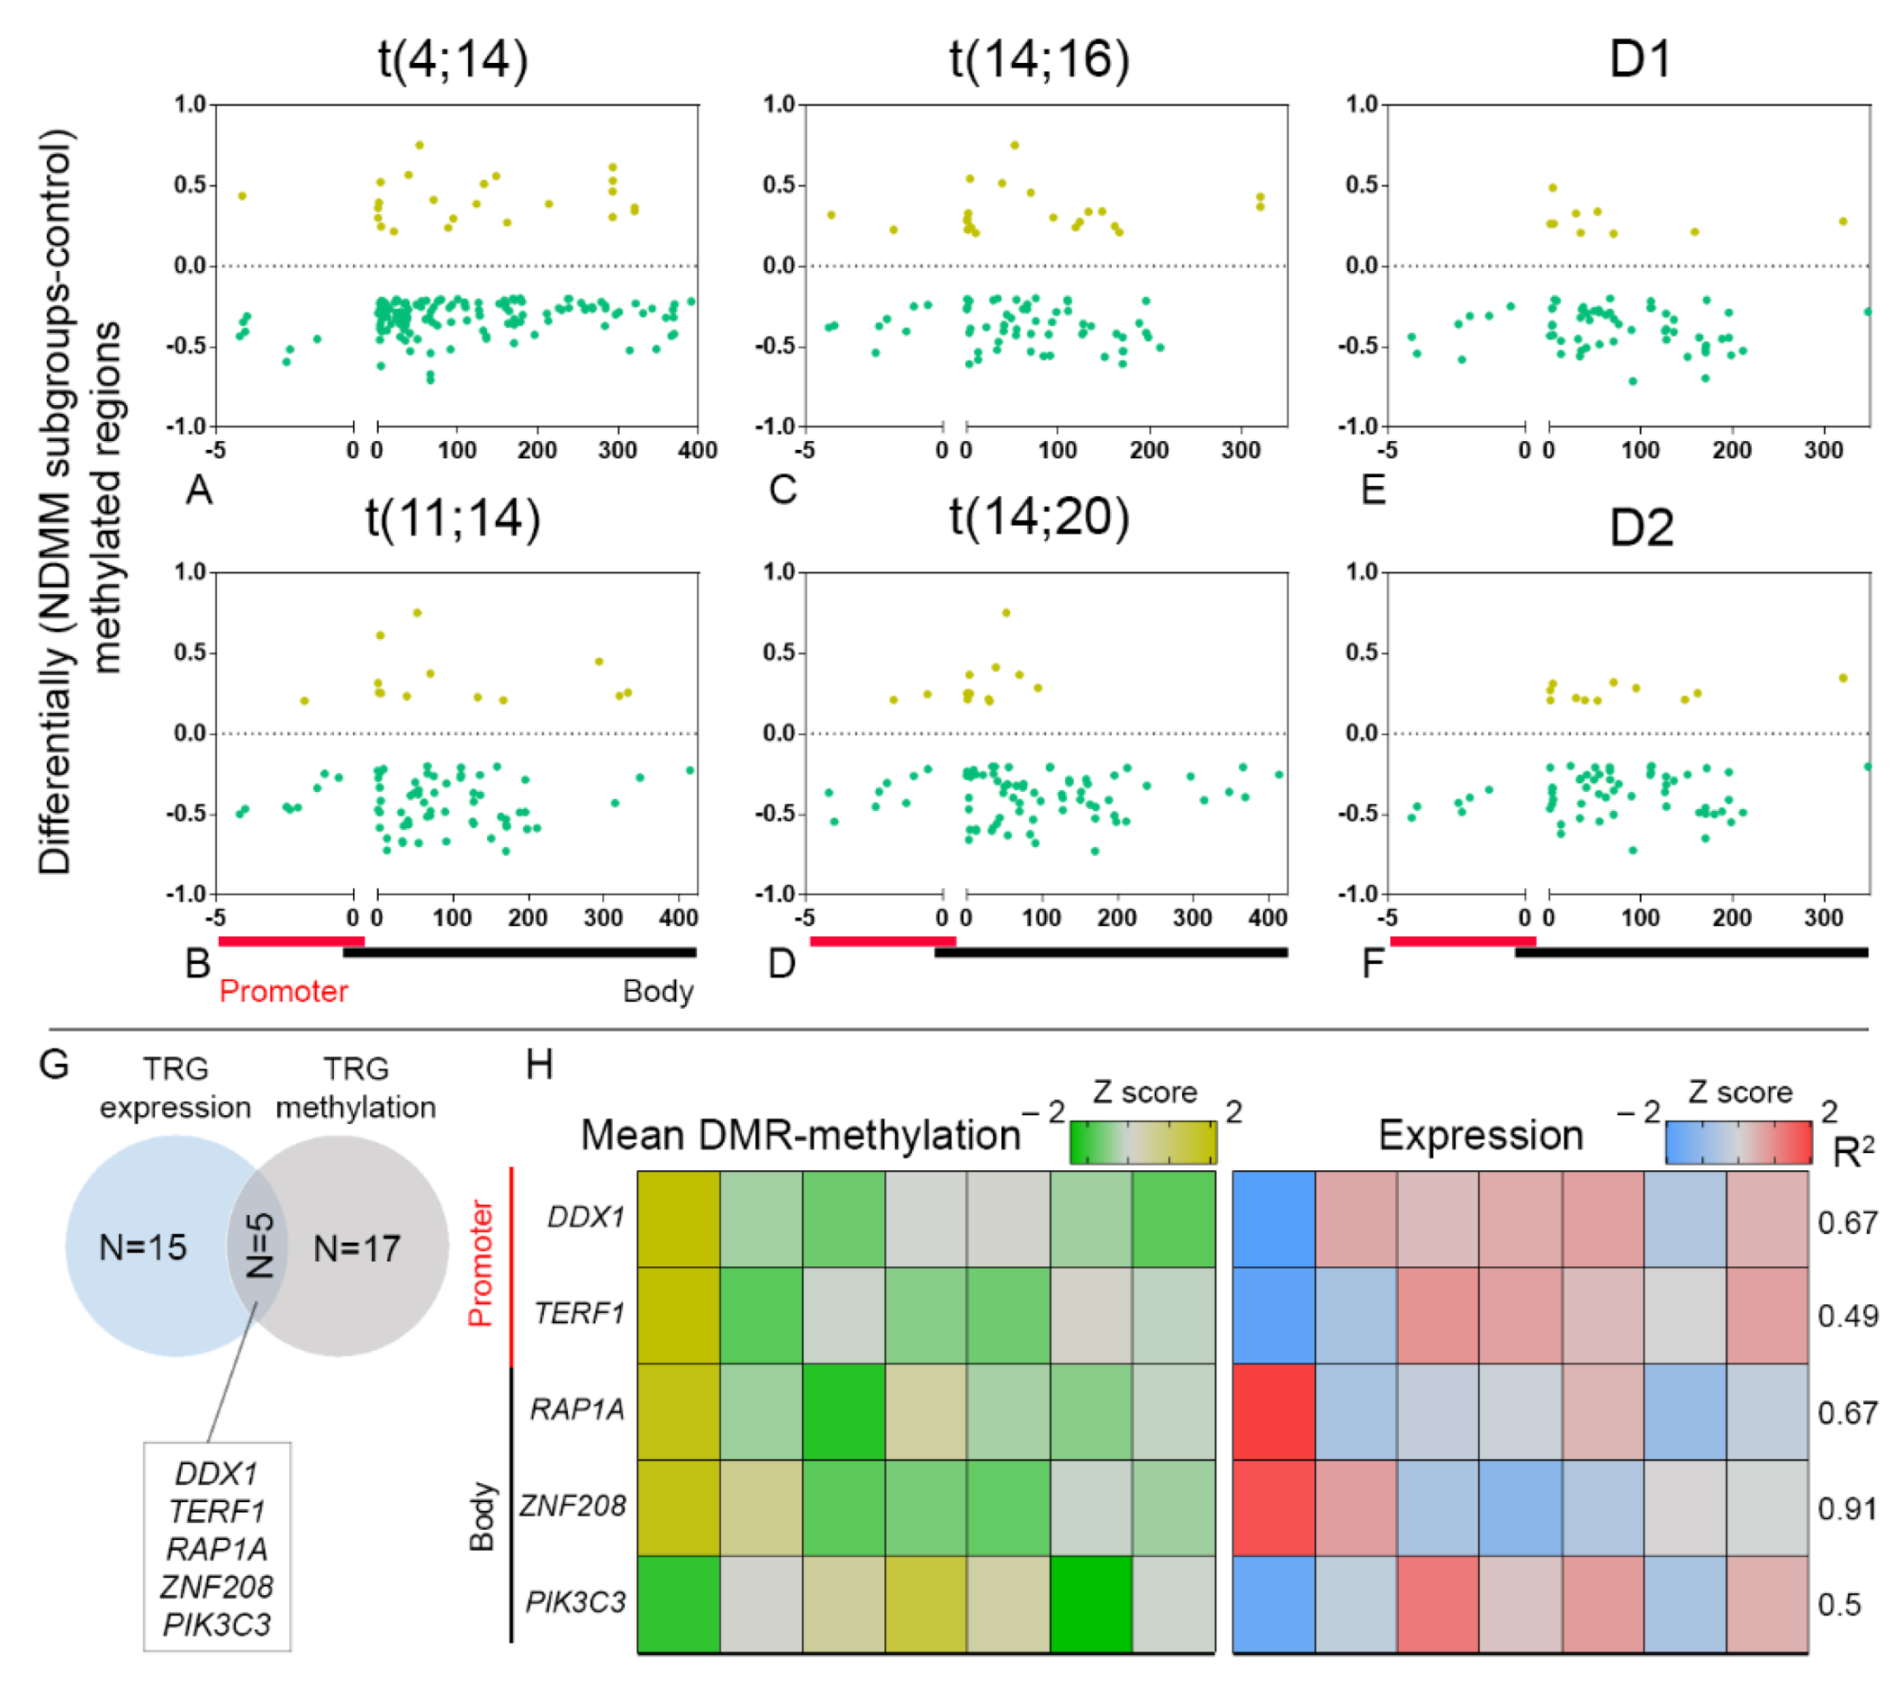
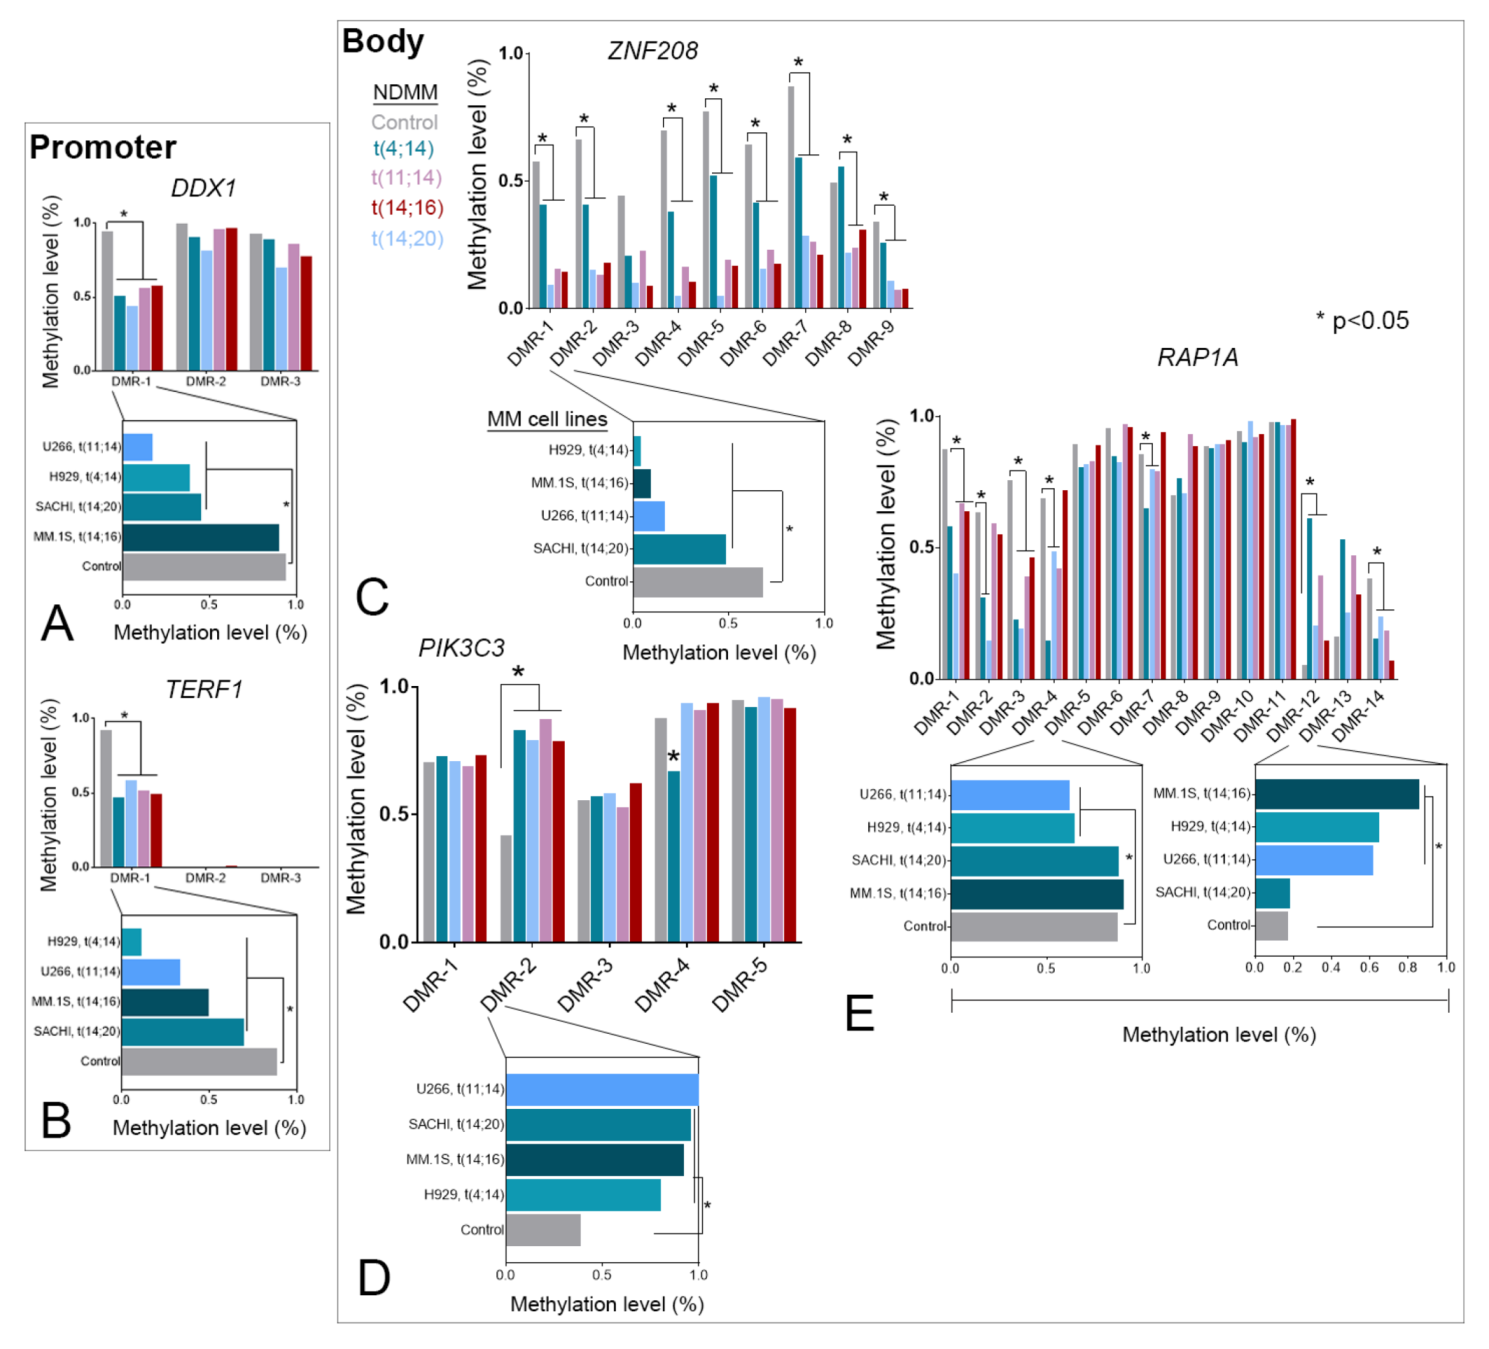
3.2. Selective TRGs Are Differentially Methylated and Tightly Correlated to Expression in NDMM

We analyzed significant DMRs (p < 0.05 differential methylation greater or less than 20% between NDMM and controls) of 70 known TRGs across their promoters and bodies as detected per NDMM subgroups. The gene bodies were found to have multiple DMRs of a representative gene, while TRGs at the promoters were typically represented with single DMRs. In general, the majority of DMRs in both the genomic regions were found hypomethylated across the subgroups. For instance, we observed 12% hypermethylated (1/8) and 88% hypomethylated (7/8) DMRs representing six unique TRGs at the promoters and 14% hypermethylated (21/146) and 86% hypomethylated (125/146) DMRs at the bodies, representing 30 unique TRGs in NDMM subgroup t(4;14) (Figure 3A, Table S3).
In t(11;14) subgroup, we observed 11% hypermethylated (1/9) and 89% hypomethylated (8/9) DMRs at the promoters, representing 9 unique TRGs and 16% hypermethylated (11/69) and 84% hypomethylated (58/69) DMRs at the bodies representing 18 unique TRGs (Figure 3B and Table S4). The t(14;16) and t(14;20) subgroups showed high similarities in number and distribution of DMRs across the promoters, having 20% hypermethylated (2/10) and 80% hypomethylated (8/10) DMRs, representing 10 unique TRGs. In contrast, subtle disparities were observed in DMR distribution at the bodies among the subgroups with 26% hypermethylated (18/70) and 74% hypomethylated (52/70) DMRs of the t(14;16) subgroup, representing 20 unique TRGs, and 13% hypermethylated (10/78) and 87% hypomethylated (68/78) DMRs of the t(14;20) subgroup, representing 23 unique TRGs (Figure 3C,D, Tables S5 and S6). Among HY, we observed 100% hypomethylated (7 in D1; 6 in D2) DMRs (also unique TRGs) in the promoters. In D1 subgroup, 13% hypermethylated (8/61) and 87% hypomethylated (53/61) DMRs were observed in the bodies representing 18 unique TRGs, while in D2, 18% hypermethylated (11/64) and 83% hypomethylated (53/64) DMRs were observed in the bodies representing 19 unique TRGs (Figure 3E,F, Tables S7 and S8).
Next, we focused on the TRGs that were differentially methylated in all the NDMM subgroups compared to control, and documented five TRGs at the promoters (such as DDX1, RAD54L, TP53BP1, MTR, and TERF1) and 12 TRGs at the bodies (ACYP2, DDB1, MAD1L1, MEN1, PIK3C3, PRMT8, RAP1A, RECQL4, RECQL5, RTEL1, TERT, and ZNF208). A subsequent intersection analysis containing differentially methylated and expressed TRGs among the subgroups revealed five TRGs (DDX1, PIK3C3, RAP1A, TERF1, and ZNF208) (Figure 3G), where expression is dependent on DNA-methylation. Next, we evaluated the correlation between methylation and expression of these genes and observed a strong negative correlation (R2) between methylation and expression for the promoter DMRs, as observed for TRGs such as DDX1 (R2 = 0.67) and TERF1 (R2 = 0.49). In contrast, strong positive correlations were observed between methylation and expression for the body DMRs representing TRGs such that RAP1A (R2 = 0.67) and ZNF208 (R2 = 0.91) were downregulated in accordance with hypomethylation, while PIK3C3 (R2 = 0.5) was upregulated in accordance with increase in methylation (Figure 3H). In summary, we demonstrated a robust correlation between DNA methylation and expression of selective TRGs, evident in the early stage of the disease.

3.3. TRG-Methylation Is Fairly Conserved between Patients with NDMM and MM Cell Lines

Epigenetic polymorphisms (including DNA methylation) among patients may significantly influence variations in therapeutic response and survival outcome [36,37]. CpG sites (cytosine and guanine occurring consecutively) that are crucial to the development or maintenance of a disease are typically well-conserved between patients and cell lines [38]. To investigate the importance of the TRG-DMRs, we further compared the DNA methylation level and distribution along DMRs between TC NDMM subgroups and representative MM cell lines. We compared the MDM across NDMM subgroups and MM cell lines compared to control. For example, DMR-1 (MDM = −0.42, p = 0.001 in NDMM; MDM = −0.46, p = 0.038 in MM lines) of DDX1 and DMR-1 (MDM = −0.4, p = 0.026 in NDMM; MDM = −0.47, p = 0.019 in MM lines) of TERF1 promoters were hypomethylated in both patients and cell lines (Figure 4A,B). Of nine DMRs at the body of ZNF208 in the NDMM subgroups, only DMR-2 was found consistently hypomethylated between patients (MDM = −0.44, p = 2.09 × 10⁻⁸) and cell lines (MDM = −0.48, p = 0.0411) (Figure 4C).
In contrast, DMR-2 of PIK3C3 was consistently hypermethylated in patients (MDM = 0.4, p = 0.0016) and cell lines (MDM = 0.53, p = 0.0022) (Figure 4D). For RAP1A, we observed 7 out of 14 significantly (p < 0.05) methylated DMRs in NDMM subgroups, of which DMR-1 through DMR-4 and DMR-14 were hypomethylated, and DMR-12 was hypermethylated (Figure 4E). However, we noticed that in DMR-2, only t(4;14) and t(14;20) subgroups were significantly (p < 0.05) hypomethylated compared to control. Another interesting observation from RAP1A was the disparity in methylation between DMRs in NDMM subgroups and MM cell lines, such that DMR-5 was not differentially methylated in NDMM subgroups (MDM = −0.05, p = 0.593), but was hypomethylated in MM cell lines (MDM = −0.21, p = 0.005). Additionally, compared to hypermethylation at DMR-12 in patients, DMR-13 was particularly hypermethylated in cell lines (MDM = 0.4, p = 0.0007). Noteworthy, TRGs were also consistently upregulated or downregulated between patients and cell lines. Cumulatively, we observed considerable similarities in the DNA methylation profile at selective DMRs that were consistent between NDMM subgroups and MM cell lines with few above-mentioned exceptions.

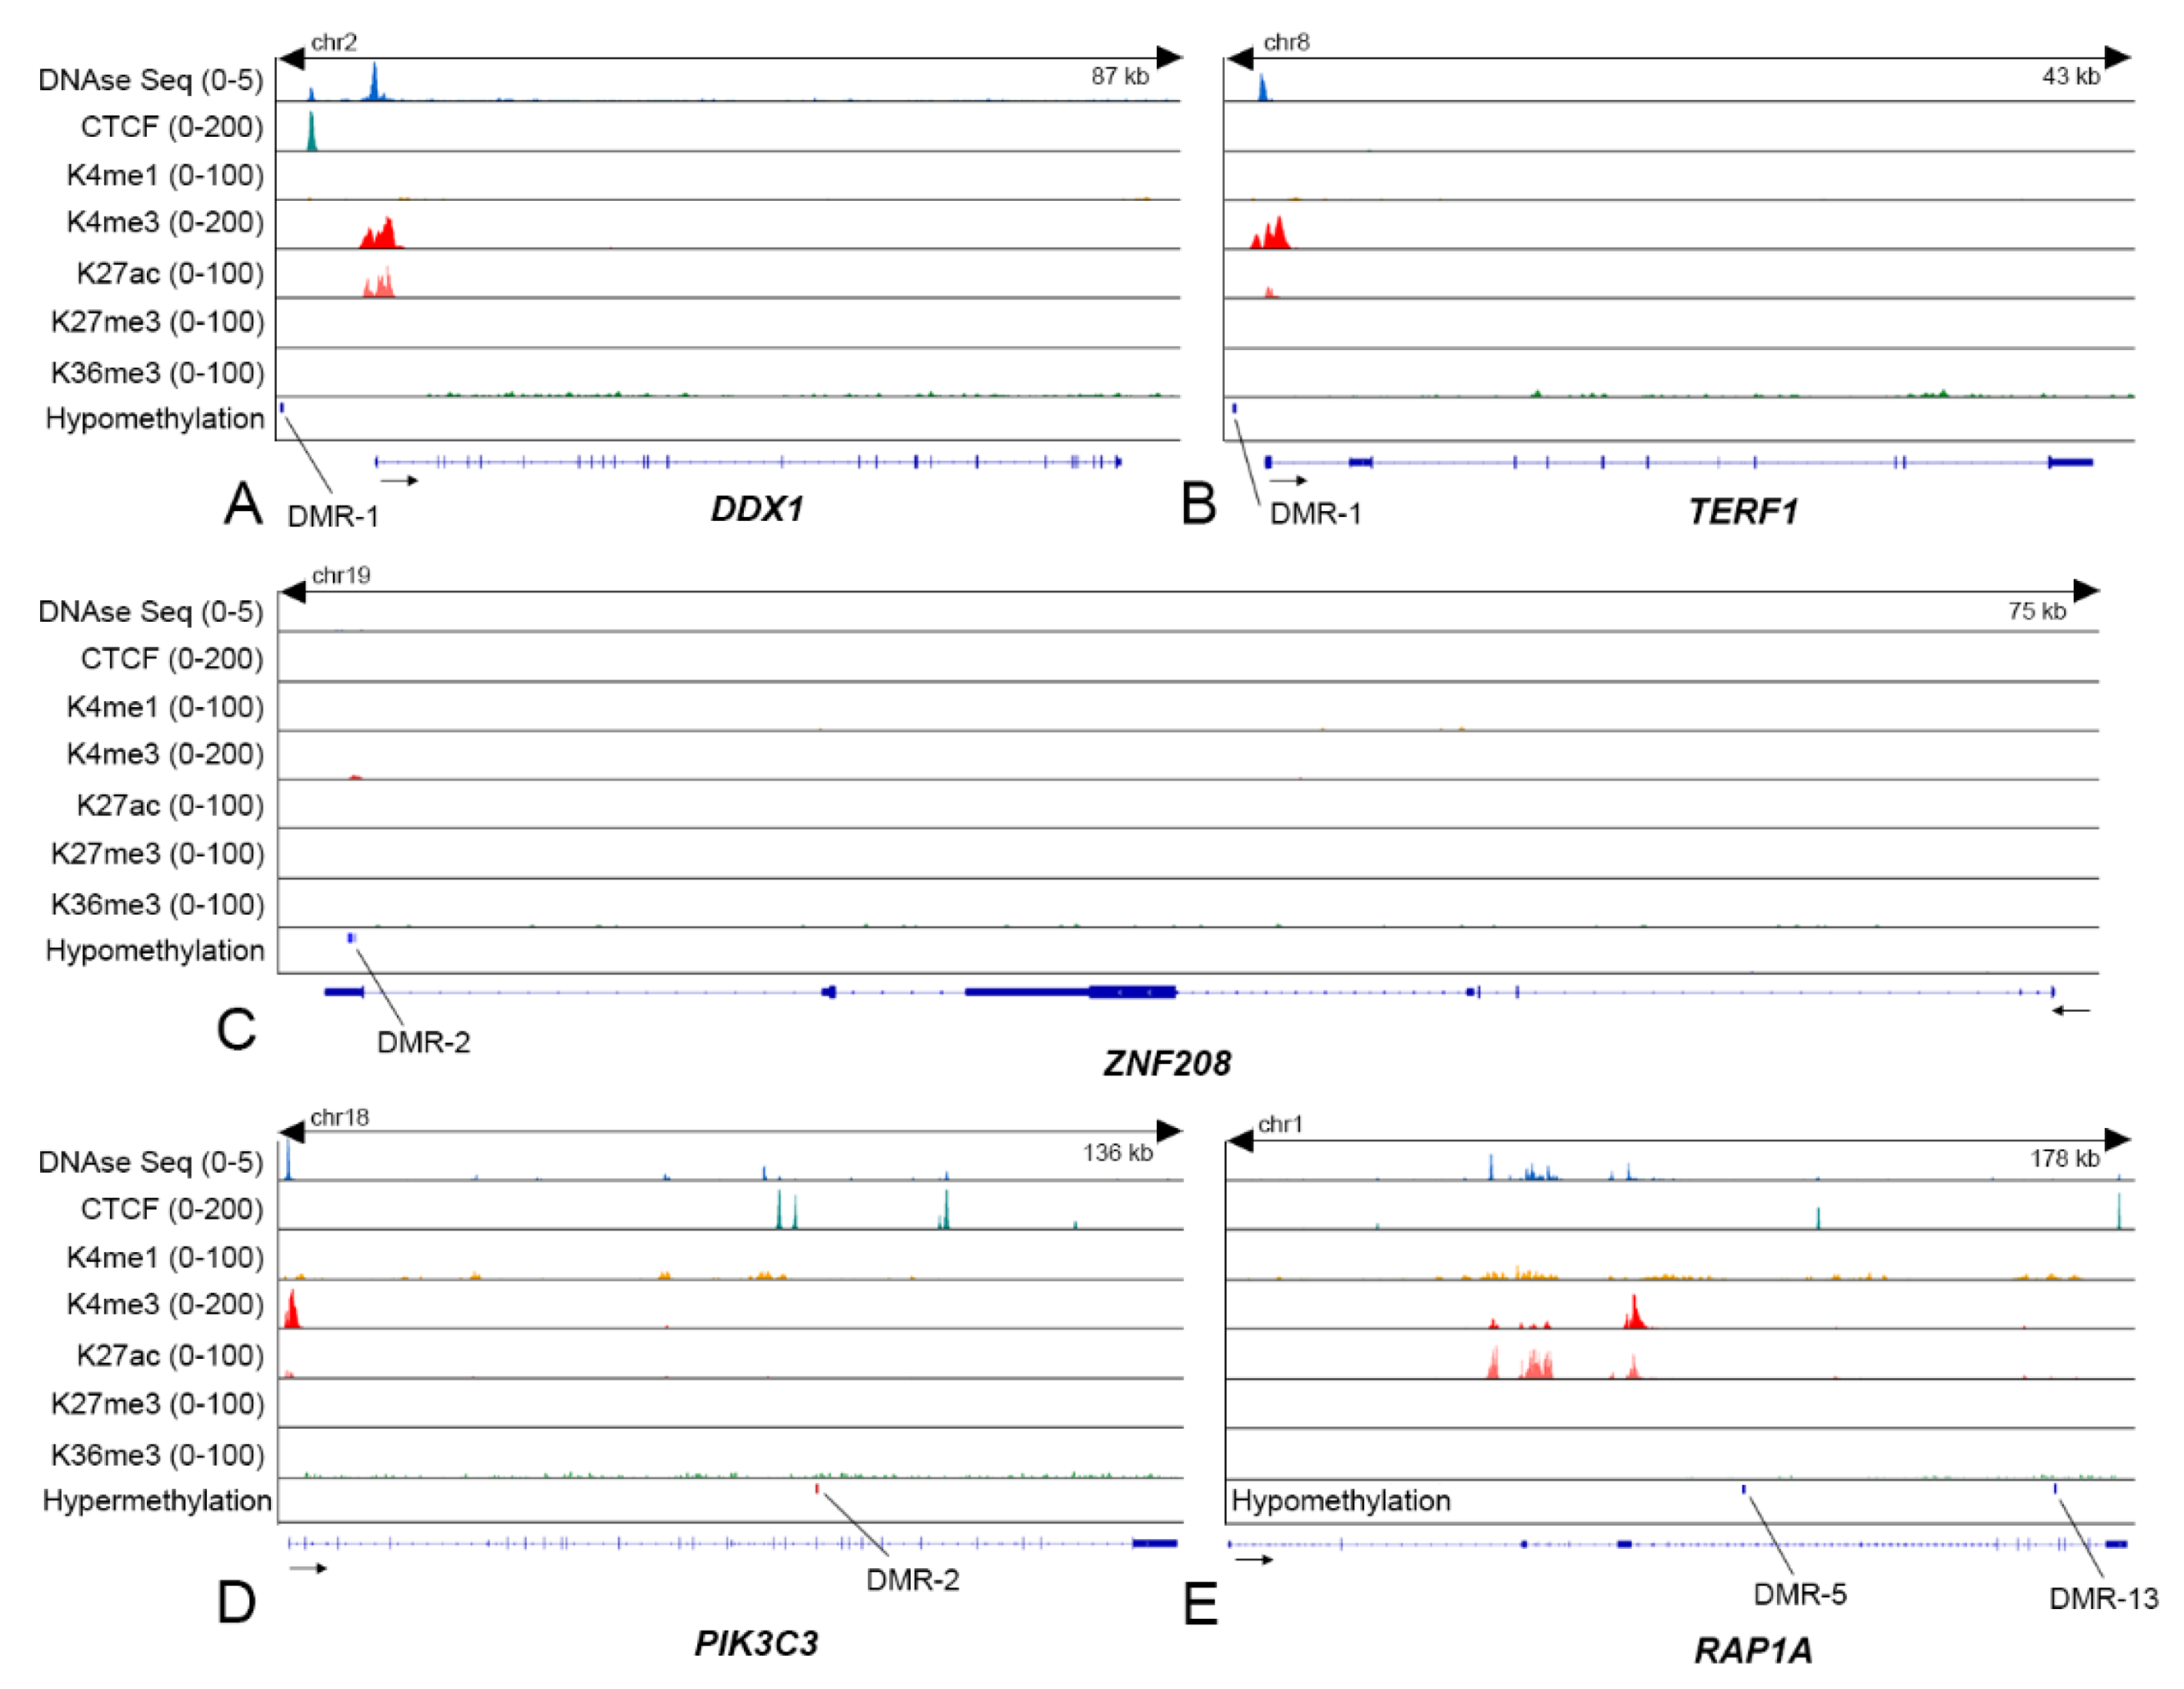
3.4. DNA Methylation Alone or Cooperatively with Chromatin Marks Regulates TRG Expression

We wanted to determine if the expression of TRGs was controlled by DNA methylation alone or in cooperation with other epigenetic factors, such as histone marks, TF binding, or chromatin state. Given the consistencies in DNA methylation across DMRs between NDMM subgroups and MM cell lines, we investigated the chromatin marks in the MM cell line H929, t(4;14) in reference to the DMRs of the NDMM patient-subgroups. We mapped proximities or overlaps between histone marks, CTCF binding sites, and open chromatin state to selective TRG-DMRs. For instance, a DMR (DMR-1 of DDX1) spanning base pairs 15,586,861 to 15,587,037 on chromosome 2 (chr2:15586861 to chr2:15587037) at 4.4 kb upstream of the TSS of DDX1, and a DMR (DMR-1 of TERF1) spanning chr8:73007342 to chr8:73007540 at 1.3 kb upstream of the TSS of TERF1 contained an abundance of activating histone H3K4me3 and relatively lesser enrichment for H3K27ac (Figure 5A,B). The chromatin adjacent to DMRs of both the genes was found in an open state, as evidenced from DNAse peaks. Additionally, a sharp CTCF peak was observed at the upstream TSS of DDX1. Hypomethylation at the promoters, coincident with activating histone marks and open chromatin state, explained upregulation of DDX1 (DE: 1.2, log2) and TERF1 (DE: 1.2, log2).
In contrast, hypomethylation observed at DMR-2 spanning chr19:21940986 to chr19:21941044, DMR-5 along the body of ZNF208 spanning chr1:111608116 to chr1:111608192, and DMR-13 spanning chr1:111689837 to chr1:111689970 across RAP1A gene-body were consistent with downregulation of ZNF208 (DE: −0.6, log2); and RAP1A (DE: −0.7, log2) (Figure 5C,E). While no prominent chromatin marks were found across the promoter or the body of ZNF208, subtle histone enrichments and open chromatin loci were observed in the body of RAP1A; however, were considerably distant (>5 kb) to the DMRs. In these two examples, DNA methylation is likely to control TRG expression, independently or with chromatin modifications. The DMR-2 spanning chr18:42024964 to chr18:42025106) of PIK3C3 was hypermethylated and proximal (<5 kb) to CTCF binding sites, which is consistent with upregulation (DE: 0.61, log2) of the gene (Figure 5D). Cumulative data demonstrated variable epigenetic regulations, linked to the TRG expression in the disease.

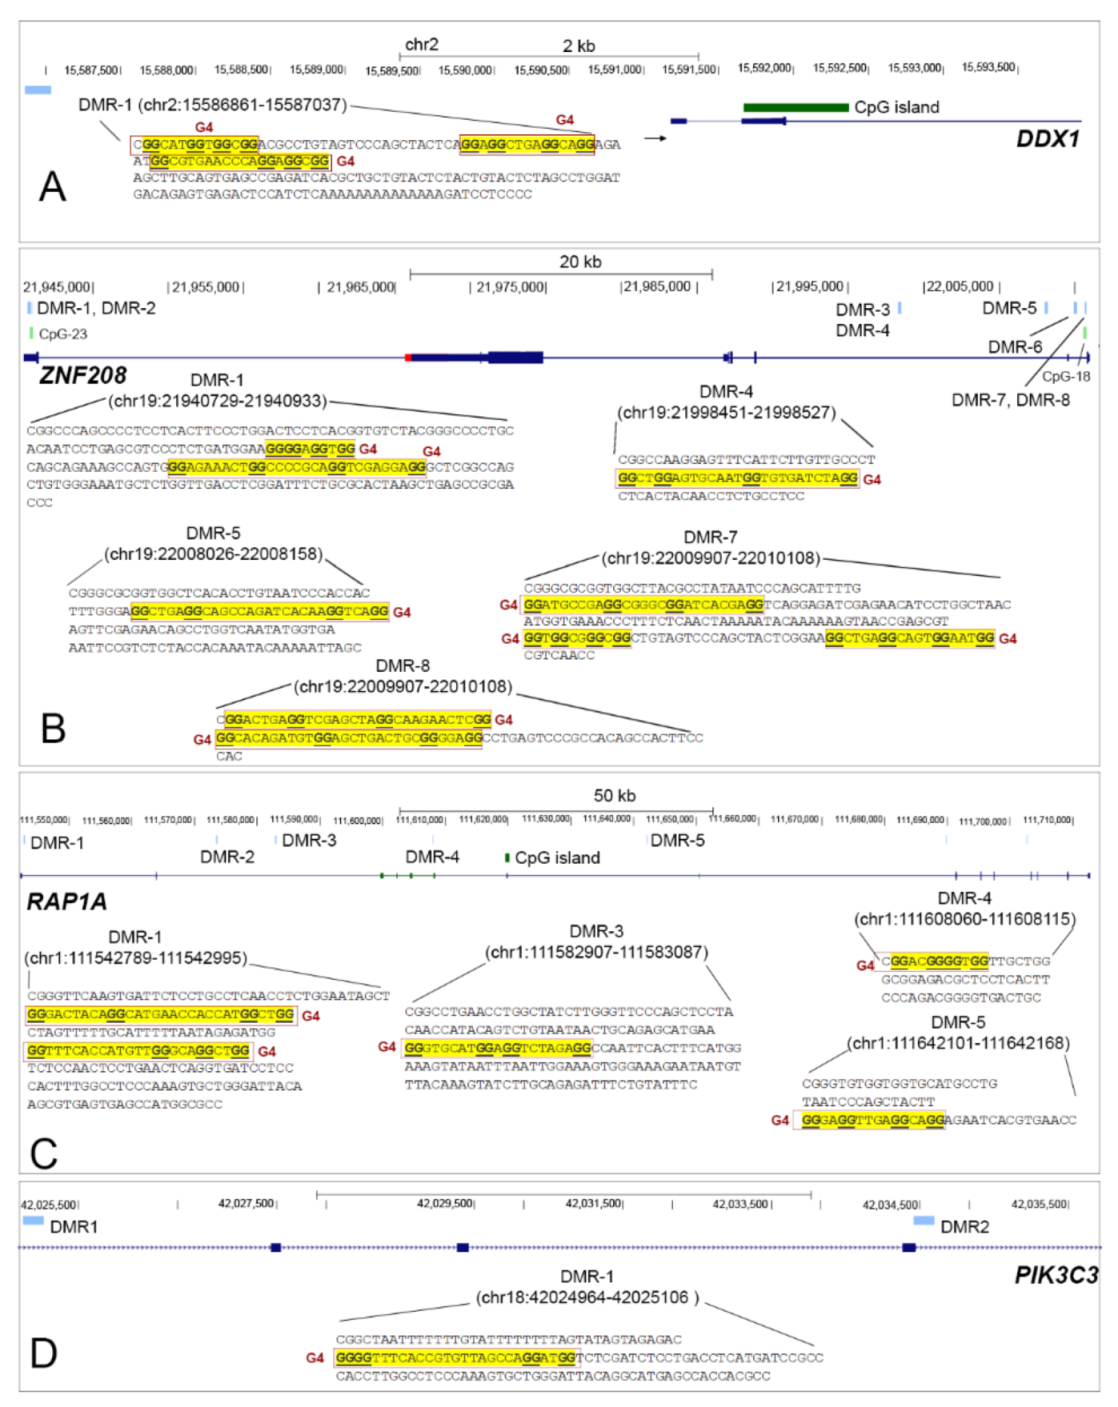
3.5. TRG Hypomethylated DMRs Are Stabilized with G-Quadruplexes

Given the fact that aberrantly hypomethylated genomic regions, enriched for G4FS have significant contributions to the genomic instabilities in cancer [39], we investigated overlaps of G4FS with the DMRs of TRGs to understand the possible impact of these genetic–epigenetic variants on sustaining stability of these TRG-related epigenetic risk-loci in the disease. We observed three G4FS overlapped with the hypomethylated DMR-1 (177 bp) at the promoter of DDX1 (Figure 6A), which also coincides to the open chromatin region.
However, no G4FS was found in the DMR-1 of TERF1. Nonetheless, similar to DDX1, frequent overlaps between G4FS and hypomethylated DMRs were found at the bodies of ZNF208 and RAP1A. For instance, 56% (5/9) of DMRs at the ZNF208 body were overlapped with G4FS, of which DMR-1 (205 bp) has two G4FS, DMR-4 (77 bp) has one G4FS, DMR-5 (133 bp) has one G4FS, DMR-7 (202 bp) has three G4FS, and DMR-8 has two G4FS (Figure 6B). For RAP1A, we observed 29% (4/14) overlap between G4FS and hypomethylated DMRs having two G4FS in DMR-1 (207 bp), one G4FS in DMR-3 (181 bp), one G4FS in DMR-4 (56 bp), and one G4FS in DMR-1 (143 bp) (Figure 6C). For PIK3C3, we observed a single G4FS, overlapped with the DMR-1 (143 bp), which was not significantly differently methylated across NDMM subgroups compared to control (Figure 6D). In summary, we have demonstrated that hypomethylated DMRs of selective TRGs are frequently stabilized by G4FS.

4. Discussion

To the best of our knowledge, this is the first study to report that DNA methylation alone, or in cooperation with chromatin state and histone marks, deregulate aberrant selective TRG expression in early-stage MM.
In general, the majority of TRGs in our NDMM cohort were differentially upregulated (81%) rather than downregulated (19%) across the subgroups. For instance, upregulation of the TRGs, such as DKC1, GAR1, NHP2, and NOP10, were found in several NDMM subgroups (Table S2), which is consistent to the previous finding where expression of these genes was progressively increased along with the development from MGUS to the MM stage [27]. In contrast, WRAP53, which is known to bind the Cajal body box of the telomerase RNA template component, was downregulated (DE: −0.37, log2). Reduced expression of WRAP53 has been previously correlated to attenuated DNA damage response and poor survival in ovarian and lung cancers [40,41], and suggests similar line of dysregulation in MM. Of the shelterin proteins, TERF1 was upregulated, while RAP1A was downregulated, which suggest defunct telomere maintenance, favorable of progression of the disease. In particular, TERF1 overexpression was found strongly correlated with TL and disease progression in gastric and renal carcinomas [42,43]. Another interesting finding from the TRG expression profile was the upregulation of 3 (DCLRE1C, SMC5, and SMC6) of 15 detected repair related TRGs in NDMM subgroups compared to control. DNA-repair genes have previously been found to be upregulated in response to chemotherapy and radiotherapy in a number of cancers including melanoma manifested with metastasis [44,45]. In summary, the TRG expression profile suggests an involvement of a compromised DNA-repair mechanism machinery, coincident with a dysfunctional telomere maintenance in the disease.
Next, we found a strong correlation (R2 ≥ 0.5) between DNA methylation and expression of five TRGs. In comparison to the previous studies, where DNA methylation changes at individual CpGs were correlated to changes in TRGs expression, we considered all significant DMRs along regulatory regions of the TRGs to determine the methylation–expression relationship in MM [29]. Moreover, we have investigated the role of differential methylation at both the promoters and the bodies of TRGs, considering a unique crucial role of the regulatory regions on gene expression [46,47]. We observed the promoter of DDX1 and TERF1 was hypomethylated, where DMRs of both genes were proximal to H3K4me3 and H3K27ac enriched TSS. This corroborates the fact that hypomethylation at the promoter functions cooperatively with activating chromatin marks to facilitate binding of TFs to upregulate these oncogenes. This seems more reliable given the appearance of DNAse peaks suggesting open chromatin state on the genes. Additionally, we observed CTCF binding to the DDX1 promoter. This could be explained with colocalization of CTCF with the promoter bound H3K4me3 or H3K27ac regarding upregulation of the gene [48]. We also observed a strong positive correlation between DNA methylation and expression at the bodies, such that RAP1A and ZNF208 were downregulated, consistent with hypomethylation across the body DMRs, while PIK3C3 was upregulated, consistent with hypermethylation across the body DMRs. This finding is highly fascinating because aberrant upregulation of several oncogenic TRGs is complemented with epigenetic silencing of two key tumor suppressors, RAP1A and ZNF208 [49,50,51]. Additionally, gene-body DNA methylation was found as a principal determinant of expression because DMRs were not overlapped or proximal (>5 kb) to any regulatory histone marks or CTCF binding sites at open chromatin regions.
Our study provides a potential mechanistic insight of robust epigenetic control of TRG expression in patients with NDMM, which could be considered as potential early-detection biomarkers and therapeutic targets for the disease. The DMRs, as observed in the NDMM subgroups might also have a profound role in the progression of the disease, as we found several of these DMRs to be conserved between NDMM subgroups and MM cell lines, which represent a terminal differentiation stage of the disease. However, we found a relatively higher degree of hypermethylation and hypomethylation in the cell lines compared to the patient-derived samples. We also found a general trend of hypomethylation (except for PIK3C3) in TRG-DMRs, which were frequently overlapped with G4FS. Our findings are in alignment with previous findings that G4FS may stabilize and conserve CpG sites at hypomethylated states by inhibiting DNA methyltransferase 1 enzymatic activity, which in turn facilitates enhanced DNA breakpoints or chromatin accessibility [39,52,53].
In summary, we have identified a number of crucial epigenetic risk-loci that might play crucial roles in TRG dysfunctions and overall development of the disease. These epigenetic risk-loci are consistently deregulated in NDMM subgroups and detectable at the early stage of the disease. However, future study needs further expansion with inclusion of subjects from different disease stages (such as premalignant MGUS, transient SMM, and MM with patients from relapsed and refractory cohorts) to compare dynamics of epigenetic alterations at TRG loci. Finally, given the advancement in sequencing techniques to accurately match the DNA methylation profile of cell-free DNA to the tissues and cell types, it could serve as a noninvasive screening platform for epigenetic biomarkers in patients with MM [54].

5. Conclusions

We have identified a 5 TRG panels, tightly regulated with epigenetic modifications such as DNA methylation, chromatin modifications, or G4FS in patients with NDMM. Using clustered regularly interspaced short palindromic repeats (CRISPR) tools, it would be highly interesting to investigate whether conditional alterations in DNA methylation or chromatin marks on these TRGs could alter gene expression, TL and inhibit overall progression of the disease. Investigations of epigenetically deregulated TRG pathways are also expected to provide valuable information for developing novel chemotherapies and immunotherapies in MM.

Supplementary Materials

The following are available online at https://www.mdpi.com/article/10.3390/cancers13246348/s1, Table S1: Demographic features of patients with NDMM, Table S2: Median expression of TRG transcripts in major molecular subgroups of patients with NDMM, Table S3: Differential methylation across the promoter and the body of TRGs in t(4;14) subgroup, Table S4: Differential methylation across promoter and body of TRGs in t(11;14) subgroup, Table S5: Differential methylation across promoter and body of TRGs in t(14;16) subgroup, Table S6: Differential methylation across promoter and body of TRGs in t(14;20) subgroup, Table S7: Differential methylation across promoter and body of TRGs in D1 subgroup, Table S8: Differential methylation across promoter and body of TRGs in D2 subgroup.

Author Contributions

S.R.C. conceptualized the work and wrote the manuscript. S.R.C. performed and analyzed DNA methylation. The omics data was annotated and further analyzed by C.A. and S.R.C., F.Z. and F.v.R. helped in identifying, characterizing, and selecting NDMM patient samples. All co-authors contributed to the final version of the manuscript. All authors have read and agreed to the published version of the manuscript.

Funding

S.R.C. is supported with the Winthrop P Rockefeller Cancer Institute (280-3013173), and Arkansas Children’s Research Institute (GR037166), University of Arkansas for Medical Sciences new investigator startup grants.

Institutional Review Board Statement

This study was approved by the Institutional Review Board of the University of Arkansas for Medical Sciences under protocol number 260284, date of approval 9 November 2021.

Informed Consent Statement

Informed consent was obtained from all subjects involved in the study.

Data Availability Statement

The datasets used and/or analyzed during the current study are available from the corresponding author and with permission of University of Arkansas for Medical Sciences on reasonable request.

Acknowledgments

The authors acknowledge the participants who generously gave their time to the study. UAMS Myeloma Center foundation grant is acknowledged for the generous fund support. Authors are thankful to Yan Xiao and Geethamary Gerad in the accessioning lab for their instrumental support in the acquisition and processing the patients’ samples, Ruslana Tytarenko and Purvi Patel, who processed part of the methylation and gene expression array, and Yan Wang, who helped CA in annotating RRBS data for the present study.

Conflicts of Interest

The authors declare they have no competing interest.

Abbreviations

ChIP-seq Chromatin immunoprecipitation sequencing
CTCFCCCTC binding factor
DMRDifferentially methylated region
FCFold change
FDRFalse discovery rate
G4FSG-quadruplex forming sequences
hTERTTelomerase reverse transcriptase encoding gene
HYHyperdiploidy
IgHImmunoglobulin heavy chain locus
MDMmean DMR methylation
MGUSMonoclonal gammopathy of undetermined significance
MMMultiple Myeloma
NDMMNewly diagnosed multiple myeloma
QGRSQuadraples forming G-rich sequences
RRBSReduced representation bisulfite sequencing
SMMSmoldering multiple myeloma
TCTranslocation
TFTranscription factor
TLTelomere length
TRGTelomere-related gene
TSSTranscription start site

References

  1. Morgan, G.J.; Walker, B.A.; Davies, F.E. The genetic architecture of multiple myeloma. Nat. Rev. Cancer 2012, 12, 335–348. [Google Scholar] [CrossRef]
  2. Giaccherini, M.; Macauda, A.; Orciuolo, E.; Rymko, M.; Gruenpeter, K.; Dumontet, C.; Raźny, M.; Moreno, V.; Buda, G.; Beider, K.; et al. Genetically determined telomere length and multiple myeloma risk and outcome. Blood Cancer J. 2021, 11, 74. [Google Scholar] [CrossRef]
  3. Choudhury, S.R.; Ashby, C.; Tytarenko, R.; Bauer, M.; Wang, Y.; Deshpande, S.; Den, J.; Schinke, C.; Zangari, M.; Thanendrarajan, S. The functional epigenetic landscape of aberrant gene expression in molecular subgroups of newly diagnosed multiple myeloma. J. Hematol. Oncol. 2020, 13, 1–15. [Google Scholar] [CrossRef]
  4. Dimopoulos, K.; Gimsing, P.; Grønbæk, K. The role of epigenetics in the biology of multiple myeloma. Blood Cancer J. 2014, 4, e207–e207. [Google Scholar] [CrossRef]
  5. Dumontet, C.; Landi, S.; Reiman, T.; Perry, T.; Plesa, A.; Bellini, I.; Barale, R.; Pilarski, L.; Troncy, J.; Tavtigian, S. Genetic polymorphisms associated with outcome in multiple myeloma patients receiving high-dose melphalan. Bone Marrow Transplant. 2010, 45, 1316–1324. [Google Scholar] [CrossRef] [Green Version]
  6. Blackburn, E.H. Switching and signaling at the telomere. Cell 2001, 106, 661–673. [Google Scholar] [CrossRef] [Green Version]
  7. Bekaert, S.; De Meyer, T.I.M.; Van Oostveldt, P. Telomere Attrition as Ageing Biomarker. Anticancer Res. 2005, 25, 3011. [Google Scholar]
  8. Lee, M.; Hills, M.; Conomos, D.; Stutz, M.D.; Dagg, R.A.; Lau, L.M.; Reddel, R.R.; Pickett, H.A. Telomere extension by telomerase and ALT generates variant repeats by mechanistically distinct processes. Nucleic Acids Res. 2014, 42, 1733–1746. [Google Scholar] [CrossRef] [Green Version]
  9. Reddel, R.R. Alternative lengthening of telomeres, telomerase, and cancer. Cancer Lett. 2003, 194, 155–162. [Google Scholar] [CrossRef]
  10. Hou, L.; Zhang, X.; Gawron, A.J.; Liu, J. Surrogate tissue telomere length and cancer risk Shorter or Longer? Cancer Lett. 2012, 319, 130–135. [Google Scholar] [CrossRef]
  11. Wentzensen, I.M.; Mirabello, L.; Pfeiffer, R.M.; Savage, S.A. The association of telomere length and cancer a meta-analysis. Cancer Epidemiol. Prev. Biomark. 2011, 20, 1238–1250. [Google Scholar] [CrossRef] [Green Version]
  12. Campa, D.; Mergarten, B.; De Vivo, I.; Boutron-Ruault, M.-C.; Racine, A.; Severi, G.; Nieters, A.; Katzke, V.A.; Trichopoulou, A.; Yiannakouris, N. Leukocyte telomere length in relation to pancreatic cancer risk a prospective study. Cancer Epidemiol. Prev. Biomark. 2014, 23, 2447–2454. [Google Scholar] [CrossRef] [Green Version]
  13. Campa, D.; Martino, A.; Varkonyi, J.; Lesueur, F.; Jamroziak, K.; Landi, S.; Jurczyszyn, A.; Marques, H.; Andersen, V.; Jurado, M. Risk of multiple myeloma is associated with polymorphisms within telomerase genes and telomere length. Int. J. Cancer 2015, 136, E351–E358. [Google Scholar] [CrossRef] [Green Version]
  14. Hyatt, S.; Jones, R.E.; Heppel, N.H.; Grimstead, J.W.; Fegan, C.; Jackson, G.H.; Hills, R.; Allan, J.M.; Pratt, G.; Pepper, C.; et al. Telomere length is a critical determinant for survival in multiple myeloma. Br. J. Haematol. 2017, 178, 94–98. [Google Scholar] [CrossRef] [Green Version]
  15. Wu, K.D.; Orme, L.M.; Shaughnessy, J.; Jacobson, J., Jr.; Barlogie, B.; Moore, M.A. Telomerase and telomere length in multiple myeloma correlations with disease heterogeneity, cytogenetic status, and overall survival. Blood 2003, 101, 4982–4989. [Google Scholar] [CrossRef]
  16. Cottliar, A.; Pedrazzini, E.; Corrado, C.; Engelberger, M.I.; Narbaitz, M.; Slavutsky, I. Telomere shortening in patients with plasma cell disorders. Eur. J. Haematol. 2003, 71, 334–340. [Google Scholar] [CrossRef]
  17. Rangel-Pozzo, A.; Yu, P.L.I.; LaL, S.; Asbaghi, Y.; Sisdelli, L.; Tammur, P.; Tamm, A.; Punab, M.; Klewes, L.; Louis, S.; et al. Telomere Architecture Correlates with Aggressiveness in Multiple Myeloma. Cancers 2021, 13, 1969. [Google Scholar] [CrossRef]
  18. Brennan, S.K.; Wang, Q.; Tressler, R.; Harley, C.; Go, N.; Bassett, E.; Huff, C.A.; Jones, R.J.; Matsui, W. Telomerase Inhibition Targets Clonogenic Multiple Myeloma Cells through Telomere Length-Dependent and Independent Mechanisms. PLoS ONE 2010, 5, e12487. [Google Scholar] [CrossRef]
  19. Shammas, M.A.; Koley, H.; Bertheau, R.C.; Neri p Fulciniti, M.; Tassone p Blotta, S.; Protopopov, A.; Mitsiades, C.; Batchu, R.B. Telomerase inhibitor GRN163L inhibits myeloma cell growth in vitro and in vivo. Leukemia 2008, 22, 1410–1418. [Google Scholar] [CrossRef]
  20. Akiyama, M.; Hideshima, T.; Hayashi, T.; Tai, Y.T.; Mitsiades, C.S.; Mitsiades, N.; Chauhan, D.; Richardson p Munshi, N.C.; Anderson, K.C. Cytokines modulate telomerase activity in a human multiple myeloma cell line. Cancer Res. 2002, 62, 3876–3882. [Google Scholar]
  21. Weiss, C.; Uziel, O.; Wolach, O.; Nordenberg, J.; Beery, E.; Bulvick, S.; Kanfer, G.; Cohen, O.; Ram, R.; Bakhanashvili, M.; et al. Differential downregulation of telomerase activity by bortezomib in multiple myeloma cells-multiple regulatory pathways in vitro and ex vivo. Br. J. Cancer 2012, 107, 1844–1852. [Google Scholar] [CrossRef]
  22. Mirabello, L.; Yu, K.; Kraft p De Vivo, I.; Hunter, D.J.; Prescott, J.; Wong, J.Y.; Chatterjee, N.; Hayes, R.B.; Savage, S.A. The association of telomere length and genetic variation in telomere biology genes. Hum. Mutat. 2010, 31, 1050–1058. [Google Scholar] [CrossRef] [Green Version]
  23. Choudhury, S.R.; Cui, Y.; Milton, J.R.; Li, J.; Irudayaraj, J. Selective increase in subtelomeric DNA methylation an epigenetic biomarker for malignant glioma. Clin. Epigenet. 2015, 7, 107. [Google Scholar] [CrossRef] [PubMed] [Green Version]
  24. Buxton, J.L.; Suderman, M.; Pappas, J.J.; Borghol, N.; McArdle, W.; Blakemore, A.I.F.; Hertzman, C.; Power, C.; Szyf, M.; Pembrey, M. Human leukocyte telomere length is associated with DNA methylation levels in multiple subtelomeric and imprinted loci. Sci. Rep. 2014, 4, 4954. [Google Scholar] [CrossRef] [Green Version]
  25. Wong, J.Y.Y.; De Vivo, I.; Lin, X.; Grashow, R.; Cavallari, J.; Christiani, D.C. The association between global DNA methylation and telomere length in a longitudinal study of boilermakers. Genet. Epidemiol. 2014, 38, 254–264. [Google Scholar] [CrossRef] [PubMed]
  26. Heng, J.; Zhang, F.; Guo, X.; Tang, L.; Peng, L.; Luo, X.; Xu, X.; Wang, S.; Dai, L.; Wang, J. Integrated analysis of promoter methylation and expression of telomere related genes in breast cancer. Oncotarget 2017, 8, 25442–25454. [Google Scholar] [CrossRef] [PubMed] [Green Version]
  27. Díaz de la Guardia, R.; Catalina p Panero, J.; Elosua, C.; Pulgarin, A.; López, M.B.; Ayllón, V.; Ligero, G.; Slavutsky, I.; Leone, P.E. Expression profile of telomere-associated genes in multiple myeloma. J. Cell Mol. Med. 2012, 16, 3009–3021. [Google Scholar] [CrossRef]
  28. Panero, J.; Stella, F.; Schutz, N.; Fantl, D.B.; Slavutsky, I. Differential Expression of Non-Shelterin Genes Associated with High Telomerase Levels and Telomere Shortening in Plasma Cell Disorders. PLoS ONE 2015, 10, e0137972. [Google Scholar] [CrossRef] [PubMed]
  29. Joyce, B.T.; Zheng, Y.; Nannini, D.; Zhang, Z.; Liu, L.; Gao, T.; Kocherginsky, M.; Murphy, R.; Yang, H.; Achenbach, C.J.; et al. DNA Methylation of Telomere-Related Genes and Cancer Risk. Cancer Prev. Res. 2018, 11, 511–522. [Google Scholar] [CrossRef] [Green Version]
  30. Choudhury, S.R.; Walker, B.A. A Rapid and Robust Protocol for Reduced Representation Bisulfite Sequencing in Multiple Myeloma. In Multiple Myeloma; Springer: Berlin/Heidelberg, Germany, 2018; pp. 179–191. [Google Scholar]
  31. Schreiber, J.; Bilmes, J.; Noble, W.S. Completing the ENCODE3 compendium yields accurate imputations across a variety of assays and human biosamples. Genome Biol. 2020, 21, 82. [Google Scholar] [CrossRef] [Green Version]
  32. Robinson, J.T.; Thorvaldsdóttir, H.; Winckler, W.; Guttman, M.; Lander, E.S.; Getz, G.; Mesirov, J.P. Integrative genomics viewer. Nat. Biotechnol. 2011, 29, 24–26. [Google Scholar] [CrossRef] [PubMed] [Green Version]
  33. Kikin, O.; D’Antonio, L.; Bagga, P.S. QGRS Mapper a web-based server for predicting G-quadruplexes in nucleotide sequences. Nucleic Acids Res. 2006, 34, W676–W682. [Google Scholar] [CrossRef]
  34. Storti, C.B.; de Oliveira, R.A.; de Carvalho, M.; Hasimoto, E.N.; Cataneo, D.C.; Cataneo, A.J.M.; De Faveri, J.; Vasconcelos, E.J.R.; Dos Reis, P.P.; Cano, M.I.N. Telomere-associated genes and telomeric lncRNAs are biomarker candidates in lung squamous cell carcinoma (LUSC). Exp. Mol. Pathol. 2020, 112, 104354. [Google Scholar] [CrossRef]
  35. Cui, H.; Onyango, P.; Brandenburg, S.; Wu, Y.; Hsieh, C.-L.; Feinberg, A.P. Loss of imprinting in colorectal cancer linked to hypomethylation of H19 and IGF2. Cancer Res. 2002, 62, 6442–6446. [Google Scholar]
  36. Palumbo, D.; Affinito, O.; Monticelli, A.; Cocozza, S. DNA Methylation variability among individuals is related to CpGs cluster density and evolutionary signatures. BMC Genom. 2018, 19, 229. [Google Scholar] [CrossRef]
  37. Chambwe, N.; Kormaksson, M.; Geng, H.; De, S.; Michor, F.; Johnson, N.A.; Morin, R.D.; Scott, D.W.; Godley, L.A.; Gascoyne, R.D.; et al. Variability in DNA methylation defines novel epigenetic subgroups of DLBCL associated with different clinical outcomes. Blood 2014, 123, 1699–1708. [Google Scholar] [CrossRef] [PubMed] [Green Version]
  38. McMahon, K.W.; Karunasena, E.; Ahuja, N. The Roles of DNA Methylation in the Stages of Cancer. Cancer J. 2017, 23, 257–261. [Google Scholar] [CrossRef]
  39. De, S.; Michor, F. DNA secondary structures and epigenetic determinants of cancer genome evolution. Nat. Struct. Mol. Biol. 2011, 18, 950–955. [Google Scholar] [CrossRef] [PubMed] [Green Version]
  40. Hedström, E.; Pederiva, C.; Farnebo, J.; Nodin, B.; Jirström, K.; Brennan, D.J.; Farnebo, M. Downregulation of the cancer susceptibility protein WRAP53β in epithelial ovarian cancer leads to defective DNA repair and poor clinical outcome. Cell Death Dis. 2015, 6, e1892. [Google Scholar] [CrossRef]
  41. Kim, D.S.; Lee, W.K.; Park, J.Y. Promoter methylation of Wrap53α, an antisense transcript of p53, is associated with the poor prognosis of patients with non-small cell lung cancer. Oncol. Lett. 2018, 16, 5823–5828. [Google Scholar] [CrossRef] [Green Version]
  42. Kondo, T.; Oue, N.; Yoshida, K.; Mitani, Y.; Naka, K.; Nakayama, H.; Yasui, W. Expression of POT1 is associated with tumor stage and telomere length in gastric carcinoma. Cancer Res. 2004, 64, 523–529. [Google Scholar] [CrossRef] [Green Version]
  43. Pal, D.; Sharma, U.; Singh, S.K.; Kakkar, N.; Prasad, R. Over-Expression of Telomere Binding Factors (TRF1 & TRF2) in Renal Cell Carcinoma and Their Inhibition by Using SiRNA Induce Apoptosis, Reduce Cell Proliferation and Migration Invitro. PLoS ONE 2015, 10, e0115651. [Google Scholar]
  44. Helleday, T.; Petermann, E.; Lundin, C.; Hodgson, B.; Sharma, R.A. DNA repair pathways as targets for cancer therapy. Nat. Rev. Cancer 2008, 8, 193–204. [Google Scholar] [CrossRef]
  45. Kauffmann, A.; Rosselli, F.; Lazar, V.; Winnepenninckx, V.; Mansuet-Lupo, A.; Dessen, P.; Van den Oord, J.; Spatz, A.; Sarasin, A. High expression of DNA repair pathways is associated with metastasis in melanoma patients. Oncogene 2008, 27, 565–573. [Google Scholar] [CrossRef] [Green Version]
  46. Yang, X.; Han, H.; De Carvalho, D.D.; Lay, F.D.; Jones, P.A.; Liang, G. Gene body methylation can alter gene expression and is a therapeutic target in cancer. Cancer Cell 2014, 26, 577–590. [Google Scholar] [CrossRef] [Green Version]
  47. Trolle, C.; Nielsen, M.M.; Skakkebæk, A.; Lamy, P.; Vang, S.; Hedegaard, J.; Nordentoft, I.; Ørntoft, T.F.; Pedersen, J.S.; Gravholt, C.H. Widespread DNA hypomethylation and differential gene expression in Turner syndrome. Sci. Rep. 2016, 6, 34220. [Google Scholar] [CrossRef] [Green Version]
  48. Holwerda, S.J.B.; de Laat, W. CTCF the protein, the binding partners, the binding sites and their chromatin loops. Philos. Trans. R. Soc. B Biol. Sci. 2013, 368, 20120369. [Google Scholar] [CrossRef] [Green Version]
  49. Banerjee, R.; Russo, N.; Liu, M.; Van Tubergen, E.; D’Silva, N.J. Rap1 and its regulatory proteins the tumor suppressor, oncogene, tumor suppressor gene axis in head and neck cancer. Small GTPases 2012, 3, 192–197. [Google Scholar] [CrossRef] [Green Version]
  50. Zhang, W.; Shang, S.; Yang, Y.; Lu p Wang, T.; Cui, X.; Tang, X. Identification of DNA methylation-driven genes by integrative analysis of DNA methylation and transcriptome data in pancreatic adenocarcinoma. Exp. Ther. Med. 2020, 19, 2963–2972. [Google Scholar] [CrossRef] [Green Version]
  51. Zhang, J.; Huang, J.Y.; Chen, Y.N.; Yuan, F.; Zhang, H.; Yan, F.H.; Wang, M.J.; Wang, G.; Su, M.; Lu, G.; et al. Whole genome and transcriptome sequencing of matched primary and peritoneal metastatic gastric carcinoma. Sci. Rep. 2015, 5, 13750. [Google Scholar] [CrossRef] [Green Version]
  52. Jara-Espejo, M.; Line, S.R. DNA G-quadruplex stability, position and chromatin accessibility are associated with CpG island methylation. FEBS J. 2020, 287, 483–495. [Google Scholar] [CrossRef]
  53. Mao, S.-Q.; Ghanbarian, A.T.; Spiegel, J.; Martínez Cuesta, S.; Beraldi, D.; Di Antonio, M.; Marsico, G.; Hänsel-Hertsch, R.; Tannahill, D.; Balasubramanian, S. DNA G-quadruplex structures mold the DNA methylome. Nat. Struct. Mol. Biol. 2018, 25, 951–957. [Google Scholar] [CrossRef]
  54. Moss, J.; Magenheim, J.; Neiman, D.; Zemmour, H.; Loyfer, N.; Korach, A.; Samet, Y.; Maoz, M.; Druid, H.; Arner, P.; et al. Comprehensive human cell-type methylation atlas reveals origins of circulating cell-free DNA in health and disease. Nat. Commun. 2018, 9, 5068. [Google Scholar] [CrossRef] [Green Version]
Figure 1. (A) A subgroup-specific differential telomere-related genes (TRG)s expression pattern was seen in major molecular subgroups of newly diagnosed multiple myeloma (NDMM) patients compared to controls. (B) Unsupervised hierarchical clustering with differentially expressed TRGs showed distinct clustering between D1 and t(4;14) subgroups or MAF subgroups containing t(14;16) or t(14;20) translocations. Abbreviation: NDMM; newly diagnosed multiple myeloma.
Cancers 13 06348 g001
Figure 2. Selective TRGs are significantly (p < 0.05) differentially upregulated (n = 10) or downregulated (n = 5) across major IgH translocation (n = 4) and hyperdiploidy (n = 2) subgroups in a cohort of patients with NDMM, compared to control. Abbreviations: IgH, immunoglobulin heavy chain locus; NDMM, newly diagnosed multiple myeloma; TRG, telomere-related gene.
Cancers 13 06348 g002
Figure 3. (AF) Distribution of hypermethylated and hypomethylated DMRs across the promoters (−5 kb of TSS) and bodies (up to 3′ UTR) of TRGs among NDMM subgroups. (G) Out of 15 significantly (adj p < 0.05) differentially expressed and 17 differentially (p < 0.05) methylated TRGs among NDMM subgroups, we observed 16% (n = 5) of TRGs that were mutually inclusive to both the categories. (H) We observed strong correlation (R2 ≥ 0.5) between MDM and expression in 5 TRGs, where an inverse methylation-expression at the promoter, or direct methylation-expression relationship at the body were considered. Abbreviations: DMR; differentially methylated regions; MDM, mean DMR-methylation; NDMM, newly diagnosed multiple myeloma; TRG, telomere-related gene; TSS, Transcription Start Site.
Cancers 13 06348 g003
Figure 4. We observed similarities in DNA methylation pattern across DMRs of representative TRGs between NDMM subgroups and MM cell lines. For instance, DMR-1 at the promoters of (A) DDX1 and (B) TERF1, and DMRs at the bodies of (C) ZNF208, and (E) RAP1A were hypomethylated. We observed a single (DMR-2; p < 0.05) hypermethylated DMR at the body of PIK3C3 (D). Abbreviations: DMR, differentially methylated regions; NDMM, newly diagnosed multiple myeloma; TRG, telomere-related gene.
Cancers 13 06348 g004
Figure 5. Proximity and possible overlaps between DMRs and chromatin marks were mapped on selective epigenetically regulated TRGs (n = 5). ChIP-sequencing data from H929, t(4;14) cell line containing four activating histones (H3K4me1, H3K4me3, H3k27ac, and H3K36me3), and one repressive histone (H3K27me3) were mapped to the proximal DMRs. Additionally, DNAse-seq peaks were observed to determine open chromatin, while CTCF binding was also observed. The overlaps between DNA and chromatin level epigenetic marks were visualized at 5 kb upstream TSS of (A) DDX1 and (B) TERF1, or across the body region of (C) ZNF208, (D) PIK3C3, and (E) RAP1A. Abbreviations: ChIP, chromatin immunoprecipitation; CTCF, CCCTC binding factor; DMR, differentially methylated regions; DNAse-seq, DNAse sequencing; TRG, telomere-related gene; TSS, transcription start site.
Cancers 13 06348 g005
Figure 6. We observed frequent overlaps between hypomethylated DMRs and G4FS at (A) the promoter of DDX1, and the body of (B) ZNF208 and (C) RAP1A. (D) A single G4FS was observed, overlapped to the hypermethylated DMR of PIK3C3, while no overlap was noticed at the DMR-1 of the TERF1 promoter. Abbreviations: DMR, differentially methylated regions; G4FS, G quadruplex forming sequences.
Cancers 13 06348 g006
Publisher’s Note: MDPI stays neutral with regard to jurisdictional claims in published maps and institutional affiliations.

