1. Introduction
It is well established that cancers rewire metabolic pathways to fuel the needs of rapidly dividing cells. Increased amino acid catabolism, specifically of arginine by arginase 1 (ARG1) and tryptophan by indoleamine 2,3 dioxygenase (IDO), are considered hallmarks of tumorigenesis, with the activity of both enzymes known to facilitate immune tolerance by suppressing the antitumor immune response. However, compared to IDO, the precise role of ARG1 is less understood. Arginine is a semi-essential amino acid with a complex metabolism pathway and diverse functionality, which spans well beyond its role in the immune system.
Classically, increased arginine catabolism is known to starve T lymphocytes and drive an immunosuppressive phenotype, as T cells are incapable of generating this essential amino acid. In light of this, earlier studies have investigated the use of ‘immunonutrition’ via arginine-rich supplements to ‘feed’ and boost T cells and improve postsurgical outcomes [
1,
2,
3]. Overall, results have been mixed due to limited follow-up and a lack of correlative statistics to describe relationships with overall and progression-free survival. Consequently, ongoing clinical trials (NCT04001543 and NCT03531190) are underway to bolster early work and evaluate the efficacy of a formula enriched with arginine and other nutrients in perioperative patients with high-risk locally advanced head and neck cancers.
However, arginine metabolism is a double-edged sword, and tampering with it can also affect tumor cells. Certain cancers, such as hepatocellular carcinoma, acute lymphoblastic leukemia and melanoma, are ‘arginine auxotrophic’ and rely on extracellular arginine as a crucial substrate for proliferation and growth. These cancer types are unable to synthesize arginine de novo, as they lack functional gene expression for the rate-limiting enzyme argininosuccinate synthetase (ASS) [
4,
5]. Capitalizing on this vulnerability, there are numerous clinical trials (NCT03455140, NCT02089763, NCT04051307, NCT03837509, NCT02709512) in these cancer types to test depletion of arginine via administration of arginase mimics that essentially mute the supply to tumor (and most likely immune) cells [
6,
7].
Head and neck cancers are different and are nonauxotrophic for arginine, as they have the capacity to synthesize this metabolite de novo [
4,
5]. In fact, head and neck cancers express high ASS levels, suggesting a heightened capacity to synthesize arginine, and studies have shown that this independently predicts unfavorable disease-free survival [
4,
5]. Considering the nonauxotrophic nature of head and neck cancer together with its heightened ability to synthesize arginine, high doses of ARG1 mimics would theoretically be required to ‘starve’ this cancer type. Paradoxically, a study conducted 30 years ago showed that a crude ARG1 mimic (arginine deiminase from mycoplasmas) inhibited the growth of two oral tongue cancer cell lines in vitro [
8]. A more recent study showed that a purified ARG1 mimic (arginine deaminase conjugated with polyethylene glycol) inhibited some but not all head and neck cancer cell growth in vitro [
4,
8]. Further, this study showed that knockdown of ASS potentiated the growth-inhibitory effect of ADI for some but not all cells. Overall, this suggests that there may be compensatory signaling pathways that facilitate cell growth and mediate survival and that other mechanisms are involved.
In contrast to these in vitro ARG1 mimic studies, two clinical trials have included but not focused on head and neck cancer and have explored the use of ARG1 inhibitors (NCT02903914) and [
9]. The rationale is that ARG1 inhibitors will disrupt myeloid-derived stem cell ARG1 activity and restore arginine levels that are required to mount an effective immune response. However, the action of ARG1 inhibitors on tumor cells has not been considered. Further, it is unclear how tolerable, yet effective doses of an ARG1 inhibitor will be achieved in oral cancers because they have already tweaked arginine metabolism to their advantage via reduced ARG1. Beyond these studies, there is an alarming paucity in the literature that explores the intricacies of arginine metabolism in head and neck cancers.
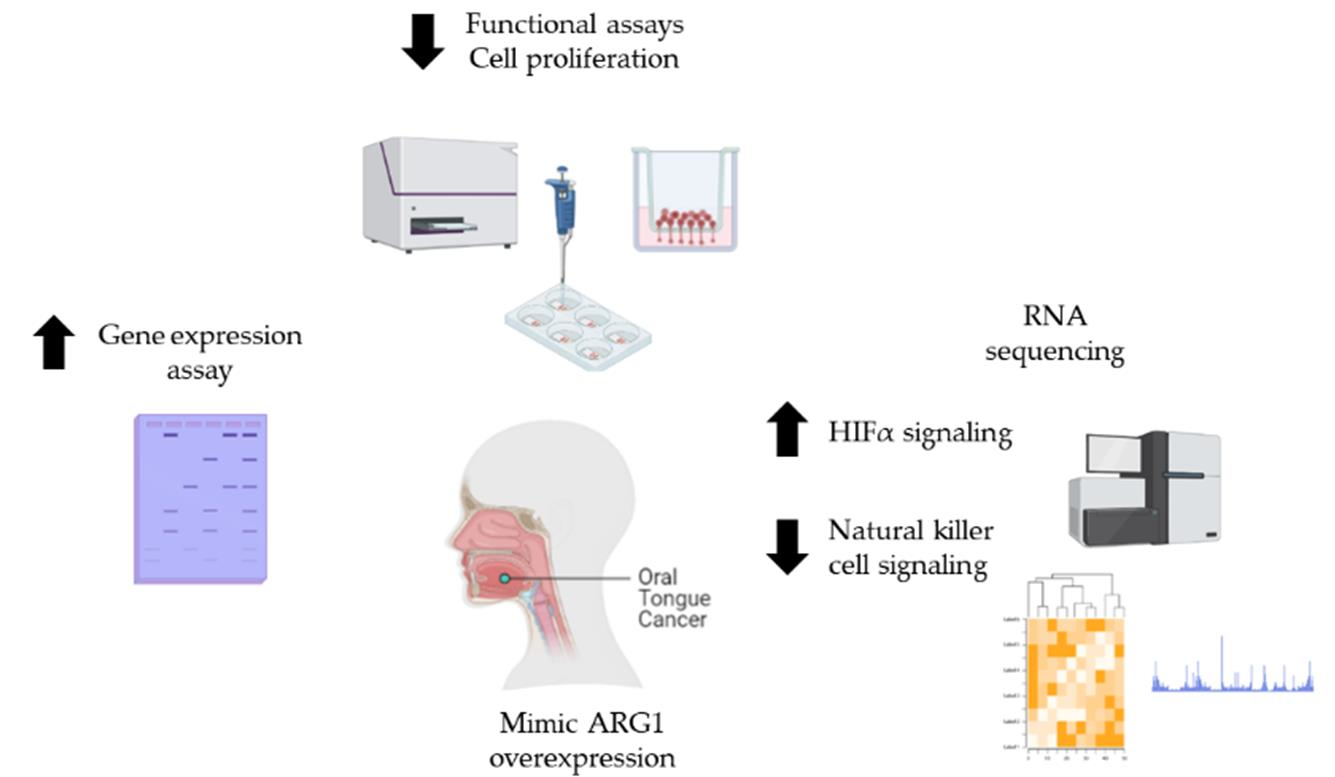
In this article, we explored the impact of disrupted arginine signaling in oral tongue squamous cancers. This is important because oral tongue cancers appear to behave differently from other cancers that are currently in clinical trials testing the treatment efficacy of ARG1 mimics. Oral cancers are unique and our understanding of arginine metabolism in this cancer type is incomplete. Here, we show that oral tongue squamous cancer cells have reduced growth and functionality upon ARG1 transfection (which recapitulates the effect of ARG1 mimics). However, we also show that a percentage of oral cancer cells survive, and a portion remains functional despite overexpression of ARG1. We performed RNA-sequencing to understand which signaling mechanisms govern this coercive yet persistent prosurvival behavior. HIFα and natural killer cell signaling appear to be activated and inactivated, respectively, and provide insight on compensatory pathways that may be mediating survival and mitigating arginine deprivation induced by ARG1 overexpression.
2. Materials and Methods
2.1. Cell Culture
Human oral tongue squamous carcinoma (SCC9 (RRID:CVCL_1685), SCC25 (RRID:CVCL_1682) and CAL27 (RRID:CVCL_1107)) cell lines were obtained from the American Type Culture Collection. Human hepatoma cells (Huh7 (RRID:CVCL_0336)) were received from Prof. Judy Yam, Department of Pathology, the University of Hong Kong, and transformed human keratinocyte cells (HaCaT (RRID: CVCL_0038)) were obtained by Prof. George Tsao, School of Biomedical Sciences, the University of Hong Kong. SCC9 and SCC25 cells were grown in DMEM/F12 (GibcoTM), supplemented with 10% fetal bovine serum (FBS) (ExCellBio), 100 U/mL penicillin, 100 µg of streptomycin and 400 ng/mL hydrocortisone (Sigma-Aldrich). CAL27, Huh7 and HaCaT were grown in DMEM (GibcoTM) with 10% fetal bovine serum (FBS). All cells were cultured at 37 °C with 5% CO2. All experiments were performed with mycoplasma-free cells.
2.2. Cell Transfection
SCC9, SCC25, Cal27 and HaCaT were transiently transfected with 1 µg pCMV-Myc-DDK-tagged-Human arginase, liver (ARG1) (NM_000045) (Origene) and empty vector control (PS100001) (OriGene) using Lipofectamine® 3000 reagent (Thermo Fisher Scientific, Massachusetts, USA). All transfections were performed in 6-well plates for 24 h and were performed in triplicate. Various downstream functional assays were subsequently performed as below.
2.3. Cell Viability Assay
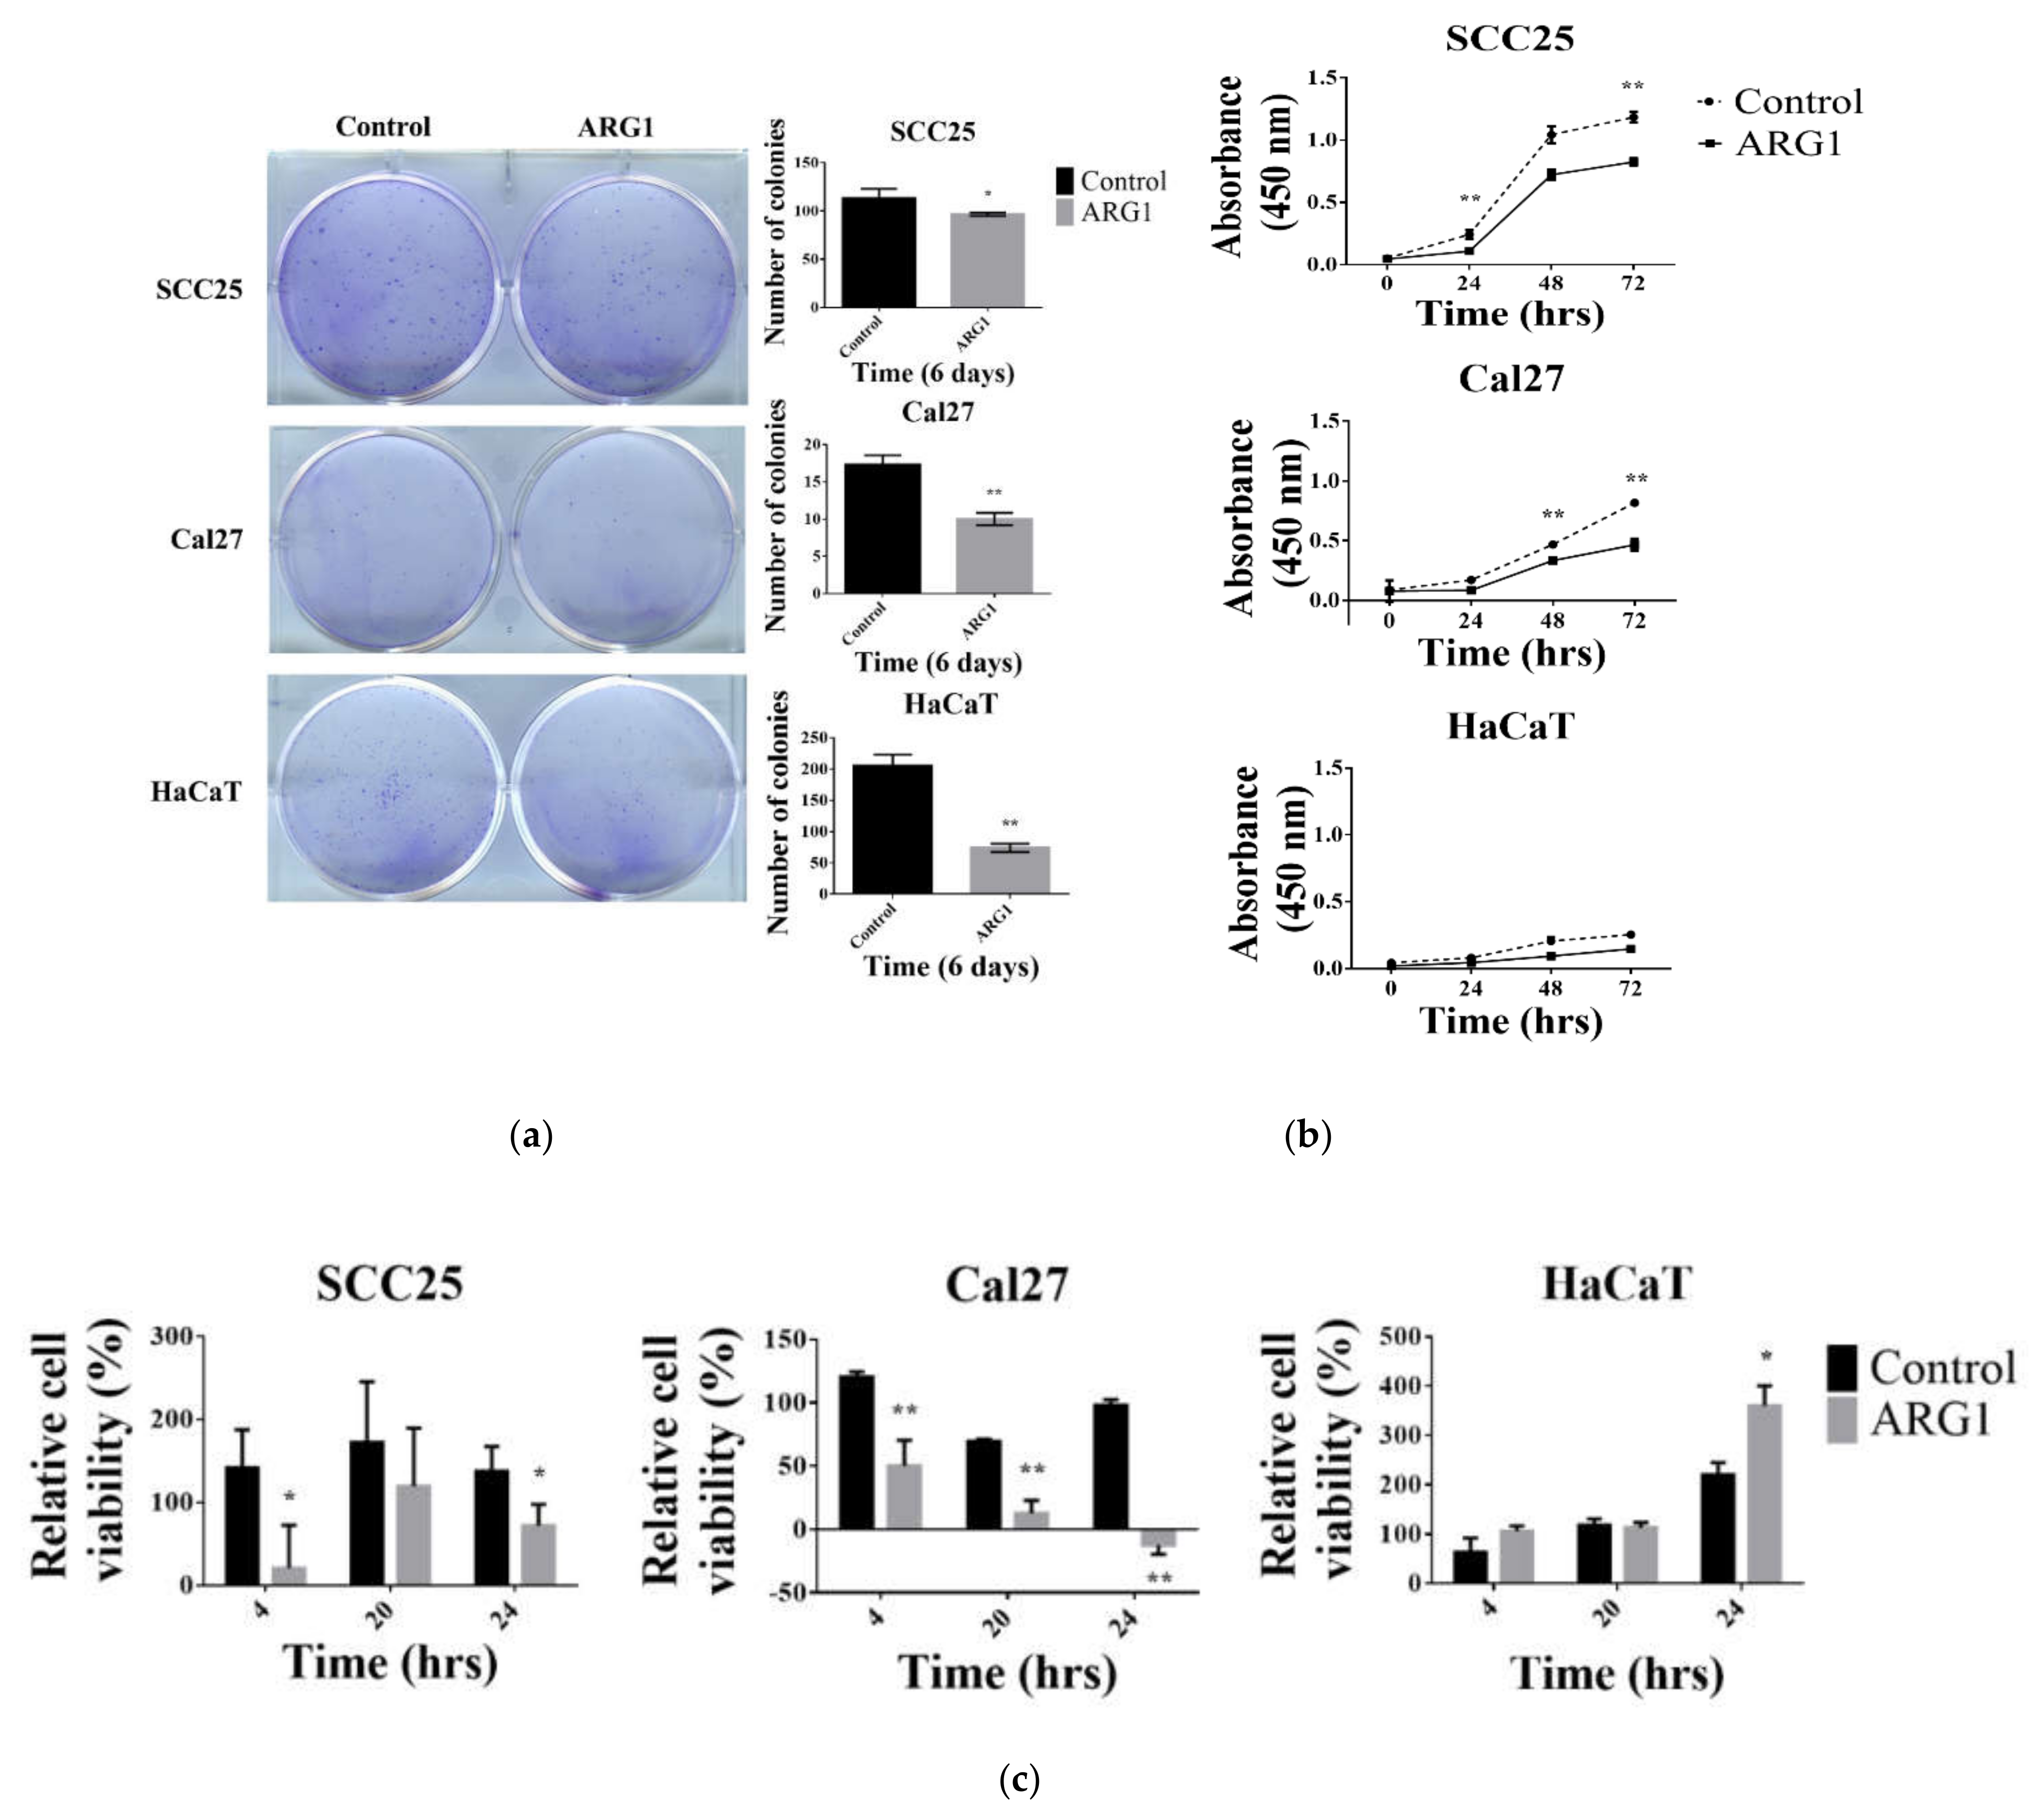
SCC9, SCC25 and Cal27 cells were seeded in triplicate at 10,000 cells per well in 24-well plates per treatment group. After cells were transfected with ARG1 or empty vector controls, cells were trypsinized at various time points (0 h, 4 h, 20 h and 24 h) and counted based on trypan blue (Gibco™) exclusion. The experiment was repeated three times.
2.4. Colony Formation Assay
ARG1-transfected SCC25 and HaCaT cells were seeded at 500 cells per well, and Cal27 cells were seeded at a density of 1000 cells in 6-well plates. Endogenous controls (untransfected cells) were cultured in parallel. Cells were incubated for 6 to 10 days at 37 °C in 5% CO
2. Following this, cells were fixed and stained with 0.25% crystal violet immersed with 25% methanol for 15 min. Colonies were counted using the COUNTPHICS plugin with ImageJ [
10]. Each assay was repeated three times.
2.5. Cell Proliferation Assay
For the cell proliferation assay, transfected and untransfected SCC25, Cal27 and HaCaT cells were seeded into 96-well plates at a concentration of 2000 cells per well. After 24, 48 and 72 h, cell viability was measured by the Cell Count Kit-8 (CCK-8) assay (Dojindo Laboratories). A microplate reader (SpectraMax) was used to measure absorbance at 450 nm. The average absorbance for 10 wells in a group was calculated.
2.6. Wound-Healing Assay
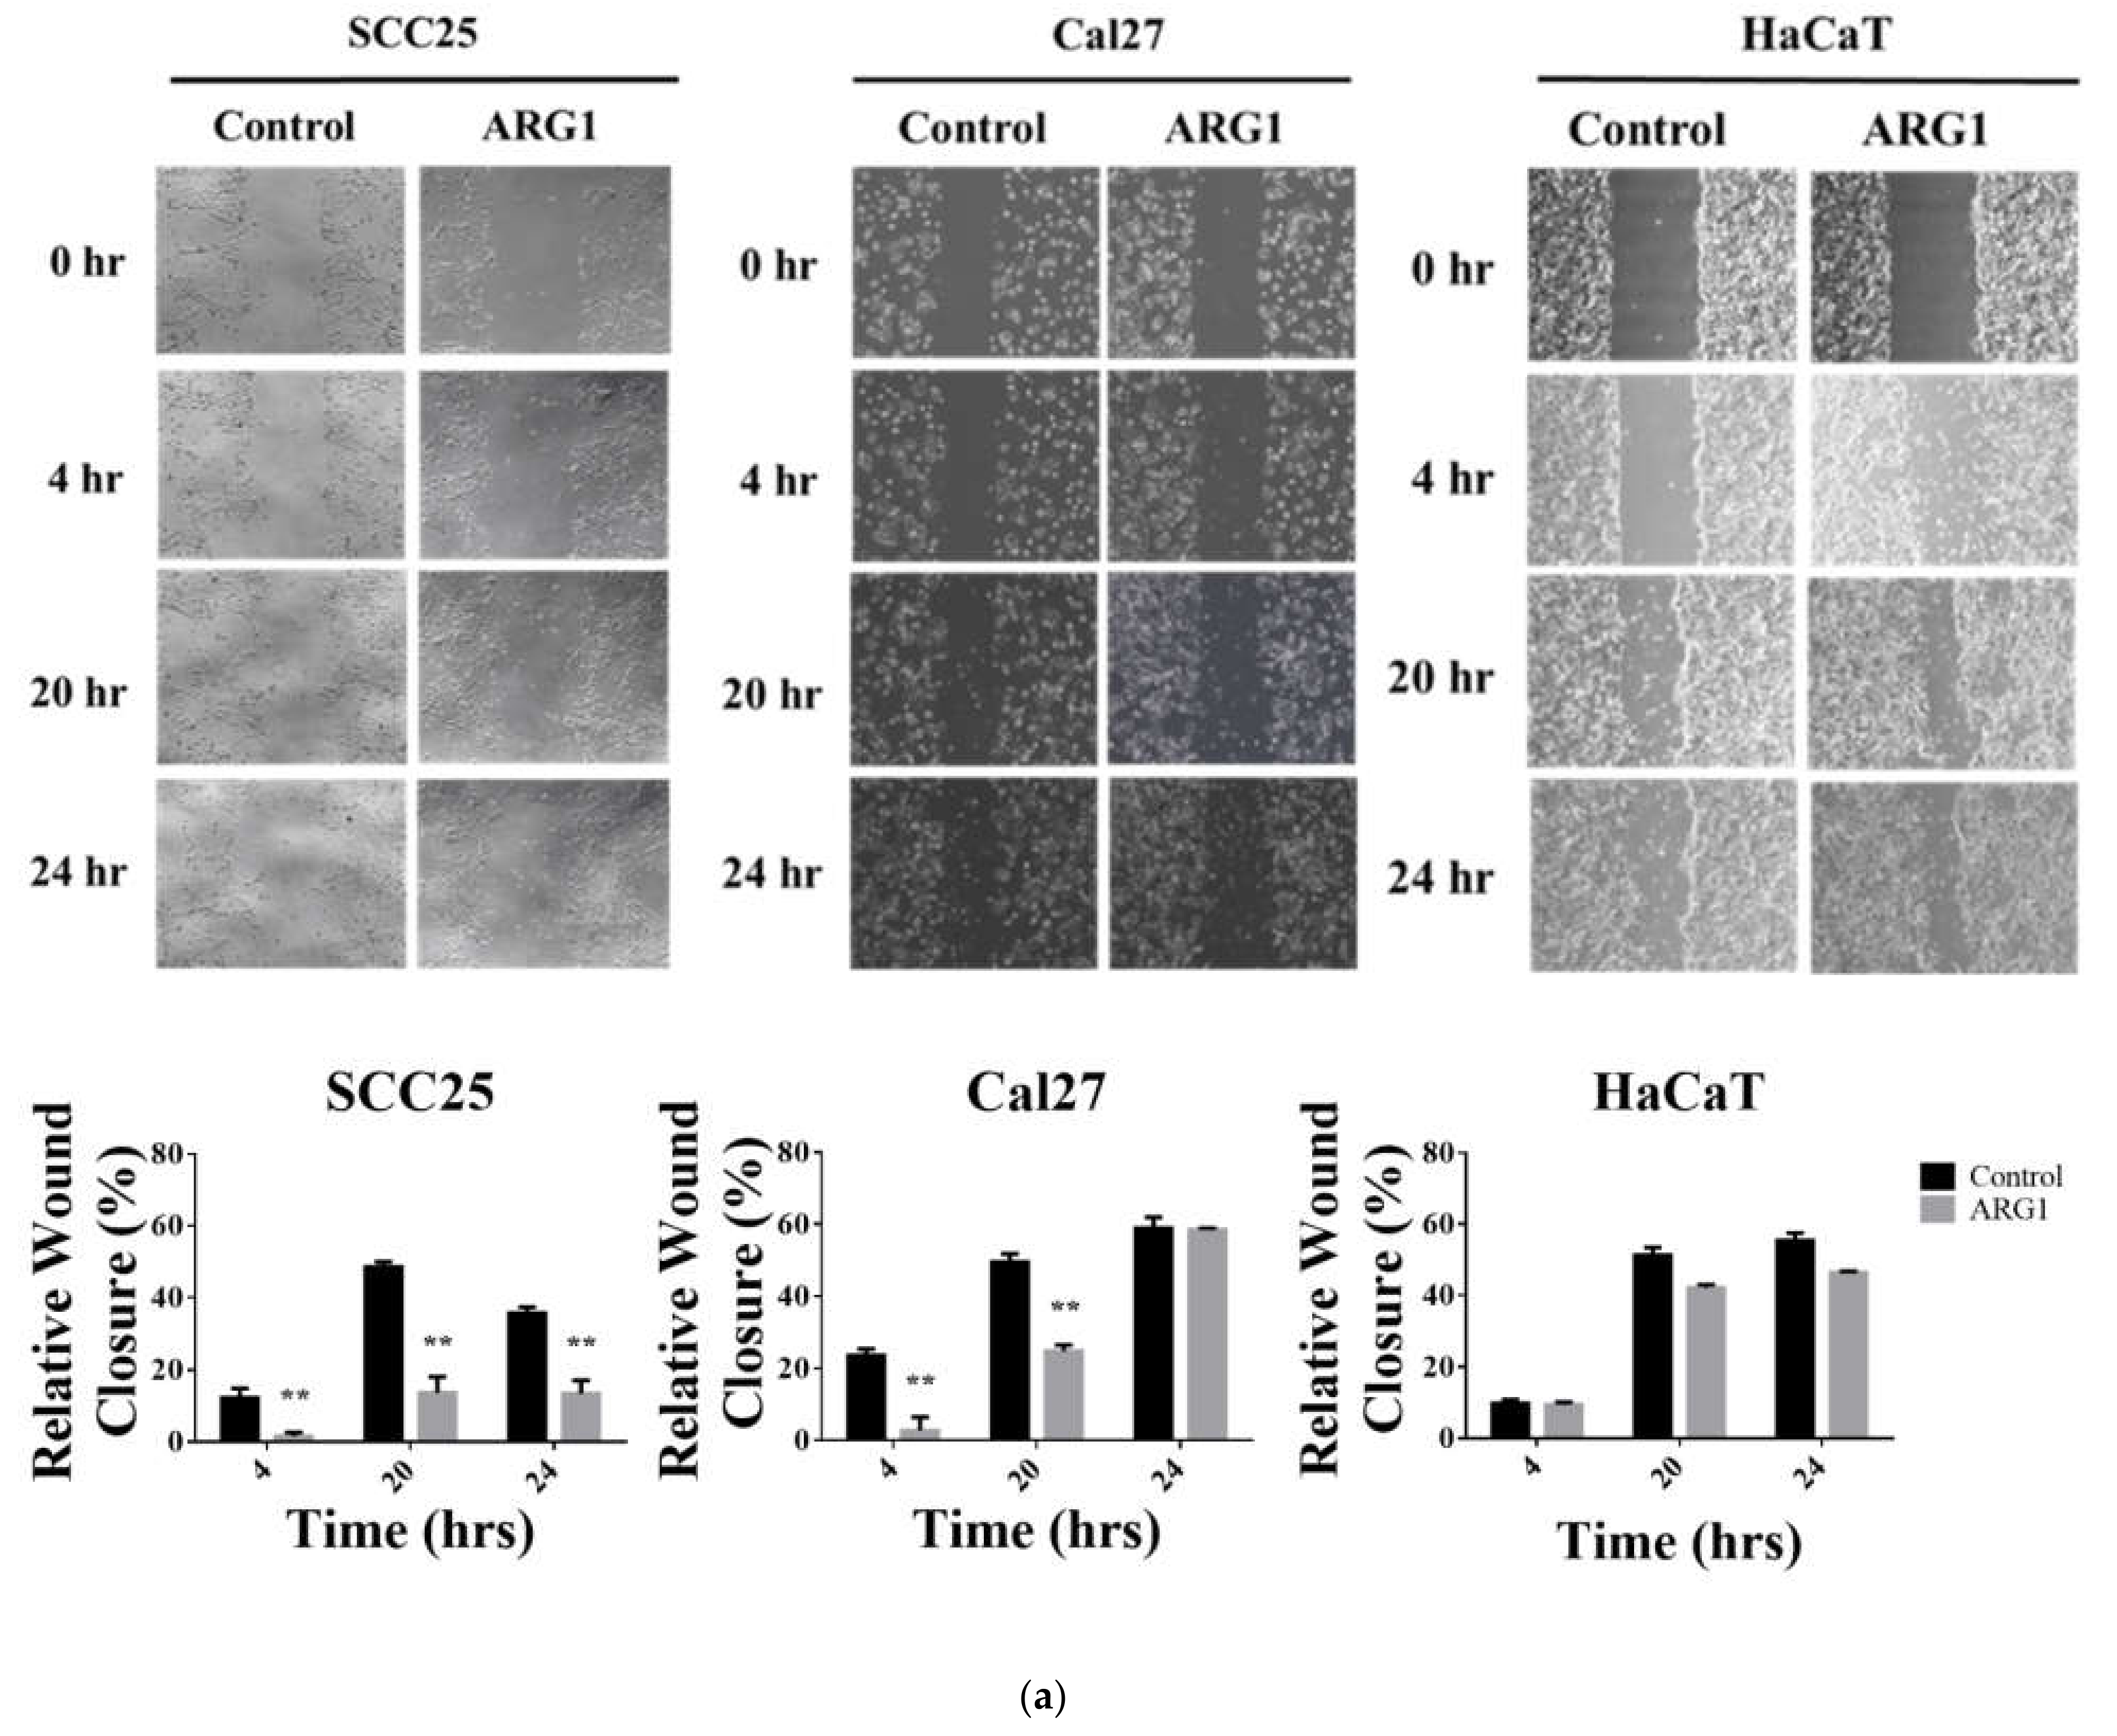
ARG1-transfected SCC25, Cal27 and HaCaT cells and the respective endogenous controls were seeded at a density of 2 × 10⁵ cells per well into 6-well plates in complete medium. A scratch was created with a 20 µL sterile pipette tip, and cells were washed twice with phosphate-buffered saline to remove the loose cells. Serum-free medium was added, and the cells were cultured for up to 24 h. Wound closure was imaged with an inverted microscope at 200× magnification (Nikon ECLIPSE Ti2-E) at various time points (0 h, 4 h, 20 h and 24 h). The scratch healing rate was determined using ImageJ software (National Institute of Health). The experiment was repeated three times.
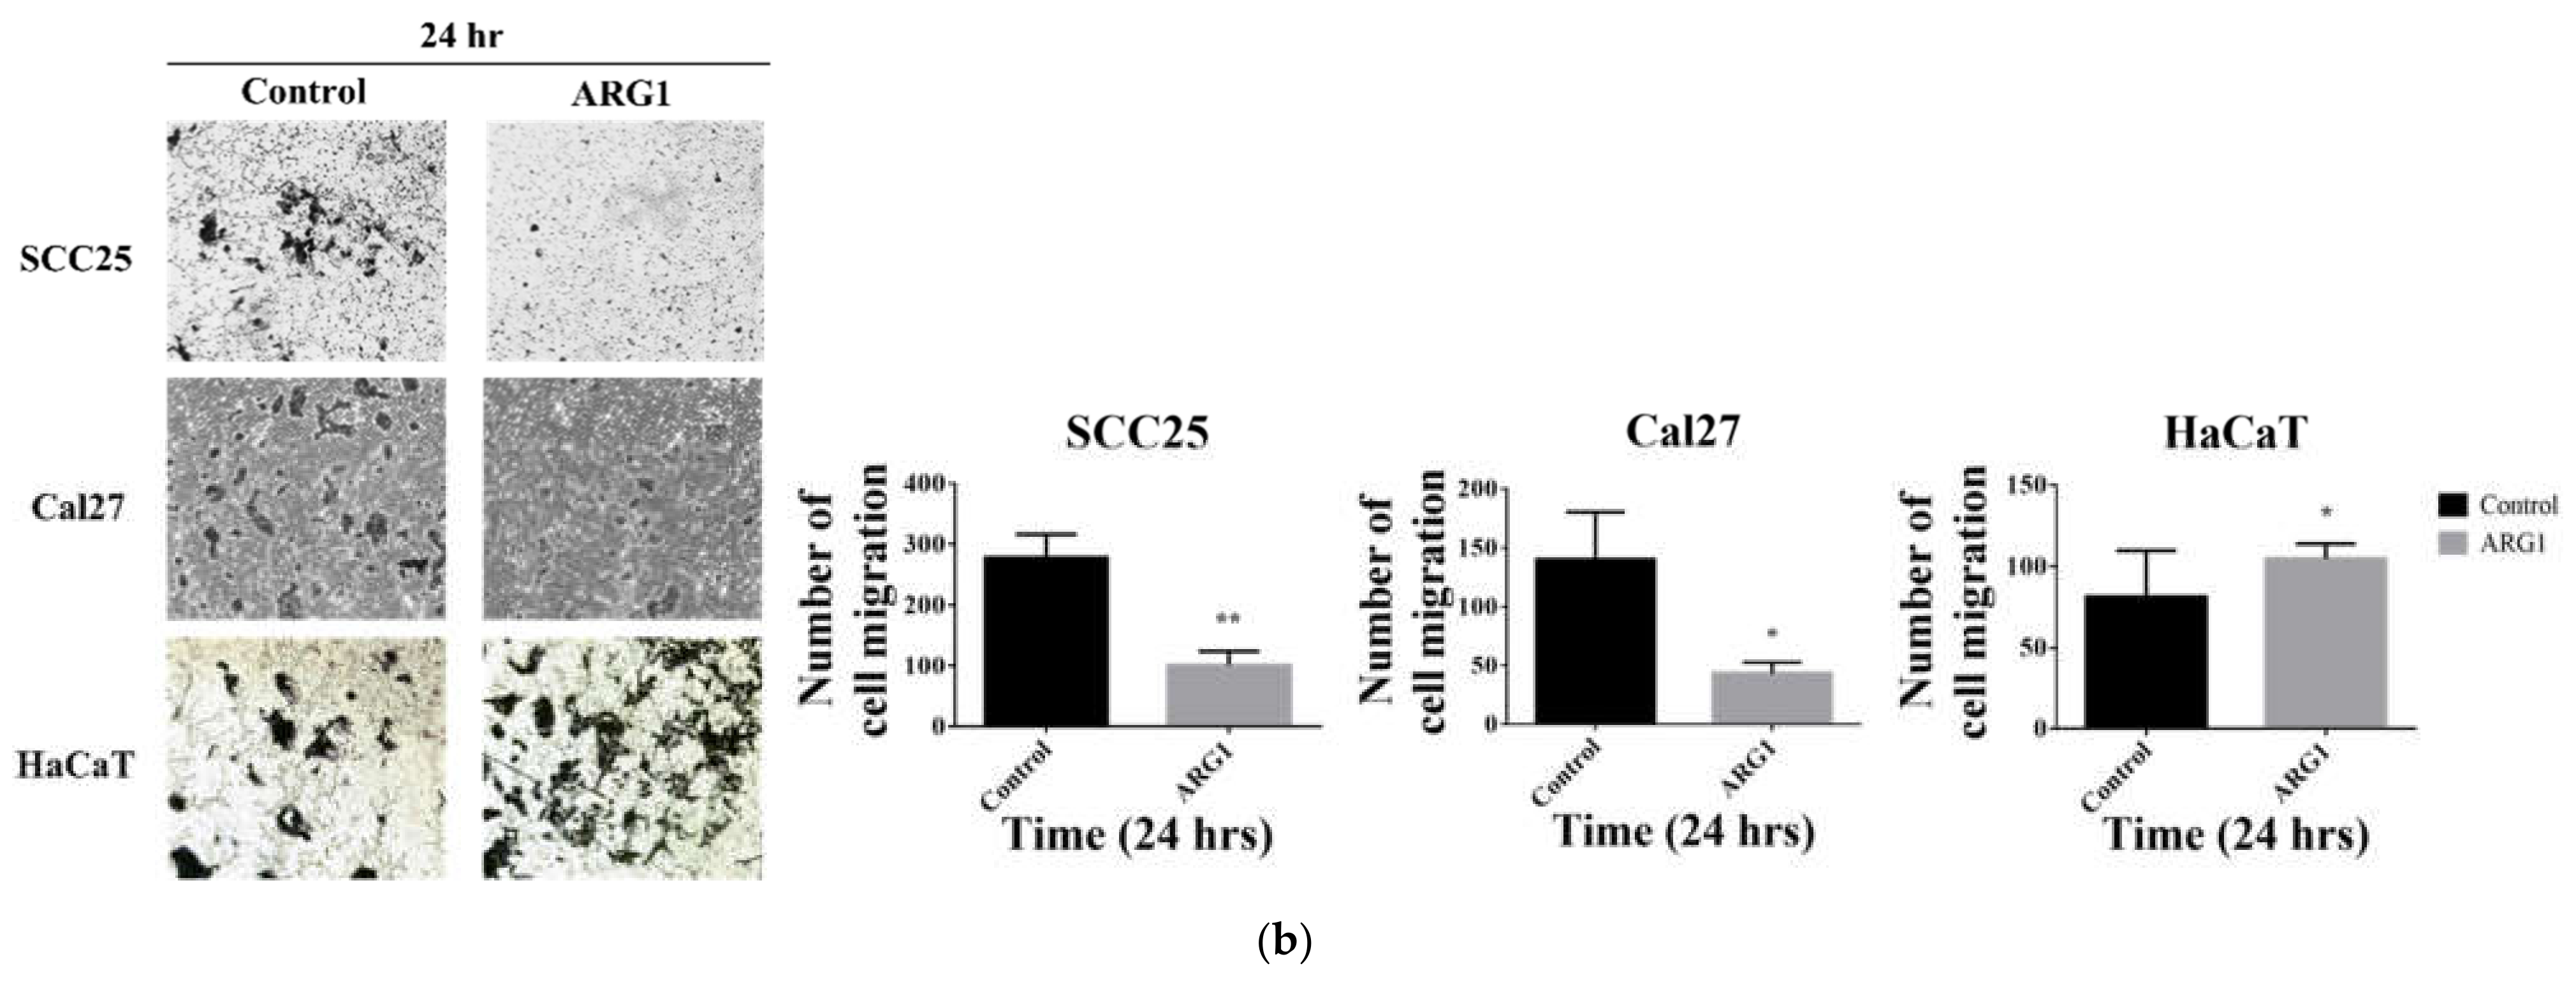
2.7. Cell Migration Assay
ARG1-transfected SCC25, Cal27 and HaCaT cells and the respective endogenous controls were seeded at a density of 1 × 10
5 cells into 24-well plates containing 8 µm pore transwell upper chamber inserts (SPL Life Science). The upper chamber containing the cells was filled with 200 µL of serum-free DMEM/F12 and DMEM medium, and 500 µL of complete medium was added into the lower chamber. The plate was incubated for 24 h to allow cell migration. Cells were fixed and stained with 0.25% crystal violet immersed with 25% methanol for 15 min. Migrating cell colonies were counted with ImageJ using the Cell Counter plugin (
https://imagej.nih.gov/ij/plugins/cell-counter.html, accessed on 21 January 2021).
2.8. RNA Isolation and Gene Expression Assay
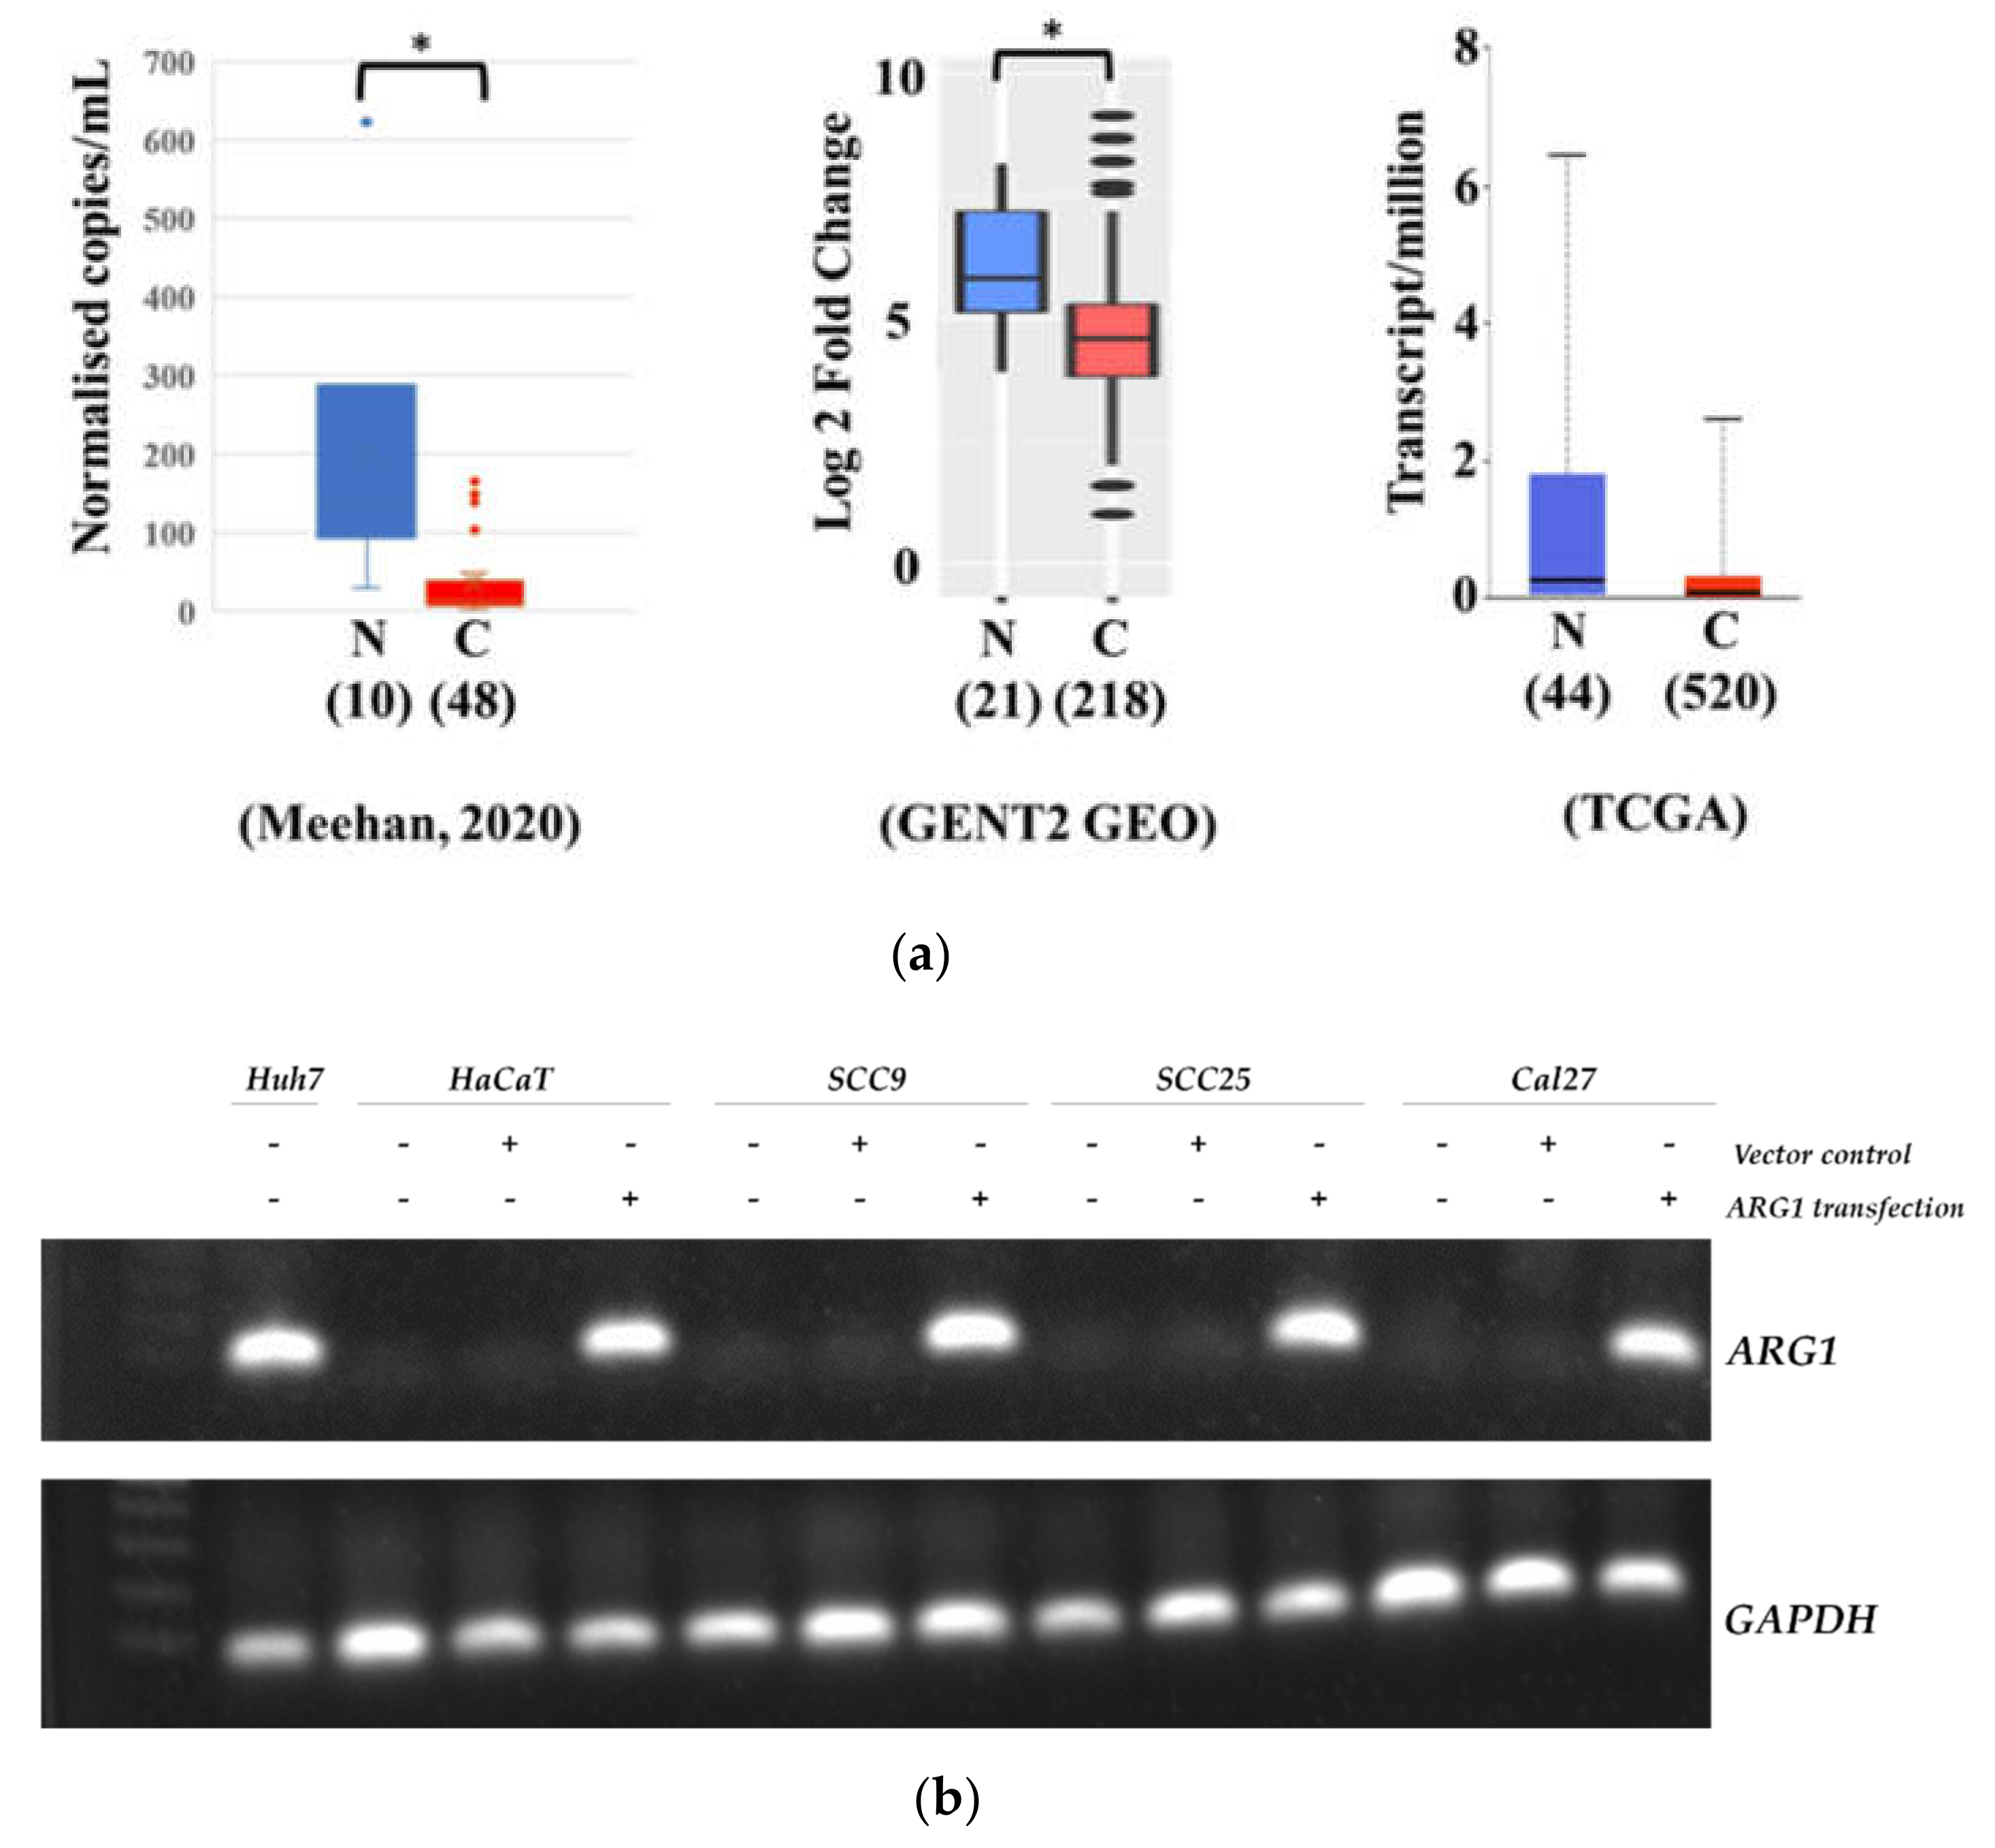
ARG1-transfected SCC9 and SCC25 cells and the related empty vector control cells were seeded in 6-well plates in addition to positive (Huh7) controls. Total RNA was isolated using the PureLink RNA Isolation Kit (Thermo Fisher Scientific) according to the manufacturer’s protocol. The concentration of the purified RNA was measured using a NanodropTM 2000 spectrophotometer (Thermo Fisher Scientific). Reverse transcription was performed using 60 ng of RNA with the SuperScriptTM VILOTM cDNA synthesis kit (InvitrogenTM). ARG1 gene expression was measured by RT-PCR. Initially, we combined the predesigned FAM-labeled TaqMan primer ARG1 (Hs00163660_m1), the endogenous control GAPDH (Hs03929097_g1) and TaqMan Gel Master Mix (4369016) (Thermo Fisher Scientific) with cDNA samples. PCR was performed as follows: 50 °C for 10 min, 90 °C for 2 min, 34 cycles of 95 °C for 15 s and 60 °C for 1 min. The amplified PCR product was loaded in 1% agarose gel with gel red staining and subsequently photographed using the Gel Doc XR+ Gel Documentation System (Bio-Rad).
2.9. RNA-seq Sample Preparation, Sequencing (RNA-seq) and Analysis of Differentially Expressed Genes
Total RNA from SCC25 control and
ARG1-transfected cells was extracted with the PureLink RNA Isolation Kit (Thermo Fisher Scientific) following the manufacturer’s instructions. The RNA sample test, library preparation, sequencing (RNA-seq) and raw data quality control were performed by Novogene Co. Ltd., Hong Kong, China. Briefly, RNA quality was determined with 1% agarose gel. The purity was examined using a NanoPhotometer
® spectrophotometer (IMPLEN), and the integrity and quantitation were assessed using the RNA Nano 6000 Assay Kit of the Bioanalyzer 2100 system (Agilent Technologies). Then, cDNA libraries were prepared from 1 µg of total RNA per sample using the NEBNext
® Ultra
TM RNA Library Prep Kit (NEB, USA) and sequenced on an Illumina HiSeq 2500 platform. Paired-end reads (2 × 150 bp) were generated with three biological replicates for both
ARG1-transfected and control SCC25 cells. Sequencing image data were subject to base calling and demultiplexing by CASAVA to generate the raw data. Raw reads were preprocessed using fastp [
11] to remove reads containing adapters and low-quality reads (quality score of over 50% bases of the read is ≤5). The total number of clean reads ranged from 19.6 M to 22.3 M across all six samples, with a fraction of Q30 bases >93.5% in each sample. We mapped the resulting quality-filtered reads to human genome using HISAT2 (v2.0.4) [
12] with prebuilt indexes based on the GRCh38 reference assembly. The generated SAM files were converted to BAM files and sorted using SAMtools (v1.5) [
13]. Mapped reads were quantified utilizing featurecounts (v2.0.1) [
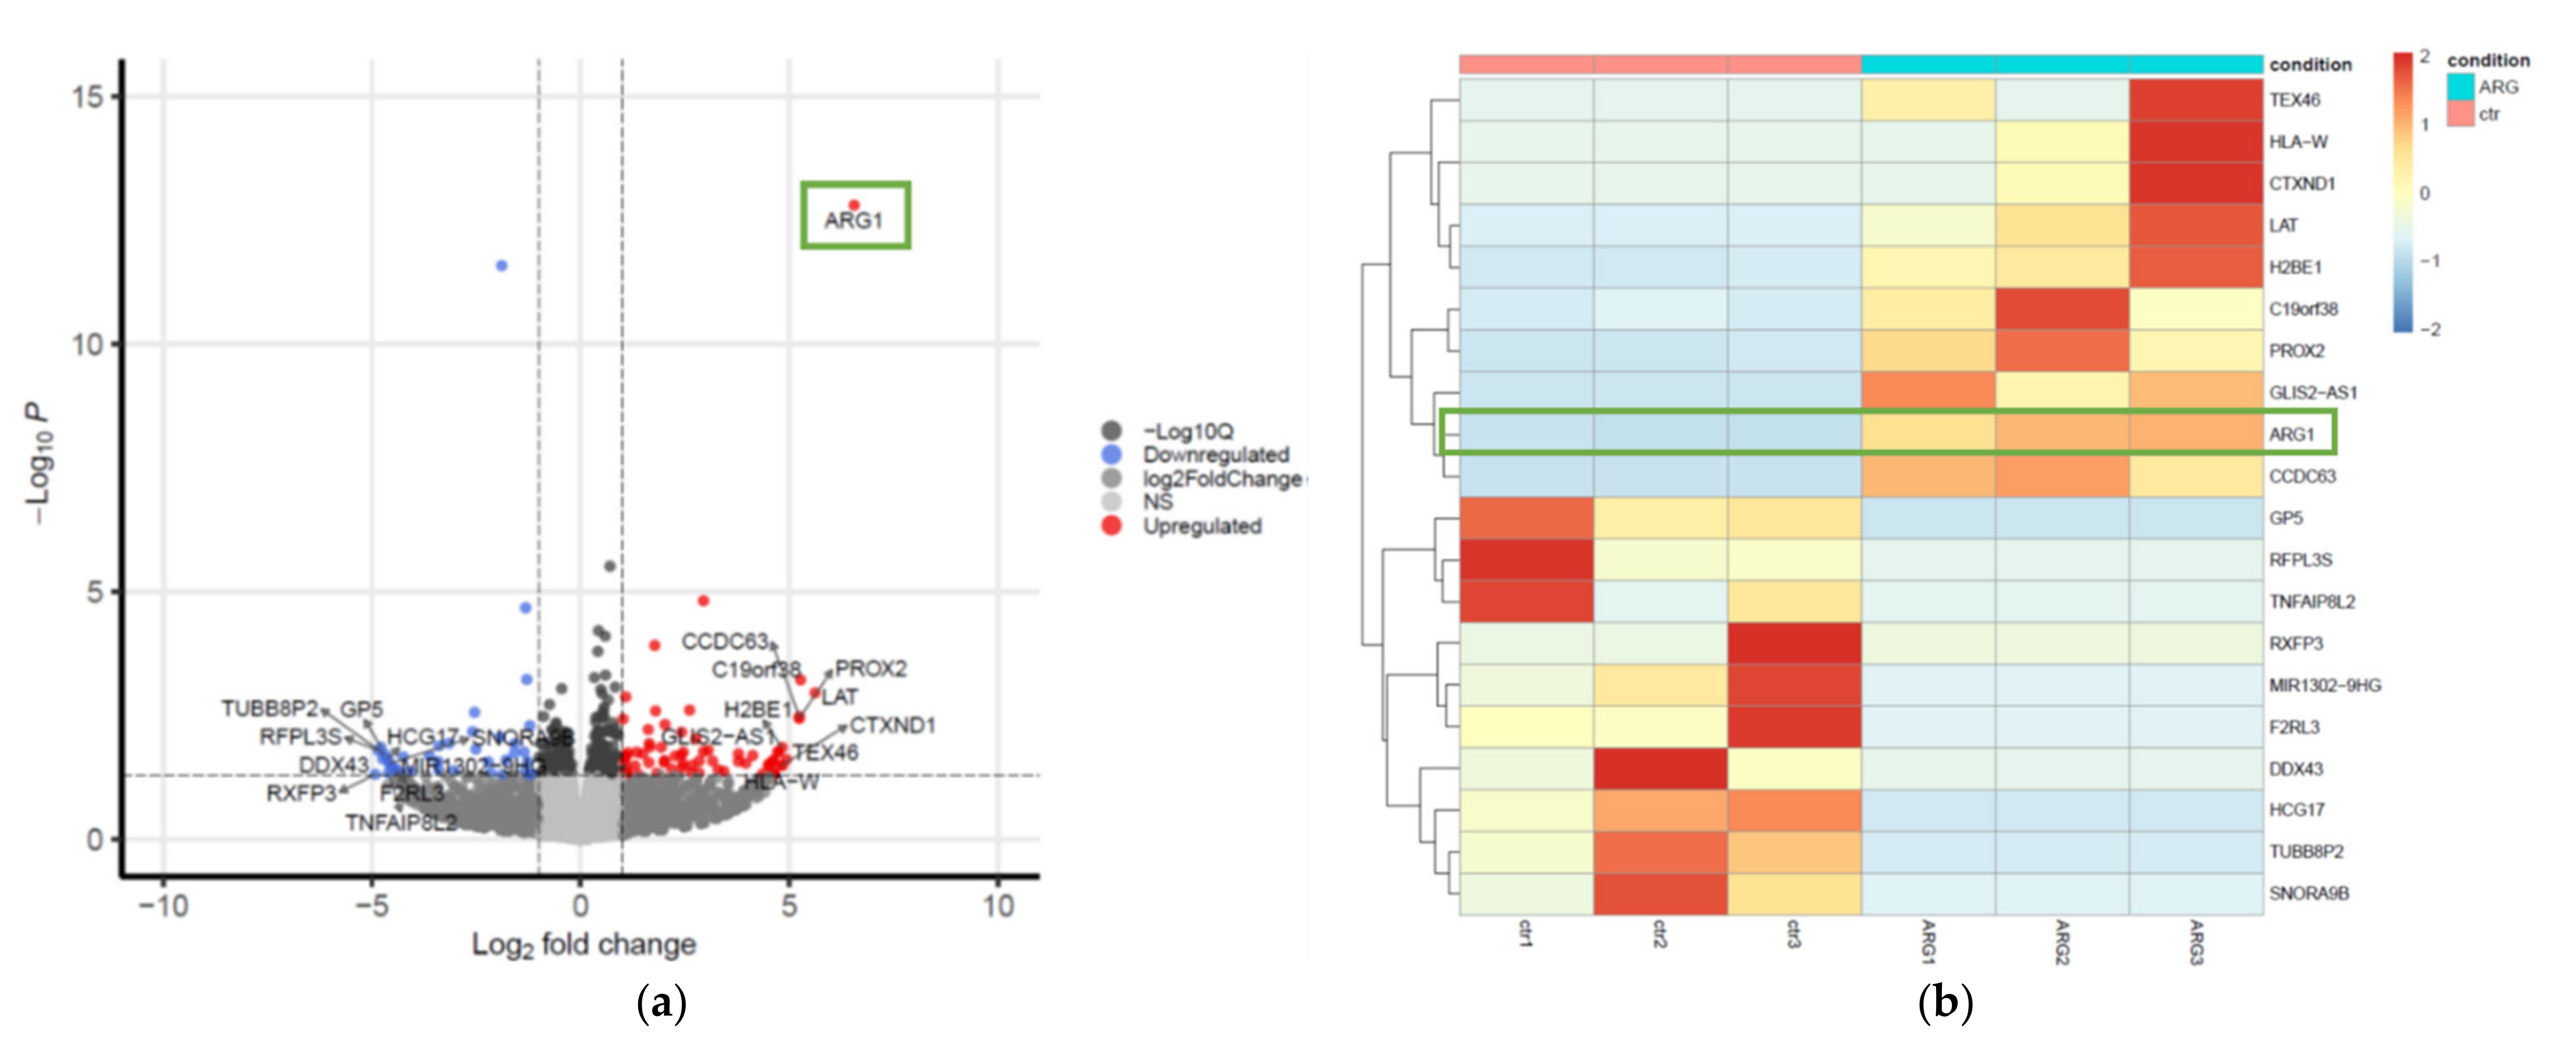
14]. Differentially expressed genes (DEGs) between conditions were identified using the DESeq2 (v1.30.0) R package [
15] based on a negative binomial distribution. Genes with an adjusted
p < 0.05 based on Benjamini–Hochberg (BH) method were considered as DEGs [
11]. To visualize DEGs, a hierarchical clustering heatmap and volcano plot were generated using pheatmap (v1.0.12) and EnhancedVolcano (v1.8.0) [
16] R packages, respectively.
2.10. Ingenuity Pathway Analysis (IPA) Gene Set Enrichment and Modeling of Gene Interactions Network Analysis
A table containing ENSEMBL gene IDs, gene symbols, log2 fold changes and adjusted
p-values of the DEGs was used as input for the IPA software (Qiagen). IPA’s core analysis was performed with default parameters using tools including canonical pathways, upstream regulators and regulator effect networks. For canonical pathways analysis, a
p-value was calculated based on Fisher’s exact test, and −log(
p-value) >2 was set as the threshold. For upstream regulators, a value of
p < 0.05 was considered as the threshold. The Z-score is >0 if the pathway or upstream regulator is activated, while the Z-score is <0 when they are inhibited. The underlying algorithm for the calculation of the Z-score and
p-value of the overlap has been described previously [
17]. Regulator effect networks were evaluated based on consistency scores. The higher the consistency score, the more accurate the result of the regulatory effects. DEGs involved in a given canonical pathway were used to construct gene interaction networks using STRING (V11.5) [
18], an online web tool for the prediction of functional protein interactions. Networks were generated with the following parameters: active interaction sources, including text mining, databases, experiments and coexpression; an interaction score >0.4 (medium confidence).
2.11. Statistical Analyses
Data are presented as the mean ± standard error of the mean. The difference between the two groups was determined using Student’s t-test. Multiple-group comparisons were determined using one-way analysis of variance, followed by the Tukey–Kramer test. Nonparametric tests were used for data lacking a normal distribution. A value of p < 0.05 was considered statistically significant. The statistical thresholds for DEGs and IPA analysis were mentioned above. All data were analyzed using Excel from Office 365 or R packages, as described in the results.
4. Discussion
Although impressive strides have been made in the management and treatment of oral tongue cancer, the 5-year survival rate has remained relatively stable at ~50% over the past few decades [
17,
18]. It is inarguable that new and rational therapeutic strategies are needed to improve survival. Towards this, the therapeutic prowess of both ARG1 mimics and inhibitors are under investigation and in clinical trials that include various cancer types. Testing therapies with apparent opposite effects highlight a clear gap in our understanding of arginine metabolism. Here, we sought to address this by studying the functional and downstream consequences of deregulated arginine metabolism in oral tongue cancer cells. Firstly, we show that ARG1, the enzyme responsible for the catabolism of arginine, is not expressed by oral tongue cancer cells. Although this contradicts one previous study [
12], it corroborates various other findings [
13,
14,
15] and supports the hypothesis that arginine metabolism is selectively rewired in oral tongue cancer cells to create a survival advantage. Considering the lack of expression of
ARG1, we next sought to determine whether oral tongue cancer cells had adapted to function and proliferate without relying on arginine catabolism. To address this, we examined the functional effects of reinstating
ARG1 expression in oral tongue cancer cells. Compared with noncancer keratinocyte control cells, we show that
ARG1 overexpression limits oral tongue cancer cell proliferation, decreases cell viability and reduces cell migration and invasion over time. Although oral tongue cancer cells were constrained upon
ARG1 overexpression relative to control, a proportion of cells ultimately persisted and survived. A potential explanation for this may be that surviving cells activate compensatory signaling pathways.
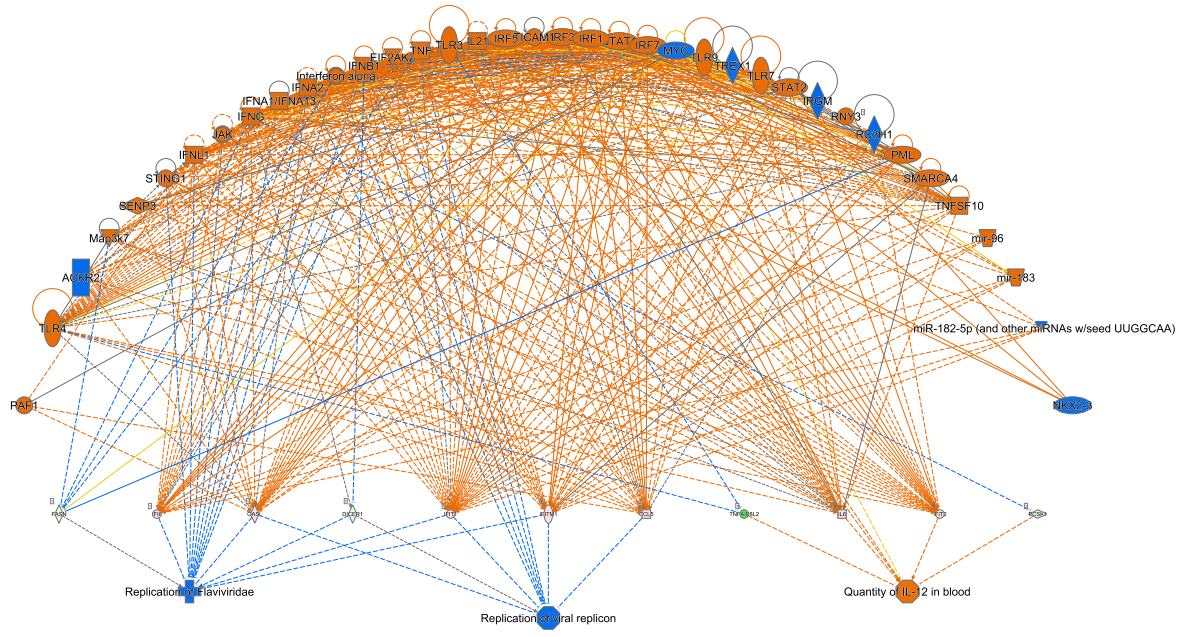
To explore this, we performed gene expression profiling on oral tongue cancer cells that had been transfected with
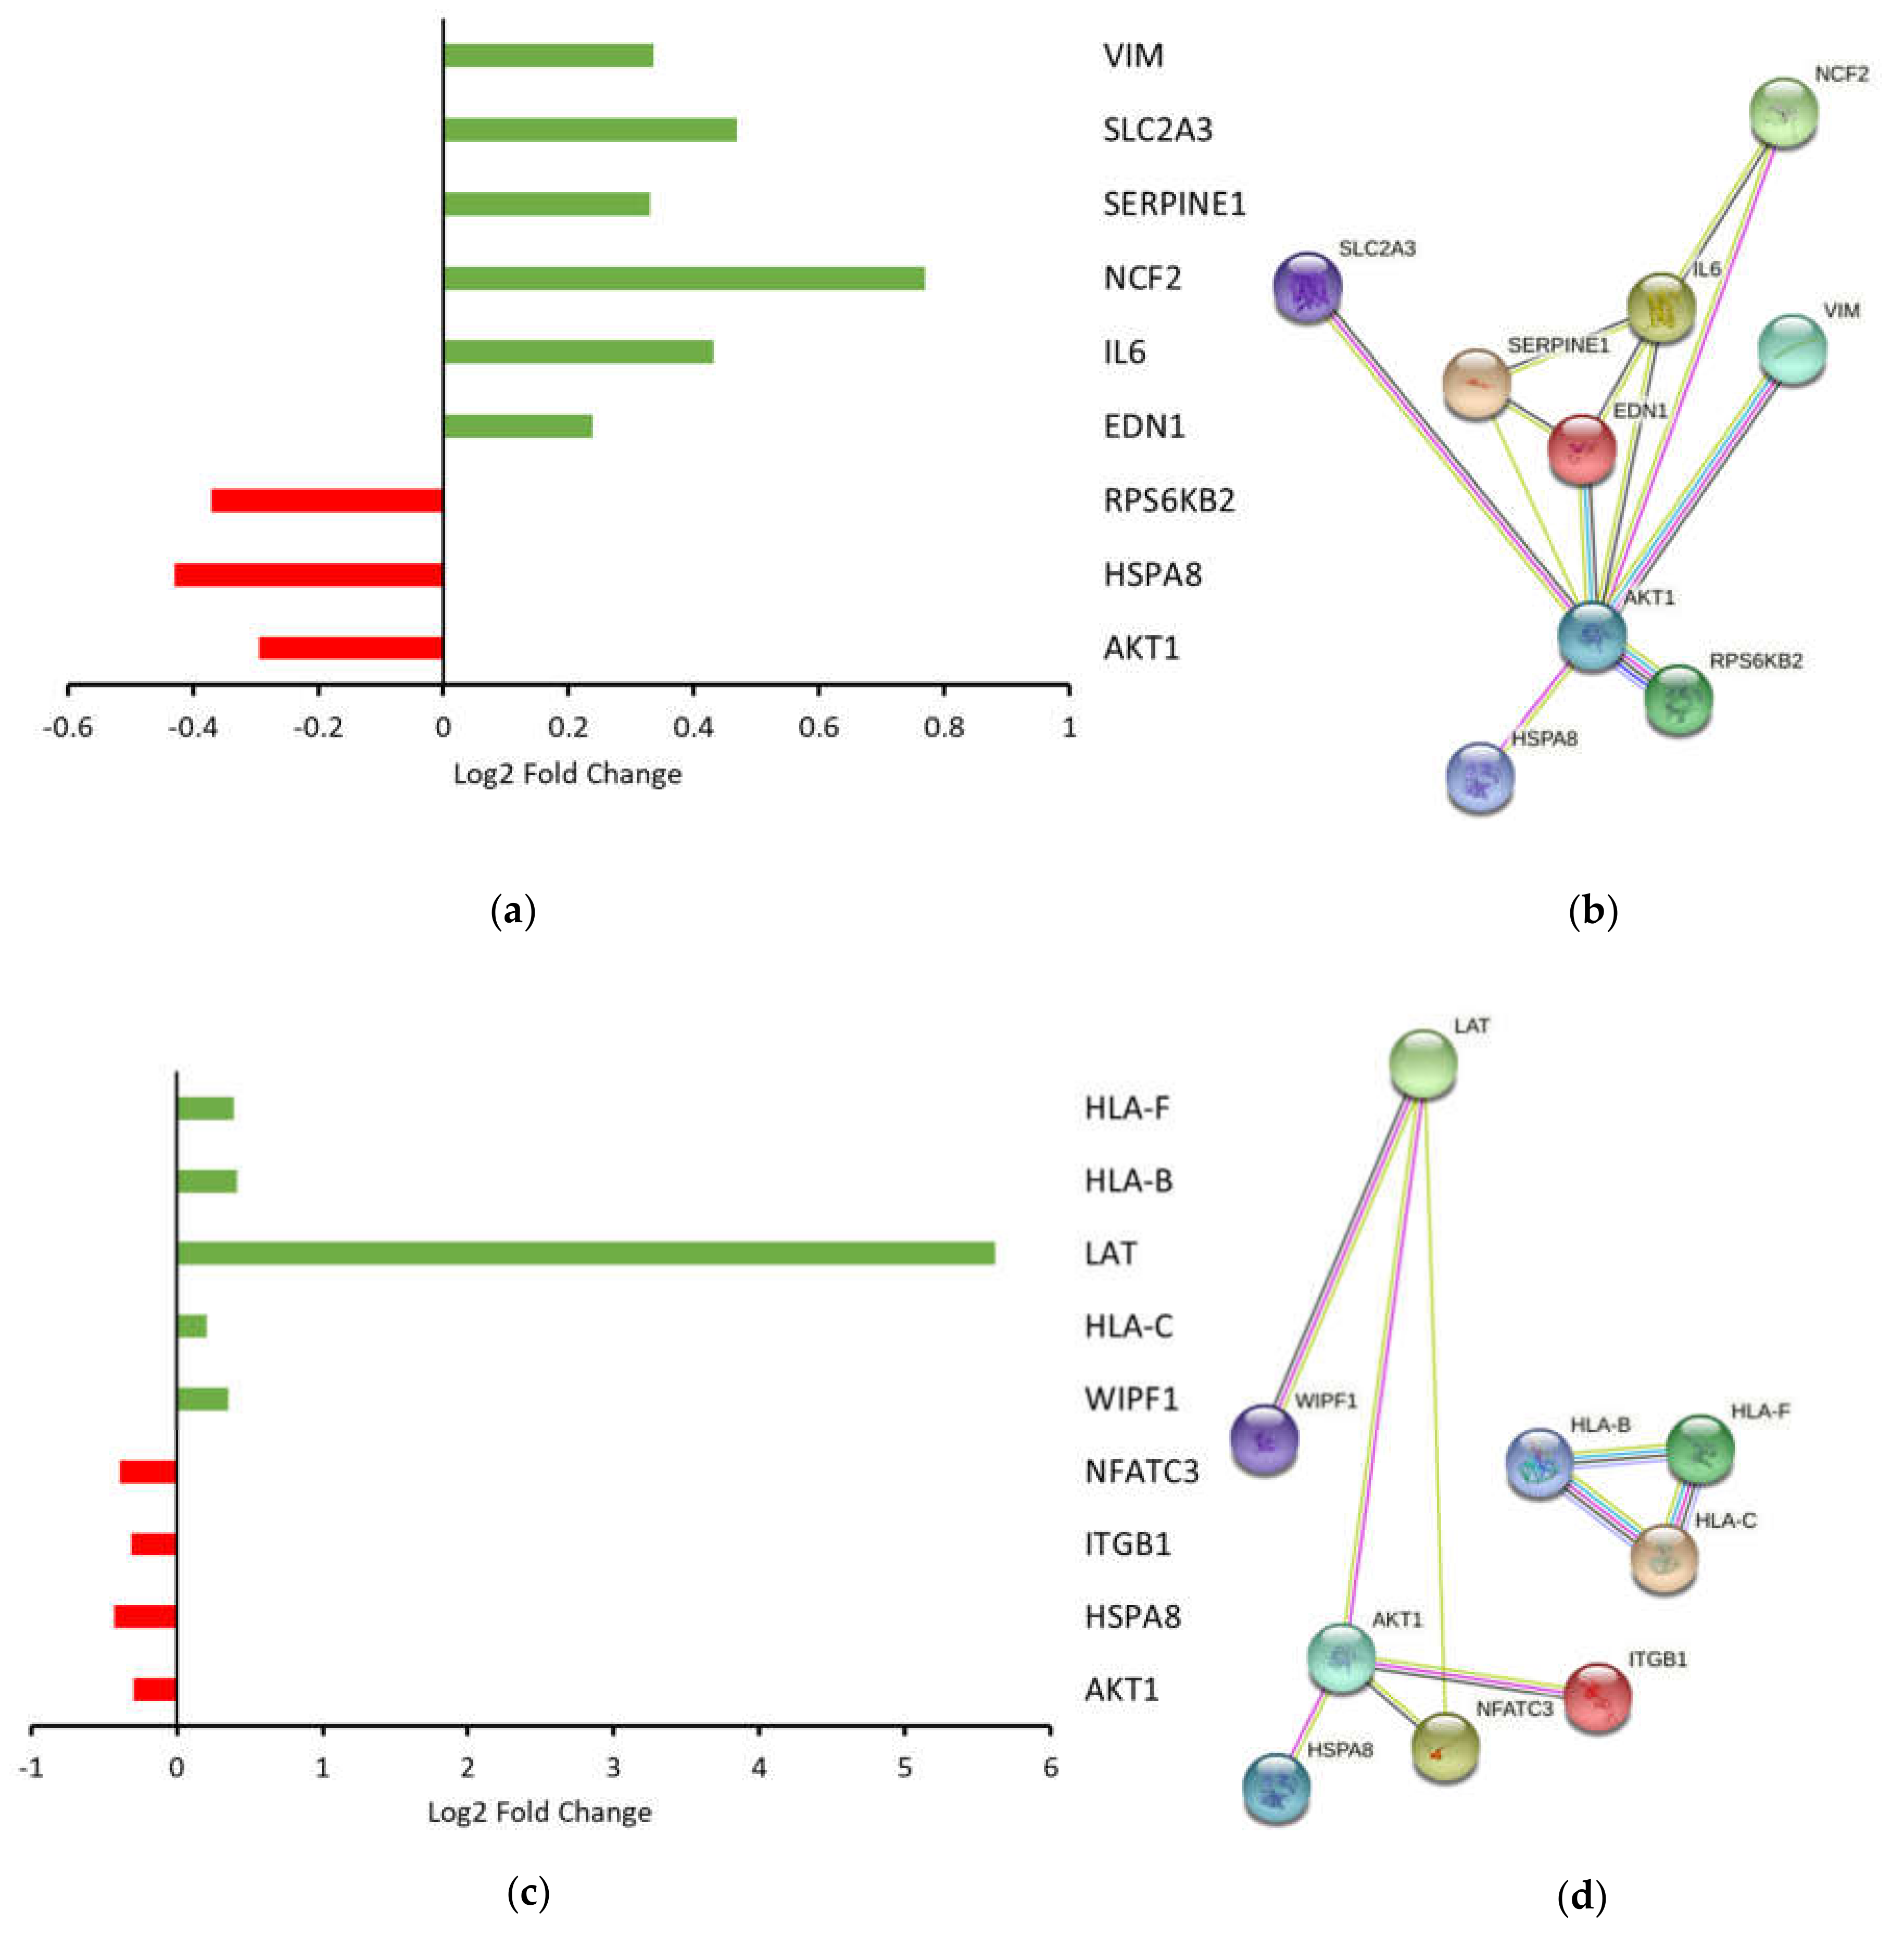
ARG1 and compared this with untransfected controls. Pathway analyses revealed that DEG involved in
HIFα and natural killer cell signaling were associated with activation and inactivation of these pathways, respectively. Activation of HIF signaling was initially unexpected, considering the normoxic conditions of our cell culture. However, various studies have shown that HIF signaling may be activated by factors besides oxygen status, including Fe2
+ chelation [
19], overproduction of ROS [
20] and activation of various growth factor signaling pathways [
21]. Indeed, we revealed that
ARG1 overexpression led to upregulation of
IL6, a transcriptional precursor of
HIFα. Overall, activation of HIF signaling suggested that oral tongue cancer cells were attempting to adapt to survive in an unfavorable microenvironment by increasing expression of genes involved in vascular tone, superoxide/energy production, glucose transport and mesenchymal transition.
Events leading to natural killer cell activation are likely to occur simultaneously with inhibitory events and may depend on specific cell-to-cell interactions and the surrounding microenvironment [
22]. Consistent with this theory, we detected upregulation of genes known to elicit proimmune cell functions and downregulation of genes associated with a dampened immune response. Despite this, IPA analyses suggested that the natural killer cell signaling pathway was inhibited based on gene expression data. For example, downregulation of integrin subunit beta 1 (
ITGB1), a crucial activating receptor upstream of natural killer cell signaling, suggests a pathway impairment. In addition, reduced
AKT1 (RAC-alpha serine/threonine-protein kinase) underscores a general constraint on cells that require MAPK signaling, including natural killer cells. Finally, downregulation of nuclear factor of activated T cells (
NFATC1) indicates a reduced capacity to regulate the activation, proliferation and differentiation of natural killer and other immune cells. While these are up- or downstream events, these data suggest that ARG1 overexpression rewires oral cancer cell signaling to prime a dampened natural killer cell associated immune response.
In spite of this, one of the most upregulated genes detected in the dataset was linker for activation of T cells (
LAT). The phosphorylated and therefore activated protein product of this gene recruits multiple downstream molecules in immunology-related pathways and is involved in the first steps of T-cell receptor signal transduction [
23]. Presumably,
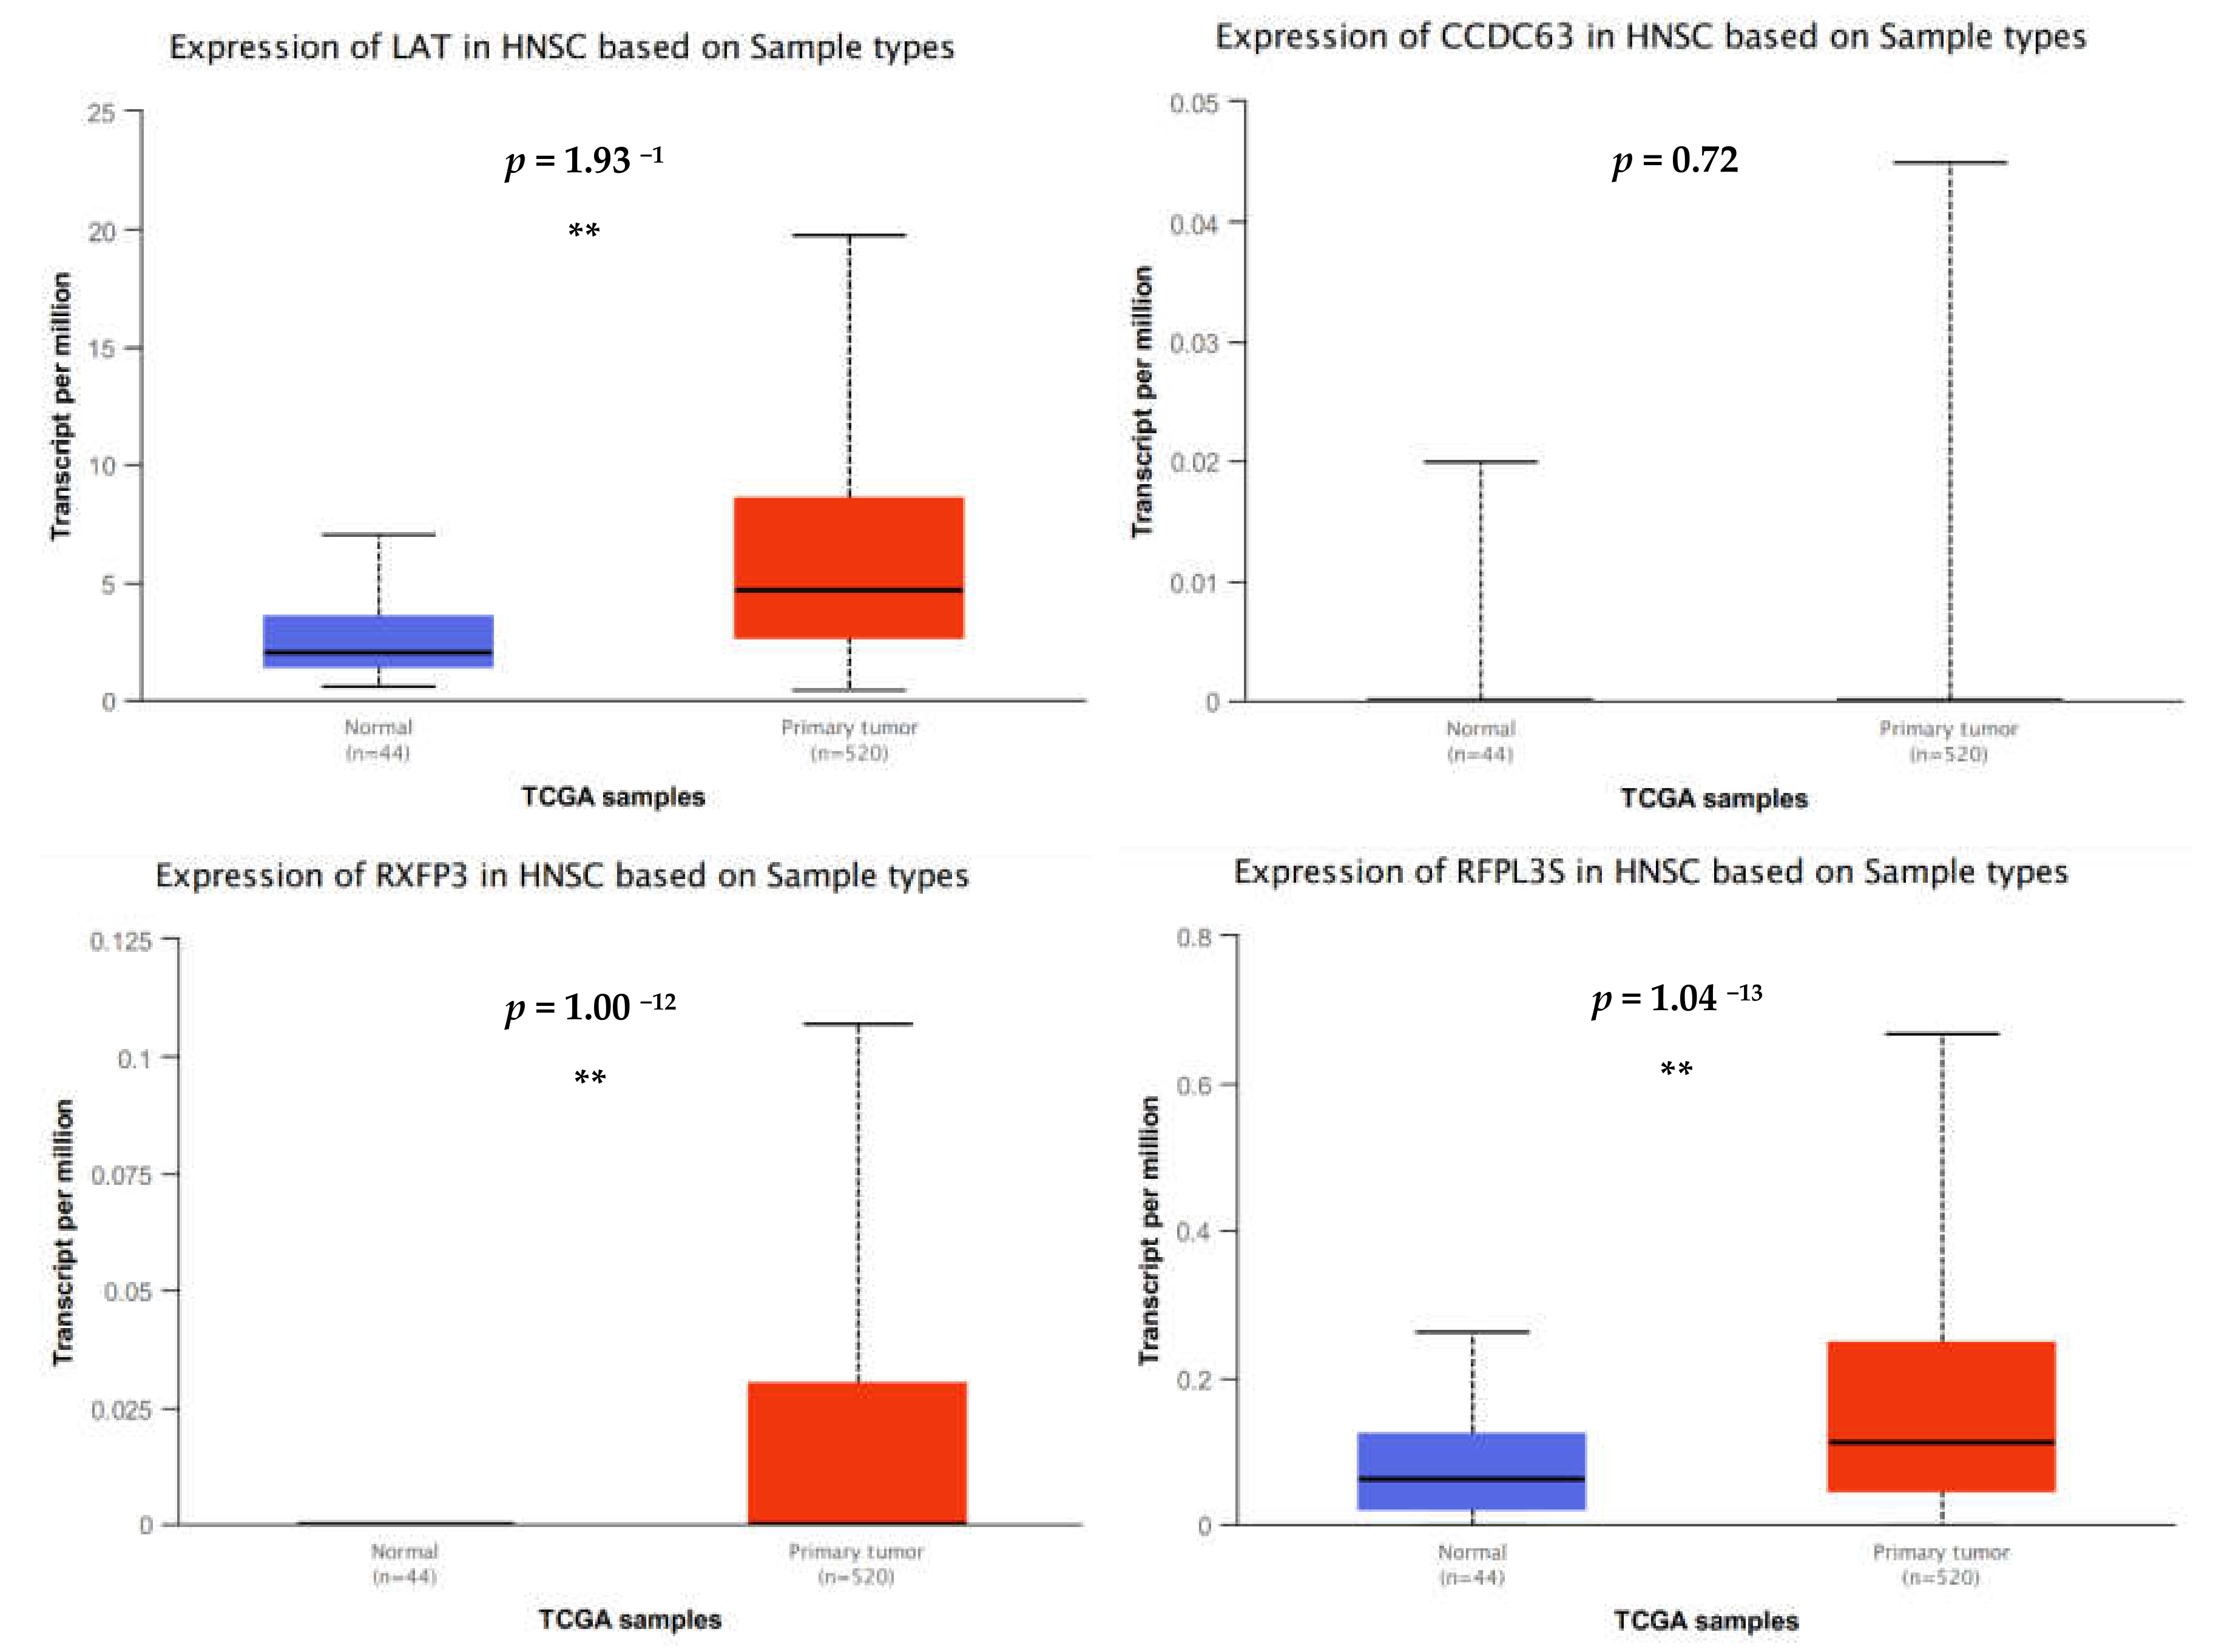
LAT expression facilitates antigen recognition, which would translate to an enhanced immune response. A recent study suggested that overexpression of
LAT in head and neck cancer was associated with a good prognosis based on an in silico investigation using gene expression data from the TCGA [
24]. However, this trend was the opposite in another study, where overexpression of
LAT was associated with poorer overall survival among patients with clear cell renal cell carcinoma [
25]. Regardless, immunohistochemical validation of protein expression failed to convincingly support gene expression data and suggests that LAT protein expression is typically absent or low in most tumor tissues [
24,
26]. In aggregate, these findings suggest that
LAT overexpression may be a common phenomenon whereby most cells are equipped with the machinery to facilitate T-cell receptor signaling. However, subsequent failure to phosphorylate and activate LAT renders this protein inactive. In other words, we suggest that overexpression of
LAT at the gene level occurs in response to
ARG1 transfection and may enhance the antigen presentation capacity, but the downstream ramifications of this are unknown. Given the incomplete knowledge about arginine metabolism in nonauxotrophic oral tongue cancers, and clinical trial results showing that ARG1 mimics impair antitumor T-cell responses, these findings highlight an important gap in our knowledge [
27].
The most highly downregulated gene was relaxin family peptide receptor 3 (
RXFP3), a G-protein-coupled receptor that is thought to inhibit cAMP production and activate ERK1/2, PI3K- or PKC-dependent pathways [
28]. Besides these roles,
RXFP3 may possess a range of diverse signaling functions in the absence of its cognate ligand, all of which are uniquely related to the type of cell under investigation [
28,
29]. In age degeneration studies, elevated RXFP3 expression occurs in response to DNA damage whereby it indirectly regulates cellular degradation [
29]. That is, increased RXFP3 appears to attenuate the impact of DNA damage stress and may be associated with an augmented cellular protection from stress that enables cellular recovery. To date, there have been no studies to examine whether a similar process occurs in cancer cells. However, considering that
ARG1 overexpression led to downregulation of
RXFP3, it is tempting to speculate that this signaling axis may dampen oral cancer cellular ability to cope with DNA damage stress. This theory is consistent with results from our functional studies showing that
ARG1 overexpression constrains oral tongue cancer cells.
Head and neck cancer cells, including oral tongue cancer cells, are nonauxotrophic for arginine and can readily synthesize this semi-essential amino acid de novo. Therefore, theoretically ARG1 overexpression in nonauxotropic oral tongue cancer cells would lead to increased arginine catabolism and increased polyamine production, which would fuel cell proliferation and growth. However, our collective results do not support this theory. We showed that ARG1 overexpression constrains but does not efficiently kill oral tongue cancer cells by mediating associated signaling networks. Our gene expression data suggest that oral tongue cancer cells attempt to adapt to unfavorable conditions induced by ARG1 overexpression, as well as indirectly prime a dampened immune response to facilitate survival. In stark contrast, decreased RXFP3 expression suggests that oral cancer cells fail to perambulate increased DNA damage, a phenomenon that is associated with heightened metabolism and ROS production and occurs in response to ARG1 overexpression.


 ,
, 


