Article

High Grade of Amplification of Six Regions on Chromosome 2p in a Neuroblastoma Patient with Very Poor Outcome: The Putative New Oncogene TSSC1

1
U.O.C. Genetica Medica, IRCCS Istituto Giannina Gaslini, 16147 Genova, Italy
2
U.O.C. Oncologia Pediatrica, IRCCS Istituto Giannina Gaslini, 16147 Genova, Italy
3
U.O. Pediatria, Oncologia e Ematologia Pediatrica, IRCCS Azienda Ospedaliero-Universitaria S. Orsola, 40138 Bologna, Italy
4
Unità di Bioinformatica Clinica, IRCCS Istituto Giannina Gaslini, 16147 Genova, Italy
5
UOSID Epidemiologia e Biostatistica, IRCCS Istituto Giannina Gaslini, 16147 Genova, Italy
6
IRCCS Istituto Giannina Gaslini, 16147 Genova, Italy
*
Author to whom correspondence should be addressed.
These authors contributed equally to this work.
Cancers 2021, 13(22), 5792; https://doi.org/10.3390/cancers13225792
Submission received: 28 September 2021 / Revised: 14 November 2021 / Accepted: 16 November 2021 / Published: 18 November 2021

Abstract

:

Simple Summary

Here, a case of neuroblastoma (NB) carrying a high-grade amplification of six loci besides MYCN is described. Since the patient had a very poor outcome, we postulated that these DNA co-amplifications might have a synergistic effect in increasing NB cell proliferation. In order to verify this hypothesis, we analyzed in silico the impact of high expression of the genes located within the amplifications on the NB patients’ outcome using a large dataset integrating three different platforms. These analyses disclosed that high expression of the TSSC1 gene was the most significantly associated with reduced overall survival of NB patients, suggesting that it may have a potential prognostic role in NB in both MYCN amplified and MYCN not amplified tumors. Further studies on TSSC1 interactions and functioning could lead to possible focused therapies for high-risk NB patients.

Abstract

We observed a case of high-risk neuroblastoma (NB) carried by a 28-month-old girl, displaying metastatic disease and a rapid decline of clinical conditions. By array-CGH analysis of the tumor tissue and of the metastatic bone marrow aspirate cells, we found a high-grade amplification of six regions besides MYCN on bands 2p25.3–p24.3. The genes involved in these amplifications were MYT1L, TSSC1, CMPK2, RSAD2, RNF144A, GREB1, NTSR2, LPIN1, NBAS, and the two intergenic non-protein coding RNAs LOC730811 and LOC339788. We investigated if these DNA co-amplifications may have an effect on enhancing tumor aggressiveness. We evaluated the association between the high expression of the amplified genes and NB patient’s outcome using the integration of gene expression data of 786 NB samples profiled with different public platforms from patients with at least five-year follow-up. NB patients with high expression of the TSSC1 gene were associated with a reduced survival rate. Immunofluorescence staining on primary tumor tissues confirmed that the TSSC1 protein expression was high in the relapsed or dead stage 4 cases, but it was generally low in NB patients in complete remission. TSSC1 appears as a putative new oncogene in NB.

1. Introduction

Neuroblastoma (NB) is an embryonal tumor arising from the neuronal crest cells of the sympathetic nervous system [1,2]. The overall genomic profile is a salient prognostic marker, which is used for treatment stratification of NB patients [2,3,4,5,6,7]. MYCN amplification is the most important genomic marker in terms of prognosis and impact on treatment decisions [1,2]. High MYCN expression deregulates the pathways of telomere lengthening, causing mitochondrial dysfunctions and replicative stress [8]. Amplification of MYCN occurs in 50% of high-risk NB cases, while high-risk MYCN single copy NB often express c-MYC as the oncogenic driver [9]. There is an incompatibility between MYCN amplification and other oncogenic events such as genomic rearrangements involving the TERT locus or mutations of the ATRX gene [10]. Other genomic amplifications targeting various loci, different from MYCN, were described [11,12,13,14,15,16,17,18]. The amplified loci, other than MYCN, observed in NB were: ODC1 (2p25.1), ALK (2p23.2), GREB1 (2p25.1), NTSR2 (2p25.1), TERT (5p15.33), LIN28B (6q16.3), MYC (8q24.21), MYEOV (11q13.2), CCND1 (11q13.3), MDM2 (12q13.3), CDK4 (12q14), and FRS2 (12q15) [11,12,13,14,15,16,17,18]. Of note, NB patients with an amplicon not encompassing the MYCN locus have a very low survival probability [17], and these high-risk NB patients often display chemotherapy-resistant tumors. For the amplicons involving the genes ODC1, ALK, CDK4, MDM2, MYC, TERT, FRS2, and CCND1, inhibitors are currently being tested in clinical trials [19,20,21,22]. Little is known about the clinical characteristics and the survival of NB patients harboring genomic amplifications syntenic with MYCN [23,24]. DDX1, NAG, NBAS, and GREB1 genes are frequently co-amplified with MYCN in NB primary tumors. However, the relationship between the high expression of these genes and NB patients’ prognosis is not shown to be significant [25]. MYCN amplification accompanied by multiple amplified loci within 2p, encompassing the genes MYT1L, TSSC1, CMPK2, RSAD2, GREB1, NTSR2, LPIN1, LOC339788, LOC730811, and NBAS, was reported in some individual cases of unfavorable NB [26]. Among these genes, MYT1L is of particular oncogenic interest in NB since it encodes for a zinc finger protein expressed in developing neurons at an early stage of differentiation [27], but it is not associated with unfavorable NB prognosis. Recently, in a study on the correlation between mitochondrial DNA haplogroups and susceptibility to NB, the expression of CMPK2, a nuclear gene participating in the mitochondrial pathway, was analyzed by RNA sequencing in 85 primary NB tumors, and the results showed over-expression in high-risk NB tumors [28].
Here we reported on a patient with high-risk stage 4 NB and adverse clinical behavior presenting a tumor carrying high-grade amplification of six loci besides MYCN, including the genes MYT1L, TSSC1, CMPK2, RSAD2, RNF144A, GREB1, NTSR2, LPIN1, NBAS, and the two long intergenic non-protein coding RNAs LOC730811 and LOC339788. These findings open the way for the identification of putative new NB oncogene(s) in 2p25.3–p24.3 as possible targets for future therapies.

2. Materials and Methods

2.1. Case Description

A 28-month-old girl was referred to our examination for fever and lack of appetite associated with fatigue and asthenia. Physical examination findings included skin pallor, petechiae in the upper and lower limbs, tender and distended abdomen with hepatomegaly, and a palpable mass in the left iliac fossa. Ultrasonography showed a solid abdominal mass confirmed by a CT scan that showed a median retroperitoneal solid mass (11 × 10 × 13 cm) with the presence of a necrotic-colliquative component and fine calcifications, hepatomegaly with edema of the portal spaces, and the presence of at least three-millimeter focal lesions of likely secondary significance, respectively, to the IVs (7 mm), IIIs (3 mm), and VIs (4 mm). The blood test results were: hemoglobin 7.9 g/dL, leucocytes 28.50 × 10³/µL, piastrinopenia with a platelet count of 34 × 103/µL, lactate dehydrogenase 6043 U/L, and activated protein C 17.32 mg/dL. The liver function tests revealed direct and total bilirubin levels of 1 and 1.65 mg/dL, respectively, elevated aspartate aminotransferase (AST) 449 U/L and a normal level of alkaline aminotransferase (ALT, 22 U/L). Urinary catecholamines were pathologic (homovanillic acid and vanillylmandelic acid 90.6 and 352.2 µmol/mmol, respectively). The patient presented a rapid decline in clinical conditions associated with severe hypoglycemia (20 mg/dL) and hyponatremia (123 mg/dL). At diagnosis, the patient had evidence of metastatic disease with massive infiltrating neoplastic cells in the bone marrow and was therefore considered as high-risk NB [29] and treated according to European HR-NBL1/SIOPEN protocol [30]. She received the first course of chemotherapy, but liver failure, impaired coagulation, oliguria that was unresponsive to diuretics, multi-organ failure, and progressive disease caused her death only 4 days after the diagnosis.
The pathological diagnosis was stroma poor, poorly differentiated, stage 4 NB. Primary NB tissue and metastatic bone marrow aspirate cells were obtained before treatment at the time of diagnosis. Tumor samples were stored in the BIT-NB (Biobank Integrated Tumor—Neuroblastoma) Tissue Section of IRCCS G. Gaslini, Genova, Italy. DNAs were extracted using QIAamp DNA Extraction Kit (Qiagen, Hilden, Germany), according to the manufacturer’s instructions.

2.2. Genomic Profile Analysis

DNAs from primary NB and metastatic bone marrow aspirate cells were tested by high-resolution oligonucleotide a-CGH using the 4 × 180 K Kit (Agilent Technologies, Santa Clara, CA, USA) with a mean resolution of approximately 25 kb [31]. Each hybridization produced a pair of 16-bit images, which were processed using the Agilent Feature Extraction 10.5 Software. The data were analyzed using the Genomic Workbench 7.0.40 software (Agilent Technologies, Santa Clara, CA, USA), the altered chromosomal regions and breakpoints events were detected using ADM-1 (threshold 10) with 0.5 Mb window size to reduce false positives [32]. Amplifications were defined at loci with log2 ratio ≥ 2, and loci with log2 ratio ≥3.5 were considered as high-level amplifications. Chromosome positions were determined using GRCh38/hg19 (UCSC Genome Browser, http://genome.ucsc.edu, accessed on 10 June 2021. The chromosomal copy number variations present in the Database of Genomic Variants (DGV: http://projects.tcag.ca/variation/, accessed on 28 July 2021) were taken into consideration only with a frequency <5%. The raw data were stored in the BIT-NB (Biobank Integrated Tumor—Neuroblastoma) Genomic Section of IRCCS G. Gaslini.
Written informed consent was obtained from the parents in accordance with the Declaration of Helsinki to report the case of their child. This study was approved by the Italian Institutional Ethics Committee (Measure n° 270/17 related to the clinical study protocol IGG-NCA-AP-2016).

2.3. Data Source

We inquired about any association between the high expression of the genes located within 2p amplifications and the NB patient’s survival using public gene expression data. A dataset of gene expression profiles from 786 NB primary tumors with associated patient clinical and molecular information was recently summarized by Cangelosi et al. [33]. This dataset was obtained integrating gene expression data from three different platforms, thereby representing the largest dataset of matched gene expression profiles and clinical data about NB patients available in the literature to date [33]. The dataset summarized by Cangelosi et al. was used to carry out gene expression and survival analyses of all genes except NTSR2 and the two long non-coding mRNA (LOC339788 and LOC730811), whose expression was not available in the dataset.
Analysis involving NTSR2 gene and LOC339788 and LOC730811 loci were performed using the gene expression profile of 709 and 498 NB tumor samples generated by Agilent customized 4 × 44 K oligonucleotide microarray [34] and Illumina HiSeq 2000 platform [35], respectively. Gene expression and clinical data included in these datasets were publicly accessible through the ArrayExpress (http://www.ebi.ac.uk/arrayexpress; accession: E-MTAB-1781, accessed on 20 June 2021) and the Gene Expression Omnibus (http://www.ncbi.nlm.nih.gov/geo; accession: gse62564, accessed on 20 June 2021) databases.
The main characteristics of the selected datasets are resumed in Table 1. More information about the datasets structure and the original gene expression experiments are available in the related publications [33,34,35]. The level of expression of the target genes in the normal adrenal gland tissue, obtained from the Genotype-Tissue Expression (GTEx) database [36], is shown in Table S1.

2.4. Immunofluorescence Detection

Immunofluorescence analysis was performed on formalin-fixed, paraffin-embedded NB specimens (4 µm thick), as previously described [37]. TSSC1 protein expression and localization were revealed by incubation with the mouse monoclonal antibody TSSC1 (C7) (sc-376124 by Santa Cruz Biotechnology, Dallas, TX, USA) followed by a specific secondary antibody conjugated with Alexa 488 (green). We used isotype-matched non-binding mAbs in all antibody staining experiments to avoid nonspecific reactivity. Slides were counterstained with 4′,6′-diamidino-2-phenylindole (DAPI) (Vector Laboratories, Peterborough, UK) to visualize nuclei. The results were photographically documented using fluorescence microscope Axio Imager M2 equipped with ApoTome System (Carl Zeiss, Oberkochen, Germany). Each tested tumor area contained malignant NB cells, as assessed by histologic examination. The quantification of immunofluorescence positive tumor cells was performed on serial tissue sections, thus allowing quantification in tumor areas selected by the pathologist. TSSC1 protein is a component of the endosomal retrieval machinery, so green particles in the cytoplasm were considered to be positively stained cells following immunofluorescence detection. The results were analyzed according to the cell staining intensity and the percentage of TSSC1-positive cells. In total, 5 high-power fields were randomly selected for every section, and target cells were counted. The average percentage of 5 high-power fields was used for result determination.

2.5. Statistical Analysis

The expression levels of LOC339788 non-coding mRNA were categorized into two categories because most expression values (n = 370, 74.3%) were tied to a single value equal to 0.0143553 arbitrary units, which allegedly corresponded to very low gene expression. Therefore, all analyses were performed by splitting the data on the basis of such cut-off. Expression levels of all the other genes were considered as continuous variables.
Differences between the expression of each considered gene, except LOC339788, by the patient prognostic factors at diagnosis (age, MYCN status, and stage) was evaluated by boxplot graphs and tested by the Mann–Whitney U test for pairwise comparisons and the Kruskal–Wallis test in the presence of more than two groups. With regard to LOC339788 expression levels, differences by patient prognostic factors were assessed by the chi-squared test or the Fisher exact test when appropriated.
Association between gene expression and patient survival was evaluated by the Kaplan–Meier method. Values of each gene, except LOC339788, were split both into two and into three groups of equal sample size on the basis of the median and tertiles values, respectively, and the related 95% confidence intervals (95% CI) of survival estimates were obtained by the Kalbfleisch and Prentice method [38].
Both overall (OS) and Event Free survival (EFS) were estimated. Overall Survival time was calculated from the date of diagnosis to the date of death or to the last contact for censored data. Event Free survival was calculated from the date of diagnosis to the first occurrence between death and disease recurrence. No information was available about the occurrence of secondary tumors.
The statistical comparison between Kaplan–Meier curves was performed by using the log-rank test and by the log-rank test for trends when appropriated. The multivariable Cox regression model was also applied to adjust for the confounding effect of the available prognostic factors at diagnosis (MYCN status, age, and stage) [38]. The original non-categorized expression values were also analyzed by the Cox model to evaluate the presence of a linear trend between the gene expression and the patient survival.
The sub-group analyses included stratification by MYCN status and stage at diagnosis (localized, including stages 1, 2, and 3, stage 4 and stage 4S). Analyses restricted to the subgroup of patients with characteristics similar to those of the proband (i.e., age ≥ 18 months at diagnosis, Stage 4 and amplified MYCN status) were also performed.
All tests were two-tailed, and a p-value < 0.05 was considered statistically significant. All analyses were performed by STATA statistical software (release 13.1, Stata Corporation, College Station, TX, USA).

3. Results

3.1. Genomic Profile Analysis

Molecular genomic profiling of tumor tissue led us to describe the concomitant high grade amplification of six loci located at: 2p25.3 (log2 ratio = 4.47) containing MYT1L and TSSC1 genes and the long intergenic non-protein coding RNA LOC730811; 2p25.2 (log2 ratio = 4.38) containing CMPK2, RSAD2, and RNF144A genes; 2p25.1 (log2 ratio = 3.758) containing the long intergenic non-protein coding RNA LOC339788; 2p25.1–p24.3 (log2 ratio = 4.05) containing GREB1, NTSR2, and LPIN1 genes; 2p24.3 (log2 ratio = 4.36) containing NBAS gene; 2p24.3 (log2 ratio = 4.29) containing MYCN gene (Figure 1A). Primary tumor harbored the segmental chromosome alterations typical of NB, 1q gain, and 17q gain, and the atypical 5p gain, containing the TERT gene, and several numerical alterations (Figure 1B). It is impossible to know if the tumor even showed a TERT rearrangement since only a-CGH data were available; however, these rearrangements are almost mutually exclusive with MYCN amplification. The six co-amplified regions on bands 2p25.3–p24.3 were detected, identical to the primary tumor, also in the metastatic bone marrow aspirate cells from the patient. The other cytogenetic abnormalities present in the primary tumor were not identified in the metastatic bone marrow cells (Figure 1A,C).

3.2. Association between Patient Survival and Expression of RNF144A

Association between patient characteristics at diagnosis and RNF144A expression levels are shown in Figure 2. Statistically significant higher values were observed for patients diagnosed before 18 months of age (Figure 2A), with normal MYCN status (Figure 2B), and with localized stages or stage 4S (Figure 2C).
The occurrence of both events and deaths were associated with lower expression values (Figure S1A,B, respectively). When stratifying by age at diagnosis, the difference was no longer significant (Figure S1C,D) but remained evident among patients with normal MYCN status (Figure S1E,F) and with stage 4 disease (Figure S1G,H) or localized stage (death occurrence only, Figure S1H).
Figure 3A,B show the Overall Survival (OS) curves of the entire cohort of NB patients (n = 786) in relation to RNF144A expression levels. Higher values were associated with better survival (Figure 3A) with a statistically significant trend (Figure 3B). Multivariable analysis confirmed this finding (Table 2). Stratification by MYCN status (Table S2) indicates that the potentially protective effect of the high-level gene expression was limited to patients without MYCN amplification. The analysis by stage at diagnosis (Table S3) confirmed the better survival of patients with higher gene expression levels both in localized stages and in metastatic ones, except stage 4S, but for the latter, evidence was based on a very small number of deaths. Figure 3C,D show the Event Free Survival (EFS) of the cohort of 769 NB patients. Survival was better for higher values of RNF144A expression (Figure 3C) with evidence of a trend (Figure 3D). In multivariable analysis, this association was less evident and remains statistically significant only when the non-categorized original variable was considered (continuous variable) (Table 3). Table S4 shows the EFS stratified by MYCN status. The association between high gene expression levels and survival was observed only in patients with normal MYCN status. Analysis by stage at diagnosis (Table S5) confirmed the observed association among Stage 4 patients only.
The results of the analysis restricted to patients with stage 4 disease showed that amplified MYCN status and age ≥ 18 months (Figure S2) showed a better OS for patients with expression values above the median, but statistical significance was borderline (p = 0.054). No difference appears for the EFS or when data were stratified by tertile values (Figure S2B–D).

3.3. Association between Patient Survival and Expression of MYT1L

The comparisons between MYT1L expression levels by patient characteristics at diagnosis are displayed in Figure 4. Lower values were associated with older age (Figure 4A), amplified MYCN status (Figure 4B), and stage 4 disease (Figure 4C).
Lower expression values were observed among patients with events (Figure S3A) and deceased (Figure S3B). This association was also observed after stratifying by age at diagnosis (Figure S3C,D), MYCN status (Figure S3E,F), and stage, with the only exception of Stage 4S patients (Figure S3G,H).
Figure 5 shows the OS curves (A–B) of the whole cohort of NB patients (n = 786) by MYT1L expression levels. A favorable outcome was associated with higher values of gene expression (Figure 5A) with clear evidence of trend (Figure 5B). This association was confirmed in multivariable Cox regression analysis (Table 4). Higher values of gene expression were found to be significantly associated with a better OS both in MYCN normal and in MYCN amplified NB (Table S6), and in both localized stages and Stage 4 patients, but not in Stage 4S (Table S7). EFS curves of the cohort of 769 NB patients indicated that survival was higher for higher values of MYT1L expression (Figure 5C) with clear evidence of trend (Figure 5D). Multivariable analysis confirmed this finding (Table 5). Higher gene expression values were associated with higher EFS both after stratifying by MYCN status (Table S8), and by stage at diagnosis, with the exception of Stage 4S patients (Table S9).
Analysis restricted to patients with stage 4 disease, amplified MYCN status, and age ≥ 18 months (Figure S4A–D) did not find any statistically significant association between patient survival and gene expression levels.

3.4. Association between Patient Survival and Expression of TSSC1

Figure 6 shows the comparison between TSSC1 expression levels by patient’s characteristics at diagnosis. Higher expression values were associated with older age (Figure 6A), amplified MYCN status (Figure 6B), and stage 4 disease (Figure 6C).
Higher values were associated with event occurrence (Figure S5A) and deceased patients (Figure S5B). Higher values were also associated with events in older patients (Figure S5C) and with death in both age groups (Figure S5D), with events in patients with MYCN amplification (Figure S5E), and with death in those with both amplified and not amplified MYCN status (Figure S5F). After stratification by stage at diagnosis, higher levels were observed for deceased patients in localized stages and in stage 4 (Figure S5H), whereas the association with event occurrence was no longer evident (Figure S5G).
OS curves related to TSSC1 expression levels reported in Figure 7 showed that a poorer outcome was associated with higher values of gene expression (Figure 7A), with evidence of trend (Figure 7B). The association was still observed and remained statistically significant after adjusting for the available confounding factors in multivariable Cox regression analysis (Table 6). The stratified analysis confirmed the observed association in both non-amplified and amplified MYCN patients (Table S10) and in both localized stages and stage 4 patients (Table S11). With EFS curves, we saw that survival was poorer for higher values of TSSC1 expression (Figure 7C), with evidence of trend (Figure 7D). In multivariable analysis, this association was less noticeable and no longer statistically significant (Table 7). In patients with normal MYCN status, no statistically significant association was observed, whereas, in MYCN amplified NB, higher values of TSSC1 expression were slightly associated with poorer survival (Table S12). Stratification by stage at diagnosis indicated that the association between the gene expression and patient survival was limited to Stage 4 patients (Table S13).
A poorer survival was observed in association with higher TSSC1 expression values among patients with stage 4 disease, amplified MYCN status and age ≥ 18 months (Figure S6A–D), even if statistical significance was achieved for OS only when data were split on the median expression value (Figure S6A).

3.5. Association between Patient Survival and Expression of LOC730811

Figure 8 shows the association between LOC730811 expression and patient characteristics at diagnosis. Higher levels were observed among patients with amplified MYCN status (Figure 8B) and with stage 4 (Figure 8C).
Association between gene expression levels and the outcome (event or death) is shown in Figure S7A–H). No association was found with the occurrence of disease relapse in the whole cohort (Figure S7A) and after stratification by age (Figure S7C), MYCN status (Figure S7E), and stage (Figure S7G). Slightly higher expression values were observed among deceased patients (Figure S7B), which remains statistically significant among younger patients only (Figure S7D).
Figure 9 shows the OS of the whole cohort (n = 498) in relation to LOC730811 long non-coding mRNA expression. A slightly poorer survival was associated with higher values of expression (Figure 9A) but without any evidence of trend (Figure 9B). After adjusting for the available confounding factors in multivariable Cox regression analysis, no association was observed (Table 8). After stratification by MYCN status (Table S14) and by stage at diagnosis (Table S15), no association between expression level and OS emerged. About EFS, no statistically significant association was found splitting the cohort on the basis of either the median (Figure 9C) or the tertile expression values (Figure 9D). The multivariable Cox regression analysis confirmed the lack of association between expression levels and EFS (Table 9). The results from the stratified analysis by MYCN status (Table S16) and by stage at diagnosis (Table S17) did not find any evidence of a potential impact of LOC730811 on EFS.
The analysis restricted to patients with stage 4 disease, amplified MYCN status, and age ≥ 18 months (Figure S8A–D) shows a poorer EFS in relation to higher expression levels (Figure S8B), but without evidence of any trend (Figure S8D).

3.6. Association between Patient Survival and Expression of CMPK2

Figure 10 shows the association between CMPK2 gene expression and the main patient characteristics at diagnosis. Higher expression values were observed among older patients (Figure 10A) and in those with stage 4 at diagnosis (Figure 10C).
Figure S9 shows the association between CMPK2 expression levels and patient outcome. The occurrence of both event (Figure S9A) and dead (Figure S9B) were related to high expression values. This association was no more observed after stratification by age (Figure S9C,D) and stage (Figure S9G,H) but remains evident and statistically significant in patients with normal MYCN status (Figure S9E,F).
In Figure 11, we reported the survival curves of the entire cohort of NB patients in relation to CMPK2 expression levels. OS was slightly poorer in association with a high level of gene expression (Figure 11A) with some evidence of trend (Figure 11B). This association was no longer evident after adjusting for confounding in multivariable Cox regression analysis (Table 10). The stratified analysis highlighted a lower survival in relation to higher values of gene expression among patients with normal MYCN status (Table S18) and in those diagnosed in stage 4, even if in the latter no clear evidence of trend emerged (Table S19). EFS of the cohort of 769 NB patients in relation to CMPK2 expression levels displayed a survival slightly poorer in patients with higher values of gene expression (Figure 11C) with some evidence of trend (Figure 11D). In multivariable analysis, this association was no more evident (Table 11). Higher levels of gene expression were associated with a poorer prognosis among non-amplified MYCN patients, but not for the ones with MYCN amplification (Table S20). Stratification by stage at diagnosis did not find any statistically significant correlation (Table S21).
Analysis of the group of patients with amplified MYCN status, stage 4 disease, and age ≥ 18 months at diagnosis did not find any association between patient survival and CMPK2 expression values (Figure S10).

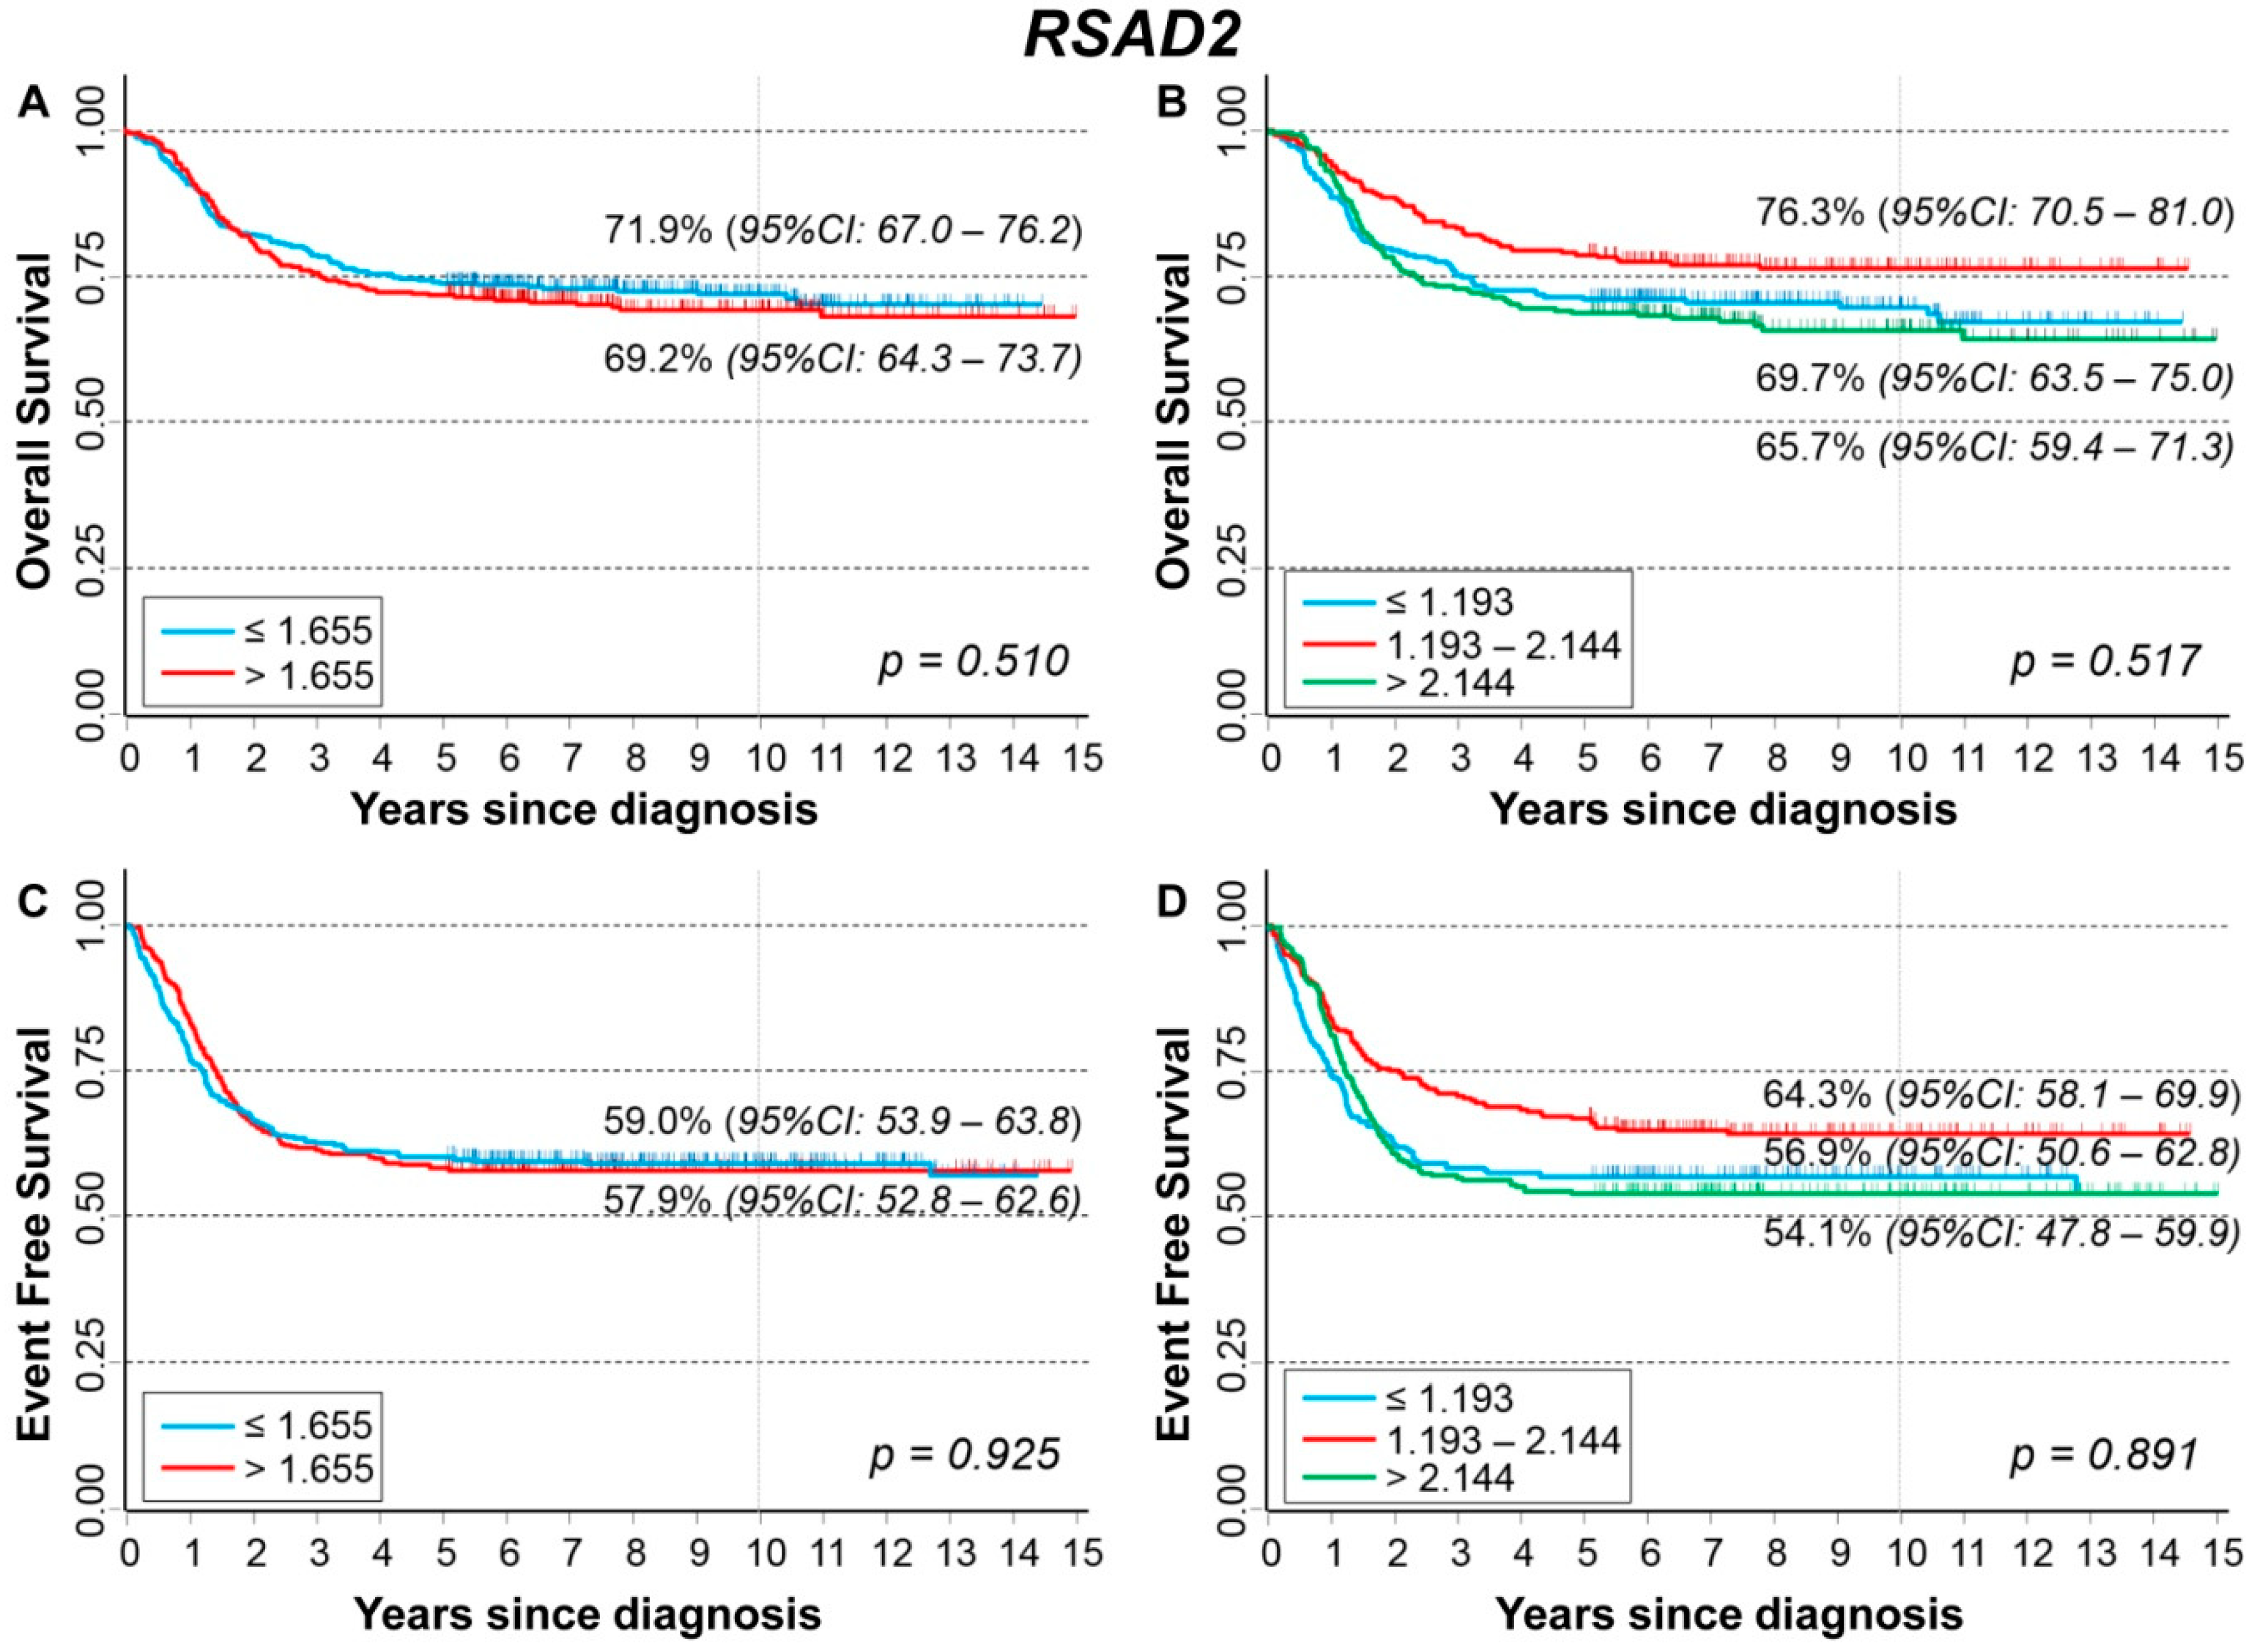
3.7. Association between Patient Survival and Expression of RSAD2

Figure 12 shows the association between RSAD2 gene expression and the main patient characteristics at diagnosis. Significantly higher values were observed among older patients (Figure 12A) and stage 4 patients (Figure 12C).
Gene expression values were not associated with patient outcome (Figure S11A–H) except for slightly lower values in localized stages among deceased patients both for event (Figure S11G) and for dead occurrence (Figure S11H).
Figure 13 shows the survival curves of the entire cohort of NB patients in relation to RSAD2 expression levels. No association was found after splitting the cohort either on the basis of the median (Figure 13A) or the tertiles (Figure 13B) of the gene expression distribution. Multivariable analysis confirmed the lack of any association (Table 12). Neither stratification by MYCN status (Table S22) nor by stage at diagnosis (Table S23) found any significant link between OS and RSAD2 expression. About EFS, no association emerged splitting the data by either median (Figure 13C) or tertile gene expression values (Figure 13D). In multivariable analysis, no clear link between RSAD2 and EFS was observed (Table 13). RSAD2 expression was not found associated with EFS either in normal or in amplified MYCN patients (Table S24). Among patients with localized disease, a poorer survival was observed for those with high values of gene expression (Table S25).
Restriction to patients with age ≥ 18 months at diagnosis, stage 4, and amplified MYCN status did not find any association between RSAD2 expression levels and patient survival (Figure S12).

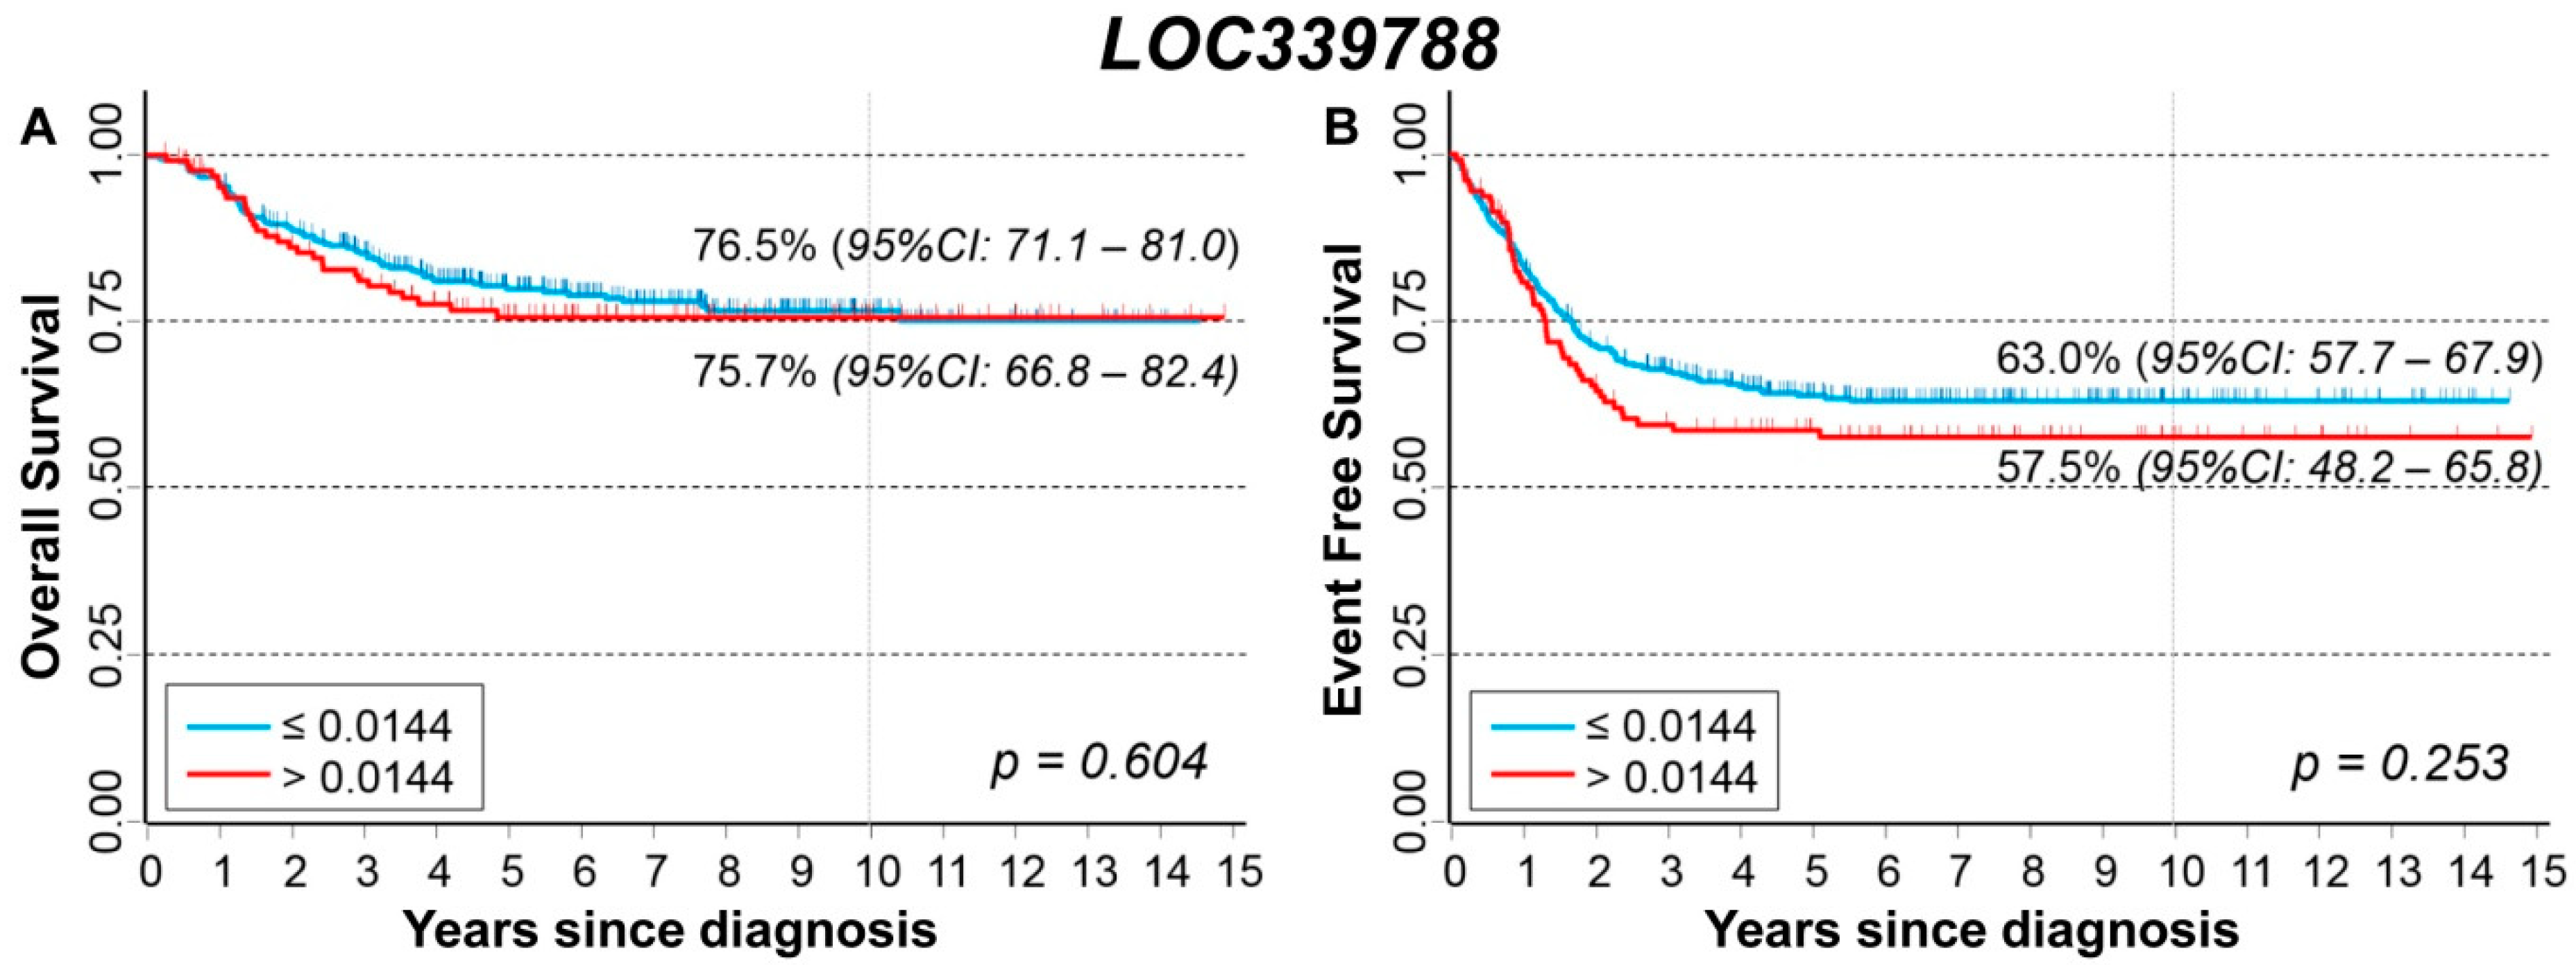
3.8. Association between Patient Survival and Expression of LOC339788

LOC339788 expression levels were analyzed after collapsing all values into two categories using as a cut-off the baseline value. Values above the cut-off were more frequently in MYCN amplified patients (35% vs. 23%, p = 0.024), while no difference was observed by age and stage at diagnosis (Table 14).
No association was observed between LOC339788 expression values and patient outcome except for a slightly higher proportion of observed events in patients with higher expression values compared to those with a lower expression both in the subgroup of aged < 18 months (30% vs. 20%, p = 0.045) and in those diagnosed with a localized stage (30% vs. 18%, Table S26).
Figure 14A shows the OS curves of the entire cohort of NB patients (n = 498) in relation to the expression of the LOC339788 long non-coding mRNA. No association was found. Multivariable analysis confirmed this observation (Table 15). Stratified analysis either by MYCN status (Table S27) or by stage at diagnosis (Table S28) did not find any link between LOC339788 expression and patient survival. Figure 14B, reporting EFS curves, shows that no association emerged. Multivariable analysis confirmed the lack of any association (Table 16). Stratified analysis by MYCN status (Table S29) and stage at diagnosis (Table S30) did not find any link between LOC339788 expression levels and EFS except a slightly poorer outcome among localized stages patients with higher values.

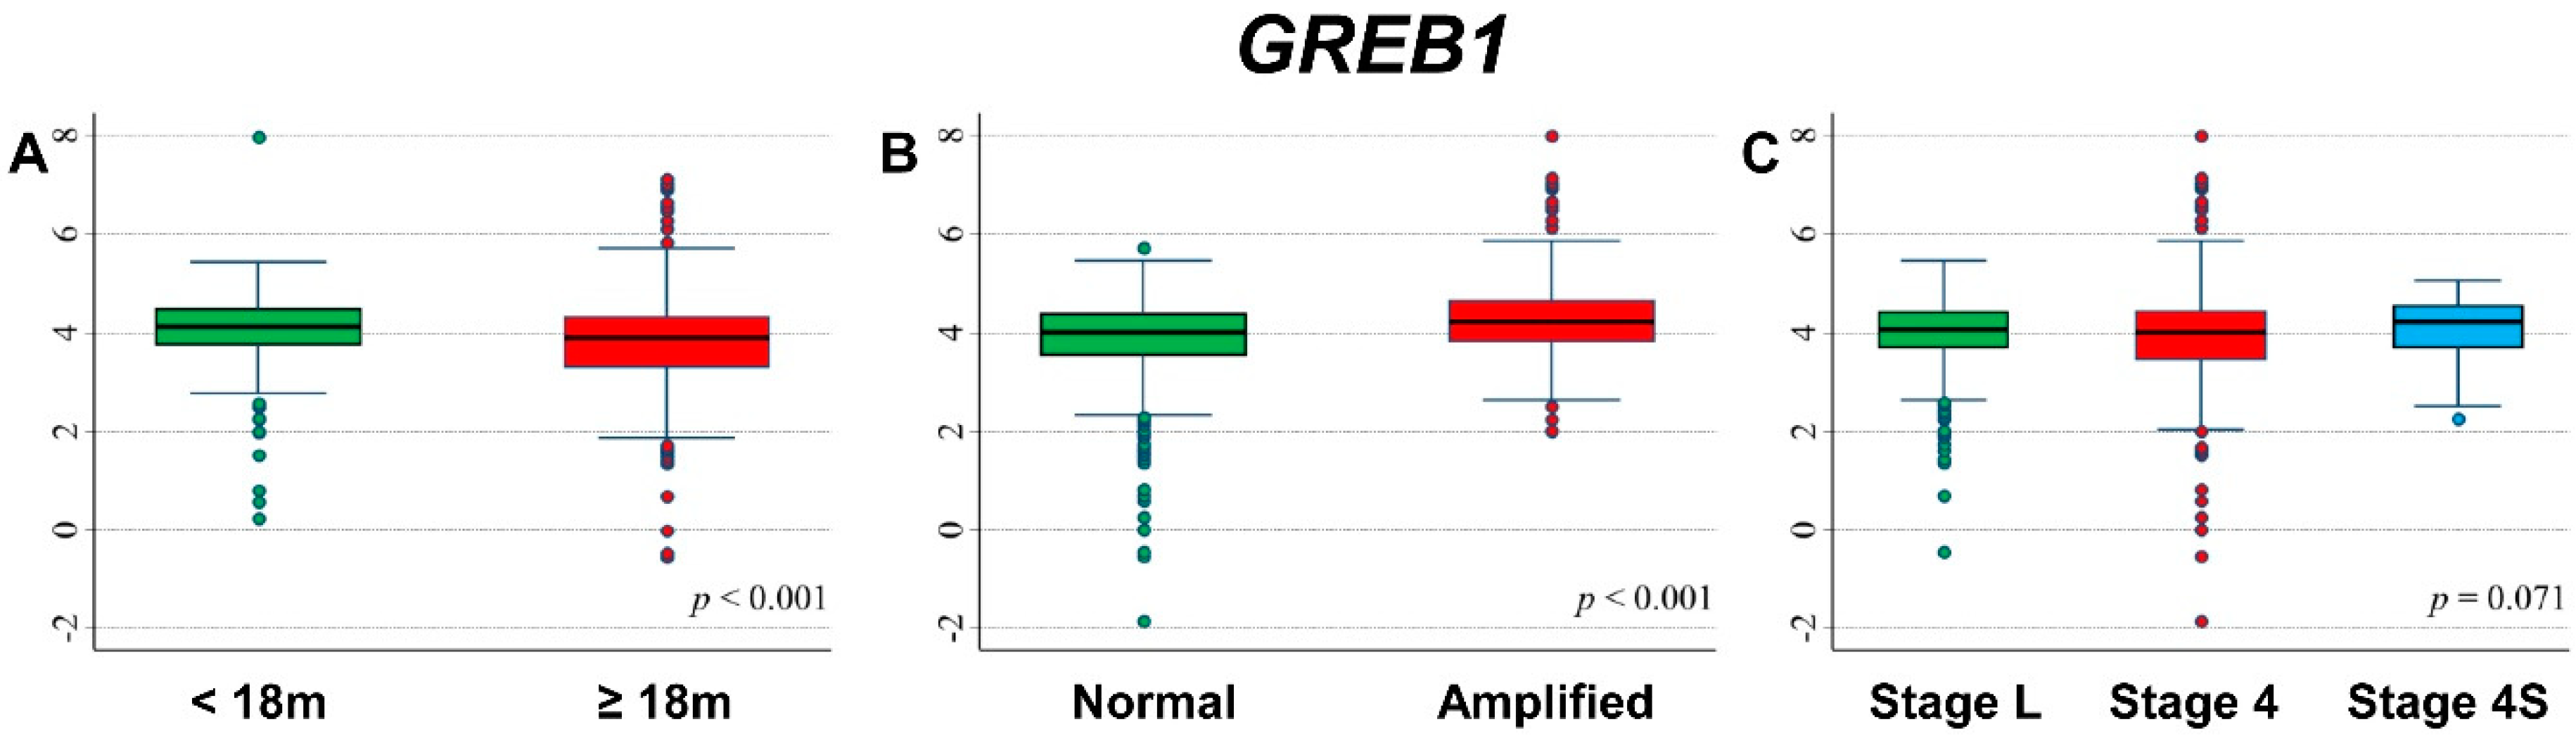
3.9. Association between Patient Survival and Expression of GREB1

Figure 15 shows the association between GREB1 gene expression and the main patient characteristics at diagnosis. Slightly higher values were observed among younger patients (Figure 15A) and in MYCN amplified (Figure 15C).
Association between gene expression and patient outcome is shown in Figure S13. Slightly higher values were observed among patients without events (Figure S13A). In stratified analysis, among patients with normal MYCN status, higher values were observed for patients who did not experience events (Figure S13E) and for those alive (Figure S13F). A similar association was found among patients with a localized stage at diagnosis (Figure S13G,H).
Figure 16 shows the OS curves of the whole cohort (n = 786), referred to as GREB1 expression levels. No association was observed either splitting data on median expression values (Figure 16A) or on the basis of tertile values (Figure 16B). Multivariable analysis confirmed the lack of any association (Table 17). Higher values were associated with a better OS in non-amplified MYCN patients, with evidence of a trend, but not in the ones carrying MYCN amplification (Table S31). Analysis by stage at diagnosis found a positive association between GREB1 expression levels and OS in localized stages (Table S32). About EFS curves related to GREB1 expression, no association was found when data were split on the basis of the median value of the expression (Figure 16C), while a better survival was observed for higher values when data were split on the tertiles of the distribution, but statistically, the significance was borderline (Figure 16D). In multivariable Cox regression analysis, a slightly statistically significant linear trend was also observed (Table 18). High levels of GREB1 expression were linked to better survival in patients with normal MYCN status (Table S33) and in those diagnosed with localized stages, the latter with a borderline statistical significance (Table S34).
Analysis for the group of patients diagnosed at age ≥ 18 months, with amplified MYCN status and stage 4 disease, did not find any association between GREB1 expression levels and patient survival (Figure S14A–D).

3.10. Association between Patient Survival and Expression of NTSR2

Figure 17 shows the association between NTSR2 gene expression and the main patient characteristics at diagnosis. Slightly lower values were observed for patients with amplified MYCN status (Figure 17B) and stage 4S disease (Figure 17C).
No statistically significant association was found between gene expression values and the occurrence of event or death in the whole cohort (Figure S15A,B, respectively) and after stratification by age at diagnosis (Figure S15C,D), MYCN status (Figure S15E,F), and stage (Figure S15G,H).
In Figure 18, we reported the OS curves of the entire cohort of NB patients (n = 709) in relation to NTSR2 expression levels. Better survival was slightly associated with higher values of gene expression (Figure 18A) but without any evidence of trend (Figure 18B). No statistically significant association was found in multivariable Cox regression analysis (Table 19). The stratified analysis did not reveal any effect either in MYCN normal or in MYCN amplified patients (Table S35), while high expression levels were found associated with better survival in the group of localized stages (Table S36). Regarding EFS curves, survival was slightly better for higher values of NTSR2 expression (Figure 18C,D), but statistical significance was not reached. The multivariable analysis did not find any link between the gene expression and EFS (Table 20). Stratified analysis by MYCN status did not find any association (Table S37). Among patients with a localized stage at diagnosing, a better survival in relation to higher levels of gene expression was observed (Table S38).
Analysis restricted to patients with age ≥ 18 months at diagnosis, stage 4 disease, and MYCN amplification did not find any association between patient survival and NTSR2 expression levels (Figure S16).

3.11. Association between Patient Survival and Expression of LPIN1

Figure 19 shows the association between LPIN1 gene expression and the main patient characteristics at diagnosis. Lower values were observed for patients aged 18 months or more at diagnosis (Figure 19A), with amplified MYCN status (Figure 19B), and with stage 4 disease (Figure 19C).
Lower expression values were observed for patients with events (Figure S17A) and for deceased ones (Figure S17B). In stratified analysis, such associations were observed among patients ≥ 18 months at diagnosis (Figure S17C,D), with normal MYCN status (Figure S17E,F), and in those with a localized stage (Figure S17G,H).
OS curves of the entire cohort of NB patients in relation to LPIN1 expression levels (Figure 20) showed a positive association between patient survival and gene expression levels, with higher values of LPIN1 expression corresponding to better OS (Figure 20A) and evidence of trend (Figure 20B). In multivariable analysis, the observed association was slightly attenuated, but the trend remains statistically significant (Table 21). The link between higher OS and LPIN1 levels seemed to be limited to patients with normal MYCN status (Table S39) and diagnosed in localized stages (Table S40). EFS curves of the cohort of 769 NB patients related to LPIN1 expression showed that survival was better for higher values of gene expression (Figure 20C) with evidence of trend (Figure 20D). In multivariable analysis, this association was reduced, and statistical significance was limited to the coefficient of the continuous variable (Table 22). Stratified analysis showed a link between high values of LPIN1 expression and patient survival in the group with normal MYCN status (Table S41) and for patients with an NB diagnosis in localized stages (Table S42).
Among patients ≥ 18 months at diagnosis, with MYCN amplified tumor and Stage 4 disease (Figure S18A–D), no association was found between LPIN1 expression levels and patient survival.

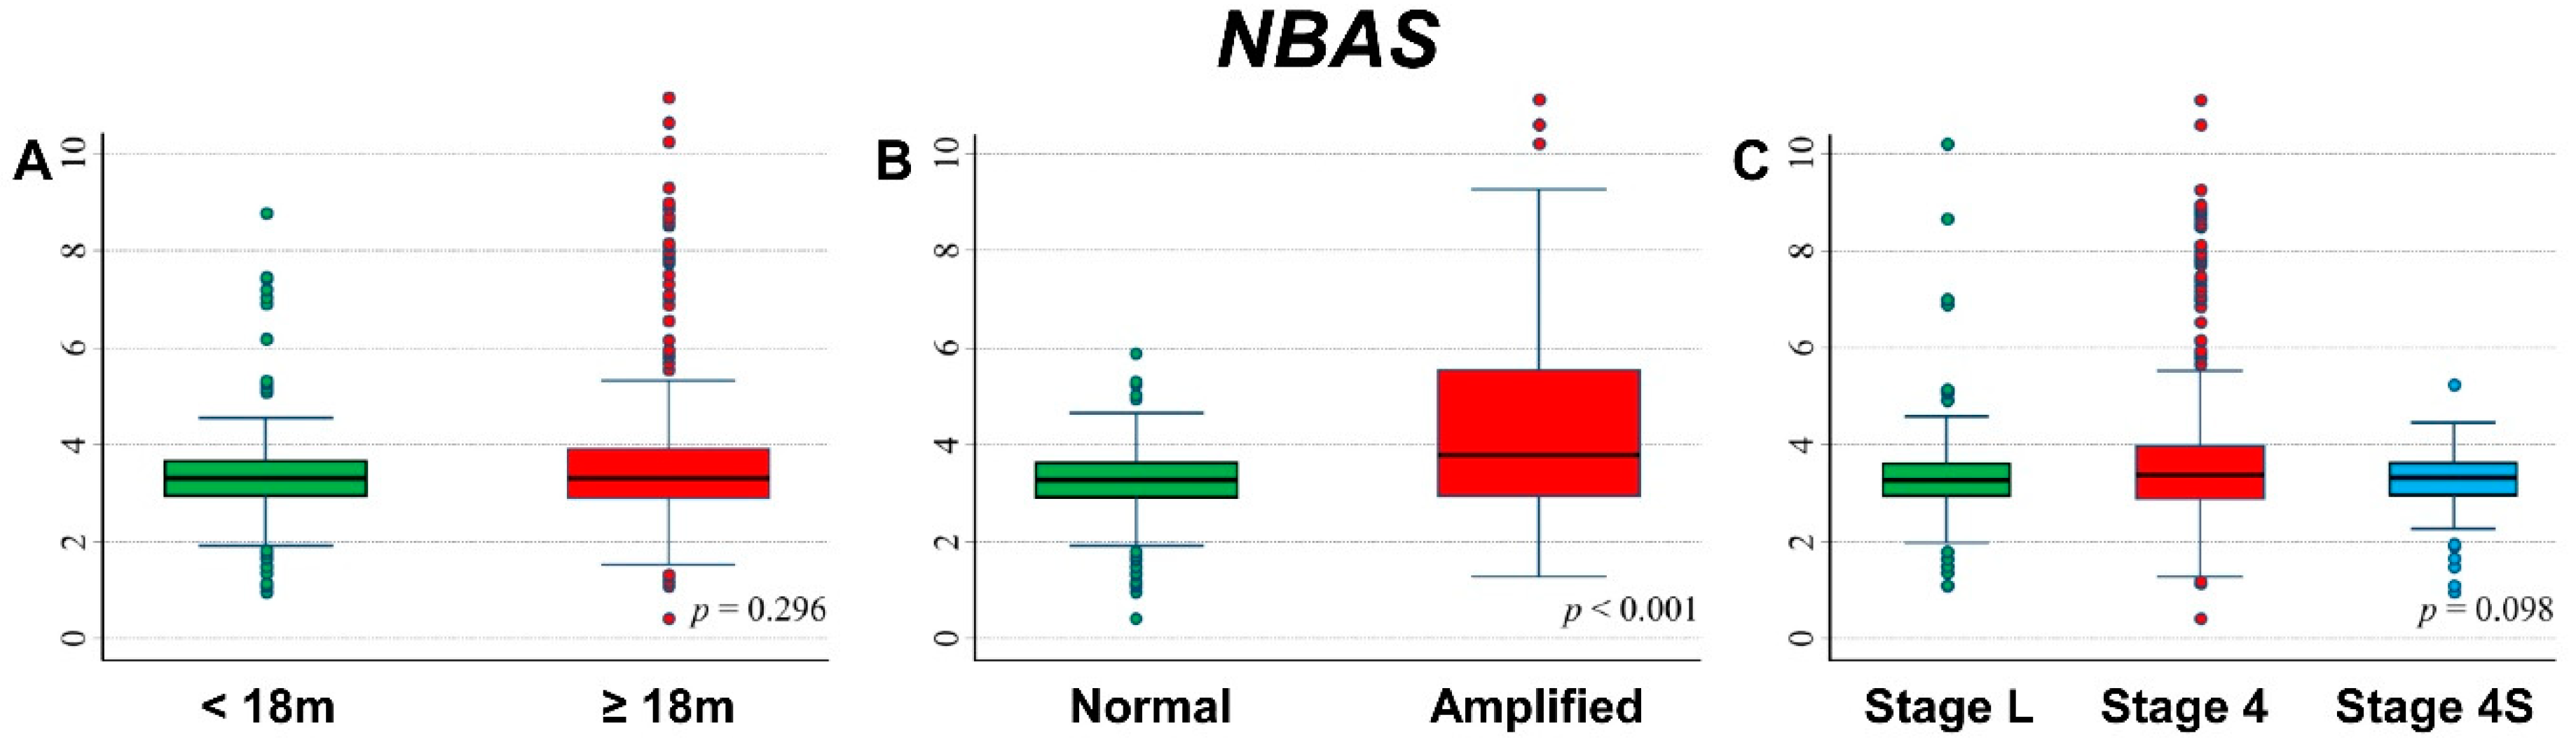
3.12. Association between Patient Survival and Expression of NBAS

Figure 21 shows the association between NBAS gene expression and the main patient characteristics at diagnosis. Statistically significant higher values were observed for patients with MYCN amplified tumors (Figure 21B).
Slightly higher expression values were associated with a poorer outcome (event, Figure S19A; death, Figure S19B). However, this association was no longer evident after stratification by age at diagnosis (Figure S19C,D), MYCN status (Figure S19E,F), and stage (Figure S19G,H), except for death occurrence among older patients (Figure S19D), and stage 4 patients (Figure S19H).
Figure 22 shows the OS curves of the whole cohort of NB patients (n = 786) related to NBAS expression levels. Survival was inversely associated with gene expression because higher values corresponded to a poorer OS (Figure 22A,B). In multivariable analysis via Cox regression model, the observed association was reduced, and the statistical significance was completely lost (Table 23). No association emerged stratifying by MYCN status (Table S43), while a slight inverse significant association was observed in Stage 4 patients (Table S44). EFS curves showed a poorer survival associated with higher values of NBAS expression (Figure 22C), with some evidence of trend (Figure 22D). The association was no longer observed in multivariable analysis (Table 24). The stratified analysis did not find any association splitting the data either by MYCN status (Table S45) or by stage at diagnosis (Table S46).
Analysis restricted to patients with age ≥ 18 months at diagnosis, stage 4 disease, and MYCN amplified tumor did not find any association between patient survival and NBAS expression levels (Figure S20A–D).

3.13. TSSC1 Protein Expression in Stage 4 NB

In order to evaluate TSSC1 protein expression, we performed immunofluorescence analysis of the proposita tumor tissue and of other 30 stage 4 NB biopsy tissue samples at the onset of disease. The results of TSSC1 protein expression analysis in the observed specimens revealed that TSSC1 was mainly expressed in the cytoplasm and showed low expression in adjacent normal tissue. TSSC1 expression was estimated by evaluating the proportion of positively stained NB cells. TSSC1 was found expressed with a high percentage of positive cells (>85%) in the proposita NB tissue. Similarly, all relapsed or dead stage 4 NB showed many TSSC1 positive cells in their tumor tissues, while NB in complete remission expressed a lower amount of TSSC1 positive cells (Figure 23 and Table 25). In more detail, the median value was 12.5 among the not relapsed patients and 67.5 among the relapsed ones (p < 0.001, Mann–Whitney U test); 11.5 among the 10 alive patients and 67.58 among the 20 deceased ones (p < 0.001) (Figure S21).

4. Discussion

We observed a case of NB showing high-grade amplification of six loci besides MYCN in a 28-month-old girl with high-risk metastatic disease. The large regional amplifications on bands 2p25.3–p24.3 involved the genes MYT1L, TSSC1, CMPK2, RSAD2, RNF144A, GREB1, NTSR2, LPIN1, NBAS, and the two long intergenic non-protein coding RNAs LOC730811 and LOC339788. The six co-amplified regions on bands 2p25.3–p24.3, identical to the primary tumor, were also detected in metastatic bone marrow aspirate cells from the patient. This observation suggests that the multiple co-amplifications located on 2p occurred in the first steps of tumor development, where the immature cells that are the source of NB are still present in the sympathetic nervous system. High-level amplifications may arise by different mechanisms such as chromothripsis or breakage-fusion bridges, leading to proto-oncogenes amplified in homogeneously staining regions or in extrachromosomal circular DNA (double minute chromosome) [39]. The increased expression of one or more proto-oncogenes contained in highly amplified regions contributes to tumor formation, maintenance, progression, and resistance to therapies. NB is one of the first cancers in which amplification of the MYCN proto-oncogene in the form of extrachromosomal circularization has been described [40]. The extrachromosomal circular DNA could constitute the driving mutagenic process in NB with functional consequences beyond MYCN amplification. Recently, a large complexity of extrachromosomal circular DNA, with hot spots on chromosome 2p, was described in NB using whole-genome sequencing (WGS) data [41]. The map of extrachromosomal circular DNA in NB describes how the DNA circularization affects not only proto-oncogenes but also various coding and non-coding regions with yet unknown functional effects [41]. The patient presented a rapid decline of clinical conditions that led her to death after only four days since diagnosis. Primary NB tumor harbored, in addition to high-grade amplification of six loci besides MYCN, the atypical 5p15 gain containing TERT gene. It is known that in non-MYCN-amplified NB displaying 5p15 gains, TERT expression increases, functioning in lieu of MYCN amplification to promote tumor progression [42]. Although nothing is known about the influence of 5p15 gains in MYCN-amplified NB, it is possible that the amplified expression of TERT also contributed to the very poor prognosis of the patient. We postulated that the co-amplifications of genes located on chromosome 2p could functionally cooperate with MYCN amplification increasing NB cell proliferation and tumor aggressiveness. In order to understand which gene(s) could be interacting with MYCN that caused such adverse effects on the proposita, we analyzed in silico the impact of high expression of the genes located within the amplifications on the NB patients’ outcome using the information contained in the dataset summarized by Cangelosi et al. [33]. These analyses disclosed that high expression of the TSSC1 gene resulted most significantly related to a reduced survival rate of NB patients, suggesting that it may have a strong oncogenic role in NB. The association remains highly statistically significant after adjusting for age, stage, and MYCN status. Interestingly, the stratified analysis found a very poor survival in association with high expression values of TSSC1 gene among patients with clinical characteristics similar to those of our patient, i.e., metastatic disease, age > 18 months, and MYCN amplified. While the expression of RNF144A, LPIN1, and MYT1L genes was inversely associated with both OS and EFS of NB patients, the stratified analysis indicated a potentially protective effect of LPIN1 and MYT1L gene expression in localized tumors, especially in patients with normal MYCN status. RNF144A, LPIN1, and MYT1L genes, therefore, behave as tumor suppressor genes; in particular, the pan neuron-specific transcription factor MYT1L exerts an important function in neuronal differentiation [20,43], and its overexpression could lead to a differentiation of NB cells with a beneficial effect for patients’ outcome.
To confirm the negative effect of the TSSC1 gene on the survival of the NB patients, we showed by immunofluorescence analysis that TSSC1 protein expression was high in the tumor tissues of relapsed or dead stage 4 patients, but it was generally low in NB cases in complete remission. This data induced us to hypothesize that TSSC1 could be a new putative oncogene whose high expression strongly enhances the inauspicious action of MYCN. Interestingly, in some tumors with non-amplified MYCN (breast cancer, Wilms tumor), TSSC1 behaves as a tumor suppressor gene instead of an oncogene [44].
TSSC1 gene plays a critical role in the endosomal retrieval pathway, and it is identified as a component of the molecular machinery that catalyzes cargo recycling to the plasma membrane [45]. TSSC1 participates in a network of interactions with SNARE (Soluble N-ethylmaleimide Attachment REceptors) proteins, consistent with the role of these proteins in membrane fusion of endosome-derived carriers to the corresponding compartments that is a critical role for cell viability and neurite outgrowth [45]. Furthermore, SNARE proteins seem to be important for KRAS regulation [46], where KRAS is a driver of many human malignancies, including NB [47]. Overexpression of TSSC1 could lead to altered regulation of SNARE-mediated vesicle fusion, which could be associated with tumor progression. Since the transcription factor MYCN is known to regulate the NB microenvironment via secretion of exosomes or microvesicles, which increase cell proliferation [48], a functional link between MYCN and TSSC1 genes is likely to exist. Our findings identified the TSSC1 gene as an interesting candidate to be a putative new oncogene in high-risk NB and a possible objective for future targeted therapies. Other experimental data will be needed to confirm the activity of TSSC1 as an oncogenic molecule in NB.

5. Conclusions

Among the protein-coding genes involved in the six co-amplifications on chromosome 2p found on an NB case with very poor outcome, the one most significantly associated with the worse survival of NB patients is TSSC1 that, even in synergy with MYCN, could have a potential role in NB oncogenesis and cell cycle regulation. Extensive clinical and functional investigations are required to confirm the role of the TSSC1 gene in NB.

Supplementary Materials

The following are available online at https://www.mdpi.com/article/10.3390/cancers13225792/s1, Figure S1: Association between RNF144A gene expression and the main patient characteristics at diagnosis and outcome evaluated on the entire cohort. Figure S2: Survival of patients with age ≥ 18 months, stage 4 disease and MYCN amplification at diagnosis in relation to RNF144A expression level. Figure S3: Association between MYT1L gene expression and the main patient characteristics at diagnosis and outcome evaluated on the entire cohort. Figure S4: Survival of patients with age ≥ 18 months, stage 4 disease and MYCN amplification at diagnosis in relation to MYT1L expression level. Figure S5: Association between TSSC1 gene expression and the main patient characteristics at diagnosis and outcome evaluated on the entire cohort. Figure S6: Survival of patients with age ≥ 18 months, stage 4 disease and MYCN amplification at diagnosis in relation to TSSC1 expression level. Figure S7: Association between LOC730811 expression and the main patient characteristics at diagnosis and outcome evaluated on the entire cohort. Figure S8: Survival of patients with age ≥ 18 months, stage 4 disease and MYCN amplification at diagnosis in relation to LOC730811 expression level. Figure S9: Association between CMPK2 gene expression and the main patient characteristics at diagnosis and outcome evaluated on the entire cohort. Figure S10: Survival of patients with age ≥ 18 months, stage 4 disease and MYCN amplification at diagnosis in relation to CMPK2 expression level. Figure S11: Association between RSAD2 gene expression and the main patient characteristics at diagnosis and outcome evaluated on the entire cohort. Figure S12: Survival of patients with age ≥ 18 months, stage 4 disease and MYCN amplification at diagnosis in relation to RSAD2 expression level. Figure S13: Association between GREB1 gene expression and the main patient characteristics at diagnosis and outcome evaluated on the entire cohort. Figure S14: Survival of patients with age ≥ 18 months, stage 4 disease and MYCN amplification at diagnosis in relation to GREB1 expression level. Figure S15: Association between NTSR2 gene expression and the main patient characteristics at diagnosis and outcome evaluated on the entire cohort. Figure S16: Survival of patients with age ≥ 18 months, stage 4 disease and MYCN amplification at diagnosis in relation to NTSR2 expression level. Figure S17: Association between LPIN1 gene expression and the main patient characteristics at diagnosis and outcome evaluated on the entire cohort. Figure S18: Survival of patients with age ≥ 18 months, stage 4 disease and MYCN amplification at diagnosis in relation to LPIN1 expression level. Figure S19: Association between NBAS gene expression and the main patient characteristics at diagnosis and outcome evaluated on the entire cohort. Figure S20: Survival of patients with age ≥ 18 months, stage 4 disease and MYCN amplification at diagnosis in relation to NBAS expression level. Figure S21: Relative TSSC1 expression levels were plotted in not relapsed or relapsed patients and in alive or dead patients, Table S1: Expression level of the target genes in the normal adrenal gland tissue, Table S2: Overall Survival of 786 NB patients in relation to RNF144A expression levels by MYCN status, Table S3: Overall Survival of 786 NB patients in relation to RNF144A expression levels by stage at diagnosis, evaluated by the Kaplan–Meier method, Table S4: Event Free Survival of 769 NB patients in relation to RNF144A expression levels by MYCN status, Table S5: Event Free Survival of 769 NB patients in relation to RNF144A expression levels by stage at diagnosis, evaluated by the Kaplan–Meier method, Table S6: Overall Survival of 786 NB patients in relation to MYT1L expression levels by MYCN status, Table S7: Overall Survival of 786 NB patients in relation to MYT1L expression levels by stage at diagnosis, evaluated by the Kaplan–Meier method, Table S8: Event Free Survival of 769 NB patients in relation to MYT1L expression levels by MYCN status, Table S9: Event Free Survival of 769 NB patients in relation to MYT1L expression levels by stage at diagnosis, evaluated by the Kaplan–Meier method, Table S10: Overall Survival of 786 NB patients in relation to TSSC1 expression levels by MYCN status, Table S11: Overall Survival of 786 NB patients in relation to TSSC1 expression levels by stage at diagnosis, evaluated by the Kaplan–Meier method, Table S12: Event Free Survival of 786 NB patients in relation to TSSC1 expression levels by MYCN status, Table S13: Event Free Survival of 769 NB patients in relation to TSSC1 expression levels by stage at diagnosis, evaluated by the Kaplan–Meier method, Table S14: Overall Survival of 498 NB patients in relation to LOC730811 expression levels by MYCN status, Table S15: Overall Survival of 498 NB patients in relation to LOC730811 expression levels by stage at diagnosis, evaluated by the Kaplan–Meier method, Table S16: Event Free Survival of 498 NB patients in relation to LOC730811 expression levels by MYCN status, Table S17: Event Free Survival of 498 NB patients in relation to LOC730811 expression levels by stage at diagnosis, evaluated by the Kaplan–Meier method, Table S18: Overall Survival of 786 NB patients in relation to CMPK2 expression levels by MYCN status, Table S19: Overall Survival of 786 NB patients in relation to CMPK2 expression levels by stage at diagnosis, evaluated by the Kaplan–Meier method, Table S20: Event Free Survival of 769 NB patients in relation to CMPK2 expression levels by MYCN status, Table S21: Event Free Survival of 769 NB patients in relation to CMPK2 expression levels by stage at diagnosis, evaluated by the Kaplan–Meier method, Table S22: Overall Survival of 786 NB patients in relation to RSAD2 expression levels by MYCN status, Table S23: Overall Survival of 786 NB patients in relation to RSAD2 expression levels by stage at diagnosis, evaluated by the Kaplan–Meier method, Table S24: Event Free Survival of 769 NB patients in relation to RSAD2 expression levels by MYCN status, Table S25: Event Free Survival of 769 NB patients in relation to RSAD2 expression levels by stage at diagnosis, evaluated by the Kaplan–Meier method, Table S26: Association between LOC339788 expression levels by outcome and main patient characteristics at diagnosis. Table S27: Overall Survival of 498 NB patients in relation to LOC339788 expression levels by MYCN status, Table S28: Overall Survival of 498 NB patients in relation to LOC339788 expression levels by stage at diagnosis, evaluated by the Kaplan–Meier method, Table S29: Event Free Survival of 498 NB patients in relation to LOC339788 expression levels by MYCN status, Table S30: Event Free Survival of 498 NB patients in relation to LOC339788 expression levels by stage at diagnosis, evaluated by the Kaplan–Meier method, Table S31: Overall Survival of 786 NB patients in relation to GREB1 expression levels by MYCN status, Table S32: Overall Survival of 786 NB patients in relation to GREB1 expression levels by stage at diagnosis, evaluated by the Kaplan–Meier method, Table S33: Event Free Survival of 769 NB patients in relation to GREB1 expression levels by MYCN status, Table S34: Event Free Survival of 769 NB patients in relation to GREB1 expression levels by stage at diagnosis, evaluated by the Kaplan–Meier method, Table S35: Overall Survival of 709 NB patients in relation to NTSR2 expression levels by MYCN status, Table S36: Overall Survival of 709 NB patients in relation to NTSR2 expression levels by stage at diagnosis, evaluated by the Kaplan–Meier method, Table S37: Event Free Survival of 695 NB patients in relation to NTSR2 expression levels by MYCN status, Table S38: Event Free Survival of 695 NB patients in relation to NTSR2 expression levels by stage at diagnosis, evaluated by the Kaplan–Meier method, Table S39: Overall Survival of 786 NB patients in relation to LPIN1 expression levels by MYCN status, Table S40: Overall Survival of 786 NB patients in relation to LPIN1 expression levels by stage at diagnosis, evaluated by the Kaplan–Meier method, Table S41: Event Free Survival of 769 NB patients in relation to LPIN1 expression levels by MYCN status, Table S42: Event Free Survival of 769 NB patients in relation to LPIN1 expression levels by stage at diagnosis, evaluated by the Kaplan–Meier method, Table S43: Overall Survival of 786 NB patients in relation to NBAS expression levels by MYCN status, Table S44: Overall Survival of 786 NB patients in relation to NBAS expression levels by stage at diagnosis, evaluated by the Kaplan–Meier method, Table S45: Event Free Survival of 769 NB patients in relation to NBAS expression levels by MYCN status, Table S46: Event Free Survival of 769 NB patients in relation to NBAS expression levels by stage at diagnosis, evaluated by the Kaplan–Meier method.

Author Contributions

Conceptualization, A.P., M.O. and S.P.; methodology, M.O., A.P. and S.P.; Statistical analysis, S.P. and D.C.; validation, A.P., M.O. and S.P.; investigation, M.O., A.P. and S.P.; resources, L.A., F.M. and F.Z.; data curation, M.O., A.P. and S.P.; writing—original draft preparation, M.O., L.A., A.P. and S.P.; writing—review and editing, M.O., S.P. and A.P.; visualization, M.O. and S.P.; supervision, A.P.; project administration, A.P.; funding acquisition, A.P. and F.Z. All authors have read and agreed to the published version of the manuscript.

Funding

This research was funded by Compagnia San Paolo (ID ROL 20207) and by Finanziamento Ricerca Corrente 2021, Ministero della Salute (MSALRC21).

Institutional Review Board Statement

Written informed consent was obtained from the parents of the patients before they were included in the study. The study was conducted according to the guidelines of the Declaration of Helsinki, and it was approved by the Italian Institutional Ethics Committee (Measure n° 270/17 related to the clinical study protocol IGG-NCA-AP-2016, approved on 15 December 2016 and renewed on 24 May 2021).

Informed Consent Statement

Informed parental consent was obtained from all subjects involved in the study.

Data Availability Statement

Data are contained within the article or Supplementary Material.

Acknowledgments

We thank the BIT-NB Biobank of IRCCS G. Gaslini for providing NB specimens.

Conflicts of Interest

The authors declare no conflict of interest.

References

  1. Cheung, N.K.; Dyer, M.A. Neuroblastoma: Developmental biology, cancer genomics and immunotherapy. Nat. Rev. Cancer 2013, 13, 397–411. [Google Scholar] [CrossRef] [Green Version]
  2. Louis, C.U.; Shohet, J.M. Neuroblastoma: Molecular pathogenesis and therapy. Annu. Rev. Med. 2015, 66, 49–63. [Google Scholar] [CrossRef] [Green Version]
  3. Cheung, N.K.; Zhang, J.; Lu, C.; Parker, M.; Bahrami, A.; Tickoo, S.K.; Heguy, A.; Pappo, A.S.; Federico, S.; Dalton, J.; et al. Association of age at diagnosis and genetic mutations in patients with neuroblastoma. J. Am. Med. Assoc. 2012, 307, 1062–1071. [Google Scholar] [CrossRef] [PubMed] [Green Version]
  4. Janoueix-Lerosey, I.; Schleiermacher, G.; Michels, E.; Mosseri, V.; Ribeiro, A.; Lequin, D.; Vermeulen, J.; Couturier, J.; Peuchmaur, M.; Valent, A.; et al. Overall genomic pattern is a predictor of outcome in neuroblastoma. J. Clin. Oncol. 2009, 27, 1026–1033. [Google Scholar] [CrossRef] [PubMed]
  5. Matthay, K.K.; Maris, J.M.; Schleiermacher, G.; Nakagawara, A.; Mackall, C.L.; Diller, L.; Weiss, W.A. Neuroblastoma. Nat. Rev. Dis. Primers 2016, 2, 16078. [Google Scholar] [CrossRef] [PubMed]
  6. Schleiermacher, G.; Janoueix-Lerosey, I.; Ribeiro, A.; Klijanienko, J.; Couturier, J.; Pierron, G.; Mosseri, V.; Valent, A.; Auger, N.; Plantaz, D.; et al. Accumulation of segmental alterations determines progression in neuroblastoma. J. Clin. Oncol. 2010, 28, 3122–3130. [Google Scholar] [CrossRef]
  7. Carr, J.; Bown, N.P.; Case, M.C.; Hall, A.G.; Lunec, J.; Tweddle, D.A. High-resolution analysis of allelic imbalance in neuroblastoma cell lines by single nucleotide polymorphism arrays. Cancer Genet. Cytogenet. 2007, 172, 127–138. [Google Scholar] [CrossRef]
  8. Peifer, M.; Hertwig, F.; Roels, F.; Dreidax, D.; Gartlgruber, M.; Menon, R.; Krämer, A.; Roncaioli, J.L.; Sand, F.; Heuckmann, J.M.; et al. Telomerase activation by genomic rearrangements in high-risk neuroblastoma. Nature 2015, 526, 700–704. [Google Scholar] [CrossRef]
  9. Westermann, F.; Muth, D.; Benner, A.; Bauer, T.; Henrich, K.O.; Oberthuer, A.; Brors, B.; Beissbarth, T.; Vandesompele, J.; Pattyn, F.; et al. Distinct transcriptional MYCN/c-MYC activities are associated with spontaneous regression or malignant progression in neuroblastomas. Genome Biol. 2008, 9, R150. [Google Scholar] [CrossRef] [Green Version]
  10. Zeineldin, M.; Federico, S.; Chen, X.; Fan, Y.; Xu, B.; Stewart, E.; Zhou, X.; Jeon, J.; Griffiths, L.; Nguyen, R.; et al. MYCN amplification and ATRX mutations are incompatible in neuroblastoma. Nat. Commun. 2020, 11, 913. [Google Scholar] [CrossRef] [Green Version]
  11. Corvi, R.; Savelyeva, L.; Breit, S.; Wenzel, A.; Handgretinger, R.; Barak, J.; Oren, M.; Amler, L.; Schwab, M. Non syntenic amplification of MDM2 and MYCN in human neuroblastoma. Oncogene 1995, 10, 1081–1086. [Google Scholar]
  12. Fix, A.; Lucchesi, C.; Ribeiro, A.; Lequin, D.; Pierron, G.; Schleiermacher, G.; Delattre, O.; Janoueix-Lerosey, I. Characterization of amplicons in neuroblastoma: High-resolution mapping using DNA microarrays, relationship with outcome, and identification of overexpressed genes. Genes Chromosomes Cancer 2008, 47, 819–834. [Google Scholar] [CrossRef] [PubMed]
  13. Fix, A.; Peter, M.; Pierron, G.; Aurias, A.; Delattre, O.; Janoueix-Lerosey, I. High-resolution mapping of amplicons of the short arm of chromosome 1 in two neuroblastoma tumors by microarray-based comparative genomic hybridization. Genes Chromosomes Cancer 2004, 40, 266–270. [Google Scholar] [CrossRef]
  14. Molenaar, J.J.; Van Sluis, P.; Boon, K.; Versteeg, R.; Caron, H.N. Rearrangements and increased expression of cyclin D1 (CCND1) in neuroblastoma. Genes Chromosomes Cancer 2003, 36, 242–249. [Google Scholar] [CrossRef] [PubMed]
  15. Su, W.T.; Alaminos, M.; Mora, J.; Cheung, N.K.; La Quaglia, M.P.; Gerald, W.L. Positional gene expression analysis identifies 12q overexpression and amplification in a subset of neuroblastomas. Cancer Genet. Cytogenet. 2004, 154, 131–137. [Google Scholar] [CrossRef]
  16. Guimier, A.; Ferrand, S.; Pierron, G.; Couturier, J.; Janoueix-Lerosey, I.; Combaret, V.; Mosseri, V.; Thebaud, E.; Gambart, M.; Plantaz, D.; et al. Clinical characteristics and outcome of patients with neuroblastoma presenting genomic amplification of loci other than MYCN. PLoS ONE 2014, 9, e101990. [Google Scholar] [CrossRef] [PubMed]
  17. Depuydt, P.; Boeva, V.; Hocking, T.D.; Cannoodt, R.; Ambros, I.M.; Ambros, P.F.; Asgharzadeh, S.; Attiyeh, E.F.; Combaret, V.; Defferrari, R.; et al. Genomic Amplifications and Distal 6q Loss: Novel Markers for Poor Survival in High-risk Neuroblastoma Patients. J. Natl. Cancer Inst. 2018, 110, 1084–1093. [Google Scholar] [CrossRef]
  18. Amoroso, L.; Ognibene, M.; Morini, M.; Conte, M.; Di Cataldo, A.; Tondo, A.; D’Angelo, P.; Castellano, A.; Garaventa, A.; Lasorsa, V.A.; et al. Genomic co-amplification of CDK4/MDM2/FRS2 is associated with very poor prognosis and atypical clinical features in neuroblastoma patients. Genes Chromosomes Cancer 2020, 59, 277–285. [Google Scholar] [CrossRef]
  19. Wagner, A.H.; Coffman, A.C.; Ainscough, B.J.; Spies, N.C.; Skidmore, Z.L.; Campbell, K.M.; Krysiak, K.; Pan, D.; McMichael, J.F.; Eldred, J.M.; et al. DGIdb 2.0: Mining clinically relevant drug-gene interactions. Nucleic Acids Res. 2016, 44, 1036–1044. [Google Scholar] [CrossRef] [Green Version]
  20. Sholler, G.L.; Gerner, E.W.; Bergendahl, G.; MacArthur, R.B.; VanderWerff, A.; Ashikaga, T.; Bond, J.P.; Ferguson, W.; Roberts, W.; Wada, R.K.; et al. A phase I trial of DFMO targeting polyamine addiction in patients with relapsed/refractory neuroblastoma. PLoS ONE 2015, 10, e0127246. [Google Scholar] [CrossRef]
  21. Burgess, A.; Chia, K.M.; Haupt, S.; Thomas, D.; Haupt, Y.; Lim, E. Clinical overview of MDM2/X-targeted therapies. Front. Oncol. 2016, 6, 7. [Google Scholar] [CrossRef]
  22. Sato, T.M.; Gotoh, N. The FRS2 family of docking/scaffolding adaptor proteins as therapeutic targets of cancer treatment. Expert Opin. Ther. Targets 2009, 13, 689–700. [Google Scholar] [CrossRef]
  23. Scott, D.; Elsden, J.; Pearson, A.; Lunec, J. Genes co-amplified with MYCN in neuroblastoma: Silent passengers or co-determinants of phenotype? Cancer Lett. 2003, 197, 81–86. [Google Scholar] [CrossRef]
  24. Carr-Wilkinson, J.; Griffiths, R.; Elston, R.; Gamble, L.D.; Goranov, B.; Redfern, C.P.F.; Lunec, J.; Tweddle, D.A. Outcome of the p53-mediated DNA damage response in neuroblastoma is determined by morphological subtype and MYCN expression. Cell Cycle 2011, 10, 3778–3787. [Google Scholar] [CrossRef] [PubMed] [Green Version]
  25. De Preter, K.; Speleman, F.; Combaret, V.; Lunec, J.; Board, J.; Pearson, A.; De Paepe, A.; Van Roy, N.; Laureys, G.; Vandesompele, J. No Evidence for Correlation of DDX1 Gene Amplification with Improved Survival Probability in Patients with MYCN-Amplified Neuroblastomas. J. Clin. Oncol. 2005, 23, 3167–3168. [Google Scholar] [CrossRef]
  26. Cetinkaya, C.; Martinsson, T.; Sandgren, J.; Träger, C.; Kogner, P.; Dumanski, J.; Díaz De Ståhl, T.; Hedborg, F. Age dependence of tumor genetics in unfavorable neuroblastoma: Array-CGH profiles of 34 consecutive cases, using a Swedish 25-year neuroblastoma cohort for validation. BMC Cancer 2013, 13, 231–245. [Google Scholar] [CrossRef] [PubMed] [Green Version]
  27. Kim, J.G.; Armstrong, R.C.; Agoston, D.; Robinsky, A.; Wiese, C.; Nagle, J.; Hudson, L.D. Myelin transcription factor 1 (Myt1) of the oligodendrocyte lineage, along with a closely related CCHC zinc finger, is expressed in developing neurons in the mammalian central nervous system. J. Neurosci. Res. 1997, 50, 272–290. [Google Scholar] [CrossRef] [Green Version]
  28. Chang, X.; Bakay, M.; Liu, Y.; Glessner, J.; Rathi, K.S.; Hou, C.; Qu, H.; Vaksman, Z.; Nguyen, K.; Sleiman, P.M.A.; et al. Mitochondrial DNA haplogroups and susceptibility to neuroblastoma. J. Natl. Cancer Inst. 2020, 112, 1259–1266. [Google Scholar] [CrossRef]
  29. Park, J.R.; Bagatell, R.; Cohn, S.L.; Pearson, A.D.; Villablanca, G.J.; Berthold, F.; Burchill, S.; Boubaker, A.; McHugh, K.; Nuchtern, J.G.; et al. Revisions to the International neuroblastoma response criteria: A consensus statement from the National Cancer Institute clinical trials planning meeting. J. Clin. Oncol. 2017, 35, 2580–2587. [Google Scholar] [CrossRef]
  30. Ladenstein, R.; Valteau-Couanet, D.; Brock, P.; Yaniv, I.; Castel, V.; Laureys, G.; Malis, J.; Papadakis, V.; Lacerda, A.; Ruud, E.; et al. Randomized Trial of prophylactic granulocyte colony-stimulating factor during rapid COJEC induction in pediatric patients with high-risk neuroblastoma: The European HR-NBL1/SIOPEN study. J. Clin. Oncol. 2010, 28, 3516–3524. [Google Scholar] [CrossRef] [PubMed]
  31. Ognibene, M.; Morini, M.; Garaventa, A.; Podestà, M.; Pezzolo, A. Identification of a minimal region of loss on chromosome 6q27 associated with poor survival of high-risk neuroblastoma patients. Cancer Biol. Ther. 2020, 21, 391–399. [Google Scholar] [CrossRef] [PubMed]
  32. Pezzolo, A.; Sementa, A.R.; Lerone, M.; Morini, M.; Ognibene, M.; Defferrari, R.; Mazzocco, K.; Conte, M.; Gigliotti, A.R.; Garaventa, A.; et al. Constitutional 3p26.3 terminal microdeletion in an adolescent with neuroblastoma. Cancer Biol. Ther. 2017, 18, 285–289. [Google Scholar] [CrossRef] [PubMed] [Green Version]
  33. Cangelosi, D.; Morini, M.; Zanardi, N.; Sementa, A.R.; Muselli, M.; Conte, M.; Garaventa, A.; Pfeffer, U.; Bosco, M.C.; Varesio, L.; et al. Hypoxia Predicts Poor Prognosis in Neuroblastoma Patients and Associates with Biological Mechanisms Involved in Telomerase Activation and Tumor Microenvironment Reprogramming. Cancers 2020, 12, 2343. [Google Scholar] [CrossRef]
  34. Zhang, W.; Yu, Y.; Hertwig, F.; Thierry-Mieg, J.; Zhang, W.; Thierry-Mieg, D.; Wang, J.; Furlanello, C.; Devanarayan, V.; Cheng, J.; et al. Comparison of RNA-seq and microarray-based models for clinical endpoint prediction. Genome Biol. 2015, 16, 133. [Google Scholar] [CrossRef] [Green Version]
  35. Oberthuer, A.; Juraeva, D.; Hero, B.; Volland, R.; Sterz, C.; Schmidt, R.; Faldum, A.; Kahlert, Y.; Engesser, A.; Asgharzadeh, S.; et al. Revised risk estimation and treatment stratification of low- and intermediate-risk neuroblastoma patients by integrating clinical and molecular prognostic markers. Clin. Cancer Res. 2015, 21, 1904–1915. [Google Scholar] [CrossRef] [PubMed] [Green Version]
  36. GTEx Consortium. The Genotype-Tissue Expression (GTEx) project. Nat. Genet. 2013, 45, 580–585. [Google Scholar] [CrossRef]
  37. Ognibene, M.; Podestà, M.; Garaventa, A.; Pezzolo, A. Role of GOLPH3 and TPX2 in Neuroblastoma DNA Damage Response and Cell Resistance to Chemotherapy. Int. J. Mol. Sci. 2019, 20, 4764. [Google Scholar] [CrossRef] [Green Version]
  38. Hosmer, D.W.; Lemeshow, S.; May, S. Applied Survival Analysis—Regression Modelling of Time to Event Data, 2nd ed.; John Wiley & Sons, Inc.: New York, NY, USA, 2008; pp. 1–416. [Google Scholar]
  39. Turner, K.M.; Deshpande, V.; Beyter, D.; Koga, T.; Rusert, J.; Lee, C.; Li, B.; Arden, K.; Ren, B.; Nathanson, D.A.; et al. Extrachromosomal oncogene amplification drives tumour evolution and genetic heterogeneity. Nature 2017, 543, 122–125. [Google Scholar] [CrossRef]
  40. Schwab, M.; Alitalo, K.; Klempnauer, K.H.; Varmus, H.E.; Bishop, J.M.; Gilbert, F.; Brodeur, G.; Goldstein, M.; Trent, J. Amplified DNA with limited homology to myc cellular oncogene is shared by human neuroblastoma cell lines and a neuroblastoma tumour. Nature 1983, 305, 245–248. [Google Scholar] [CrossRef]
  41. Koche, R.P.; Rodriguez-Fos, E.; Helmsauer, K.; Burkert, M.; MacArthur, I.C.; Maag, J.; Chamorro, R.; Munoz-Perez, N.; Puiggròs, M.; Dorado Garcia, H.; et al. Extrachromosomal circular DNA drives oncogenic genome remodeling in neuroblastoma. Nat. Genet. 2020, 52, 29–34. [Google Scholar] [CrossRef]
  42. Cobrinik, D.; Ostrovnaya, I.; Hassimi, M.; Tickoo, S.K.; Cheung, I.Y.; Cheung, N.K. Recurrent pre-existing and acquired DNA copy number alterations, including focal TERT gains, in neuroblastoma central nervous system metastases. Genes Chromosomes Cancer 2013, 52, 1150–1166. [Google Scholar] [CrossRef]
  43. Mall, M.; Kareta, M.S.; Chanda, S.; Ahlenius, H.; Perotti, N.; Zhou, B.; Grieder, S.D.; Ge, X.; Drake, S.; Ang, C.E.; et al. Myt1l safeguards neuronal identity by actively repressing many non-neuronal fates. Nature 2017, 544, 245–249. [Google Scholar] [CrossRef] [Green Version]
  44. Wang, D.C.; Wang, H.F.; Yuan, Z.N. Runx2 induces bone osteolysis by transcriptional suppression of TSSC1. Biochem. Biophys. Res. Commun. 2013, 438, 635–639. [Google Scholar] [CrossRef] [PubMed]
  45. Gershlick, D.C.; Schindler, C.; Chen, Y.; Bonifacino, J.S. TSSC1 is novel component of the endosomal retrieval machinery. Mol. Biol. Cell. 2016, 27, 2867–2878. [Google Scholar] [CrossRef] [PubMed] [Green Version]
  46. Che, Y.; Siprashvili, Z.; Kovalski, J.R.; Jiang, T.; Wozniak, G.; Elcavage, L.; Khavari, P.A. KRAS regulation by small non-coding RNAs and SNARE proteins. Nat. Commun. 2019, 10, 5118. [Google Scholar] [CrossRef] [PubMed]
  47. Brady, S.W.; Liu, Y.; Ma, X.; Gout, A.M.; Hagiwara, K.; Zhou, X.; Wang, J.; Macias, M.; Chen, X.; Easton, J.; et al. Pan-neuroblastoma analysis reveals age- and signature-associated driver alterations. Nat. Commun. 2020, 11, 5183. [Google Scholar] [CrossRef]
  48. Durbin, A.D.; Zimmerman, M.W.; Dharia, N.V.; Abraham, B.J.; Iniguez, A.B.; Weichert-Leahey, N.; He, S.; Krill-Burger, J.M.; Root, D.E.; Vazquez, F.; et al. Selective gene dependencies in MYCN-amplified neuroblastoma include the core transcriptional regulatory circuitry. Nat. Genet. 2018, 50, 1240–1246. [Google Scholar] [CrossRef] [PubMed]
Figure 1. Genomic findings. (A) The six co-amplified regions on bands 2p25.3–p24.3 detected in NB primary tumor and in metastatic bone marrow aspirate cells from the patient. Genomic profiles obtained by array-CGH highlighted high level amplifications of six loci: 2p25.3, containing MYT1L, TSSC1 and LOC730811; 2p25.2, containing CMPK2, RSAD2, and RNF144A; 2p25.1, containing LOC339788; 2p25.1–p24.3, containing GREB1, NTSR2, and LPIN1; 2p24.3, containing NBAS; 2p24.3, containing MYCN. (B) Primary tumor showed a genomic profile with recurrent segmental chromosome alterations (SCA profile) typical of NB such as 1q gain and 17q gain, the atypical segmental alteration 5p gain containing TERT, six concomitant regional co-amplifications on bands 2p25.3–p24.3, and 12 numerical chromosome alterations. (C) Metastatic bone marrow aspirate cells from the patient harbored only the same six co-amplified regions on bands 2p25.3–p24.3.
Cancers 13 05792 g001
Figure 2. Association between RNF144A gene expression and the main patient characteristics at diagnosis. (A) Age (m = months); (B) MYCN status; (C) Stage (L = localized).
Cancers 13 05792 g002
Figure 3. Patient Survival in relation to RNF144A expression level. Overall Survival of 786 NB patients with (A) cut-off based on the median expression value or (B) on tertile expression values. Event Free Survival of 769 NB patients with (C) cut-off based on the median expression value or (D) on tertile expression values. Ten-year survival estimates are displayed.
Cancers 13 05792 g003
Figure 4. Association between MYT1L gene expression and the main patient characteristics at diagnosis. (A) Age; (B) MYCN status; (C) Stage.
Cancers 13 05792 g004
Figure 5. Patient Survival in relation to MYT1L expression level. Overall Survival of 786 NB patients with (A) cut-off based on the median expression value or (B) on tertile expression values. Event Free Survival of 769 NB patients with (C) cut-off based on the median expression value or (D) on tertile expression values. Ten-year survival estimates are displayed.
Cancers 13 05792 g005
Figure 6. Association between TSSC1 gene expression and the main patient characteristics at diagnosis. (A) Age; (B) MYCN status; (C) Stage.
Cancers 13 05792 g006
Figure 7. Patient Survival in relation to TSSC1 expression level. Overall Survival of 786 NB patients with (A) cut-off based on the median expression value or (B) on tertile expression values. Event Free Survival of 769 NB patients with (C) cut-off based on the median expression value or (D) on tertile expression values. Ten-year survival estimates are displayed.
Cancers 13 05792 g007
Figure 8. Association between LOC730811 expression and the main patient characteristics at diagnosis. (A) Age; (B) MYCN status; (C) Stage.
Cancers 13 05792 g008
Figure 9. Patient Survival in relation to LOC730811 expression level. Overall Survival of 498 NB patients with (A) cut-off based on the median expression value or (B) on tertile expression values. Event Free Survival of 498 NB patients with (C) cut-off based on the median expression value or (D) on tertile expression values. Ten-year survival estimates are displayed.
Cancers 13 05792 g009
Figure 10. Association between CMPK2 gene expression and the main patient characteristics at diagnosis. (A) Age; (B) MYCN status; (C) Stage.
Cancers 13 05792 g010
Figure 11. Patient Survival in relation to CMPK2 expression level. Overall Survival of 786 NB patients with (A) cut-off based on the median expression value or (B) on tertile expression values. Event Free Survival of 769 NB patients with (C) cut-off based on the median expression value or (D) on tertile expression values. Ten-year survival estimates are displayed.
Cancers 13 05792 g011
Figure 12. Association between RSAD2 gene expression and the main patient characteristics at diagnosis. (A) Age; (B) MYCN status; (C) Stage.
Cancers 13 05792 g012
Figure 13. Patient Survival in relation to RSAD2 expression level. Overall Survival of 786 NB patients with (A) cut-off based on the median expression value or (B) on tertile expression values. Event Free Survival of 769 NB patients with (C) cut-off based on the median expression value or (D) on tertile expression values. Ten-year survival estimates are displayed.
Cancers 13 05792 g013
Figure 14. (A) Overall Survival of 498 NB patients in relation to LOC339788 expression levels. The selected cut-off is based on the baseline expression value. (B) Event Free Survival of 498 NB patients in relation to LOC339788 expression levels. The selected cut-off is based on the baseline expression value.
Cancers 13 05792 g014
Figure 15. Association between GREB1 gene expression and the main patient characteristics at diagnosis. (A) Age; (B) MYCN status; (C) Stage.
Cancers 13 05792 g015
Figure 16. Patient Survival in relation to GREB1 expression level. Overall Survival of 786 NB patients with (A) cut-off based on the median expression value or (B) on tertile expression values. Event Free Survival of 769 NB patients with (C) cut-off based on the median expression value or (D) on tertile expression values. Ten-year survival estimates are displayed.
Cancers 13 05792 g016
Figure 17. Association between NTSR2 gene expression and the main patient characteristics at diagnosis. (A) Age; (B) MYCN status; (C) Stage.
Cancers 13 05792 g017
Figure 18. Patient Survival in relation to NTSR2 expression level. Overall Survival of 709 NB patients with (A) cut-off based on the median expression value or (B) on tertile expression values. Event Free Survival of 695 NB patients with (C) cut-off based on the median expression value or (D) on tertile expression values. Ten-year survival estimates are displayed.
Cancers 13 05792 g018
Figure 19. Association between LPIN1 gene expression and the main patient characteristics at diagnosis. (A) Age; (B) MYCN status; (C) Stage.
Cancers 13 05792 g019
Figure 20. Patient Survival in relation to LPIN1 expression level. Overall Survival of 786 NB patients with (A) cut-off based on the median expression value or (B) on tertile expression values. Event Free Survival of 769 NB patients with (C) cut-off based on the median expression value or (D) on tertile expression values. Ten-year survival estimates are displayed.
Cancers 13 05792 g020
Figure 21. Association between NBAS gene expression and the main patient characteristics at diagnosis. (A) Age; (B) MYCN status; (C) Stage.
Cancers 13 05792 g021
Figure 22. Patient Survival in relation to NBAS expression level. Overall Survival of 786 NB patients with (A) cut-off based on the median expression value or (B) on tertile expression values. Event Free Survival of 769 NB patients with (C) cut-off based on the median expression value or (D) on tertile expression values. Ten-year survival estimates are displayed.
Cancers 13 05792 g022
Figure 23. Expression of TSSC1 protein in stage 4 primary NB tissues. Immunofluorescence assay was performed using the anti-TSSC1 antibody (green). Images are representative of TSSC1 expression on the proposita tumor tissue (highly positive) and on other four stage 4 NB tissues among the 30 examined. Case number 29 showed a lower amount of TSSC1 positive cells. Normal adjacent tissue displayed very low expression of TSSC1. Cells were counterstained with DAPI to visualize nuclei (blue). (Scale bar: 10 μm).
Cancers 13 05792 g023
Table 1. Main characteristics of the datasets used to perform the analyses.
Cangelosi et al. [33]E-MTAB-1781SEQC-498
Patient CharacteristicsN%N%N%
Age at diagnosis
<18 months44957.143160.830561.2
≥18 months33742.927839.219838.8
MYCN status
Not amplified62980.058182.040180.5
Amplified15319.512217.29218.5
Missing40.560.851.0
INSS Stage
114318.215922.412124.3
212515.911816.67815.7
310513.49313.16312.7
432040.725936.518336.8
4s9211.78011.35310.6
Missing10.100.000.0
Events32040.7 1256 236.118336.9
Deaths22929.116122.710521.1
1 Seventeen missing for the Event Free Survival. 2 Fourteen missing for the Event Free Survival.
Table 2. Overall Survival of 786 NB patients in relation to RNF144A expression levels evaluated by the Cox model.
Univariable AnalysisMultivariable Analysis
Gene ExpressionN/DHR95% CIpHR95% CIp
Median <0.001 0.022
≤4.544393/1511ref 1Ref
>4.544393/780.460.35–0.60 0.720.54–0.96
Tertiles <0.001 0.010
≤4.299262/1051ref 1ref
4.299–4.759262/810.730.55–0.98 1.00.75–1.4
>4.759262/430.360.25–0.51 0.610.42–0.88
Continuous variable786/2290.550.45–0.66<0.0010.730.59–0.900.004
N/D = Number of patients/Deaths HR: Hazard Ratio. Multivariable analysis: HRs are adjusted by MYCN status, age, and stage at diagnosis.
Table 3. Event Free Survival of 769 NB patients in relation to RNF144A expression levels evaluated by the Cox model.
Univariable AnalysisMultivariable Analysis
Gene ExpressionN/EHR95% CIpHR95% CIp
Median <0.001 0.129
≤4.544378/1891ref 1ref
>4.544391/1310.610.49–0.76 0.830.66–1.1
Tertiles <0.001 0.115
≤4.299247/1271ref 1ref
4.299–4.759260/1120.830.64–1.1 1.10.82–1.4
>4.759262/810.540.41–0.71 0.790.59–1.1
Continuous variable769/3200.620.52–0.75<0.0010.810.67–0.980.029
N/E = Number of patients/Events. Hazard Ratio. Multivariable analysis: HRs are adjusted by MYCN status, age, and stage at diagnosis.
Table 4. Overall Survival of 786 NB patients in relation to MYT1L expression levels evaluated by the Cox model.
Univariable AnalysisMultivariable Analysis
Gene ExpressionN/DHR95% CIpHR95% CIp
Median <0.001 0.004
≤4.316393/1711ref 1ref
>4.316393/580.280.21–0.38 0.640.46–0.87
Tertiles <0.001 0.006
≤3.991262/1281ref 1ref
3.991–4.589262/690.470.35–0.63 0.800.59–1.1
>4.589262/320.200.13–0.29 0.530.35–0.80
Continuous variable786/2290.530.47–0.60<0.0010.730.62–0.86<0.001
N/D = Number of patients/Deaths HR: Hazard Ratio. Multivariable analysis: HRs are adjusted by MYCN status, age, and stage at diagnosis.
Table 5. Event Free Survival of 769 NB patients in relation to MYT1L expression levels evaluated by the Cox model.
Univariable AnalysisMultivariable Analysis
Gene ExpressionN/EHR95% CIpHR95% CIp
Median <0.001 0.003
≤4.316383/2121ref 1ref
>4.316386/1080.410.33–0.52 0.680.53–0.88
Tertiles <0.001 0.002
≤3.991253/1511ref 1ref
3.991–4.589257/1070.640.50–0.82 0.900.70–1.2
>4.589259/620.310.23–0.42 0.570.41–0.79
Continuous variable769/3200.590.52–0.66<0.0010.750.65–0.86<0.001
N/E = Number of patients/Events. Hazard Ratio. Multivariable analysis: HRs are adjusted by MYCN status, age, and stage at diagnosis.
Table 6. Overall Survival of 786 NB patients in relation to TSSC1 expression levels evaluated by the Cox model.
Univariable AnalysisMultivariable Analysis
Gene ExpressionN/DHR95% CIpHR95% CIp
Median <0.001 <0.001
≤3.346393/751ref 1ref
>3.346393/1542.41.8–3.1 1.71.3–2.2
Tertiles <0.001 0.002
≤3.162262/431ref 1ref
3.162–3.520262/661.71.1–2.5 1.51.0–2.2
>3.520262/1203.52.5–5.0 1.91.3–2.7
Continuous variable786/2292.932.27–3.79<0.0011.481.16–1.900.002
N/D = Number of patients/Deaths HR: Hazard Ratio. Multivariable analysis: HRs are adjusted by MYCN status, age, and stage at diagnosis.
Table 7. Event Free Survival of 769 NB patients in relation to TSSC1 expression levels evaluated by the Cox model.
Univariable AnalysisMultivariable Analysis
Gene ExpressionN/EHR95% CIpHR95% CIp
Median <0.001 0.178
≤1.877383/1381ref 1ref
>1.877386/1821.51.2–1.8 1.20.93–1.5
Tertiles <0.001 0.376
≤3.162256/891ref 1ref
3.162–3.520257/971.20.87–1.5 1.10.82–1.5
>3.520256/1341.81.4–2.3 1.20.92–1.6
Continuous variable769/3201.831.45–2.33<0.0011.20.96–1.50.103
N/E = Number of patients/Events. Hazard Ratio. Multivariable analysis: HRs are adjusted by MYCN status, age, and stage at diagnosis.
Table 8. Overall Survival of 498 NB patients in relation to LOC730811 expression levels evaluated by the Cox model.
Univariable AnalysisMultivariable Analysis
Gene ExpressionN/DHR95% CIpHR95% CIp
Median 0.005 0.820
≤0.535248/401ref 1ref
>0.535250/651.71.2–2.6 1.00.69–1.6
Tertiles 0.191 0.451
≤0.438166/311ref 1ref
0.438–0.638166/321.00.63–1.7 0.740.44–1.2
>0.638166/421.50.92–2.3 0.930.57–1.5
Continuous variable498/1053.071.67–5.7<0.0011.260.68–2.340.460
N/D = Number of patients/Deaths HR: Hazard Ratio. Multivariable analysis: HRs are adjusted by MYCN status, age, and stage at diagnosis.
Table 9. Event Free Survival of 498 NB patients in relation to LOC730811 expression levels evaluated by the model.
Univariable AnalysisMultivariable Analysis
Gene ExpressionN/EHR95% CIpHR95% CIp
Median 0.073 0.977
≤0.535248/821ref 1ref
>0.535250/1011.30.97–1.7 1.00.73–1.4
Tertiles 0.883 0.358
≤0.438166/631ref 1ref
0.438–0.638166/600.920.64–1.3 0.790.55–1.1
>0.638166/600.970.68–1.4 0.790.54–1.1
Continuous variable498/1831.440.86–2.400.1730.910.54–1.520.723
N/E = Number of patients/Events. HR: Hazard Ratio. Multivariable analysis: HRs are adjusted by MYCN status, age, and stage at diagnosis.
Table 10. Overall Survival of 786 NB patients in relation to CMPK2 expression levels evaluated by the Cox model.
Univariable AnalysisMultivariable Analysis
Gene ExpressionN/DHR95% CIpHR95% CIp
Median 0.020 0.498
≤1.877393/991ref 1ref
>1.877393/1301.41.0–1.8 0.910.70–1.2
Tertiles 0.132 0.612
≤1.541262/661ref 1ref
1.541–2.250262/741.10.81–1.56 1.00.73–1.4
>2.250262/891.41.0–1.9 0.880.64–1.2
Continuous variable786/2291.080.96–1.230.1940.990.86–1.120.827
N/D = Number of patients/Deaths HR: Hazard Ratio. Multivariable analysis: HRs are adjusted by MYCN status, age, and stage at diagnosis.
Table 11. Event Free Survival of 769 NB patients in relation to CMPK2 expression levels evaluated by the Cox model.
Univariable AnalysisMultivariable Analysis
Gene ExpressionN/EHR95% CIpHR95% CIp
Median 0.015 0.910
≤1.877387/1411ref 1Ref
>1.877382/1791.31.1–1.6 0.990.79–1.2
Tertiles 0.125 0.759
≤1.541258/941ref 1ref
1.541–2.250258/1051.10.85–1.5 1.10.80–1.4
>2.250253/1211.31.0–1.7 0.960.73–1.3
Continuous variable769/3201.090.98–1.210.1201.010.91–1.120.840
N/E = Number of patients/Events HR. Hazard Ratio. Multivariable analysis: HRs are adjusted by MYCN status, age, and stage at diagnosis.
Table 12. Overall Survival of 786 NB patients in relation to RSAD2 expression levels evaluated by the Cox model.
Univariable AnalysisMultivariable Analysis
Gene ExpressionN/DHR95% CIpHR95% CIp
Median 0.510 0.517
≤1.655393/1101ref 1ref
>1.655393/1191.10.84–1.4 0.920.71–1.2
Tertiles 0.021 0.529
≤1.193262/801ref 1ref
1.193–2.144262/610.710.51–0.99 0.820.59–1.2
>2.144262/881.10.81–1.5 0.900.66–1.2
Continuous variable786/2290.950.86–1.00.2660.940.85–1.030.176
N/D = Number of patients/Deaths HR: Hazard Ratio. Multivariable analysis: HRs are adjusted by MYCN status, age, and stage at diagnosis.
Table 13. Event Free Survival of 769 NB patients in relation to RSAD2 expression levels evaluated by the Cox model.
Univariable AnalysisMultivariable Analysis
Gene ExpressionN/EHR95% CIpHR95% CIp
Median 0.925 0.194
≤1.655382/1571ref 1ref
>1.655387/1630.990.79–1.2 0.860.69–1.1
Tertiles 0.024 0.188
≤1.193253/1101ref 1ref
1.193–2.144257/910.720.55–0.95 0.770.58–1.0
>2.144259/1191.00.78–1.3 0.840.65–1.1
Continuous variable769/3200.940.86–1.030.2230.930.85–1.020.123
N/E = Number of patients/Events HR. Hazard Ratio. Multivariable analysis: HRs are adjusted by MYCN status, age, and stage at diagnosis.
Table 14. Association between LOC339788 expression levels and the main patient characteristics at diagnosis.
LOC339788 Expression Levels
≤0.01436>0.01436
Patient CharacteristicsN%N%p
Age 0.898
<18 months22661.17961.7
≥18 months14438.94938.3
MYCN status 0.024
Not amplified30783.79474.6
Amplified6016.43225.4
Stage 0.498
Localized19552.76752.3
Stage 413937.64434.4
Stage 4S369.71713.3
Table 15. Overall Survival of 498 NB patients in relation to LOC339788 expression levels evaluated by the Cox model.
Univariable AnalysisMultivariable Analysis
Gene ExpressionN/DHR95% CIpHR95% CIp
Cut-off 0.607 0.921
≤0.01436370/761ref 1ref
>0.01436128/291.10.73–1.7 0.980.63–1.5
N/D = Number of patients/Deaths. HR: Hazard Ratio. Multivariable analysis: HRs are adjusted by MYCN status, age, and stage at diagnosis. Cut-off: cut-off corresponding to the baseline expression value.
Table 16. Event Free Survival of 498 NB patients in relation to LOC339788 expression levels evaluated by the Cox model.
Univariable AnalysisMultivariable Analysis
Gene ExpressionN/EHR95% CIpHR95% CIp
Cut-off 0.261 0.471
≤0.01436370/1311ref 1ref
>0.01436128/521.20.87–1.7 1.10.81–1.6
N/E = Number of patients/Events HR. HR: Hazard Ratio. Multivariable analysis: HRs are adjusted by MYCN status, age, and stage at diagnosis. Cut-off = cut-off corresponding to the baseline expression value.
Table 17. Overall Survival of 786 NB patients in relation to GREB1 expression levels evaluated by the Cox model.
Univariable AnalysisMultivariable Analysis
Gene ExpressionN/DHR95% CIpHR95% CIp
Median 0.811 0.738
≤4.029393/1141ref 1ref
>4.029393/1151.00.80–1.3 0.950.73–1.3
Tertiles 0.058 0.367
≤3.791262/891ref 1ref
3.791–4.311262/620.680.49–0.94 0.800.58–1.1
>4.311262/780.880.65–1.2 0.840.61–1.2
Continuous variable786/2290.970.83–1.10.6720.890.78–1.00.118
N/D = Number of patients/Deaths HR: Hazard Ratio. Multivariable analysis: HRs are adjusted by MYCN status, age, and stage at diagnosis.
Table 18. Event Free Survival of 769 NB patients in relation to GREB1 expression levels evaluated by the Cox regression model.
Univariable AnalysisMultivariable Analysis
Gene ExpressionN/EHR95% CIpHR95% CIp
Median 0.398 0.265
≤4.029384/1671ref 1ref
>4.029385/1530.910.73–1.1 0.880.70–1.1
Tertiles 0.007 0.113
≤3.791253/1271ref 1ref
3.791–4.311260/910.650.50–0.86 0.770.58–1.0
>4.311256/1020.780.60–1.0 0.790.60–1.0
Continuous variable769/3200.870.77–0.990.0390.860.76–0.970.014
N/E = Number of patients/Events HR: Hazard Ratio. Multivariable analysis: HRs are adjusted by MYCN status, age, and stage at diagnosis.
Table 19. Overall Survival of 709 NB patients in relation to NTSR2 expression levels evaluated by the Cox regression model.
Univariable AnalysisMultivariable Analysis
Gene ExpressionN/DHR95% CIpHR95% CIp
Median 0.033 0.192
≤−0.944354/901ref 1ref
>−0.944355/710.710.52–0.97 0.810.59–1.1
Tertiles 0.066 0.578
≤−1.303236/621ref 1ref
−1.303–−0.594236/440.630.43–0.93 0.860.58–1.3
>−0.594237/550.790.55–1.1 0.830.57–1.2
Continuous variable709/1610.920.85–0.990.0360.960.90–1.00.199
N/D = Number of patients/Deaths HR: Hazard Ratio. Multivariable analysis: HRs are adjusted by MYCN status, age, and stage at diagnosis.
Table 20. Event Free Survival of 695 NB patients in relation to NTSR2 expression levels evaluated by the Cox regression model.
Univariable AnalysisMultivariable Analysis
Gene ExpressionN/EHR95% CIpHR95% CIp
Median 0.066 0.131
≤−0.944349/1381ref 1ref
>−0.944346/1180.790.62–1.0 0.820.64–1.1
Tertiles 0.088 0.166
≤−1.303231/961ref 1ref
−1.303–−0.594235/790.750.55–1.0 0.900.66–1.2
>−0.594229/810.750.56–1.0 0.750.55–1.0
Continuous variable695/2560.950.89–1.00.1050.970.91–1.00.244
N/E = Number of patients/Events HR: Hazard Ratio. Multivariable analysis: HRs are adjusted by MYCN status, age, and stage at diagnosis.
Table 21. Overall Survival of 786 NB patients in relation to LPIN1 expression levels evaluated by the Cox regression model.
Univariable AnalysisMultivariable Analysis
Gene ExpressionN/DHR95% CIpHR95% CIp
Median <0.001 0.075
≤4.313393/1491ref 1ref
>4.313393/800.490.37–0.64 0.780.59–1.0
Tertiles <0.001 0.004
≤4.102262/1131ref 1ref
4.102–4.512262/670.550.40–0.74 1.00.75–1.4
>4.512262/490.380.27–0.53 0.600.42–0.84
Continuous variable786/2290.590.48–0.73<0.0010.750.61–0.910.003
N/D = Number of patients/Deaths HR: Hazard Ratio. Multivariable analysis: HRs are adjusted by MYCN status, age, and stage at diagnosis.
Table 22. Event Free Survival of 769 NB patients in relation to LPIN1 expression levels evaluated by the Cox regression model.
Univariable AnalysisMultivariable Analysis
Gene ExpressionN/EHR95% CIpHR95% CIp
Median <0.001 0.064
≤4.313376/1891ref 1ref
>4.313393/1310.600.48–0.75 0.810.64–1.0
Tertiles <0.001 0.060
≤4.102245/1351ref 1ref
4.102–4.512262/980.620.48–0.81 0.940.72–1.2
>4.512262/870.530.40–0.69 0.730.55–0.96
Continuous variable769/3200.620.50–0.76<0.0010.770.64–0.920.004
N/E = Number of patients/Events HR: Hazard Ratio. Multivariable analysis: HRs are adjusted by MYCN status, age, and stage at diagnosis.
Table 23. Overall Survival of 786 NB patients in relation to NBAS expression levels evaluated by the Cox regression model.
Univariable AnalysisMultivariable Analysis
Gene ExpressionN/DHR95% CIpHR95% CIp
Median 0.010 0.153
≤3.311393/991ref 1ref
>3.311393/1301.41.1–1.8 1.20.93–1.6
Tertiles <0.001 0.301
≤3.074261/711ref 1ref
3.074–3.585263/620.830.59–1.2 1.30.90–1.8
>3.585262/961.51.1–2.0 1.20.90–1.7
Continuous variable786/2291.261.16–1.37<0.0010.960.89–1.030.231
N/D = Number of patients/Deaths HR: Hazard Ratio. Multivariable analysis: HRs are adjusted by MYCN status, age, and stage at diagnosis.
Table 24. Event Free Survival of 769 NB patients in relation to NBAS expression levels evaluated by the Cox regression model.
Univariable AnalysisMultivariable Analysis
Gene ExpressionN/EHR95% CIpHR95% CIp
Median 0.063 0.340
≤3.311376/1461ref 1ref
>3.311393/1741.20.99–1.5 1.10.89–1.4
Tertiles 0.008 0.183
≤3.074244/951ref 1ref
3.074–3.585263/990.990.74–1.3 1.30.95–1.7
>3.585262/1261.41.1–1.9 1.20.95–1.6
Continuous variable769/3201.171.09–1.26<0.0010.980.91–1.050.574
N/E = Number of patients/Events HR: Hazard Ratio. Multivariable analysis: HRs are adjusted by MYCN status, age, and stage at diagnosis.
Table 25. Diagnostic characteristics of stage 4 NB patients whose tumors were analyzed by immunofluorescence for TSSC1.
Case N°Age at
Onset (Months)
INSS StageINRG StageSubtypeMYCN StatusPercentage of TSSC1
Positive Cells
RelapseFollow-UpDisease State
1354MNB/GNBLgain85yesdead
2154MNB/GNBLamp70yesdead
3494MNB/GNBLamp73yesdead
4364MNB/GNBLsc20noaliveCR
5124MNB/GNBLsc15noaliveCR
6114MNB/GNBLamp67yesdead
7184MNB/GNBLamp75yesdead
8224MNB/GNBLamp68yesdead
974MNB/GNBLamp78nodead
1034MNB/GNBLsc12noaliveCR
11474MNB/GNBLgain54yesdead
1294MNB/GNBLamp9noaliveCR
13264MNB/GNBLamp62yesdead
14634MNB NASamp78yesdead
15464MNB/GNBLamp64yesdead
161654MNB/GNBLsc11noaliveCR
171144MNB/GNBLamp72yesdead
18234MNB/GNBLsc7noaliveCR
19334MNB/GNBLsc13noaliveCR
20324MNB/GNBLgain45yesdead
21454MNB/GNBLgain59yesdead
22284MNB/GNBLgain63yesdead
23574MNB/GNBLamp54noaliveAD
2474MNB/GNBLsc6noaliveCR
25284MNB/GNBLgain77yesdead
26544MNB/GNBLamp55yesdead
27554MNB/GNBLamp59nodead
28524MNB/GNBLgain62yesdead
2954MNB/GNBLamp4noaliveCR
30154MNB/GNBLamp81yesdead
Abbreviations: AD, active disease; amp, amplified; CR, complete remission; GNBL, ganglioneuroblastoma; INSS, International Neuroblastoma Staging System; IRNG, International Neuroblastoma Risk Group; NB, neuroblastoma; NAS, neuroblastoma abdominal mass; sc, single copy.
Publisher’s Note: MDPI stays neutral with regard to jurisdictional claims in published maps and institutional affiliations.

