
Prognostic Matrisomal Gene Panel and Its Association with Immune Cell Infiltration in Head and Neck Carcinomas

 , , , and
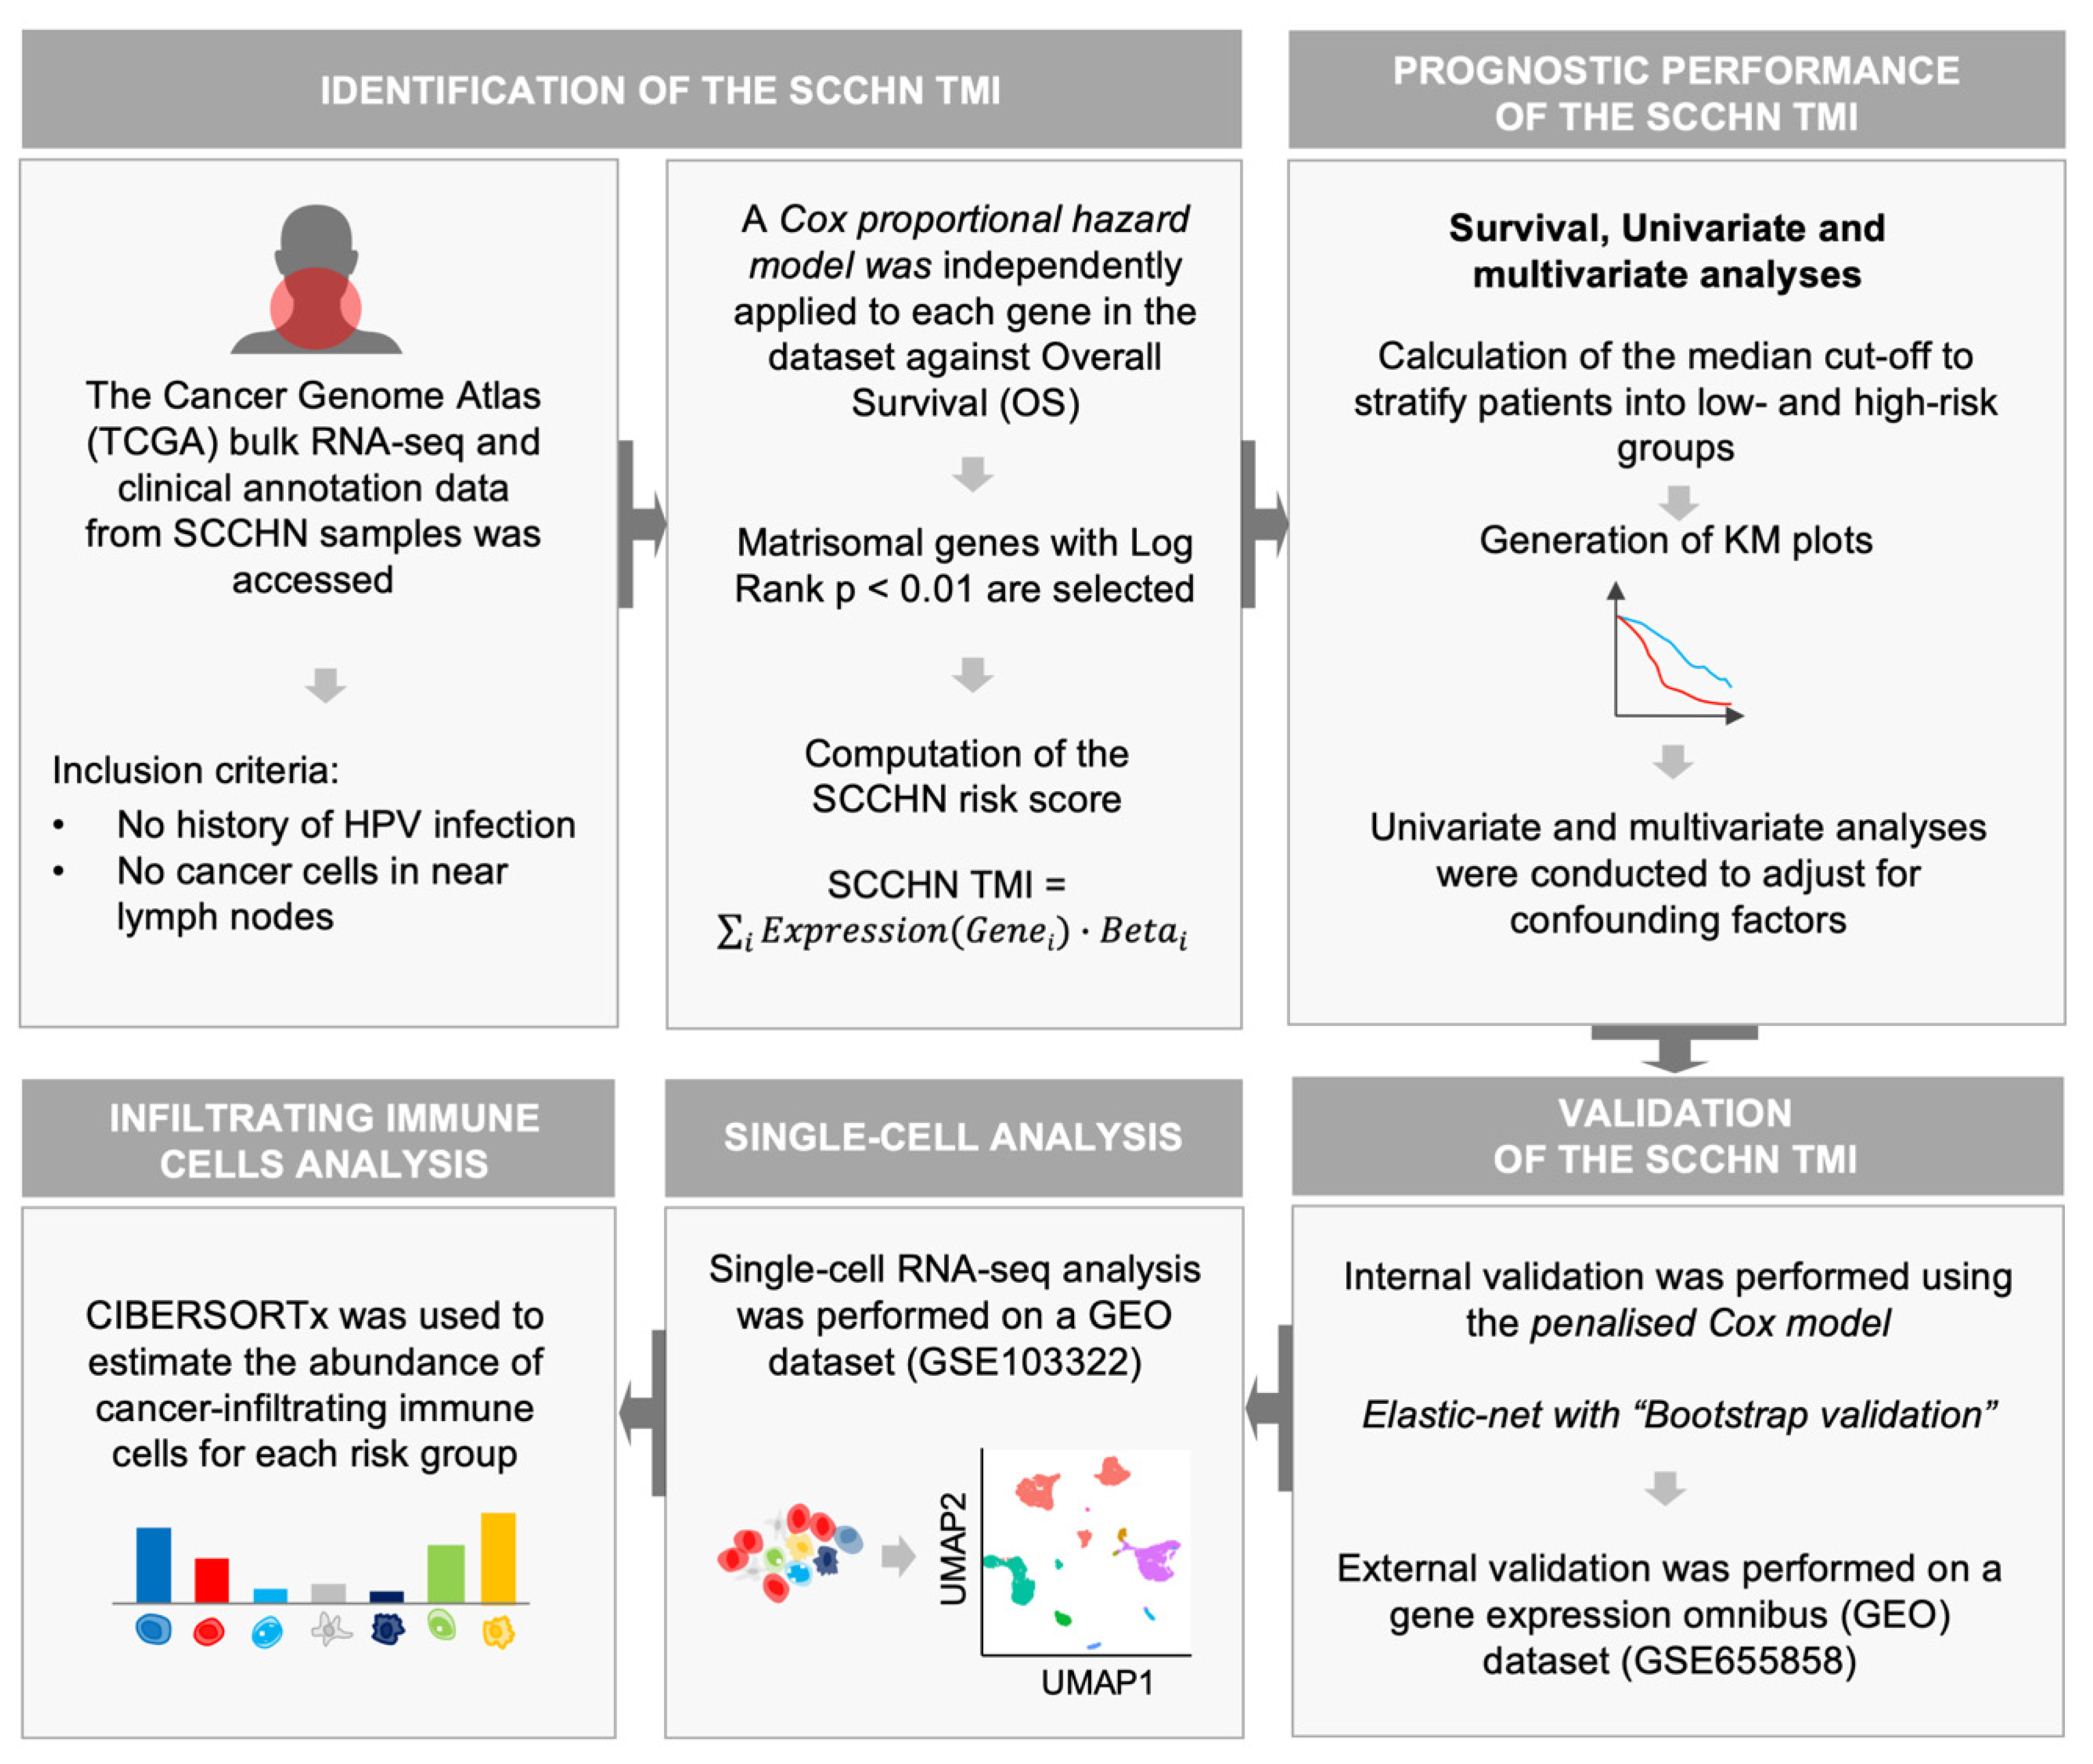
Abstract
Simple Summary
Abstract
1. Introduction
2. Materials and Methods
2.1. SCCHN TCGA Data
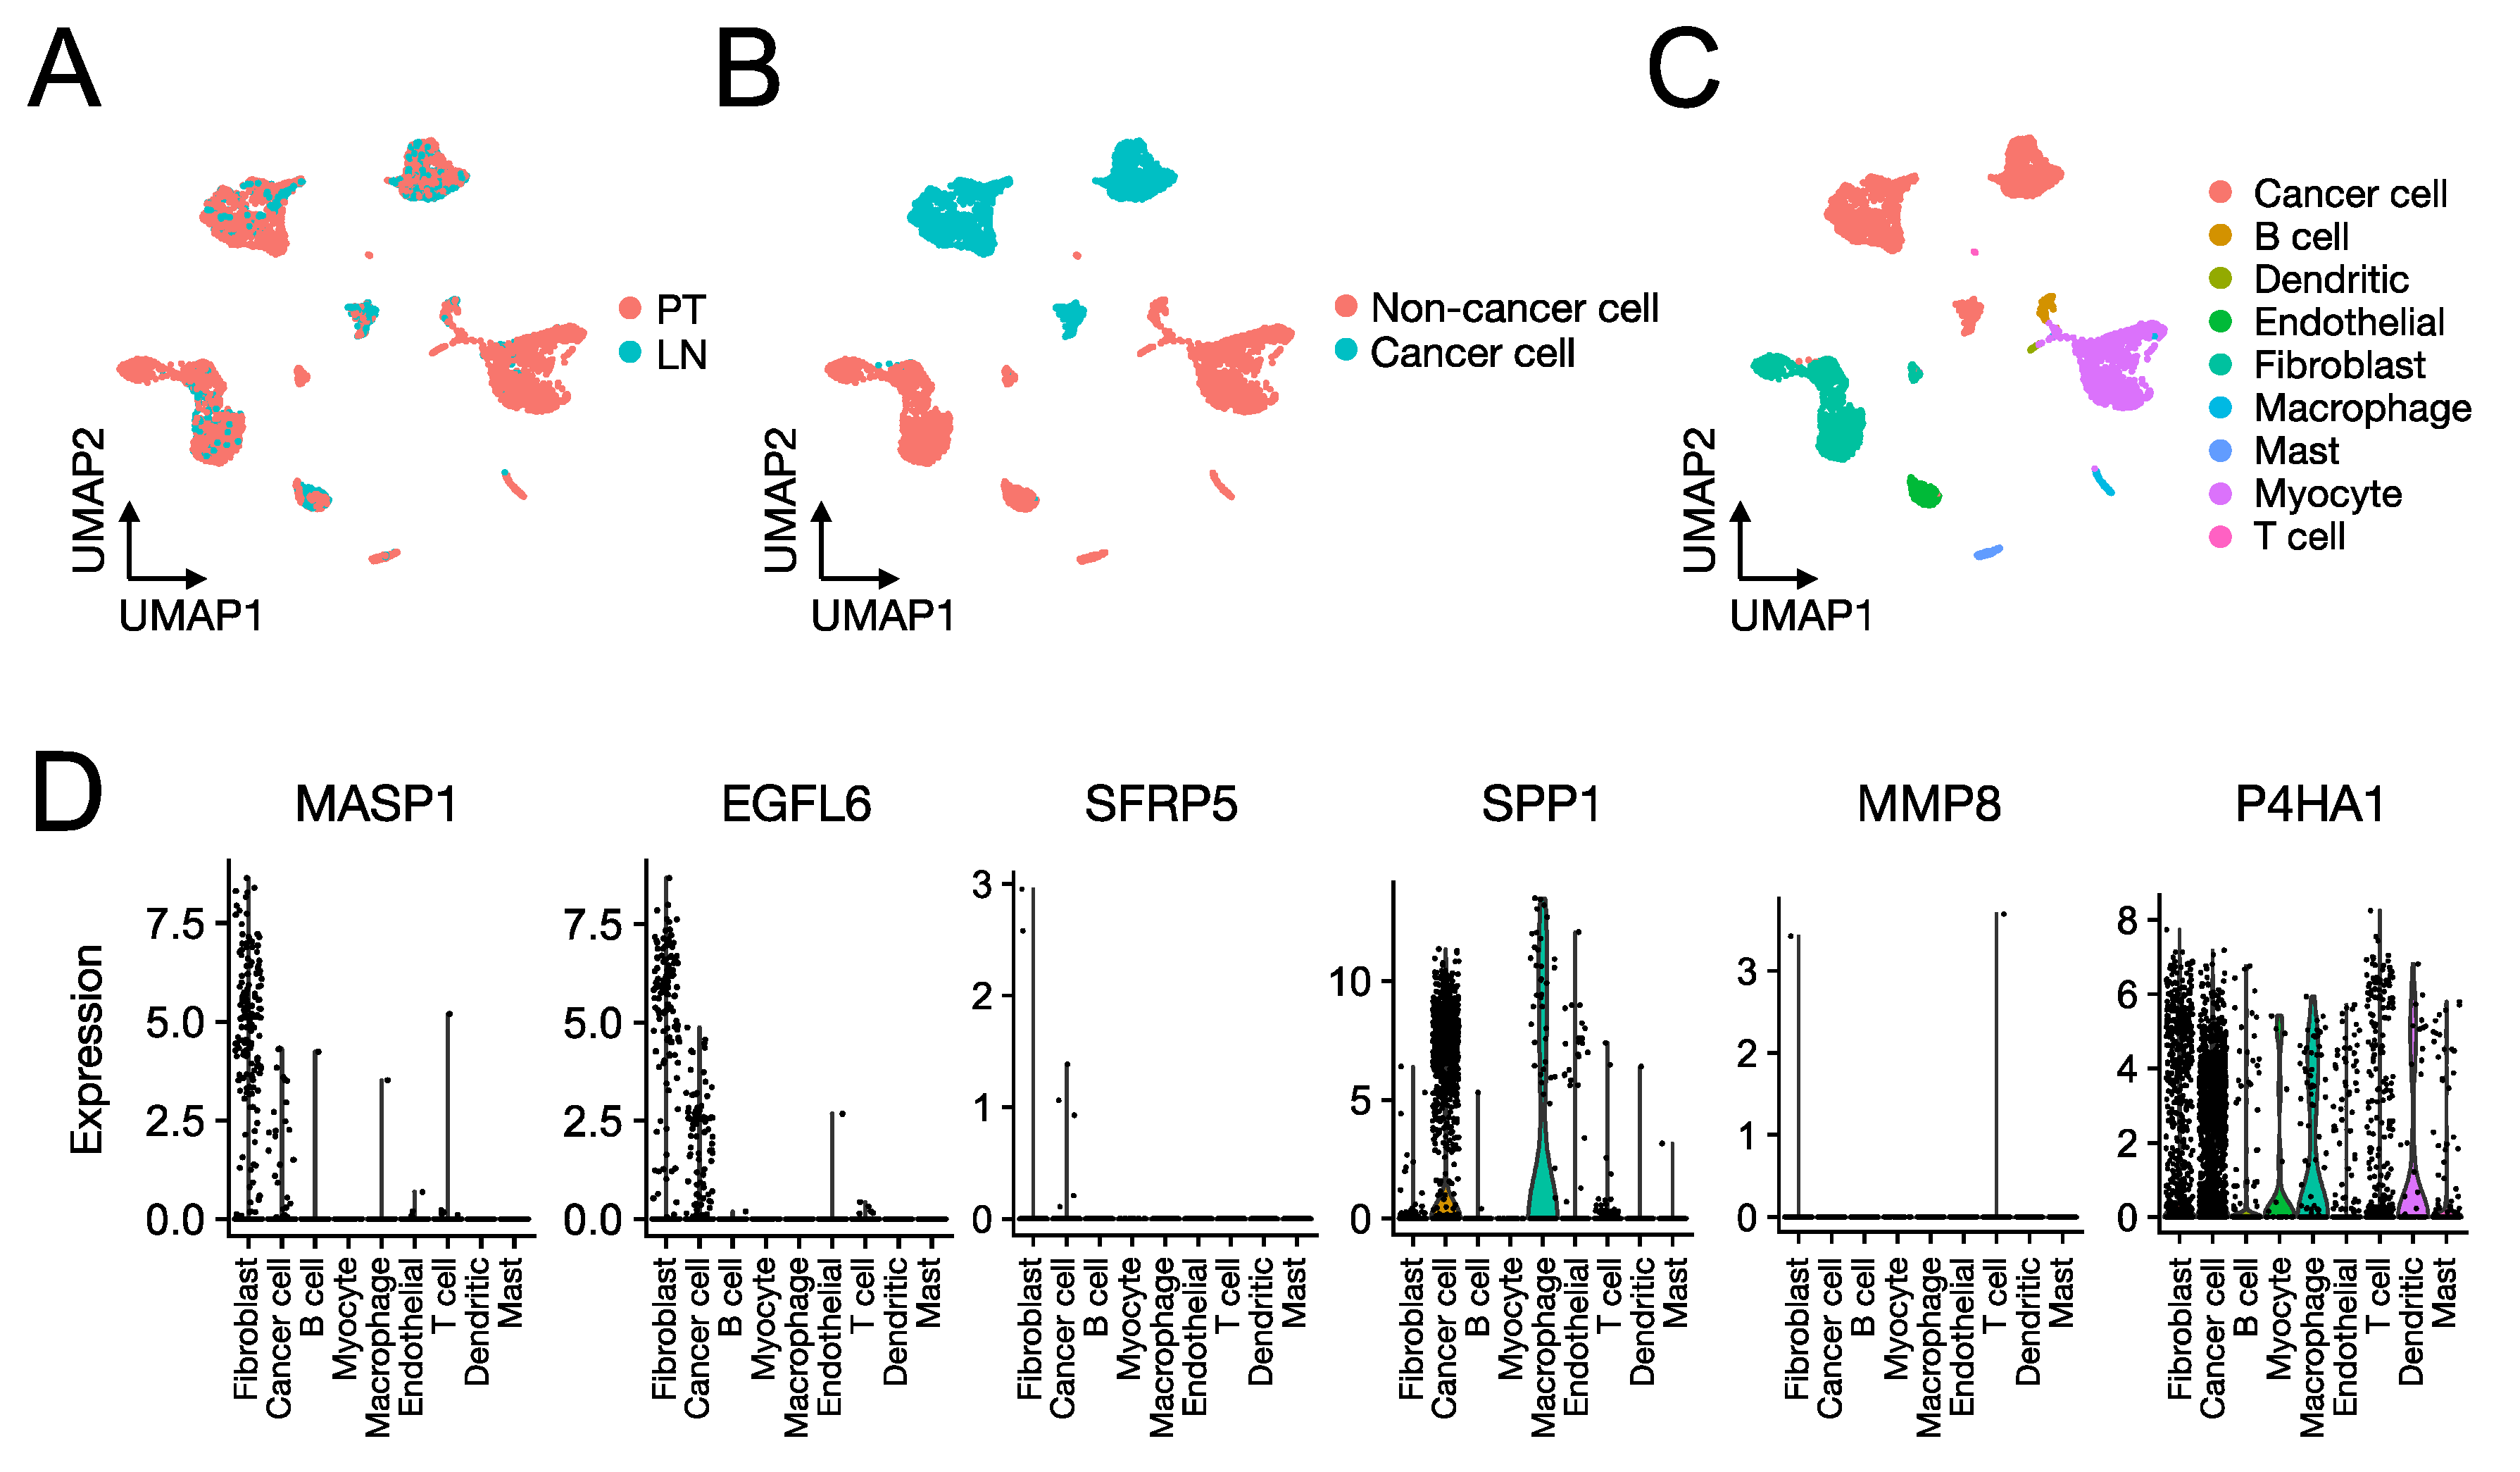
2.2. SCCHN scRNA-Seq Data
2.3. Construction of the SCCHN TMI Risk Score
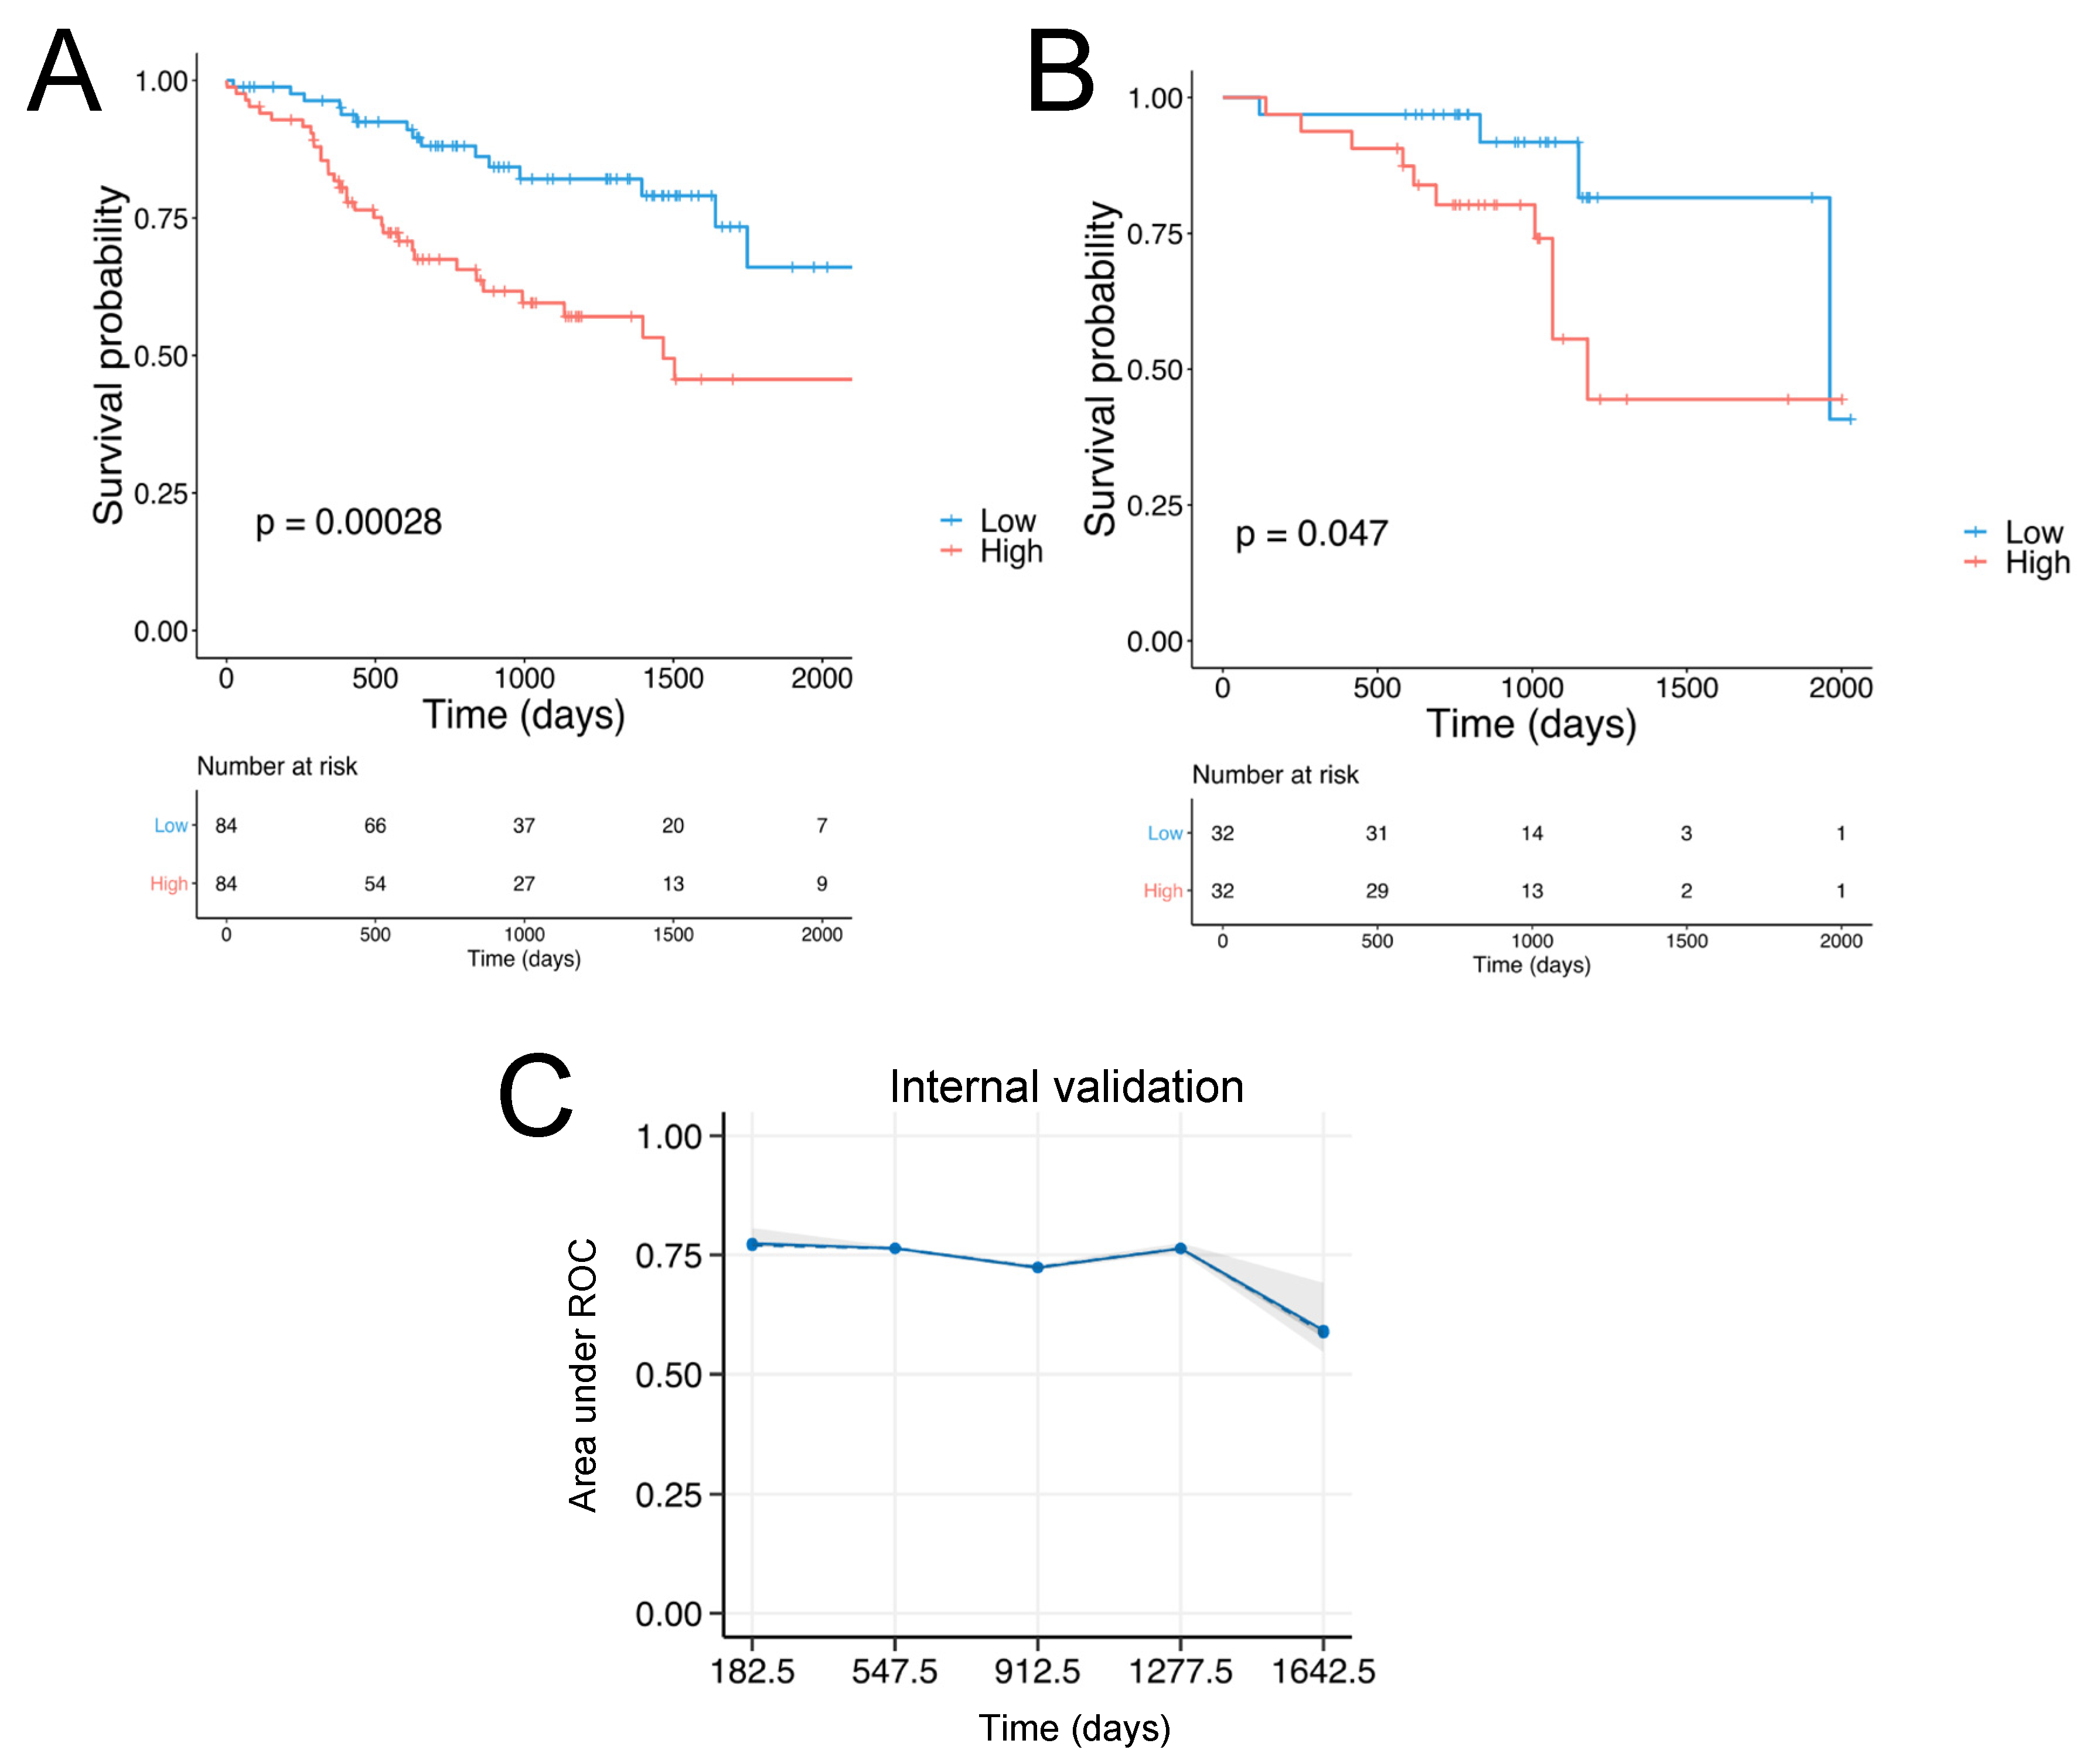
2.4. Patient Stratification and Survival Analysis
2.5. Validation
2.6. Role of the Proteins Encoded by the SCCHN TMI Genes
2.7. Network Analysis
2.8. Tumor-Infiltrating Immune Cell Analysis
2.9. Machine Learning for Personalized Prediction of the Risk Group
3. Results
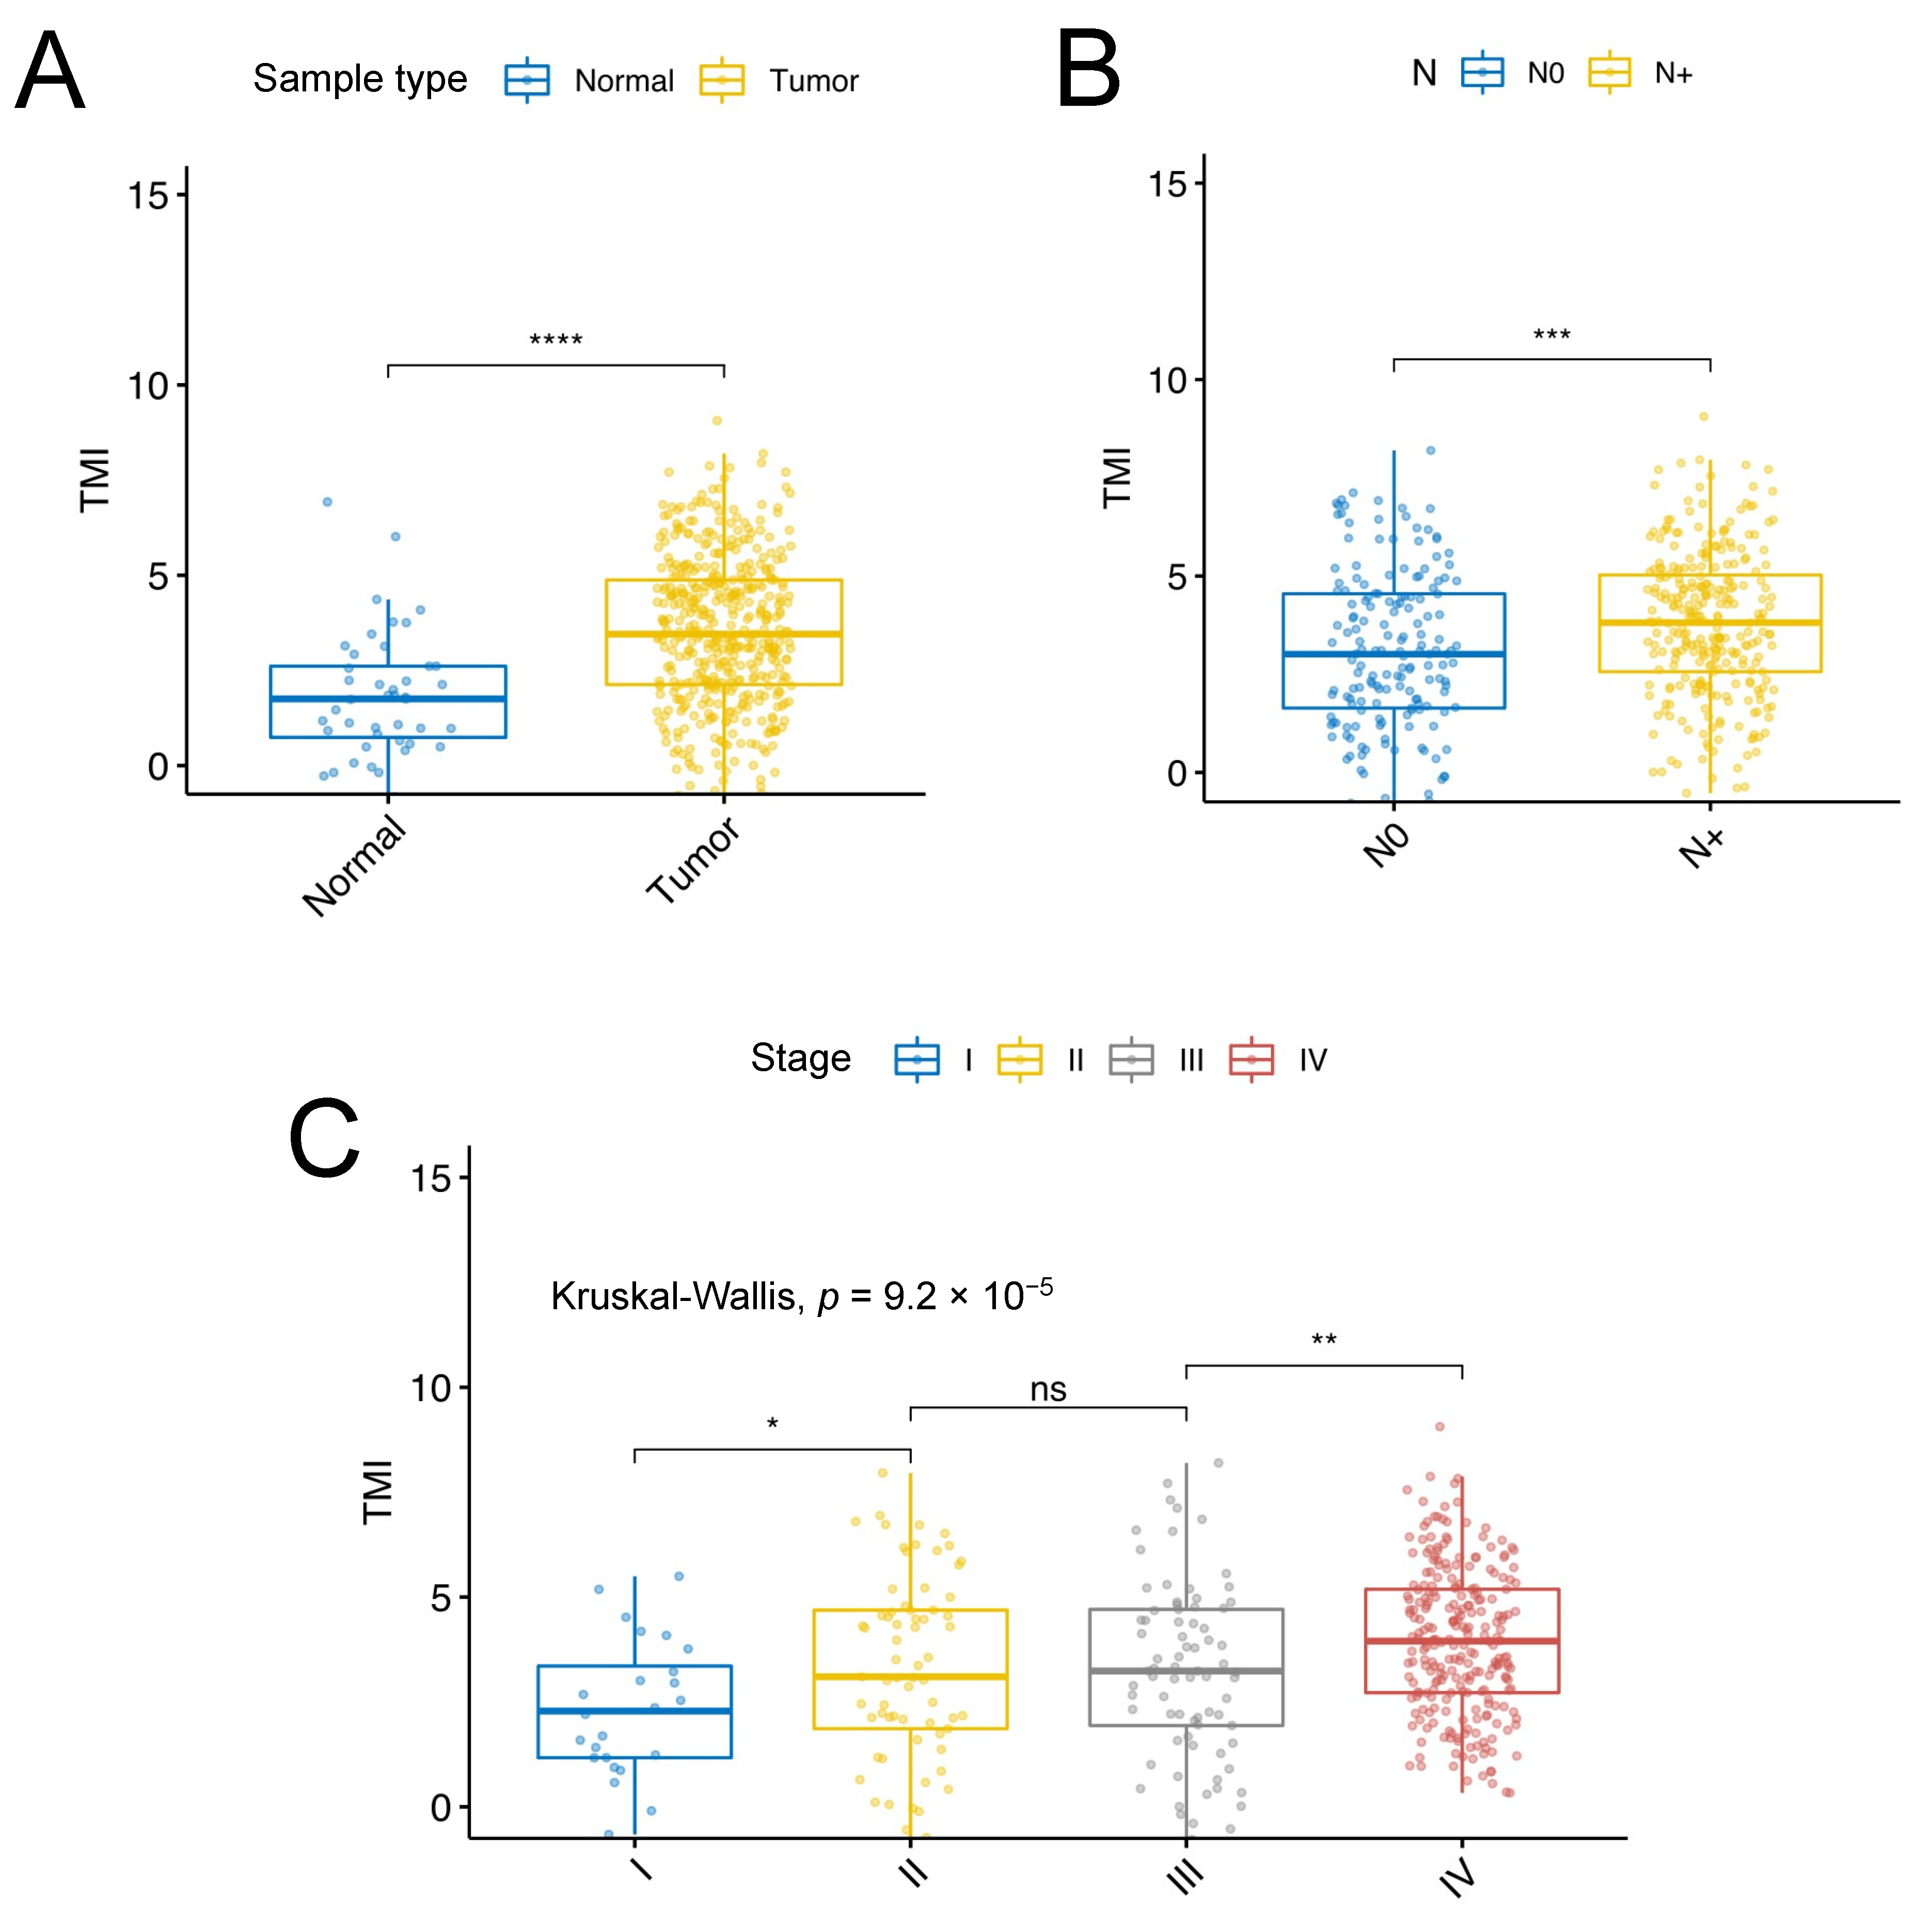
3.1. Identification of SCCHN-Specific Tumor Matrisome Index
3.2. Validation of the SCCHN TMI
3.3. Regulatory Signaling Network Analyses
3.4. Role of the Proteins Encoded by the SCCHN TMI Genes
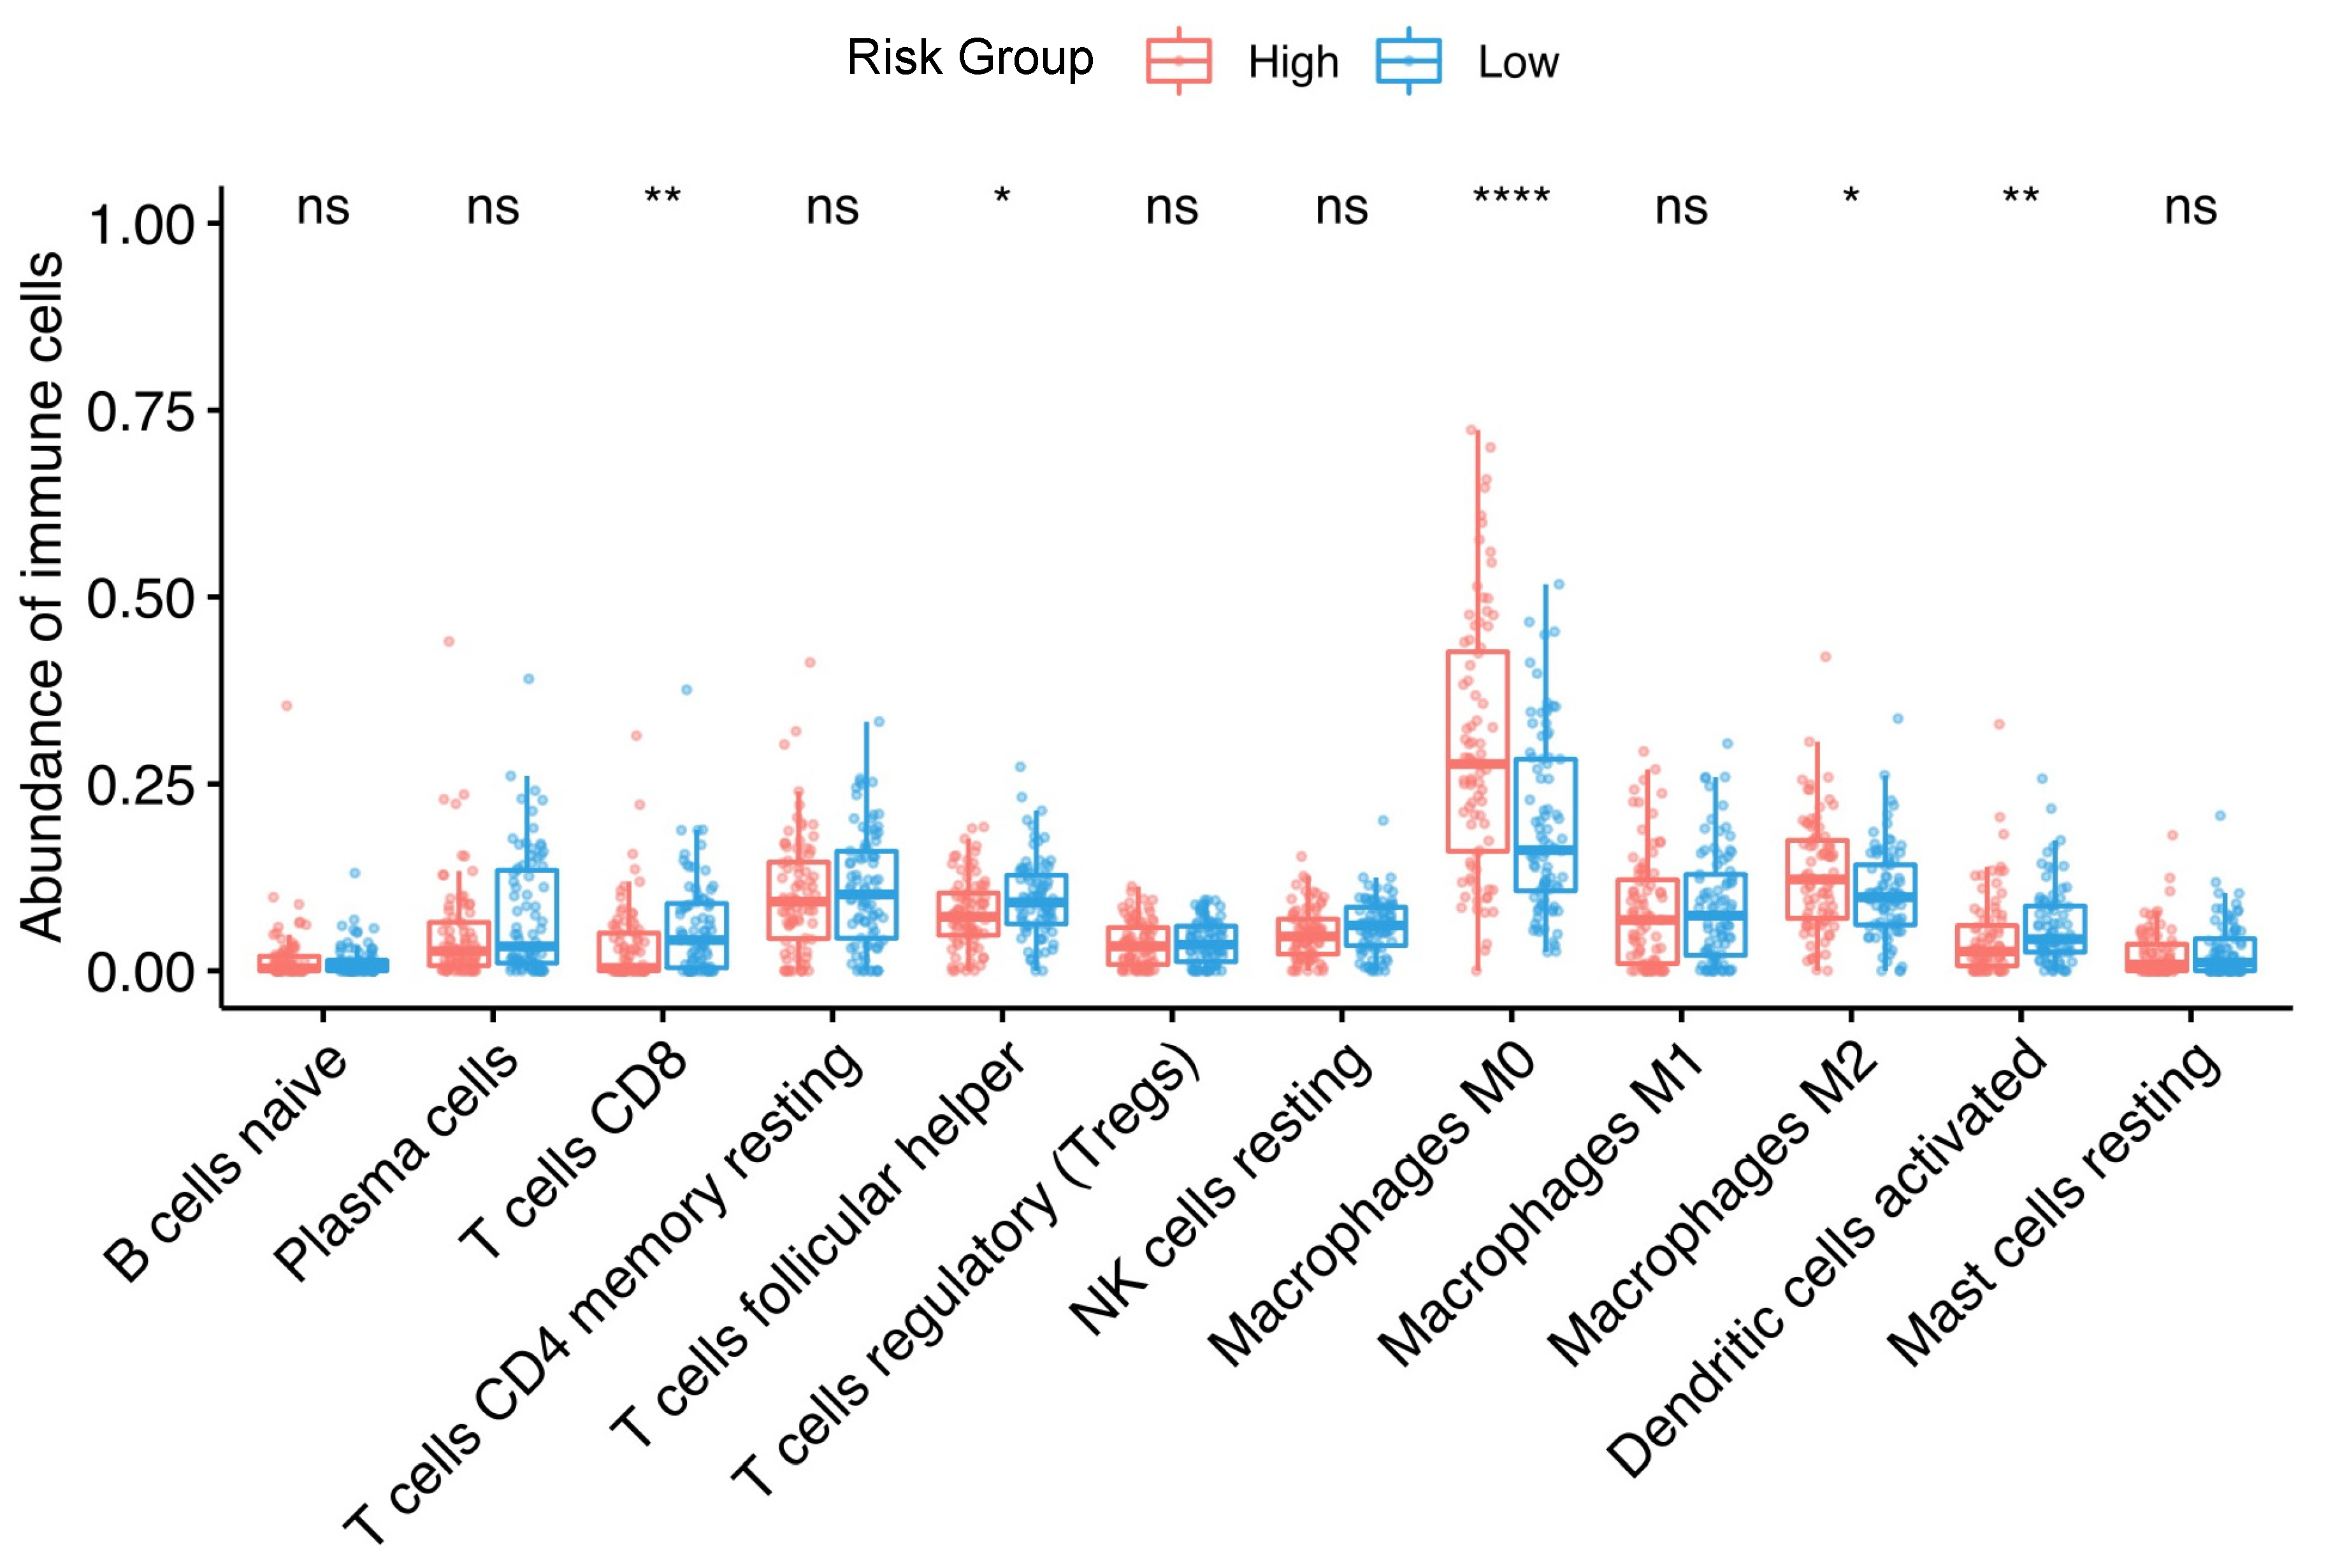
3.5. Association between Tumor-Infiltrating Immune Cells and the Risk Group
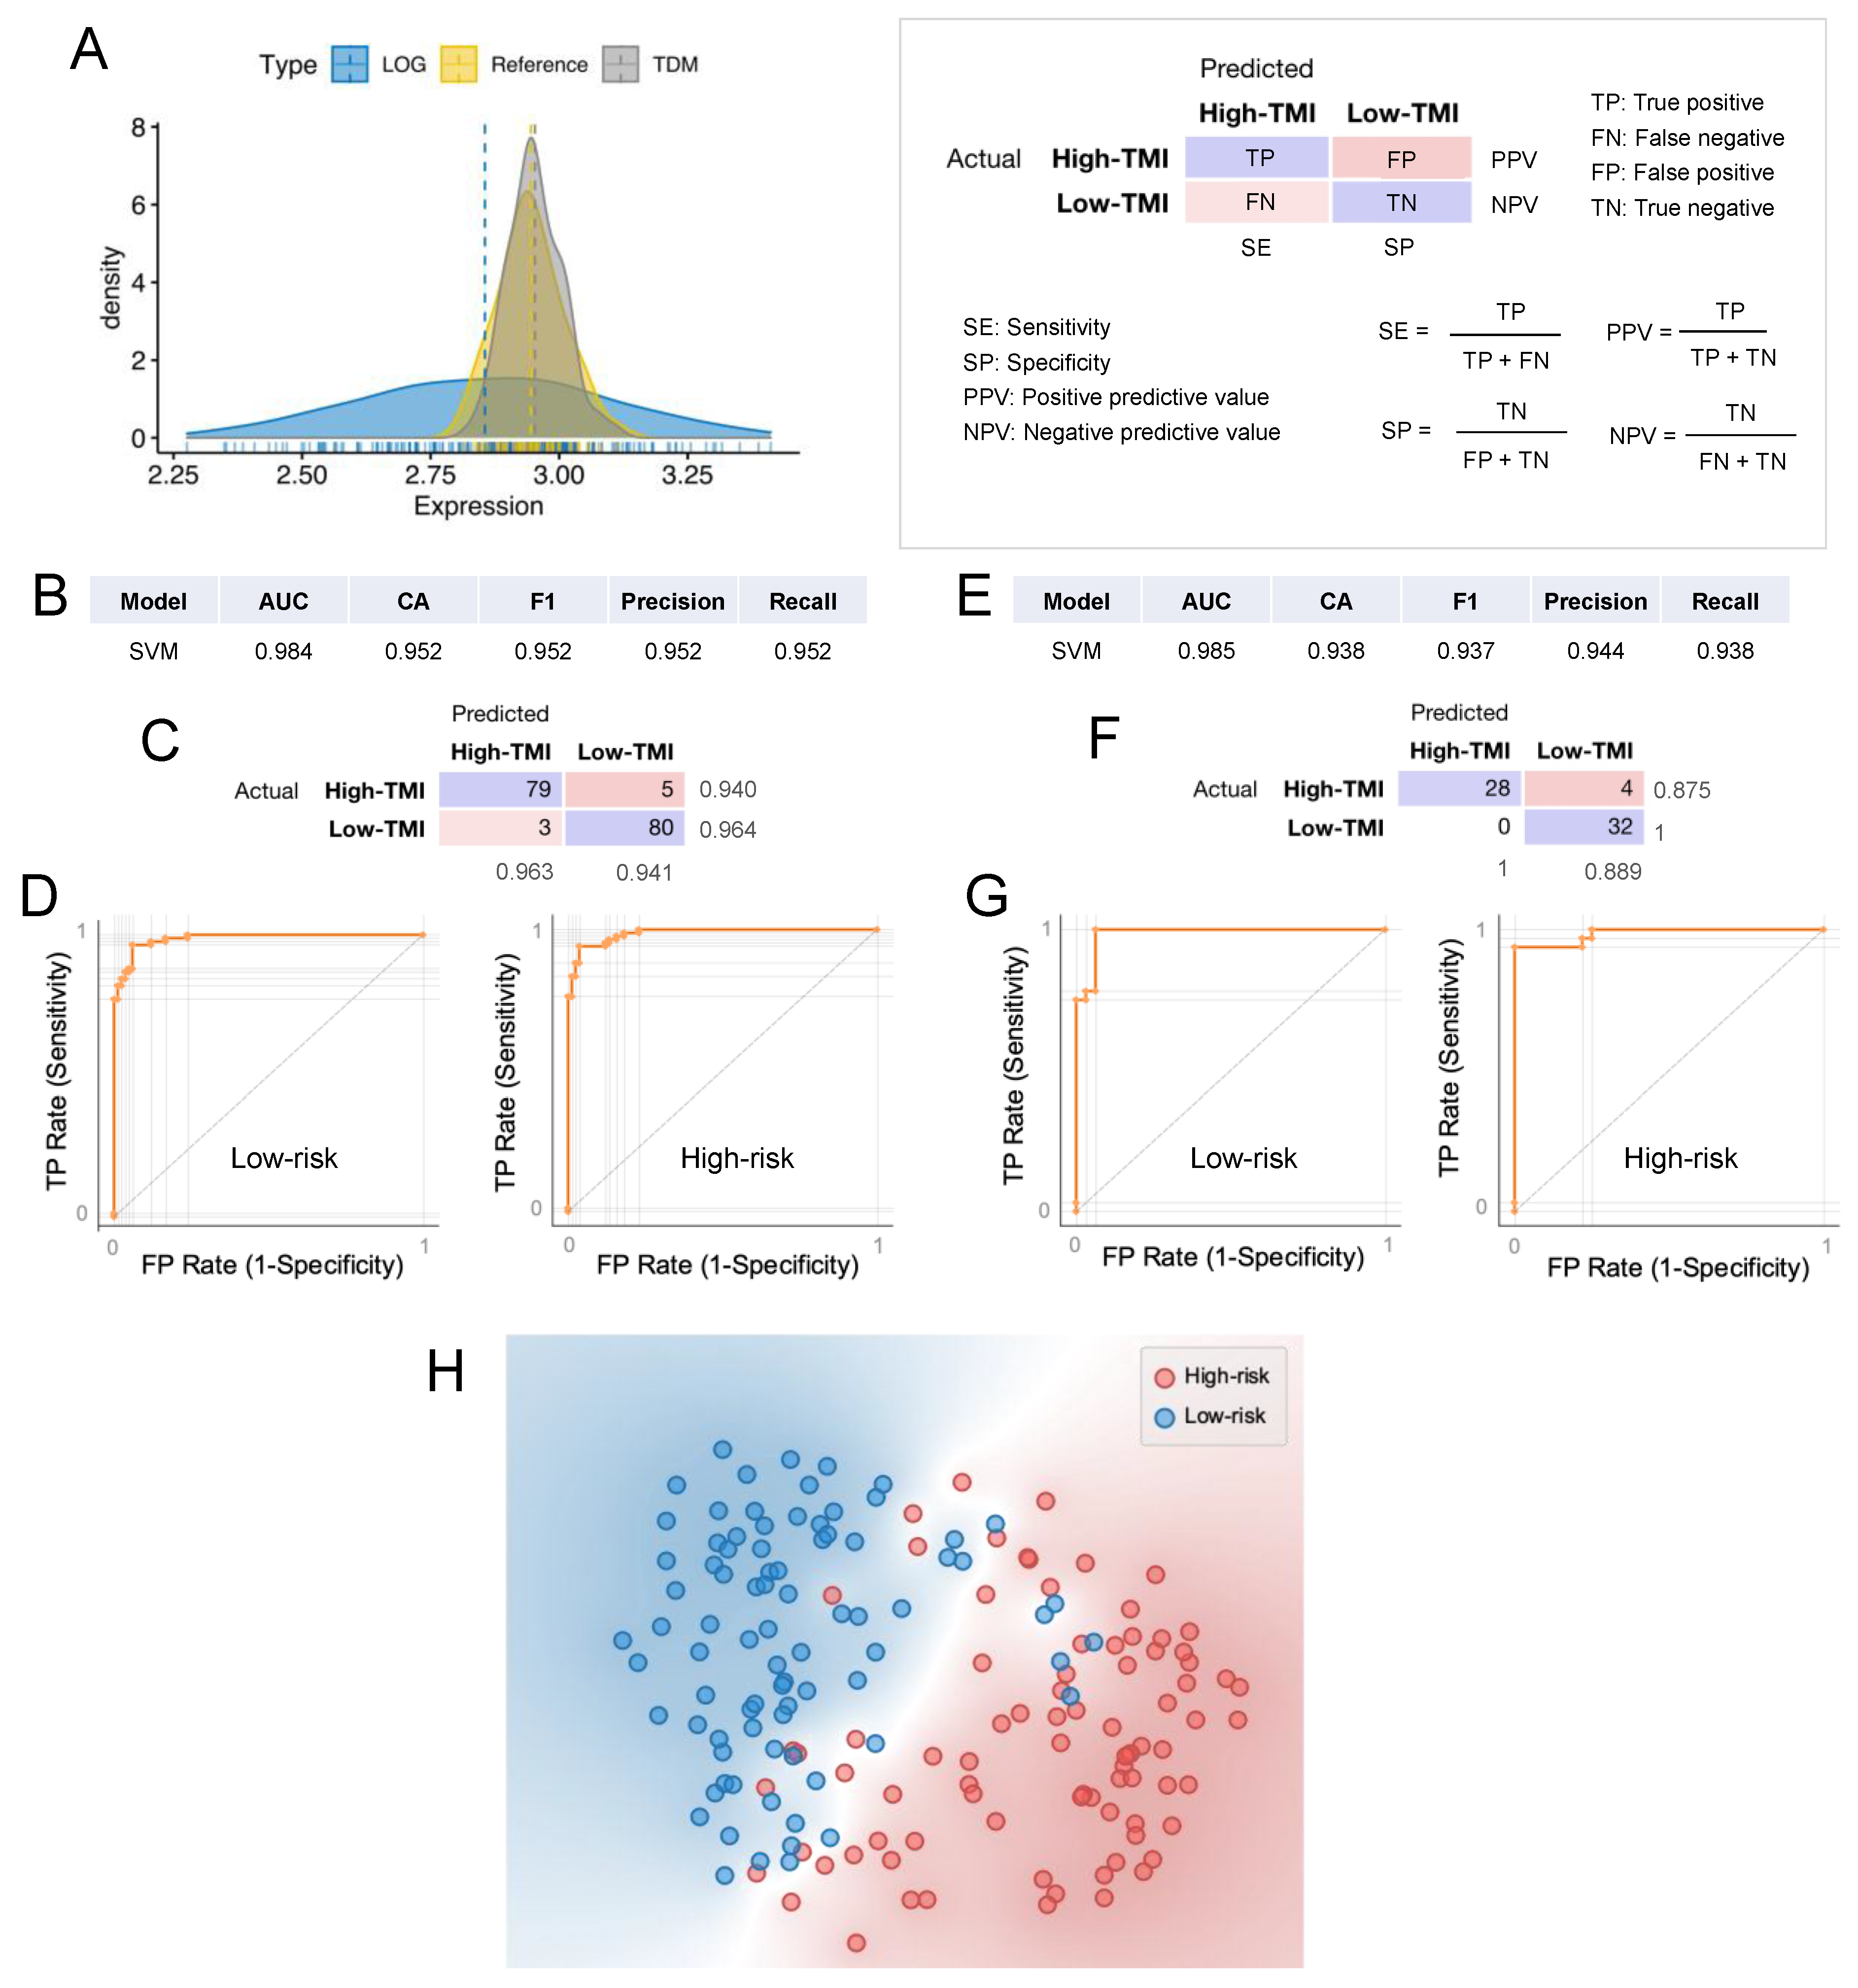
3.6. Machine Learning Approach for Risk Group Classification
4. Discussion
5. Conclusions
Supplementary Materials
Author Contributions
Funding
Institutional Review Board Statement
Informed Consent Statement
Data Availability Statement
Conflicts of Interest
References
- Dictionary-Pathology: Head and Neck Cancer—The Human Protein Atlas. Available online: https://www.proteinatlas.org/learn/dictionary/pathology/head+and+neck+cancer+2 (accessed on 16 April 2020).
- Palka, K.; Slebos, J.R.; Chung, H.C. Update in Molecular Diagnostic Tests in Head and Neck Cancer. J. Investig. Dermatol. 2008, 35, 198–210. [Google Scholar] [CrossRef][Green Version]
- Fitzmaurice, C.; Allen, C.; Barber, R.M.; Barregard, L.; Bhutta, Z.A.; Brenner, H.; Dicker, D.J.; Chimed-Orchir, O.; Dandona, R.; Dandona, L.; et al. Global, Regional, and National Cancer Incidence, Mortality, Years of Life Lost, Years Lived With Disability, and DisabilityAdjusted Life-years for 32 Cancer Groups, 1990 to 2015. JAMA Oncol. 2017, 3, 524–548. [Google Scholar]
- Simon, S. Facts & Figures 2019; American Cancer Society: Atlanta, GA, USA, 2019; p. 76. [Google Scholar]
- Mayne, S.T.; Morse, D.E.; Winn, D.M. Cancers of the Oral Cavity and Pharynx. In Cancer Epidemiology and Prevention; Oxford University Press: New York, NY, USA, 2009; ISBN 9780199865062. [Google Scholar]
- Hashibe, M.; Brennan, P.; Chuang, S.C.; Boccia, S.; Castellsague, X.; Chen, C.; Curado, M.P.; Maso, L.D.; Daudt, A.W.; Fabianova, E.; et al. Interaction between tobacco and alcohol use and the risk of head and neck cancer: Pooled analysis in the international head and neck cancer Epidemiology consortium. Cancer Epidemiol. Biomark. Prev. 2009, 18, 541–550. [Google Scholar] [CrossRef]
- Gillison, M.L.; Alemany, L.; Snijders, P.J.F.; Chaturvedi, A.; Steinberg, B.M.; Schwartz, S.; Castellsagué, X. Human papillomavirus and diseases of the upper airway: Head and neck cancer and respiratory papillomatosis. Vaccine 2012, 30, F34–F54. [Google Scholar] [CrossRef] [PubMed]
- Cadoni, G.; Giraldi, L.; Petrelli, L.; Pandolfini, M.; Giuliani, M.; Paludetti, G.; Pastorino, R.; Leoncini, E.; Arzani, D.; Almadori, G.; et al. Prognostic factors in head and neck cancer: A 10-year retrospective analysis in a single-institution in Italy. Acta Otorhinolaryngol. Ital. 2017, 37, 458–466. [Google Scholar] [CrossRef] [PubMed]
- Liu, S.A.; Wang, C.C.; Jiang, R.S.; Lee, F.Y.; Lin, W.J.; Lin, J.C. Pathological features and their prognostic impacts on oral cavity cancer patients among different subsites—A single institute’s experience in Taiwan. Sci. Rep. 2017, 7, 7451. [Google Scholar] [CrossRef] [PubMed]
- Vasan, K.; Low, T.H.H.; Gupta, R.; Ashford, B.; Asher, R.; Gao, K.; Ch’ng, S.; Palme, C.E.; Clark, J.R. Lymph node ratio as a prognostic factor in metastatic cutaneous head and neck squamous cell carcinoma. Head Neck 2018, 40, 993–999. [Google Scholar] [CrossRef] [PubMed]
- Wreesmann, V.B.; Katabi, N.; Palmer, F.L.; Montero, P.H.; Migliacci, J.C.; Gönen, M.; Carlson, D.; Ganly, I.; Shah, J.P.; Ghossein, R.; et al. Influence of extracapsular nodal spread extent on prognosis of oral squamous cell carcinoma. Head Neck 2016, 38, E1192–E1199. [Google Scholar] [CrossRef]
- Jadhav, K.B.; Gupta, N. Clinicopathological prognostic implicators of oral squamous cell carcinoma: Need to understand and revise. N. Am. J. Med. Sci. 2013, 5, 671–679. [Google Scholar] [CrossRef]
- Thomas, G.R.; Nadiminti, H.; Regalado, J. Molecular predictors of clinical outcome in patients with head and neck squamous cell carcinoma. Int. J. Exp. Pathol. 2005, 86, 347–363. [Google Scholar] [CrossRef]
- Roesch-Ely, M.; Nees, M.; Karsai, S.; Ruess, A.; Bogumil, R.; Warnken, U.; Schnölzer, M.; Dietz, A.; Plinkert, P.K.; Hofele, C.; et al. Proteomic analysis reveals successive aberrations in protein expression from healthy mucosa to invasive head and neck cancer. Oncogene 2007, 26, 54–64. [Google Scholar] [CrossRef]
- Suresh, A.; Vannan, M.; Kumaran, D.; Gümüs, Z.H.; Sivadas, P.; Murugaian, E.E.; Kekatpure, V.; Iyer, S.; Thangaraj, K.; Kuriakose, M.A. Resistance/response molecular signature for oral tongue squamous cell carcinoma. Dis. Markers 2012, 32, 51–64. [Google Scholar] [CrossRef] [PubMed]
- Reddy, R.B.; Khora, S.S.; Suresh, A. Molecular prognosticators in clinically and pathologically distinct cohorts of head and neck squamous cell carcinoma—A meta-analysis approach. PLoS ONE 2019, 14, e0218989. [Google Scholar] [CrossRef] [PubMed]
- Quail, D.F.; Joyce, J.A. Microenvironmental regulation of tumor progression and metastasis. Nat. Med. 2013, 19, 1423–1437. [Google Scholar] [CrossRef]
- Lu, P.; Weaver, V.M.; Werb, Z. The extracellular matrix: A dynamic niche in cancer progression. J. Cell Biol. 2012, 196, 395–406. [Google Scholar] [CrossRef] [PubMed]
- Naba, A.; Clauser, K.R.; Hoersch, S.; Liu, H.; Carr, S.A.; Hynes, R.O. The matrisome: In silico definition and in vivo characterization by proteomics of normal and tumor extracellular matrices. Mol. Cell. Prot. 2012, 11, M111.014647. [Google Scholar] [CrossRef]
- NCI; NHGRI The Cancer Genome Atlas Program—National Cancer Institute. Available online: https://www.cancer.gov/about-nci/organization/ccg/research/structural-genomics/tcga (accessed on 14 April 2020).
- Bin Lim, S.; Chua, M.L.K.; Yeong, J.P.S.; Tan, S.J.; Lim, W.-T.; Lim, C.T. Pan-cancer analysis connects tumor matrisome to immune response. NPJ Precis. Oncol. 2019, 3, 15. [Google Scholar] [CrossRef]
- Lim, S.B.; Tan, S.J.; Lim, W.T.; Lim, C.T. An extracellular matrix-related prognostic and predictive indicator for early-stage non-small cell lung cancer. Nat. Commun. 2017, 8, 1734. [Google Scholar] [CrossRef] [PubMed]
- Naba, A.; Clauser, K.R.; Ding, H.; Whittaker, C.A.; Carr, S.A.; Hynes, R.O. The extracellular matrix: Tools and insights for the “omics” era. Matrix Biol. 2016, 49, 10–24. [Google Scholar] [CrossRef]
- Goldman, M.J.; Craft, B.; Hastie, M.; Repečka, K.; McDade, F.; Kamath, A.; Banerjee, A.; Luo, Y.; Rogers, D.; Brooks, A.N.; et al. Visualizing and interpreting cancer genomics data via the Xena platform. Nat. Biotechnol. 2020, 38, 675–678. [Google Scholar] [CrossRef] [PubMed]
- Puram, S.V.; Tirosh, I.; Parikh, A.S.; Patel, A.P.; Yizhak, K.; Gillespie, S.; Rodman, C.; Luo, C.L.; Mroz, E.A.; Emerick, K.S.; et al. Single-Cell Transcriptomic Analysis of Primary and Metastatic Tumor Ecosystems in Head and Neck Cancer. Cell 2017, 171, 1611–1624. [Google Scholar] [CrossRef] [PubMed]
- Therneau, T. A Package for Survival Analysis in S. R Package Version 2.37-7; Springer: New York, NY, USA, 2014. [Google Scholar]
- Wichmann, G.; Rosolowski, M.; Krohn, K.; Kreuz, M.; Boehm, A.; Reiche, A.; Scharrer, U.; Halama, D.; Bertolini, J.; Bauer, U.; et al. The role of HPV RNA transcription, immune response-related gene expression and disruptive TP53 mutations in diagnostic and prognostic profiling of head and neck cancer. Int. J. Cancer 2015, 137, 2846–2857. [Google Scholar] [CrossRef] [PubMed]
- Belotti, Y.; Jokhun, D.S.; Ponnambalam, J.S.; Valerio, V.L.M.; Lim, C.T. Machine learning based approach to pH imaging and classification of single cancer cells. APL Bioeng. 2021, 5, 016105. [Google Scholar] [CrossRef]
- MASP1 Protein Expression Summary—The Human Protein Atlas. Available online: https://www.proteinatlas.org/ENSG00000127241-MASP1 (accessed on 7 May 2021).
- EGFL6 Protein Expression Summary—The Human Protein Atlas. Available online: https://www.proteinatlas.org/ENSG00000198759-EGFL6 (accessed on 7 May 2021).
- Choe, E.K.; Yi, J.W.; Chai, Y.J.; Park, K.J. Upregulation of the adipokine genes ADIPOR1 and SPP1 is related to poor survival outcomes in colorectal cancer. J. Surg. Oncol. 2018, 117, 1833–1840. [Google Scholar] [CrossRef]
- SPP1 Protein Expression Summary—The Human Protein Atlas. Available online: https://www.proteinatlas.org/ENSG00000118785-SPP1 (accessed on 7 May 2021).
- Van Tubergen, E.A.; Banerjee, R.; Liu, M.; Broek, R.V.; Light, E.; Kuo, S.; Feinberg, S.E.; Willis, A.L.; Wolf, G.; Carey, T.; et al. Inactivation or loss of TTP promotes invasion in head and neck cancer via transcript stabilization and secretion of MMP9, MMP2, and IL-6. Clin. Cancer Res. 2013, 19, 1169–1179. [Google Scholar] [CrossRef] [PubMed]
- Pietruszewska, W.; Bojanowska-Poźniak, K.; Kobos, J. Metaloproteinazy macierzy zewnątrzkomórkowej MMP1, MMP2, MMP9 oraz ich inhibitory tkankowe TIMP1, TIMP2, TIMP3 w rakach głowy i szyi: Badanie immunohistochemiczne. Otolaryngol. Pol. 2016, 70, 32–43. [Google Scholar] [CrossRef]
- P4HA1 Protein Expression Summary—The Human Protein Atlas. Available online: https://www.proteinatlas.org/ENSG00000122884-P4HA1 (accessed on 7 May 2021).
- Thompson, J.A.; Tan, J.; Greene, C.S. Cross-platform normalization of microarray and RNA-seq data for machine learning applications. PeerJ 2016, 4, e1621. [Google Scholar] [CrossRef]
- Lim, S.B.; Tan, S.J.; Lim, W.; Lim, C.T. Compendiums of cancer transcriptomes for machine learning applications. Sci. Data 2019, 6, 194. [Google Scholar] [CrossRef]
- Lee, M.H.; Chang, J.T.C.; Liao, C.T.; Chen, Y.S.; Kuo, M.L.; Shen, C.R. Interleukin 17 and peripheral IL-17-Expressing T cells are negatively correlated with the overall survival of head and neck cancer patients. Oncotarget 2018, 9, 9825–9837. [Google Scholar] [CrossRef]
- Böhrnsen, F.; Holzenburg, J.; Godek, F.; Kauffmann, P.; Moser, N.; Schliephake, H. Influence of tumour necrosis factor alpha on epithelial–mesenchymal transition of oral cancer cells in co-culture with mesenchymal stromal cells. Int. J. Oral Maxillofac. Surg. 2020, 49, 157–165. [Google Scholar] [CrossRef]
- Ward-Kavanagh, L.K.; Lin, W.W.; Šedý, J.R.; Ware, C.F. The TNF Receptor Superfamily in Co-stimulating and Co-inhibitory Responses. Immunity 2016, 44, 1005–1019. [Google Scholar] [CrossRef]
- Evrard, D.; Szturz, P.; Tijeras-Raballand, A.; Astorgues-Xerri, L.; Abitbol, C.; Paradis, V.; Raymond, E.; Albert, S.; Barry, B.; Faivre, S. Macrophages in the microenvironment of head and neck cancer: Potential targets for cancer therapy. Oral Oncol. 2019, 88, 29–38. [Google Scholar] [CrossRef] [PubMed]
- Mantovani, A.; Bottazzi, B.; Colotta, F.; Sozzani, S.; Ruco, L. The origin and function of tumor-associated macrophages. Immunol. Today 1992, 13, 265–270. [Google Scholar] [CrossRef]
- Troiano, G.; Caponio, V.C.A.; Adipietro, I.; Tepedino, M.; Santoro, R.; Laino, L.; Lo Russo, L.; Cirillo, N.; Lo Muzio, L. Prognostic significance of CD68+ and CD163+ tumor associated macrophages in head and neck squamous cell carcinoma: A systematic review and meta-analysis. Oral Oncol. 2019, 93, 66–75. [Google Scholar] [CrossRef]
- Kumar, A.T.; Knops, A.; Swendseid, B.; Martinez-Outschoom, U.; Harshyne, L.; Philp, N.; Rodeck, U.; Luginbuhl, A.; Cognetti, D.; Johnson, J.; et al. Prognostic Significance of Tumor-Associated Macrophage Content in Head and Neck Squamous Cell Carcinoma: A Meta-Analysis. Front. Oncol. 2019, 9, 656. [Google Scholar] [CrossRef] [PubMed]
- Sakakura, K.; Takahashi, H.; Kaira, K.; Toyoda, M.; Murata, T.; Ohnishi, H.; Oyama, T.; Chikamatsu, K. Relationship between tumor-Associated macrophage subsets and CD47 expression in squamous cell carcinoma of the head and neck in the tumor microenvironment. Lab. Investig. 2016, 96, 994–1003. [Google Scholar] [CrossRef]
- Gao, L.; Zhang, W.; Zhong, W.Q.; Liu, Z.J.; Li, H.M.; Yu, Z.L.; Zhao, Y.F. Tumor associated macrophages induce epithelial to mesenchymal transition via the EGFR/ERK1/2 pathway in head and neck squamous cell carcinoma. Oncol. Rep. 2018, 40, 2558–2572. [Google Scholar] [CrossRef] [PubMed]
- Tekin, C.; Aberson, H.L.; Bijlsma, M.F.; Spek, C.A. Early macrophage infiltrates impair pancreatic cancer cell growth by TNF-α secretion. BMC Cancer 2020, 20, 1183. [Google Scholar] [CrossRef]
- Ali, H.R.; Chlon, L.; Pharoah, P.D.P.; Markowetz, F.; Caldas, C. Patterns of Immune Infiltration in Breast Cancer and Their Clinical Implications: A Gene-Expression-Based Retrospective Study. PLoS Med. 2016, 13, e1002194. [Google Scholar] [CrossRef]
- Balermpas, P.; Rödel, F.; Rödel, C.; Krause, M.; Linge, A.; Lohaus, F.; Baumann, M.; Tinhofer, I.; Budach, V.; Gkika, E.; et al. CD8+ tumour-infiltrating lymphocytes in relation to HPV status and clinical outcome in patients with head and neck cancer after postoperative chemoradiotherapy: A multicentre study of the German cancer consortium radiation oncology group (DKTK-ROG). Int. J. Cancer 2016, 138, 171–181. [Google Scholar] [CrossRef]
- Watanabe, Y.; Katou, F.; Ohtani, H.; Nakayama, T.; Yoshie, O.; Hashimoto, K. Tumor-infiltrating lymphocytes, particularly the balance between CD8+ T cells and CCR4+ regulatory T cells, affect the survival of patients with oral squamous cell carcinoma. Oral Surg. Oral Med. Oral Pathol. Oral Radiol. Endodontol. 2010, 109, 744–752. [Google Scholar] [CrossRef] [PubMed]
- Boucek, J.; Mrkvan, T.; Chovanec, M.; Kuchar, M.; Betka, J.; Boucek, V.; Hladikova, M.; Betka, J.; Eckschlager, T.; Rihova, B. Regulatory T cells and their prognostic value for patients with squamous cell carcinoma of the head and neck. J. Cell. Mol. Med. 2010, 14, 426–433. [Google Scholar] [CrossRef] [PubMed]
- Cillo, A.R.; Kürten, C.H.L.; Tabib, T.; Qi, Z.; Onkar, S.; Wang, T.; Liu, A.; Duvvuri, U.; Kim, S.; Soose, R.J.; et al. Immune Landscape of Viral- and Carcinogen-Driven Head and Neck Cancer. Immunity 2020, 52, 183–199. [Google Scholar] [CrossRef] [PubMed]


Publisher’s Note: MDPI stays neutral with regard to jurisdictional claims in published maps and institutional affiliations. |
© 2021 by the authors. Licensee MDPI, Basel, Switzerland. This article is an open access article distributed under the terms and conditions of the Creative Commons Attribution (CC BY) license (https://creativecommons.org/licenses/by/4.0/).
Share and Cite
Belotti, Y.; Lim, S.B.; Iyer, N.G.; Lim, W.-T.; Lim, C.T. Prognostic Matrisomal Gene Panel and Its Association with Immune Cell Infiltration in Head and Neck Carcinomas. Cancers 2021, 13, 5761. https://doi.org/10.3390/cancers13225761
Belotti Y, Lim SB, Iyer NG, Lim W-T, Lim CT. Prognostic Matrisomal Gene Panel and Its Association with Immune Cell Infiltration in Head and Neck Carcinomas. Cancers. 2021; 13(22):5761. https://doi.org/10.3390/cancers13225761
Chicago/Turabian StyleBelotti, Yuri, Su Bin Lim, Narayanan Gopalakrishna Iyer, Wan-Teck Lim, and Chwee Teck Lim. 2021. "Prognostic Matrisomal Gene Panel and Its Association with Immune Cell Infiltration in Head and Neck Carcinomas" Cancers 13, no. 22: 5761. https://doi.org/10.3390/cancers13225761
APA StyleBelotti, Y., Lim, S. B., Iyer, N. G., Lim, W.-T., & Lim, C. T. (2021). Prognostic Matrisomal Gene Panel and Its Association with Immune Cell Infiltration in Head and Neck Carcinomas. Cancers, 13(22), 5761. https://doi.org/10.3390/cancers13225761