
TP53 Combined Phenotype Score Is Associated with the Clinical Outcome of TP53-Mutated Myelodysplastic Syndromes

 , ,
, ,
Abstract
:Simple Summary
Abstract
1. Introduction
2. Materials and Methods
2.1. Study Group
2.2. Conventional Cytogenetics and Fluorescence In Situ Hybridization Analysis
2.3. Next-Generation Sequencing
2.4. TP53 Mutation Phenotype Score (PHANTM Combined Phenotype Score)
2.5. Statistical Analysis
3. Results
3.1. Patient Characteristics
3.2. TP53 Mutations, Other Co-Mutations, and Cytogenetic Abnormalities
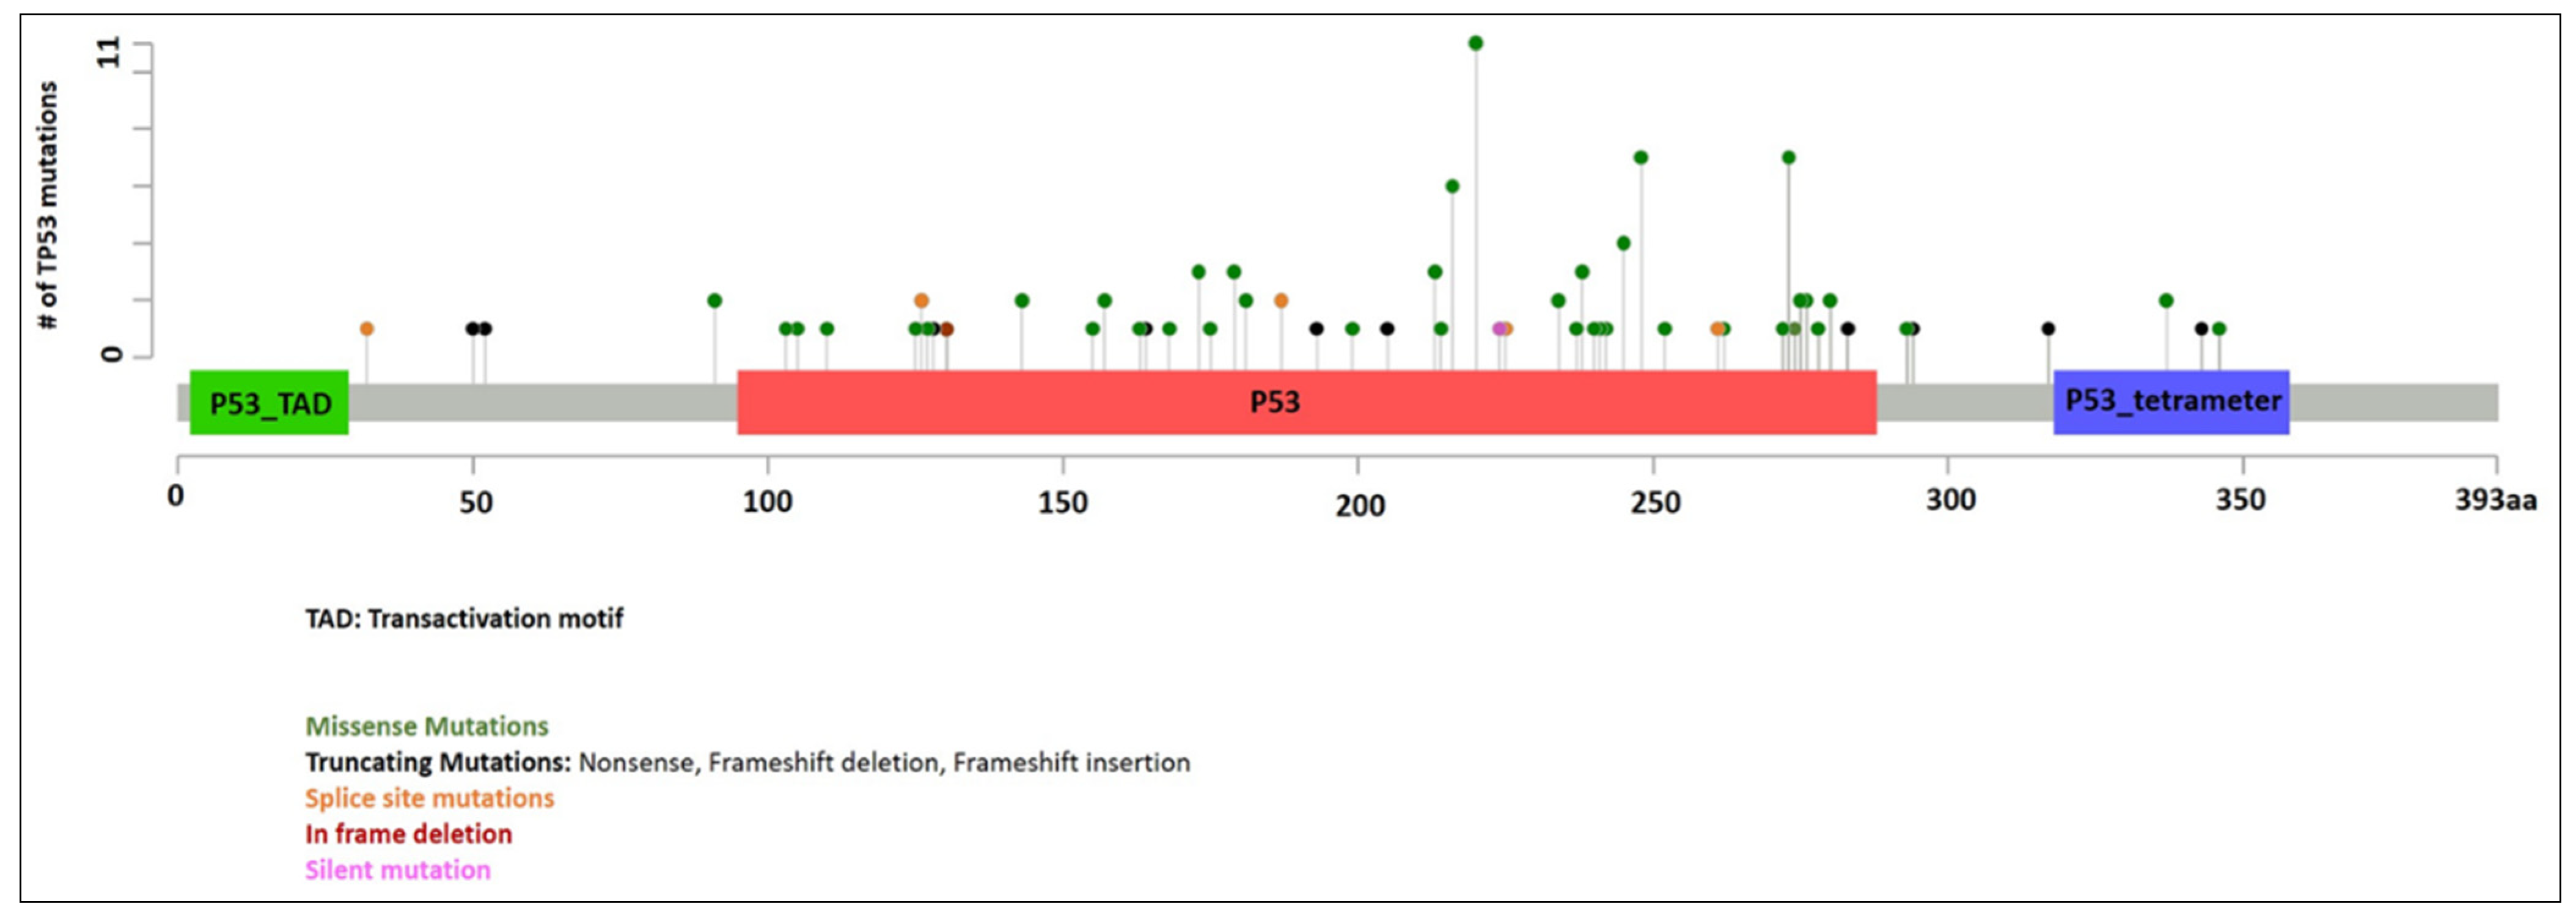
3.2.1. TP53 Mutations
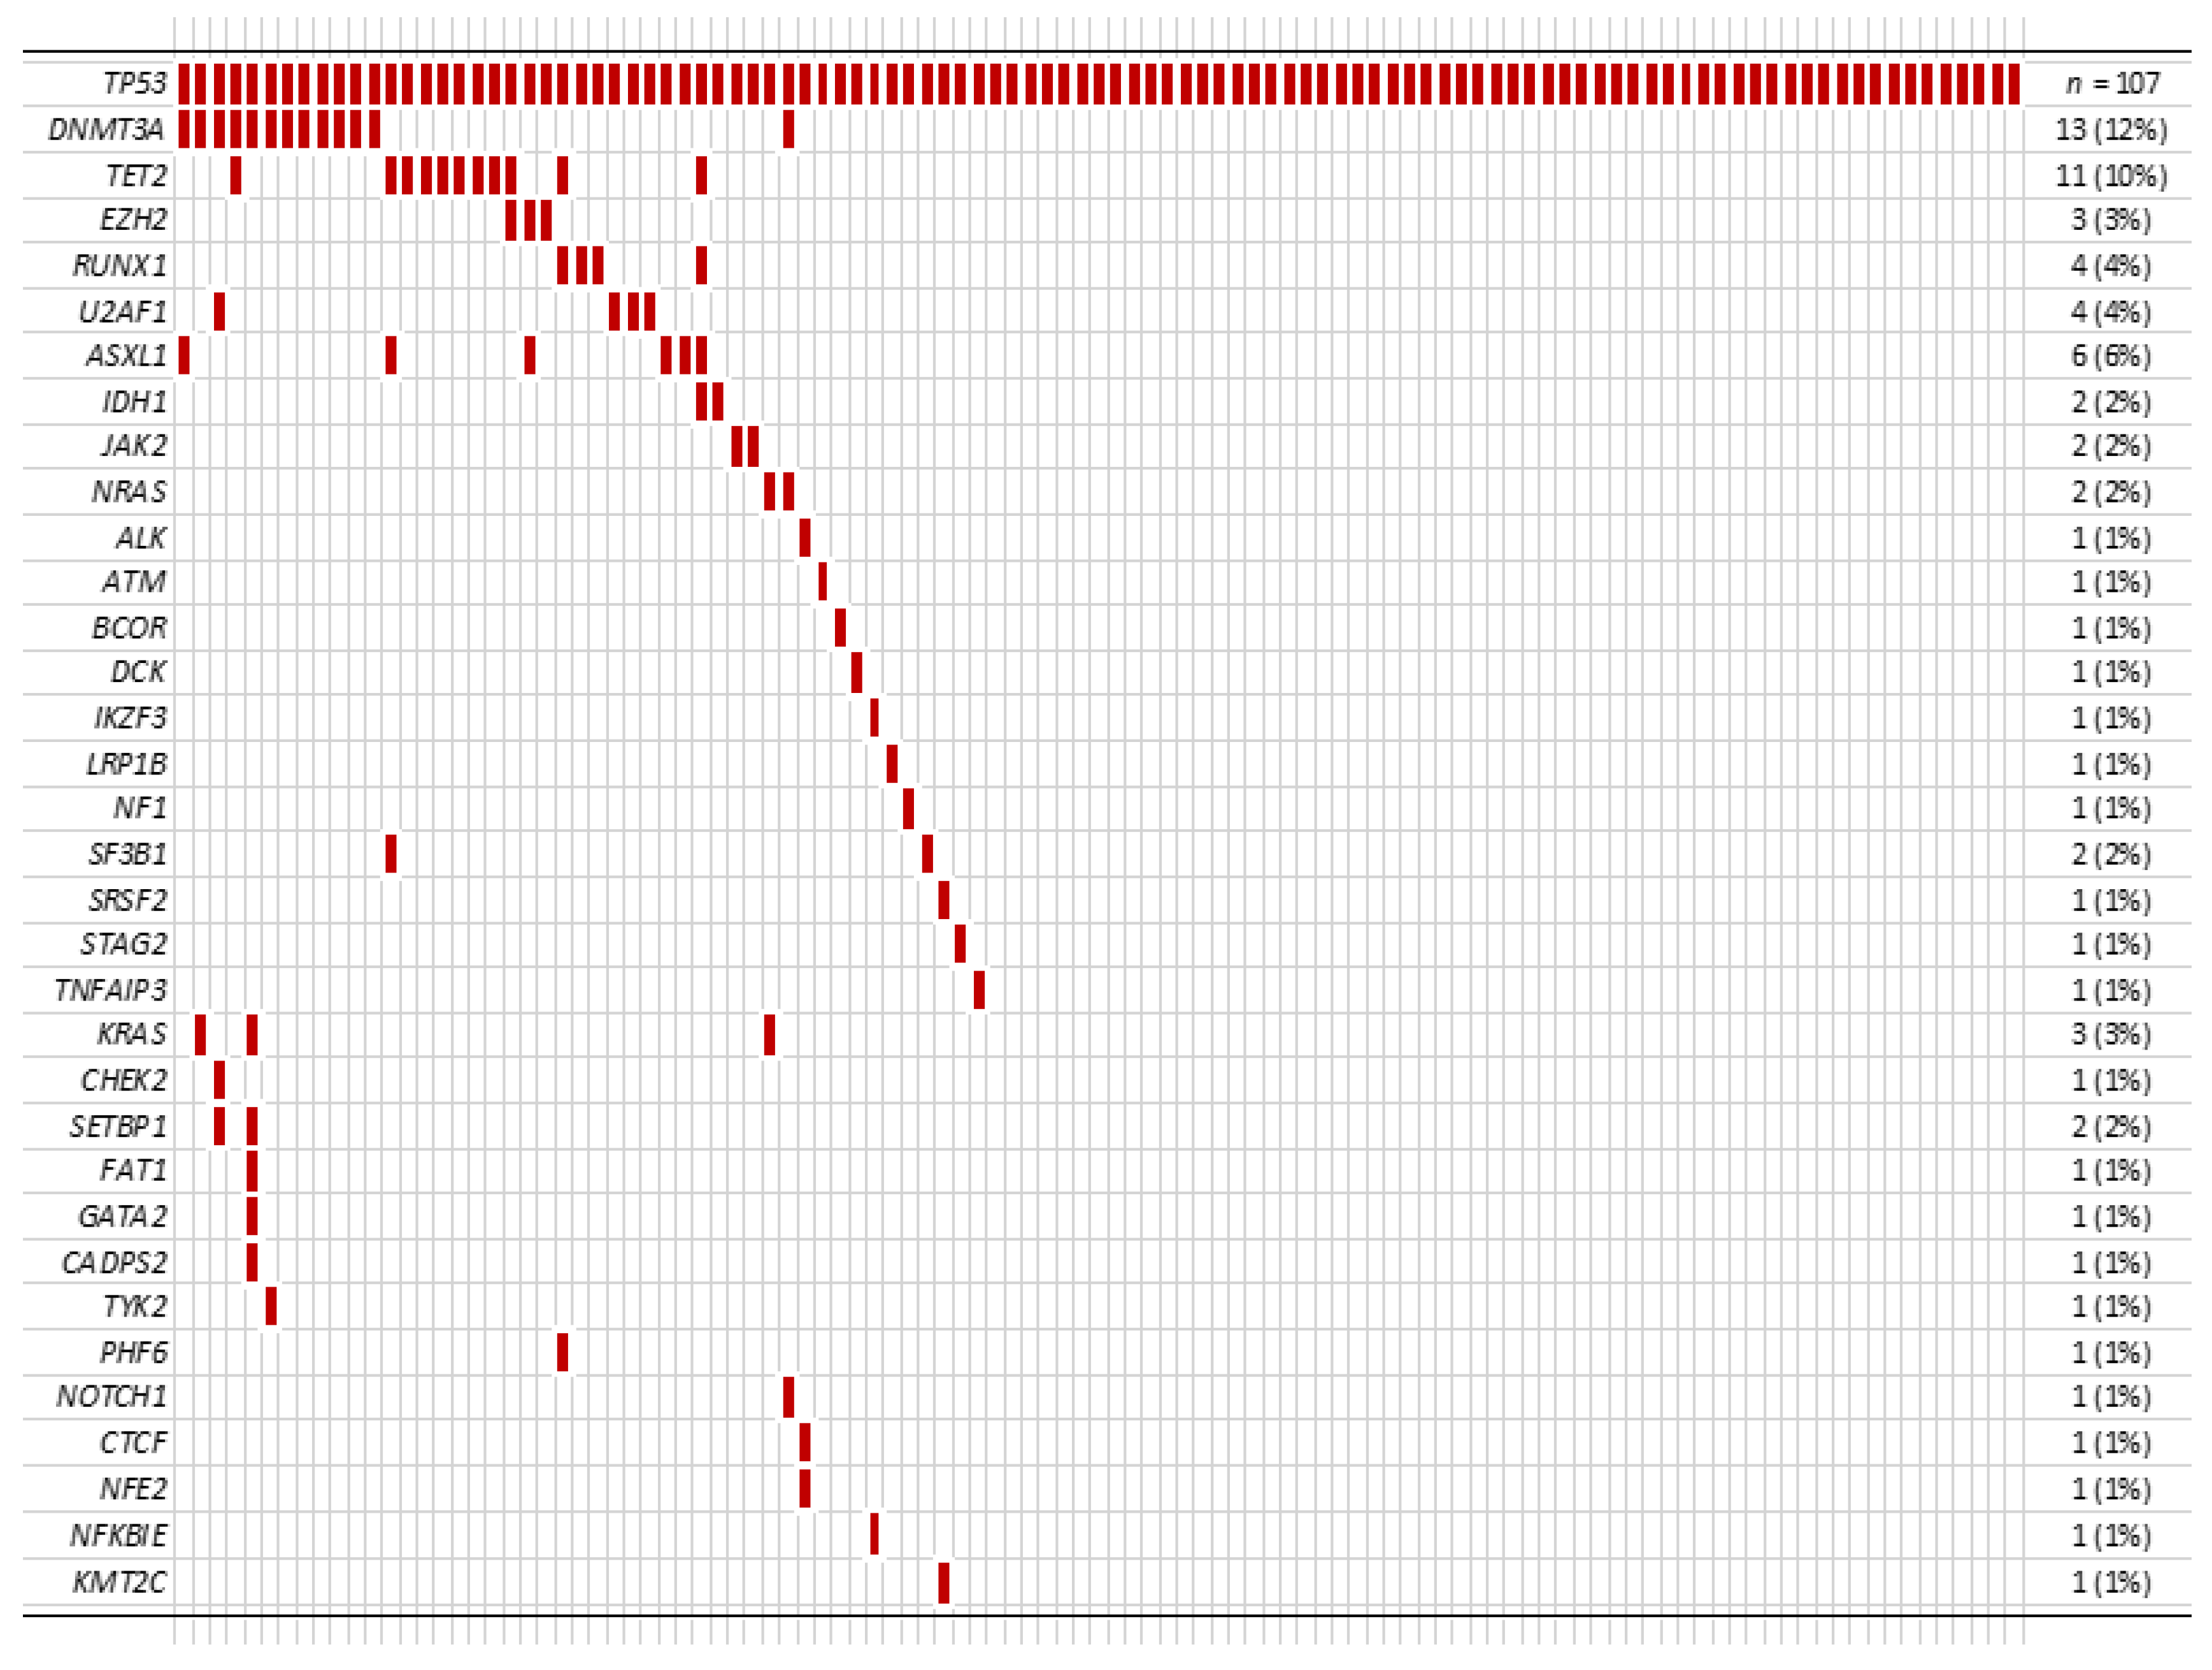
3.2.2. Other Co-Mutations
3.2.3. Cytogenetic Abnormalities
3.3. PHANTM Combined Phenotype Score
3.4. Therapy
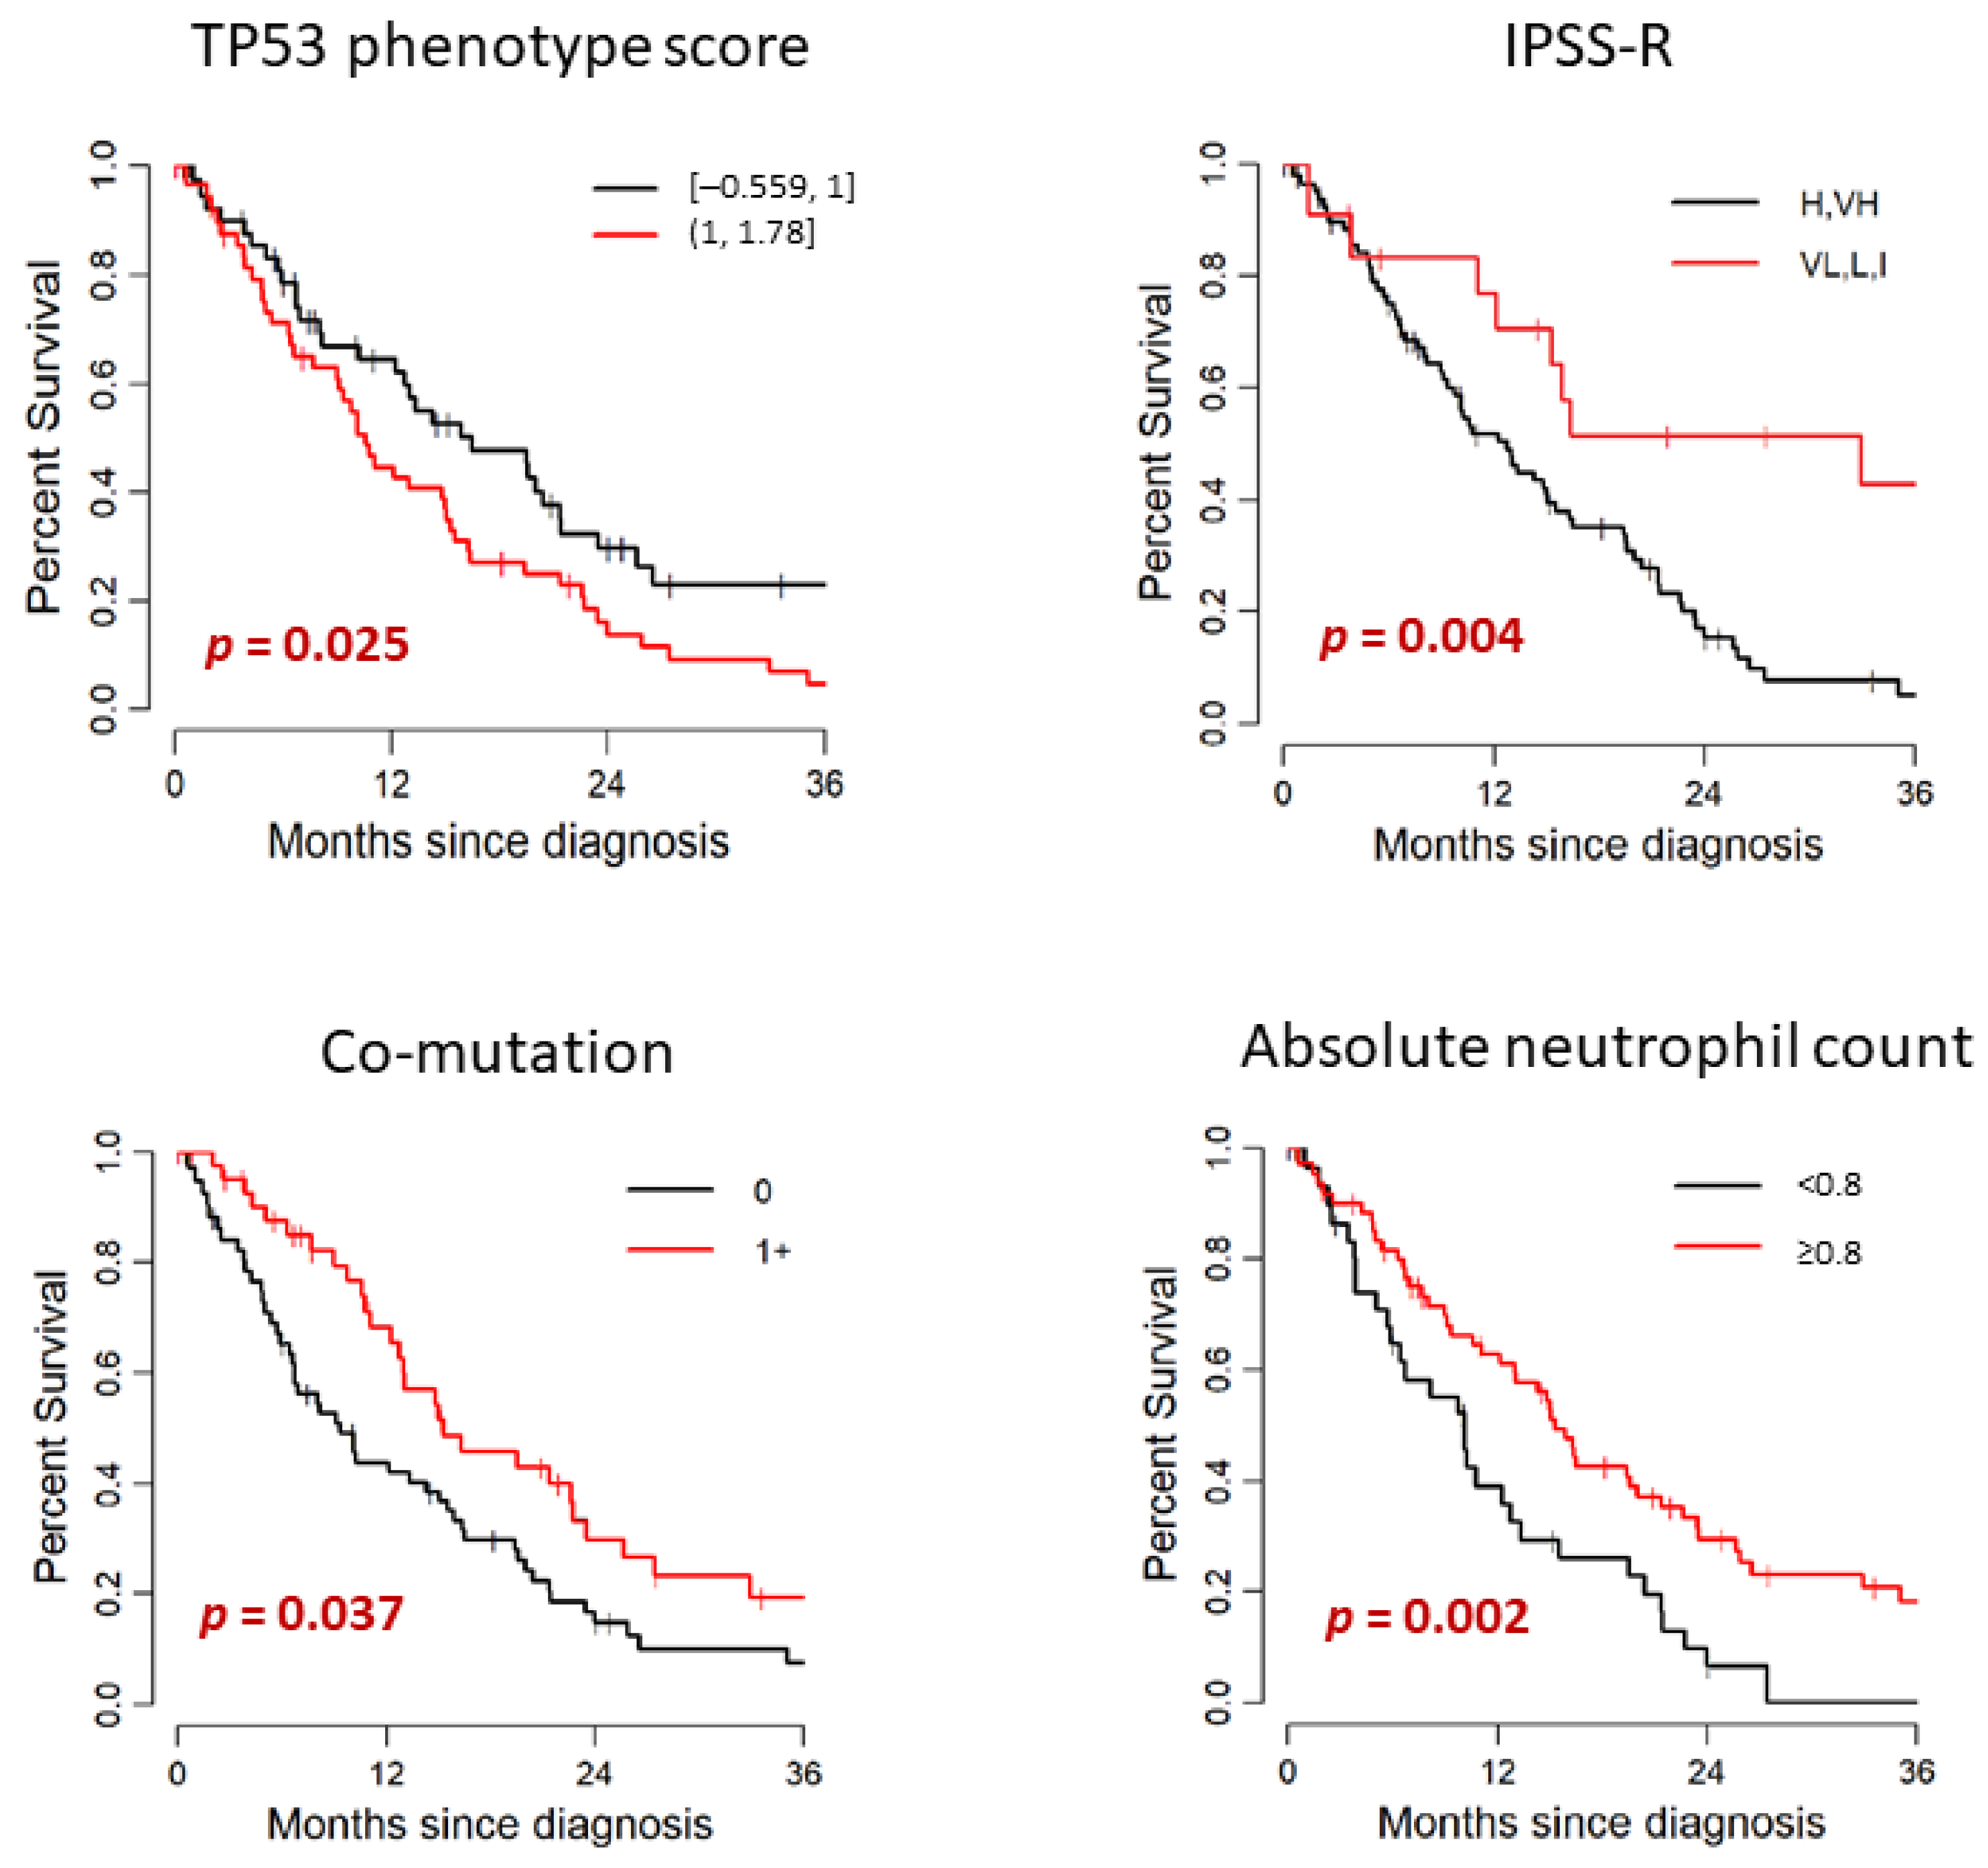
3.5. Outcome
4. Discussion
5. Conclusions
Supplementary Materials
Author Contributions
Funding
Institutional Review Board Statement
Informed Consent Statement
Data Availability Statement
Acknowledgments
Conflicts of Interest
References
- Hasserjian, R.P.; Orazi, A.; Brunning, R.D.; Germing, U.; Le Beau, M.M.; Porwit, A.; Baumann, I.; Hellstrom-Lindberg, E.; List, A.F.; Cazzola, M.; et al. Myeloysplastic syndromes. In WHO Classification of Tumours of Haematopoietic and Lymphoid Tissues, Revised, 4th ed.; Swerdlow, S.H., Campo, E., Harris, N.L., Jaffe, E.S., Pileri, S.A., Stein, H., Thiele, J., Arber, D.A., Hasserjian, R.P., Le Beau, M.M., Orazi, A., et al., Eds.; IARC: Lyon, Switzerland, 2017; pp. 97–120. [Google Scholar]
- Zehir, A.; Benayed, R.; Shah, R.H.; Syed, A.; Middha, S.; Kim, H.R.; Srinivasan, P.; Gao, J.; Chakravarty, D.; Devlin, S.M.; et al. Mutational landscape of metastatic cancer revealed from prospective clinical sequencing of 10,000 patients. Nat. Med. 2017, 23, 703–713. [Google Scholar] [CrossRef]
- Hainaut, P.; Pfeifer, G.P. Somatic TP53 Mutations in the Era of Genome Sequencing. Cold Spring Harb. Perspect. Med. 2016, 6, a026179. [Google Scholar]
- Papaemmanuil, E.; Gerstung, M.; Malcovati, L.; Tauro, S.; Gundem, G.; Van Loo, P.; Yoon, C.J.; Ellis, P.; Wedge, D.C.; Pellagatti, A.; et al. Clinical and biological implications of driver mutations in myelodysplastic syndromes. Blood 2013, 122, 3616–3627. [Google Scholar] [CrossRef]
- Haase, D.; Stevenson, K.E.; Neuberg, D.; Maciejewski, J.P.; Nazha, A.; Sekeres, M.A.; Ebert, B.L.; Garcia-Manero, G.; Haferlach, C.; Haferlach, T.; et al. TP53 mutation status divides myelodysplastic syndromes with complex karyotypes into distinct prognostic subgroups. Leukemia 2019, 33, 1747–1758. [Google Scholar] [CrossRef] [Green Version]
- Bejar, R.; Stevenson, K.; Abdel-Wahab, O.; Galili, N.; Nilsson, B.; Garcia-Manero, G.; Kantarjian, H.; Raza, A.; Levine, R.L.; Neuberg, D.; et al. Clinical effect of point mutations in myelodysplastic syndromes. N. Engl. J. Med. 2011, 364, 2496–2506. [Google Scholar] [CrossRef] [PubMed] [Green Version]
- Lindsley, R.C.; Saber, W.; Mar, B.G.; Redd, R.; Wang, T.; Haagenson, M.D.; Grauman, P.V.; Hu, Z.H.; Spellman, S.R.; Lee, S.J.; et al. Prognostic Mutations in Myelodysplastic Syndrome after Stem-Cell Transplantation. N. Engl. J. Med. 2017, 376, 536–547. [Google Scholar] [CrossRef] [Green Version]
- Montalban-Bravo, G.; Takahashi, K.; Patel, K.; Wang, F.; Xingzhi, S.; Nogueras, G.M.; Huang, X.; Pierola, A.A.; Jabbour, E.; Colla, S.; et al. Impact of the number of mutations in survival and response outcomes to hypomethylating agents in patients with myelodysplastic syndromes or myelodysplastic/myeloproliferative neoplasms. Oncotarget 2018, 9, 9714–9727. [Google Scholar] [CrossRef] [PubMed] [Green Version]
- Takahashi, K.; Patel, K.; Bueso-Ramos, C.; Zhang, J.; Gumbs, C.; Jabbour, E.; Kadia, T.; Andreff, M.; Konopleva, M.; DiNardo, C.; et al. Clinical implications of TP53 mutations in myelodysplastic syndromes treated with hypomethylating agents. Oncotarget 2016, 7, 14172–14187. [Google Scholar] [CrossRef] [PubMed] [Green Version]
- Sallman, D.A.; Komrokji, R.; Vaupel, C.; Cluzeau, T.; Geyer, S.M.; McGraw, K.L.; Al Ali, N.H.; Lancet, J.; McGinniss, M.J.; Nahas, S.; et al. Impact of TP53 mutation variant allele frequency on phenotype and outcomes in myelodysplastic syndromes. Leukemia 2016, 30, 666–673. [Google Scholar] [CrossRef]
- Haber, D.; Harlow, E. Tumour-suppressor genes: Evolving definitions in the genomic age. Nat. Genet. 1997, 16, 320–322. [Google Scholar] [CrossRef]
- Ewing, A.; Meynert, A.; Churchman, M.; Grimes, G.R.; Hollis, R.L.; Herrington, C.S.; Rye, T.; Bartos, C.; Croy, I.; Ferguson, M.; et al. Structural Variants at the BRCA1/2 Loci are a Common Source of Homologous Repair Deficiency in High-grade Serous Ovarian Carcinoma. Clin. Cancer Res. 2021, 27, 3201–3214. [Google Scholar] [CrossRef]
- Petitjean, A.; Mathe, E.; Kato, S.; Ishioka, C.; Tavtigian, S.V.; Hainaut, P.; Olivier, M. Impact of mutant p53 functional properties on TP53 mutation patterns and tumor phenotype: Lessons from recent developments in the IARC TP53 database. Hum. Mutat. 2007, 28, 622–629. [Google Scholar] [CrossRef] [PubMed]
- Kato, S.; Han, S.Y.; Liu, W.; Otsuka, K.; Shibata, H.; Kanamaru, R.; Ishioka, C. Understanding the function-structure and function-mutation relationships of p53 tumor suppressor protein by high-resolution missense mutation analysis. Proc. Natl. Acad. Sci. USA 2003, 100, 8424–8429. [Google Scholar] [CrossRef] [Green Version]
- Giacomelli, A.O.; Yang, X.; Lintner, R.E.; McFarland, J.M.; Duby, M.; Kim, J.; Howard, T.P.; Takeda, D.Y.; Ly, S.H.; Kim, E.; et al. Mutational processes shape the landscape of TP53 mutations in human cancer. Nat. Genet. 2018, 50, 1381–1387. [Google Scholar] [CrossRef]
- Milner, J.; Medcalf, E.A. Cotranslation of activated mutant p53 with wild type drives the wild-type p53 protein into the mutant conformation. Cell 1991, 65, 765–774. [Google Scholar] [CrossRef]
- Harvey, M.; Vogel, H.; Morris, D.; Bradley, A.; Bernstein, A.; Donehower, L.A. A mutant p53 transgene accelerates tumour development in heterozygous but not nullizygous p53-deficient mice. Nat. Genet. 1995, 9, 305–311. [Google Scholar] [CrossRef]
- De Vries, A.; Flores, E.R.; Miranda, B.; Hsieh, H.M.; van Oostrom, C.T.; Sage, J.; Jacks, T. Targeted point mutations of p53 lead to dominant-negative inhibition of wild-type p53 function. Proc. Natl. Acad. Sci. USA 2002, 99, 2948–2953. [Google Scholar] [CrossRef] [PubMed] [Green Version]
- Lang, G.A.; Iwakuma, T.; Suh, Y.A.; Liu, G.; Rao, V.A.; Parant, J.M.; Valentin-Vega, Y.A.; Terzian, T.; Caldwell, L.C.; Strong, L.C.; et al. Gain of function of a p53 hot spot mutation in a mouse model of Li-Fraumeni syndrome. Cell 2004, 119, 861–872. [Google Scholar] [CrossRef] [PubMed] [Green Version]
- Freed-Pastor, W.A.; Prives, C. Mutant p53: One name, many proteins. Genes Dev. 2012, 26, 1268–1286. [Google Scholar] [CrossRef] [PubMed] [Green Version]
- Boettcher, S.; Miller, P.G.; Sharma, R.; McConkey, M.; Leventhal, M.; Krivtsov, A.V.; Giacomelli, A.O.; Wong, W.; Kim, J.; Chao, S.; et al. A dominant-negative effect drives selection of TP53 missense mutations in myeloid malignancies. Science 2019, 365, 599–604. [Google Scholar] [CrossRef] [PubMed]
- Greenberg, P.L.; Tuechler, H.; Schanz, J.; Sanz, G.; Garcia-Manero, G.; Sole, F.; Bennett, J.M.; Bowen, D.; Fenaux, P.; Dreyfus, F.; et al. Revised international prognostic scoring system for myelodysplastic syndromes. Blood 2012, 120, 2454–2465. [Google Scholar] [CrossRef]
- Shaffer, L.G.; McGowan-Jordan, J.; Schmid, M. An International System for Human Cytogenetic Nomenclature; Karger: Basel, Switzerland, 2013. [Google Scholar]
- Smeby, J.; Sveen, A.; Eilertsen, I.A.; Danielsen, S.A.; Hoff, A.M.; Eide, P.W.; Johannessen, B.; Hektoen, M.; Skotheim, R.; Guren, M.G.; et al. Transcriptional and functional consequences of TP53 splice mutations in colorectal cancer. Oncogenesis 2019, 8, 35. [Google Scholar] [CrossRef]
- Holmila, R.; Fouquet, C.; Cadranel, J.; Zalcman, G.; Soussi, T. Splice mutations in the p53 gene: Case report and review of the literature. Hum. Mutat. 2003, 21, 101–102. [Google Scholar] [CrossRef] [PubMed]
- Kalbfleisch, J.D.; Prentice, R.L. The Statistical Analysis of Failure Time Data, 2nd ed.; Wiley: Hoboken, NJ, USA, 2002. [Google Scholar]
- Haferlach, T.; Nagata, Y.; Grossmann, V.; Okuno, Y.; Bacher, U.; Nagae, G.; Schnittger, S.; Sanada, M.; Kon, A.; Alpermann, T.; et al. Landscape of genetic lesions in 944 patients with myelodysplastic syndromes. Leukemia 2014, 28, 241–247. [Google Scholar] [CrossRef] [Green Version]
- Kastenhuber, E.R.; Lowe, S.W. Putting p53 in Context. Cell 2017, 170, 1062–1078. [Google Scholar] [CrossRef] [Green Version]
- Muller, P.A.; Vousden, K.H. Mutant p53 in cancer: New functions and therapeutic opportunities. Cancer Cell 2014, 25, 304–317. [Google Scholar] [CrossRef] [PubMed] [Green Version]
- Sabapathy, K.; Lane, D.P. Therapeutic targeting of p53: All mutants are equal, but some mutants are more equal than others. Nat. Rev. Clin. Oncol. 2018, 15, 13–30. [Google Scholar] [CrossRef]
- Bieging, K.T.; Mello, S.S.; Attardi, L.D. Unravelling mechanisms of p53-mediated tumour suppression. Nat. Rev. Cancer 2014, 14, 359–370. [Google Scholar] [CrossRef] [Green Version]
- Montalban-Bravo, G.; Kanagal-Shamanna, R.; Benton, C.B.; Class, C.A.; Chien, K.S.; Sasaki, K.; Naqvi, K.; Alvarado, Y.; Kadia, T.M.; Ravandi, F.; et al. Genomic context and TP53 allele frequency define clinical outcomes in TP53-mutated myelodysplastic syndromes. Blood Adv. 2020, 4, 482–495. [Google Scholar] [CrossRef] [PubMed] [Green Version]
- Bernard, E.; Nannya, Y.; Hasserjian, R.P.; Devlin, S.M.; Tuechler, H.; Medina-Martinez, J.S.; Yoshizato, T.; Shiozawa, Y.; Saiki, R.; Malcovati, L.; et al. Implications of TP53 allelic state for genome stability, clinical presentation and outcomes in myelodysplastic syndromes. Nat. Med. 2020, 26, 1549–1556. [Google Scholar] [CrossRef]
- Wang, W.; Routbort, M.J.; Tang, Z.; Ok, C.Y.; Patel, K.P.; Daver, N.; Garcia-Manero, G.; Medeiros, L.J.; Wang, S.A. Characterization of TP53 mutations in low-grade myelodysplastic syndromes and myelodysplastic syndromes with a non-complex karyotype. Eur. J. Haematol. 2017, 99, 536–543. [Google Scholar] [CrossRef] [PubMed]
- Goel, S.; Hall, J.; Pradhan, K.; Hirsch, C.; Przychodzen, B.; Shastri, A.; Mantzaris, I.; Janakiram, M.; Battini, R.; Kornblum, N.; et al. High prevalence and allele burden-independent prognostic importance of p53 mutations in an inner-city MDS/AML cohort. Leukemia 2016, 30, 1793–1795. [Google Scholar] [CrossRef] [PubMed]
- Ok, C.Y.; Patel, K.P.; Garcia-Manero, G.; Routbort, M.J.; Peng, J.; Tang, G.; Goswami, M.; Young, K.H.; Singh, R.; Medeiros, L.J.; et al. TP53 mutation characteristics in therapy-related myelodysplastic syndromes and acute myeloid leukemia is similar to de novo diseases. J. Hematol. Oncol. 2015, 8, 45. [Google Scholar] [CrossRef] [PubMed] [Green Version]

| Clinical Characteristics | n (%) |
|---|---|
| Age (Median), Year | |
| Median | 73 |
| Range | 24–91 |
| Gender | |
| Male | 72 (67) |
| Female | 35 (33) |
| MDS Type | |
| de novo MDS | 57 (53) |
| Therapy-related MDS | 50 (47) |
| Time from MDS Diagnosis to TP53 Testing, Month | |
| Median | 0.3 |
| Range | 0–41.2 |
| WHO subtypes (including Therapy-Related MDS) | |
| MDS-SLD | 1 (0.9) |
| MDS-MLD | 56 (52) |
| MDS-RS-MLD | 4 (3.7) |
| MDS with isolated del5q | 2 (1.9) |
| MDS-EB-1 | 26 (24) |
| MDS-EB-2 | 18 (17) |
| IPSS-R | |
| Very High | 62 (60) |
| High | 23 (22) |
| Intermediate | 11 (11) |
| Low | 5 (4.8) |
| Very Low | 3 (2.9) |
| Unknown (due to lack of cytogenetic data) | 3 (NA) |
| IPSS-R Cytogenetic Risk Groups | |
| Very good | 0 (0) |
| Good | 11 (11) |
| Intermediate | 2 (1.9) |
| Poor | 12 (12) |
| Very poor | 79 (76) |
| Unknown (due to lack of cytogenetic data) | 3 (NA) |
| CBC | |
| Hemoglobin, g/dL | |
| Median | 8.7 |
| Range | 4.0–14.2 |
| Platelets, ×109/L | |
| Median | 60 |
| Range | 1–422 |
| ANC, ×109/L | |
| Median | 1.14 |
| Range | 0.01–8.63 |
| Blast %, Bone Marrow Differential Count | |
| Median | 6 |
| Range | 0–18 |
| Variables | Range | Median | |
|---|---|---|---|
| PHANTM combined phenotype score | −0.559 to 1.78 | 1.00 | |
| Number of TP53 mutations | |||
| 1 (n = 86) | 2 (n = 21) | p value * | |
| PHANTM combined phenotype score (Median, (IQR)) | 1.00 (0.81, 1.22) | 1.07 (0.99, 1.31) | 0.3 |
| PHANTM combined phenotype score | |||
| −0.559 to 1 | 45 (52%) | 9 (43%) | 0.4 |
| 1< to 1.78 | 41 (48%) | 12 (57%) | |
| Number of co-mutations | |||
| 0 (n = 60) | 1+ (n = 47) | p value * | |
| PHANTM combined phenotype score (Median, (IQR)) | 1.00 (0.90, 1.22) | 1.04 (0.79, 1.33) | >0.9 |
| PHANTM combined phenotype score | |||
| −0.559 to 1 | 31 (52%) | 23 (49%) | 0.8 |
| 1< to 1.78 | 29 (48%) | 24 (51%) | |
| Clinical and Mutational Characteristics | n | Median Survival (Months) | 95% CI * | p Value |
|---|---|---|---|---|
| Overall survival, all patients | 107 | 14.84 | 11.09–19.51 | NA |
| Diagnosis | ||||
| De novo MDS | 57 | 15.07 | 10.79–23.49 | 0.674 |
| Therapy-related MDS | 50 | 10.59 | 8.06–16.51 | |
| MDS-excess blasts | 44 | 15.56 | 10.59–21.35 | 0.806 |
| MDS-other | 63 | 11.09 | 6.58–15.33 | |
| IPSS-R | ||||
| Very High, High | 85 | 12.76 | 9.77–16.32 | 0.004 |
| Intermediate, Low, Very Low | 19 | 32.93 | 15.33–NA | |
| IPSS-R Cytogenetic risk groups | ||||
| Good, Intermediate | 13 | 23.52 | 12.76–NA | 0.140 |
| Poor, Very Poor | 91 | 13.03 | 10.1–16.38 | |
| Hemoglobin level (g/dL) | ||||
| <10 | 74 | 12.17 | 7.66–16.38 | 0.036 |
| ≥10 | 32 | 15.92 | 11.09–35.1 | |
| Platelet count (×109/L) | ||||
| <100 | 80 | 13.03 | 10.1–19.44 | 0.149 |
| ≥100 | 26 | 13.32 | 9.77–NA | |
| Absolute neutrophil count (×109/L) | ||||
| <0.8 | 39 | 10.10 | 5.89–15.56 | 0.002 |
| ≥0.8 | 67 | 15.33 | 12.96–22.6 | |
| Number of TP53 mutations | ||||
| 1 | 86 | 14.31 | 10.59–20 | 0.094 |
| 2 | 21 | 8.16 | 5.89 -19.61 | |
| TP53 VAF | ||||
| <0.2 | 31 | 9.77 | 6.74–20.39 | 0.858 |
| 0.2–0.5 | 42 | 13.03 | 10.1–21.41 | |
| >0.5 | 31 | 16.32 | 10.23–23.49 | |
| Number of co-mutations | ||||
| 0 | 60 | 9.38 | 6.71–15.92 | 0.037 |
| ≥1 | 47 | 15.33 | 12.76–25.66 | |
| TP53 mutation and 17p loss | ||||
| 1 TP53 mutation and no loss of 17p | 50 | 16.38 | 12.17–25.66 | 0.07 |
| 1 TP53 mutation and loss of 17p | 33 | 12.76 | 9.38–21.35 | |
| 2 TP53 mutations | 21 | 8.16 | 5.89–19.61 | |
| PHANTM combined phenotype score | ||||
| −0.559 to 1 | 54 | 16.51 | 12.27–23.52 | 0.025 |
| >1 to 1.778 | 53 | 10.59 | 8.98–15.33 | |
| Analysis as a continuous variable | HR | 95% CI * | p value | |
| PHANTM phenotype score | 107 | 1.77 | 1.04–3.01 | 0.035 |
| TP53 VAF | 104 | 0.99 | 0.91–1.08 | 0.817 |
| Variables | HR * | 95% CI # | p Value |
|---|---|---|---|
| IPSS-R | |||
| Very High, High | ─ | ─ | |
| Intermediate, Low, Very Low | 0.42 | 0.19–0.91 | 0.028 |
| Number of TP53 mutations | |||
| 1 | ─ | ─ | |
| 2 | 1.84 | 1.04–3.25 | 0.037 |
| Number of co-mutations | |||
| 0 | ─ | ─ | |
| 1+ | 0.70 | 0.43–1.14 | 0.2 |
| Loss of 17p | |||
| No | ─ | ─ | |
| Yes | 0.97 | 0.59–1.58 | 0.9 |
| PHANTM combined phenotype score (Binary analysis) | |||
| −0.559 to 1 | ─ | ─ | |
| >1 to 1.778 | 1.62 | 1.01–2.58 | 0.044 |
| HR * | 95% CI # | p value | |
| IPSS-R | |||
| Very High, High | ─ | ─ | |
| Intermediate, Low, Very Low | 0.40 | 0.18–0.88 | 0.023 |
| Number of TP53 mutations | |||
| 1 | ─ | ─ | |
| 2 | 1.80 | 1.01–3.20 | 0.045 |
| Number of co-mutations | |||
| 0 | ─ | ─ | |
| 1+ | 0.74 | 0.45–1.21 | 0.2 |
| Loss of 17p | |||
| No | ─ | ─ | |
| Yes | 0.97 | 0.59–1.59 | >0.9 |
| PHANTM combined phenotype score (continuous analysis) | 1.53 | 0.87–2.71 | 0.14 |
Publisher’s Note: MDPI stays neutral with regard to jurisdictional claims in published maps and institutional affiliations. |
© 2021 by the authors. Licensee MDPI, Basel, Switzerland. This article is an open access article distributed under the terms and conditions of the Creative Commons Attribution (CC BY) license (https://creativecommons.org/licenses/by/4.0/).
Share and Cite
Yabe, M.; Omarbekova, A.Z.; Hsu, M.; May, H.; Arcila, M.E.; Liu, Y.; Dogan, A.; Brunner, A.M.; Nardi, V.; Hasserjian, R.P.; et al. TP53 Combined Phenotype Score Is Associated with the Clinical Outcome of TP53-Mutated Myelodysplastic Syndromes. Cancers 2021, 13, 5502. https://doi.org/10.3390/cancers13215502
Yabe M, Omarbekova AZ, Hsu M, May H, Arcila ME, Liu Y, Dogan A, Brunner AM, Nardi V, Hasserjian RP, et al. TP53 Combined Phenotype Score Is Associated with the Clinical Outcome of TP53-Mutated Myelodysplastic Syndromes. Cancers. 2021; 13(21):5502. https://doi.org/10.3390/cancers13215502
Chicago/Turabian StyleYabe, Mariko, Aidana Z. Omarbekova, Meier Hsu, Hannah May, Maria E. Arcila, Ying Liu, Ahmet Dogan, Andrew M. Brunner, Valentina Nardi, Robert P. Hasserjian, and et al. 2021. "TP53 Combined Phenotype Score Is Associated with the Clinical Outcome of TP53-Mutated Myelodysplastic Syndromes" Cancers 13, no. 21: 5502. https://doi.org/10.3390/cancers13215502
APA StyleYabe, M., Omarbekova, A. Z., Hsu, M., May, H., Arcila, M. E., Liu, Y., Dogan, A., Brunner, A. M., Nardi, V., Hasserjian, R. P., & Klimek, V. M. (2021). TP53 Combined Phenotype Score Is Associated with the Clinical Outcome of TP53-Mutated Myelodysplastic Syndromes. Cancers, 13(21), 5502. https://doi.org/10.3390/cancers13215502