Article

TP53 Mutation Is a Prognostic Factor in Lower Grade Glioma and May Influence Chemotherapy Efficacy

1
Cure Brain Cancer Biomarkers and Translational Research Group, Prince of Wales Clinical School, University of New South Wales, Sydney, NSW 2031, Australia
2
Adult Cancer Program, Lowy Cancer Research Centre, UNSW Sydney, Randwick, NSW 2031, Australia
3
Stats Central, Mark Wainwright Analytical Centre, University of New South Wales, Sydney, NSW 2031, Australia
4
Translational Cancer Metabolism Laboratory, School of Medical Sciences, Prince of Wales Clinical School, UNSW Sydney, Sydney, NSW 2031, Australia
5
School of Women’s & Children’s Health, UNSW Medicine, University of NSW, Randwick, NSW 2031, Australia
6
Children’s Cancer Institute, Lowy Cancer Research Centre, UNSW Sydney, Randwick, NSW 2031, Australia
*
Author to whom correspondence should be addressed.
Cancers 2021, 13(21), 5362; https://doi.org/10.3390/cancers13215362
Submission received: 9 September 2021 / Revised: 17 October 2021 / Accepted: 22 October 2021 / Published: 26 October 2021

Abstract

:

Simple Summary

Molecular biomarkers are utilised for the development of targeted therapy and diagnostic or prognostic tools and in strategising therapeutic approaches as they may have an effect in drug response. In lower-grade glioma (LGG), there are currently no established biomarkers that are associated with chemosensitivity. Here, we identified tumour protein 53 (TP53) hotspot mutations in TP53 codon 273 in 33% (17/51) of astrocytoma tissues and retrospectively found that these tumours were associated with significantly improved clinical outcomes when treated with chemotherapy. We used publicly available datasets to successfully confirm these findings. A potential mechanism of this chemosensitivity was explored in this study. TP53 codon 273 mutations can, thus, potentially be an indicator of chemotherapeutic efficacy in astrocytoma, and it may be useful in making astrocytoma treatment decisions.

Abstract

Background: Identification of prognostic biomarkers in cancers is a crucial step to improve overall survival (OS). Although mutations in tumour protein 53 (TP53) is prevalent in astrocytoma, the prognostic effects of TP53 mutation are unclear. Methods: In this retrospective study, we sequenced TP53 exons 1 to 10 in a cohort of 102 lower-grade glioma (LGG) subtypes and determined the prognostic effects of TP53 mutation in astrocytoma and oligodendroglioma. Publicly available datasets were analysed to confirm the findings. Results: In astrocytoma, mutations in TP53 codon 273 were associated with a significantly increased OS compared to the TP53 wild-type (HR (95% CI): 0.169 (0.036–0.766), p = 0.021). Public datasets confirmed these findings. TP53 codon 273 mutant astrocytomas were significantly more chemosensitive than TP53 wild-type astrocytomas (HR (95% CI): 0.344 (0.13–0.88), p = 0.0148). Post-chemotherapy, a significant correlation between TP53 and YAP1 mRNA was found (p = 0.01). In O (6)-methylguanine methyltransferase (MGMT) unmethylated chemotherapy-treated astrocytoma, both TP53 codon 273 and YAP1 mRNA were significant prognostic markers. In oligodendroglioma, TP53 mutations were associated with significantly decreased OS. Conclusions: Based on these findings, we propose that certain TP53 mutant astrocytomas are chemosensitive through the involvement of YAP1, and we outline a potential mechanism. Thus, TP53 mutations may be key drivers of astrocytoma therapeutic efficacy and influence survival outcomes.

1. Introduction

Lower-grade gliomas (LGGs) are cancers of the central nervous system (CNS) that affect younger adults aged between 17 and 44 years, with the median overall survival (OS) ranging from 7 to 13 years [1]. The OS is relatively longer than other gliomas such as glioblastoma; however, since much younger adults are affected in LGG, and their lifespan is significantly cut short, LGG is a devastating disease. LGGs account for 19% of all gliomas [2] and consist of two main histologic subtypes—astrocytoma and oligodendroglioma. Efforts to identify an effective therapy for LGG persist; however, there have been no substantial improvements in the OS in the past 30 years [3]. Moreover, the current treatment strategy—surgery, chemotherapy and/or radiation [4]—can also negatively affect cognitive abilities and, hence, the quality of life of LGG patients [5].
Since the discovery of mutations in isocitrate dehydrogenase enzyme isoform 1/2 (IDH1/2) and their prognostic relevance to LGG [6], IDH1/2 inhibitors are currently being explored as a therapeutic option [7,8,9,10,11]. However, the discovery of additional prognostic markers may also assist in the development of effective drugs and to accurately analyse on-going (and retrospective) clinical trials to better understand responders and non-responders. Therefore, we set out to understand the prognostic effects and mechanisms of commonly occurring genetic alterations in LGG.
Molecular studies have confirmed the distinct genetic profiles of astrocytoma and oligodendroglioma, clearly indicating distinct pathways of gliomagenesis for these sub-types [12]. In recent years, since the discovery of IDH1/2 mutation prevalence and its prognostic role in LGG, glioma classification has moved from histopathological features towards molecular characteristics [13]. This diagnostic shift has introduced further molecular sub-groups within astrocytoma and oligodendroglioma, which are useful in survival and drug response analyses of LGG in clinical trials. These molecular advancements also shed light on the spectrum of mechanisms utilised by these molecular sub-types and stress the need for targeted therapy. For instance, 1p/19q co-deletion is almost exclusively present in oligodendroglioma, while tumour protein 53 (TP53) mutation is prevalent in astrocytoma.
TP53 is a tumour suppressor gene located in chromosome 17p13.1 that encodes the p53 protein [14]. The gene is involved in a number of crucial cellular processes such as cell cycle arrest, differentiation, apoptosis and DNA damage repair, thereby protecting the cell from tumourigenesis [15]. TP53 mutations occur in 50% of all human cancers, rendering it the most common genetic alteration in cancer. Mutant p53 protein accumulates in the nucleus, with a longer half-life compared to WT p53, and the mutant protein interacts with oncoproteins, inducing tumourigenesis [16]. TP53 mutation in LGG is an early event [17] occurring after IDH1 mutation [18]. The TP53 mutation rate in astrocytoma has been reported to be 50–75%, while in oligodendrogliomas, it is 10–34% [19,20]. TP53 expression increases with increasing grades of oligodendroglioma [21]. However, no significant increase in p53 expression between increasing grades of astrocytoma has been reported [22,23]. The involvement of TP53 in gliomagenesis may, thus, vary between the subtypes of LGG.
Despite the prevalence of TP53 mutations in LGGs, their prognostic effects remain unclear. Prognostic effects of TP53 mutations have been studied extensively; however, no concordance between the outcomes of individual studies was observed [19,24,25,26,27,28], possibly because the histological subtypes associated with different OS were combined as one cohort of either LGG or glioma, particularly in survival studies, which led to discordant results. Recent advancements in molecular classification and the availability of online cancer databases, which can be used to cross-check mutations to include only reported ‘pathogenic’ mutations, provide new opportunities to better determine the survival effects of TP53 mutation in LGG.
In this paper, we investigate the prognostic effects of pathogenic TP53 mutations in LGG and attempt to understand their mechanism of action. In order to determine the prognostic role of TP53, we have analysed a large cohort of LGG and designed our study to (i) perform separate survival analysis for astrocytoma and oligodendroglioma; (ii) include only ‘pathogenic’ TP53 mutations in the survival analysis, cross-checked with COSMIC and NCBI databases; (iii) correlate TP53 mutation with other molecular features; (iv) propose a mechanism of the prognostic effects based on TP53 mutation status; and (v) understand the prognostic mechanism using available LGG datasets.

2. Materials and Methods

2.1. Tumour Sample Collection and Patient Population

A retrospective cohort of 102 LGG fresh frozen tumour specimens was obtained from the Steve and Lynette Waugh Brain Tumour Biobank, Lowy Cancer Research Centre, University of New South Wales. The patients in the cohort had undergone surgery between 2010 and 2018. The tumour inclusion criteria for the study were: (i) patients above the age of 18; (ii) diagnosed for grade II or grade III astrocytoma or oligodendroglioma; and (iii) patients who have signed an informed consent form for research use of the tumour samples. Approval from the University of New South Wales Ethics Committee was received for this study (Ethics Approval no. HC190501).

2.2. Clinical Data Collection

Clinical data of all patients were obtained from the Steve and Lynette Waugh Brain Tumour Biobank database. Clinical data included age at initial diagnosis, gender, dates of first and subsequent resections, types and dates of adjuvant therapies, extent of resection, OS duration and status of the patients, and progression-free survival (PFS) information. Tumour genetic information such as p53 expression, 1p/19q co-deletion status and alpha thalassemia/mental retardation syndrome x-linked (ATRX) status were obtained from available patient pathology reports. We also obtained proliferation index Ki67% information from pathology reports. The reports were reviewed systematically for the required information. Not all patients were tested for the same genetic variations. Clinical pathology reports of the majority of LGG patients include immunohistochemistry (IHC) staining for p53 expression (n = 62). Similarly, 1p/19q co-deletion is a commonly ordered LGG test in pathology and the data were available in the pathology reports for 49 LGG patients.

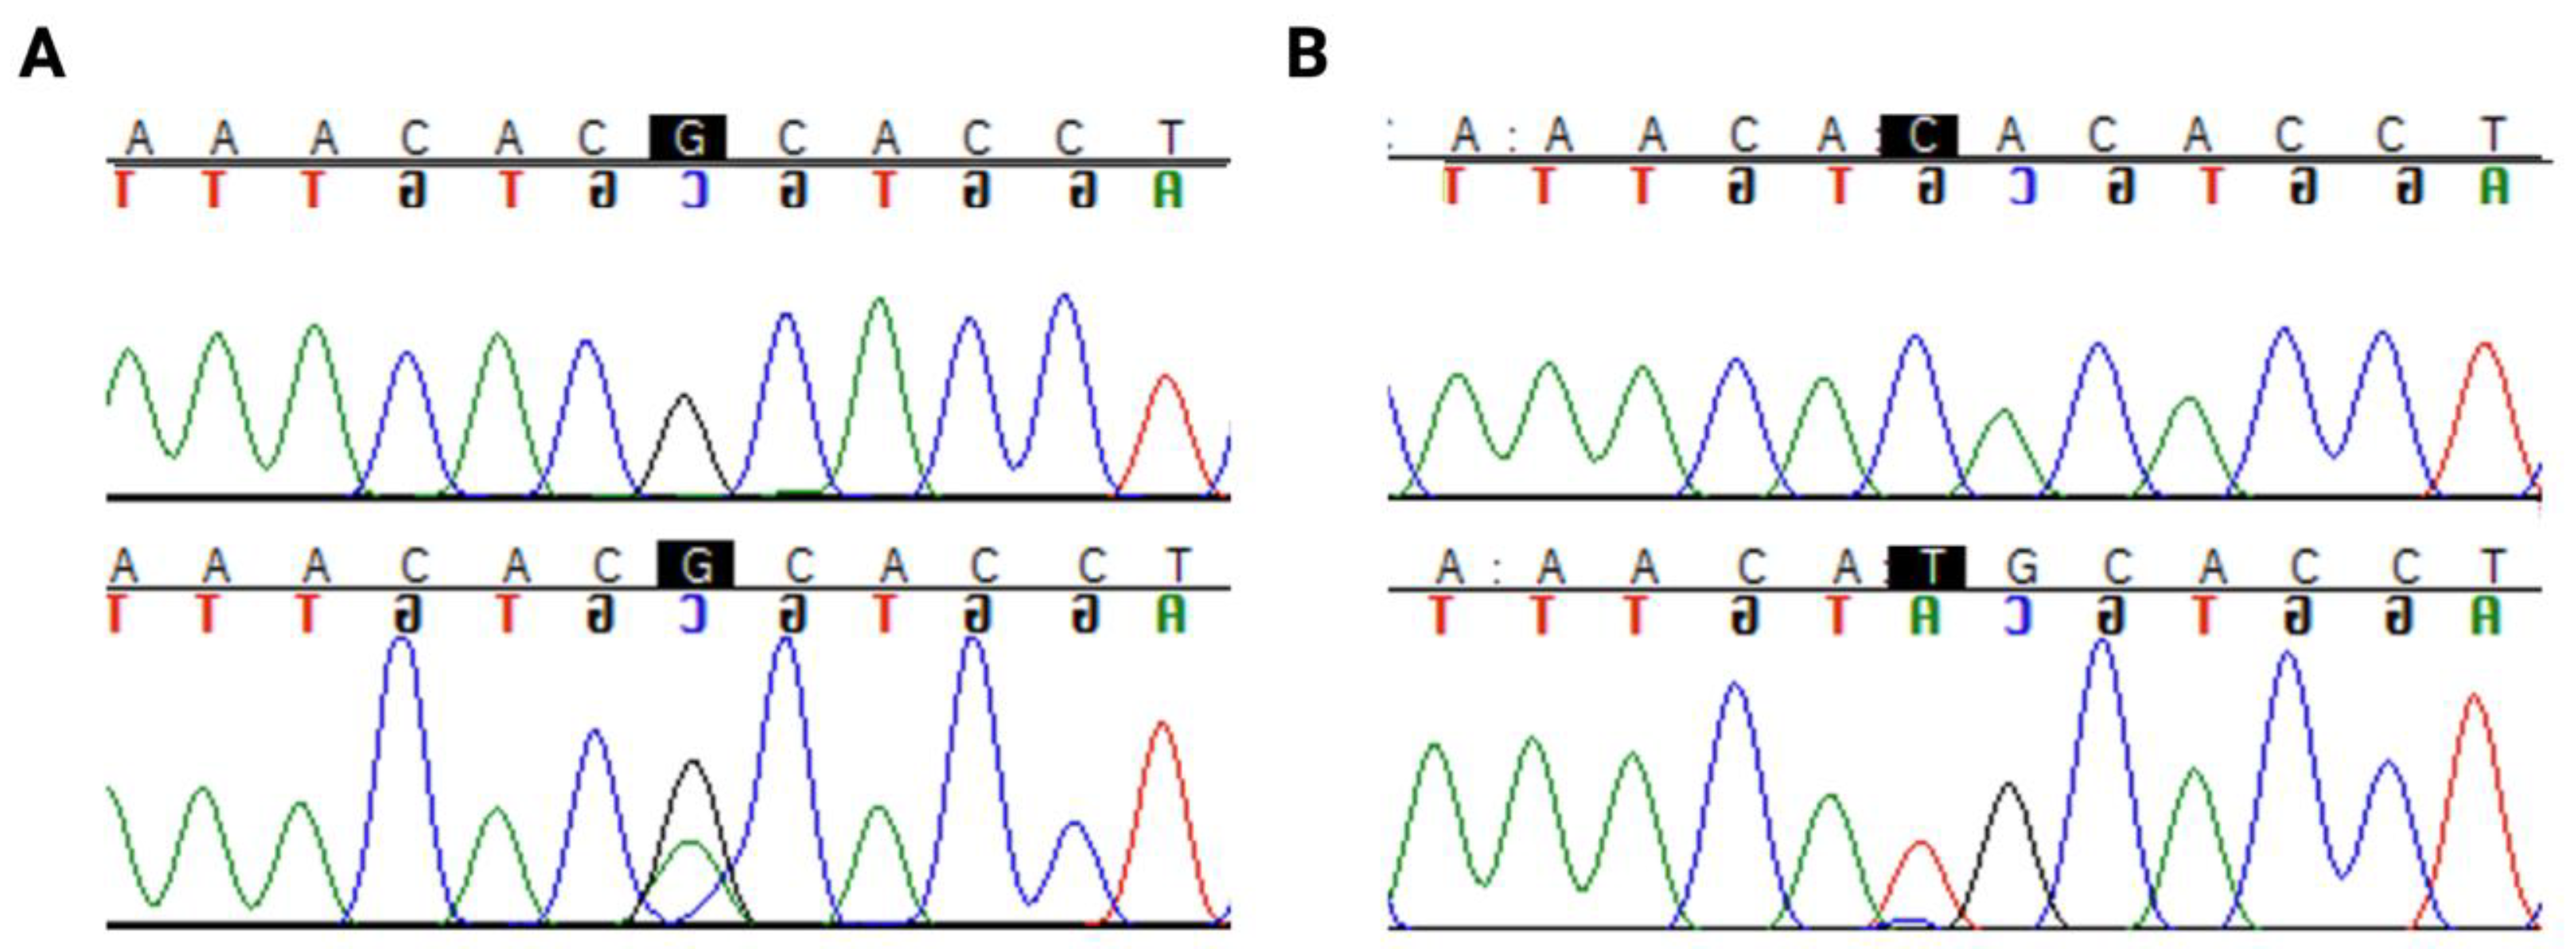
2.3. TP53 Sequencing

DNA from fresh frozen tissue samples was extracted using the DNEasy Blood and Tissue Kit (Qiagen), according to the manufacturer’s protocol. A polymerase chain reaction (PCR) was then performed for 10 exons of TP53 using the forward and reverse primer sequences outlined in Supplementary File 1: Table S1. KapaTaq HiFi ReadyMix (High-fidelity) DNA polymerase was used for the reaction. PCR was performed under the following conditions: initial denaturation at 95 °C for 3 min, denaturation at 95 °C for 30 s, annealing at the temperature corresponding to the particular exon (Supplementary File 1: Table S1) for 30 s, followed by extension at 72 °C for 1 min. The PCR reaction was performed for 34 cycles. Agarose gel electrophoresis was used to visualise and confirm the success of the PCR reaction, and each PCR product was subsequently sent to the Australian Genome Research Facility (AGRF) for purification and Sanger sequencing. This method has 99.9% accuracy, and it is the gold standard for clinical research sequencing [29]. Sequencing was performed on both the forward and reverse strands of each exon in each sample. The sequencing files (.ab1 format) were analysed with the software Sequencher (version 5.4.6) to identify whether any mutations were present. The reference sequence used for TP53 mutation analysis was NP_000537.3.

2.4. IDH1 Sequencing

PCR was performed to amplify the commonly mutated target region of IDH1, consisting of codon 132. The primer sequences were Forward—CGGTCTTCAGAGAAGCCATT and Reverse—GCAAAATCACATTATTGCCAAC. The PCR was performed under standard conditions: initial denaturation at 95 °C for 7 min, denaturation at 95 °C for 30 s, annealing at 54 °C for 30 s, followed by extension at 72 °C for 45 s. The PCR reaction was performed for 34 cycles. Agarose gel electrophoresis was used to visualise and confirm the success of the PCR reaction, and each PCR product was subsequently sent to the Australian Genome Research Facility (AGRF) for purification and Sanger sequencing. The sequencing files (.ab1) were analysed with the software Sequencher (version 5.4.6) to identify whether any mutations were present.

2.5. Determination of Pathogenic Mutations

The pathogenic status of the identified mutations was checked systematically. The mutation IDs for each of the TP53 mutations found were located using COSMIC (https://cancer.sanger.ac.uk/cosmic, accessed on 18 May 2019) and NCBI (https://www.ncbi.nlm.nih.gov/gene, accessed on 18 May 2019) databases. The COSMIC and NCBI information pages for each of the mutations state a pathogenic score, which was used to validate the pathogenicity of each mutation. Only mutations with a reported pathogenic score of >0.99 were considered “pathogenic” and used in further analysis. One exception to this was a novel TP53 mutation that was detected. The MutationTaster (http://www.mutationtaster.org/, accessed on 25 May 2019) platform was used to predict the pathogenicity of this novel mutation (occurring in a single oligodendroglioma patient).

2.6. Survival Analysis

OS was calculated from the date of histopathological diagnosis to the date of death, censored at the last follow-up. Time to first recurrence (considered as progression-free survival) was calculated from the date of first surgery to the date of the following surgery after radiological progression was confirmed. Patient vital status and date of last follow-up were last updated on 19 April 2019.

2.7. Survival Studies with Public Cancer Datasets

Survival analysis was performed on publicly available cancer datasets: The Cancer Genome Atlas (TCGA) [30], Memorial Sloan Kettering—IMPACT Clinical Sequencing Cohort (MSKCC) [31], and Chinese Glioma Genome Atlas (CGGA). cBioPortal (https://www.cbioportal.org/, accessed on 10 February 2021) was used to source mutation and clinical data for astrocytoma cases from TCGA and MSKCC datasets.
CGGA dataset was used due to their exclusive transcriptomics data availability for recurrent LGG tumours. Clinical and transcriptomic data (mRNAseq_693) [32,33] were downloaded directly from https://www.cgga.org.cn/ (accessed on 10 February 2021). All survival analysis was performed using IBM SPSS Statistics 26 software.

2.8. Determination of Prognostic Effects of Hippo Signalling Pathway Genes in TCGA Cancers and Their Correlation with TP53

Hippo Signalling pathway genes were selected for analysis from existing literature [34,35,36]. A log10 hazard ratio heatmap was used to visualise survival across TCGA cancers based on Hippo Signalling pathway gene expression, which was created using the survival function on GEPIA2 (http://gepia.cancer-pku.cn/, accessed on 21 February 2021). The correlation between Yes-associated Protein 1 (YAP1) and TP53 mRNA across TCGA cancer types was analysed using the correlation function on GEPIA2 (http://gepia.cancer-pku.cn/, accessed on 21 February 2021). The distribution of Hippo Signalling pathway gene expression among astrocytoma TP53 mutation statuses was visualised using heatmaps generated on cBioPortal (https://www.cbioportal.org/, accessed on 7 March 2021).

2.9. Differential Gene Expression, Gene Ontology and Pathway Analysis

Recurrent astrocytoma tumours treated with chemotherapy were selected from the CGGA dataset, and transcriptomics and clinical data were directly downloaded from the CGGA website. EdgeR was used for differentially expressed gene (DEG) analysis based on YAP1 high and YAP1 low groups. Genes with 1.5-fold upregulation or downregulation between YAP1 high/YAP1 low groups were considered differentially expressed. The cut off for YAP1 high/YAP1 low was set on the median expression mark, and a false discovery rate (FDR) <0.05 was considered significant. Enrichr [37] was used for gene ontology and KEGG pathway analysis. The analysis was conducted separately for upregulated and downregulated genes.

2.10. Protein–Protein Interaction Analysis

A search tool for the retrieval of interacting genes (STRING) (www.string-db.org, accessed on 9 March 2021) was used to determine protein–protein interaction (PPI). The significant DEG lists were submitted to the STRING website, and the PPIs were filtered to include only meaningful interactions that have been experimentally proven (total score > 0.4). This PPI network was saved and imported to Cytoscape [38], where module screening was performed with the molecular complex detection (MCODE) plugin [39] (scores > 3, nodes > 4). The top three PPI networks of modules were identified for each group.

2.11. Statistical Analysis

Survival probabilities (OS and PFS) were calculated using the Kaplan–Meier method, and a log-rank test was used to compare survival distributions (p < 0.05 considered significant). IBM SPSS Statistics (version 26) software was used to perform univariate survival analysis, and multivariate survival analysis with Cox proportional hazards model and a 2-sided p-value of less than 0.05 was considered statistically significant. Multivariate analysis was performed to adjust for prognostic effects of IDH1 mutation, age, sex and grade (also 1p/19q co-deletion for the TCGA oligodendroglioma dataset). GraphPad Prism 8.0 software was used to plot mRNA expression correlations, distribution of age and Ki67 and p53 expression across TP53 mutation status. Student’s t-test was used to determine significance.

3. Results

3.1. Tumour Cohort Characteristics

This study investigated a cohort of 102 LGG, including 51 astrocytomas (32 grade II and 19 grade III) and 51 oligodendrogliomas (26 grades II and 25 grade III). The median age of the cohort of patients was 36 ± 10 (Std), which is within the typical age range for LGG patients [39]. The gender ratio in our study population was 1.1 (53 females/49 males). The overall median survival of the astrocytoma cohort was 123 months; for the oligodendroglioma cohort, it was 159 months (Supplementary File 2: Figure S1). IDH1 mutation was present in 83% (85/102) of the tumours in the LGG cohort. Our results confirmed previous reports that the IDH1 R132H mutation is the most common form of IDH1 mutation in LGG as all of the cases were R132H mutants except two, which were both R132C mutants [6,40] (Table 1). LGG tumours most commonly occurred in the fronto-temporal region of the brain (64% cases), which is also in accordance with known literature [41]. All patients underwent gross total resection. Following surgery, the patients received adjuvant therapies including chemo-radiation therapy (27.5%), radiation therapy (10.8%) or chemotherapy (14.7%); however, 26.5% of patients did not receive adjuvant therapy after surgical resection (Table 1).

3.2. Population Survival Characteristics

The median OS of the cohort was 13.3 years (95% CI: 9.5–16.8 years) based on 38 deaths. The Kaplan–Meier curves in Supplementary File 2: Figure S1 shows the survival of patients based on their IDH1 mutation status, histological type, and TP53 mutation status (to be discussed in the following section). As expected from a typical LGG cohort, our cohort showed that IDH-mutant cases corresponded to a significantly increased OS (IDH1 WT vs. MUT median OS: 67.5 mo. vs. 168 mo.; HR (95% CI): 3.65 (1.33–10.00), p < 0.0001) (Supplementary File 2: Figure S1A). Additionally, expectedly, oligodendroglioma patients showed a significantly increased OS compared to astrocytoma patients (oligodendroglioma vs. astrocytoma median OS: 159 mo. vs. 123 mo.; HR (95% CI): 0.52 (0.27–0.98), p = 0.045) (Supplementary File 2: Figure S1B).

3.3. TP53 Mutation Types and Prevalence in LGG

TP53 exons 1–10 were sequenced in the cohort of LGG, and a mutational hotspot region of exons 4–8 was noted. However, the mutational hotspot region for ‘pathogenic’ TP53 mutation (as determined from COSMIC and NCBI pathogenic scores >0.99) was between exons 5 to 8. Table 2 reports 27 different mutations identified, which include missense, nonsense, silent and frameshift deletion mutations. A total of 21 out of the 27 mutations were reportedly ‘pathogenic’. There was no case where two pathogenic mutations were present in one tumour specimen. Considering only pathogenic TP53 mutations, 60% (31/51) of astrocytomas and 18% (9/50) of oligodendrogliomas were TP53 mutants (TP53 mutation status could not be determined in one oligodendroglioma tumour) (Table 3). The non-pathogenic rs1042522 polymorphism was present in 24 LGGs (Table 2).
Interestingly, a hotspot mutation region in codon 273 (Figure 1) was identified in 33% (17/51) of astrocytomas. Only 1 out of 50 oligodendrogliomas harboured a mutation in this codon. There were two pathogenic mutations in this hotspot region, R273C (c.817C>T) and R273H (c.818G>A), as shown in Figure 1.

3.4. Correlation of TP53 Mutation with Other Clinicopathological Features

We next compared the clinicopathological features of TP53 mutation status (Table 3). TP53 mutation status significantly varied between histological subtypes of LGG (p < 0.001). TP53 mutant patients were significantly younger than TP53 wild-type (WT) patients (34 vs. 38 years) (p = 0.046). IDH1 mutation status, p53 expression status (p > 10% is considered ‘high’) and 1p/19q co-deletion status were significantly different among TP53 mutant and TP53 WT groups (p = 0.009, p < 0.001 and p < 0.001, respectively). In TP53 mutant cases, there was higher expression of p53 protein, and 37/39 (94.8%) TP53 mutant cases were also IDH1 mutants. Previous reports showed that 1p/19q co-deletion was mutually exclusive to TP53 mutation [40]. However, 1p/19q co-deletion status was unknown for a number of patients in our cohort, and, hence, the mutual exclusivity cannot be verified in our study. Treatment received was significantly different among TP53 mutant and WT patients (p = 0.016); however, this cannot be concluded due to the high frequency of patients with unknown treatment types in these groups. There was no significant difference between the gender of TP53 mutant patients and WT patients (Table 3).

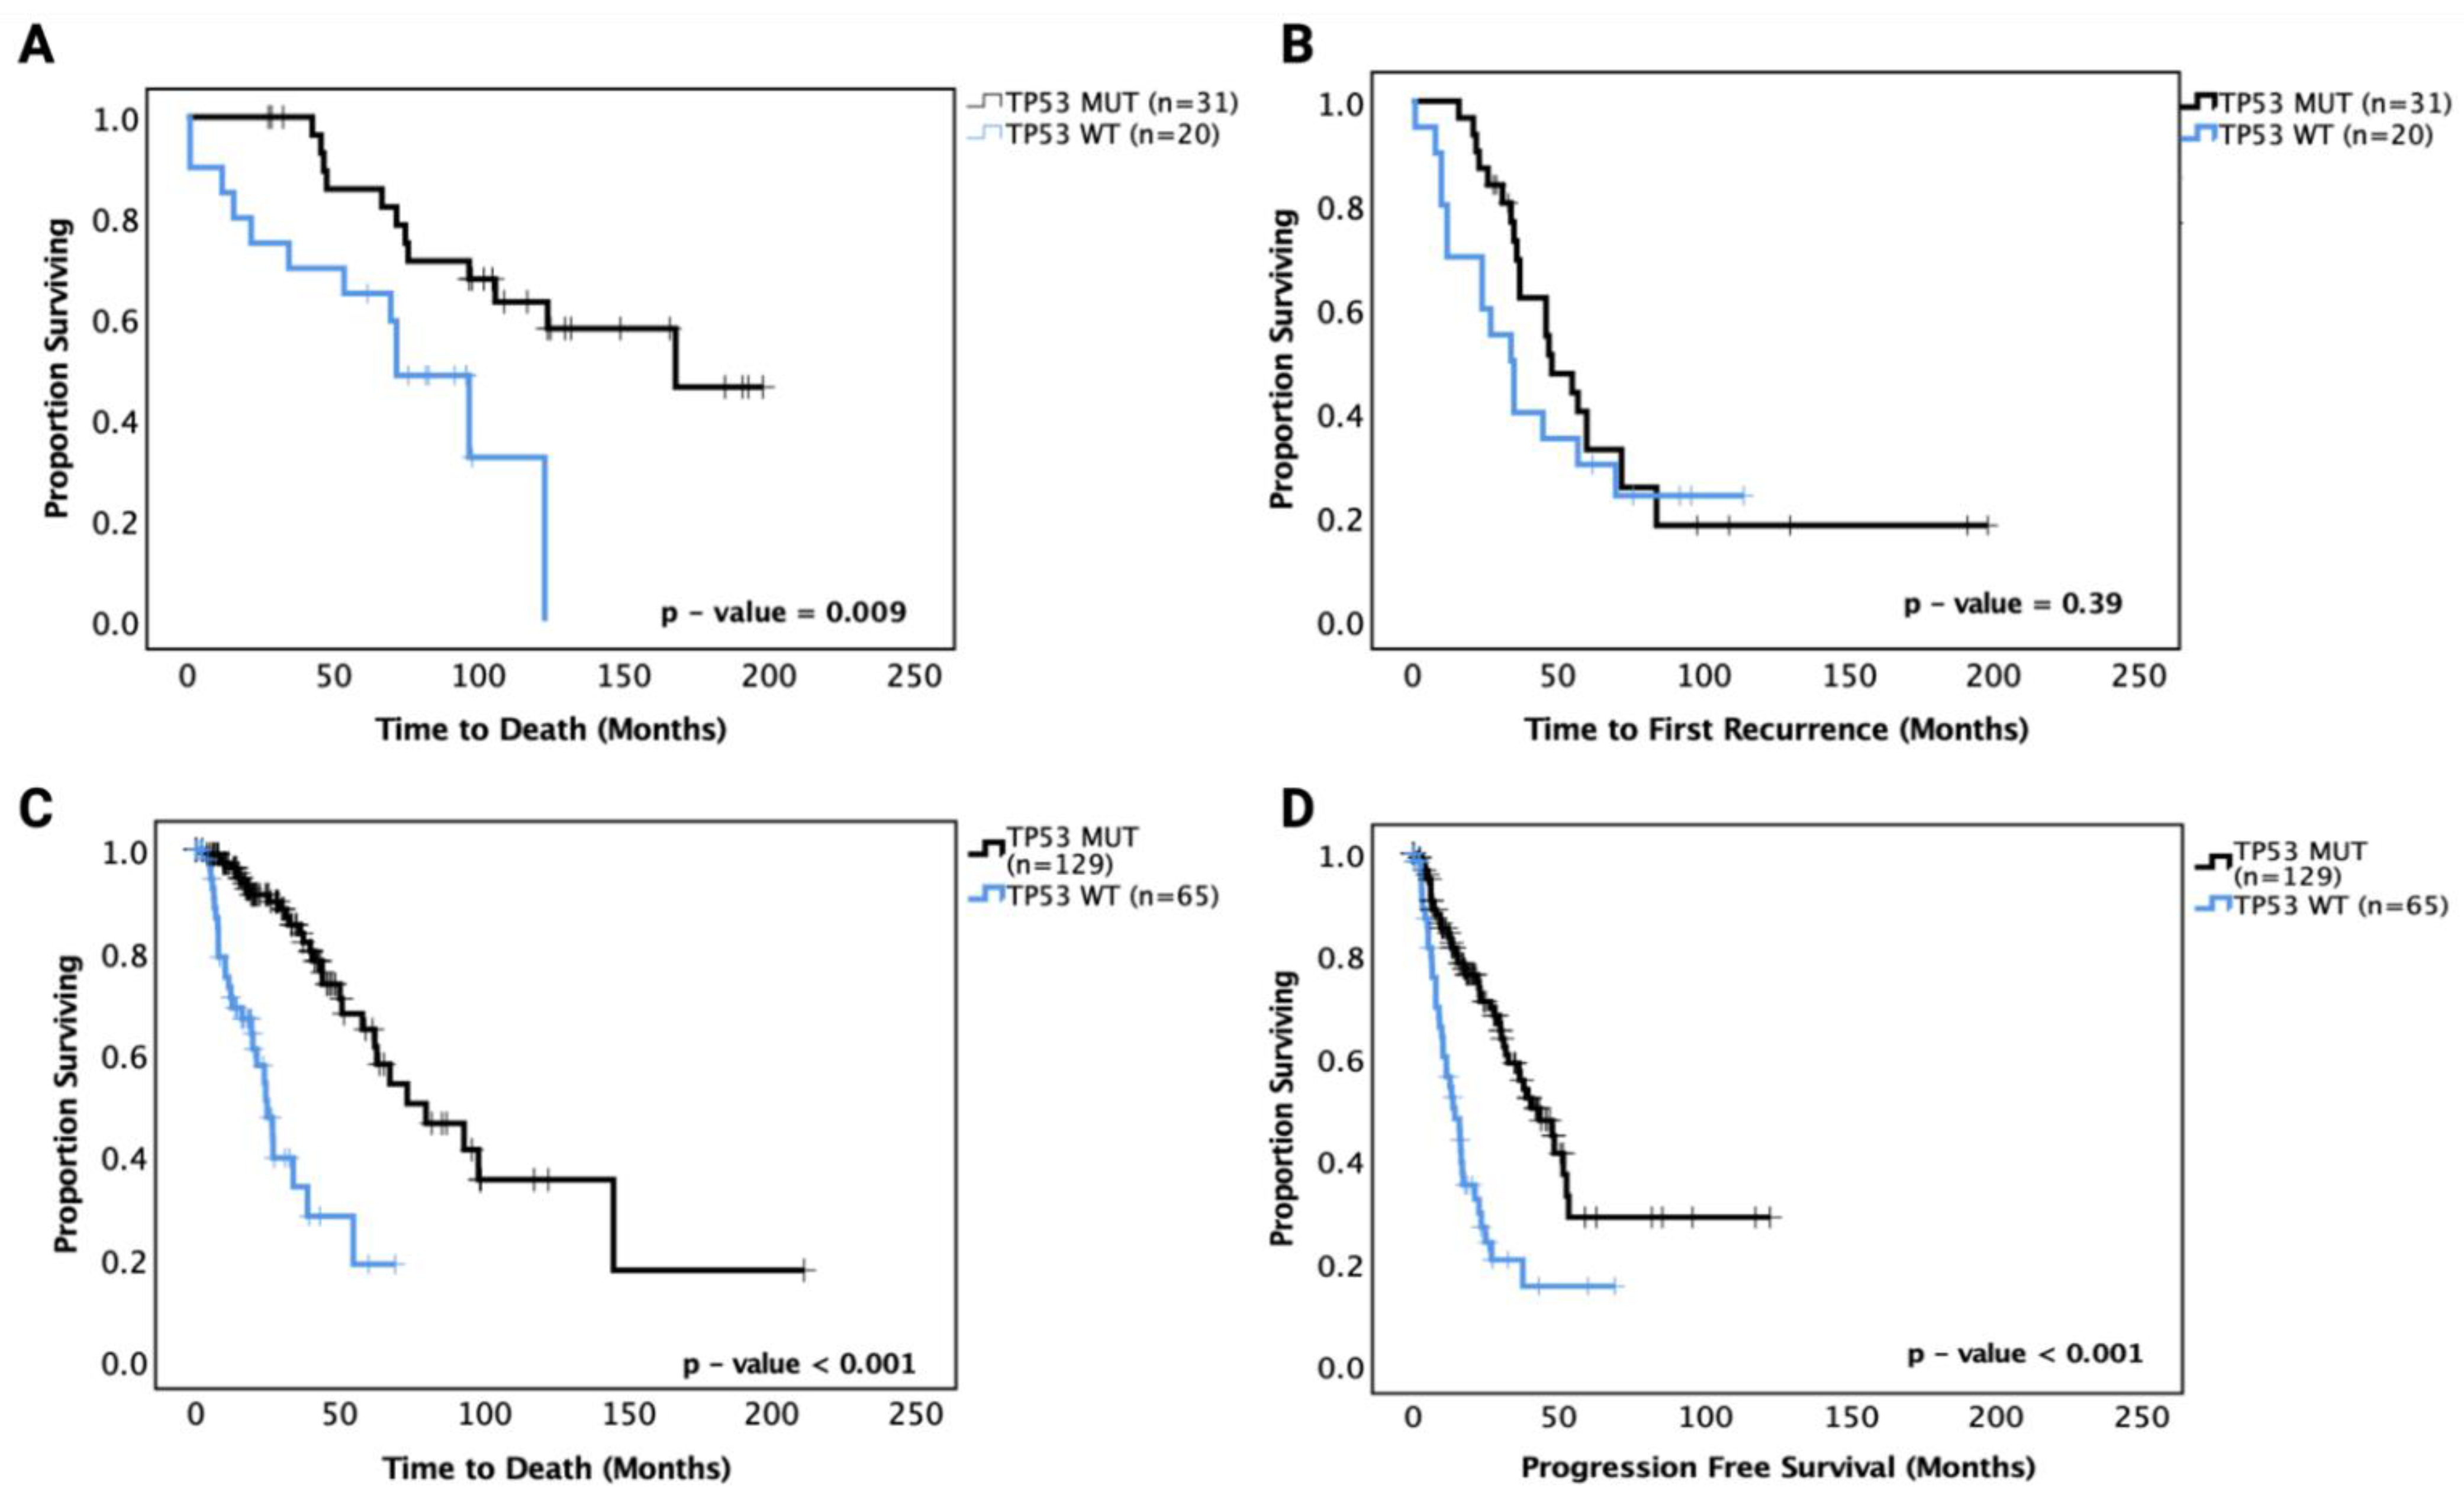
3.5. Prognostic Effects of TP53 Mutations in LGG

3.5.1. Prognostic Effects of TP53 Mutations in Astrocytoma

When the cohorts of astrocytoma and oligodendroglioma were combined as ‘LGG’, expectedly, because of the different OS of each of the subtypes, no significant prognostic effect of TP53 mutation was observed (p = 0.917) (Supplementary File 2: Figure S1C).
We then performed survival analysis on the astrocytoma and oligodendroglioma cohorts separately. In astrocytoma, ‘pathogenic’ TP53 mutant patients showed a significantly prolonged OS (median OS of TP53 MT 165 mo. vs. TP53 WT 70 mo., p = 0.009) compared to TP53 WT patients in univariate analysis (Figure 2A). In multivariate analysis adjusting for IDH1 mutation status, age, gender and grade, however, the effect was no longer significant (p = 0.091). PFS analysis showed no significant prognostic effect of TP53 mutation (p = 0.39) (Figure 2B). These data suggest that there may be a sub-group within the TP53 mutations responsible for the significantly improved survival in univariate analysis. The hazard ratios and 95% confidence intervals are detailed in Table 4 for the univariate and multivariate analyses.
The TCGA LGG dataset was used to confirm these prognostic effects. Grades II and III astrocytoma cases from the dataset were analysed for OS and PFS based on TP53 mutation status, and the results mirrored the OS findings from our cohort with TP53 mutant cases, showing significantly increased OS (median survival TP53 WT 30 months vs. TP53 MT 75 months, p < 0.001). Further, the TCGA LGG astrocytoma dataset showed significantly improved PFS for TP53 mutant cases (TP53 WT 18 months vs. TP53 MT 42 months, p < 0.001) (Figure 2C,D). It should be noted that the TP53 mutations in the TCGA dataset may include unknown numbers of non-pathogenic mutations that may affect the overall effect sizes. It should also be noted that the OS and PFS of the TCGA astrocytoma dataset were shorter than the OS and PFS of the current cohort, which may be because the TCGA dataset includes specimens with older dates of diagnosis and treatment strategies (1992 to 2013) than the current cohort (2010 to 2018).
Following the findings from combined TP53 pathogenic mutations, we next investigated the prognostic role of specific commonly occurring hotspot mutations in codon 273 (shown previously in Figure 1) to determine whether this sub-group was more prognostically relevant than the diverse combination of other TP53 mutations. Thus, the astrocytoma cohort was further divided into codon 273 mutants, TP53 other mutants (that include patients with all other pathogenic TP53 mutations) and TP53 WT categories. In univariate analysis, only codon 273 mutant cases corresponded to a significantly increased OS (50% survival mark not reached for codon 273 vs. TP53 WT 65 months, p = 0.011) and PFS (codon 273 65 months vs. TP53 WT 45 months, p = 0.029) (shown in Figure 3A,B) compared to TP53 WT, while ‘other’ combined pathogenic TP53 mutations were not a prognostic factor (p = 0.241 and p = 0.951). No significant difference was observed between other TP53 mutant and codon 273 mutant groups, suggesting that possibly other infrequent mutations that are prognostic factors may be present within the combined ‘other’ group, which remains to be characterised. In the multivariate analysis of PFS, TP53 codon 273 mutants were no longer a significant prognostic factor; however, multivariate analysis confirmed that TP53 mutation in codon 273 is an independent prognostic factor for OS in astrocytoma (HR (95% CI): 0.169 (0.036–0.766), p = 0.021) (Table 4).
In the MSKCC astrocytoma dataset, both ‘other’ TP53 and codon 273 mutant cases showed improved OS and PFS compared to WT, with the codon 273 mutant group showing the most improved OS and PFS among the three groups (Figure 3C,D) (OS: WT = 30 mo., other = 140 mo., codon 273 = 260 mo., p < 0.0001) (PFS: WT = 10 mo., other = 80 mo., codon 273 = 110 mo., p < 0.001).
In the TCGA cohort, both ‘other’ TP53 mutants and codon 273 mutants showed a significantly improved OS (WT: 25 mo., other: 75 mo., 273: not reached, p < 0.0001) and PFS (WT: 18 mo., other: 48 mo., 273: 48 mo., p < 0.001) compared to WT (Figure 3E,F).
Again, it should be noted here that in the TCGA dataset, all TP53 mutations were considered for analysis as it was not possible to determine ‘pathogenic’-only mutations. Hence, non-pathogenic TP53 mutations were inherently included in the analysis, which may have augmented the OS distribution of the ‘other’ TP53 mutant category. Table 5 summarises the hazard ratios and 95% confidence intervals for MSKCC and TCGA survival analysis.

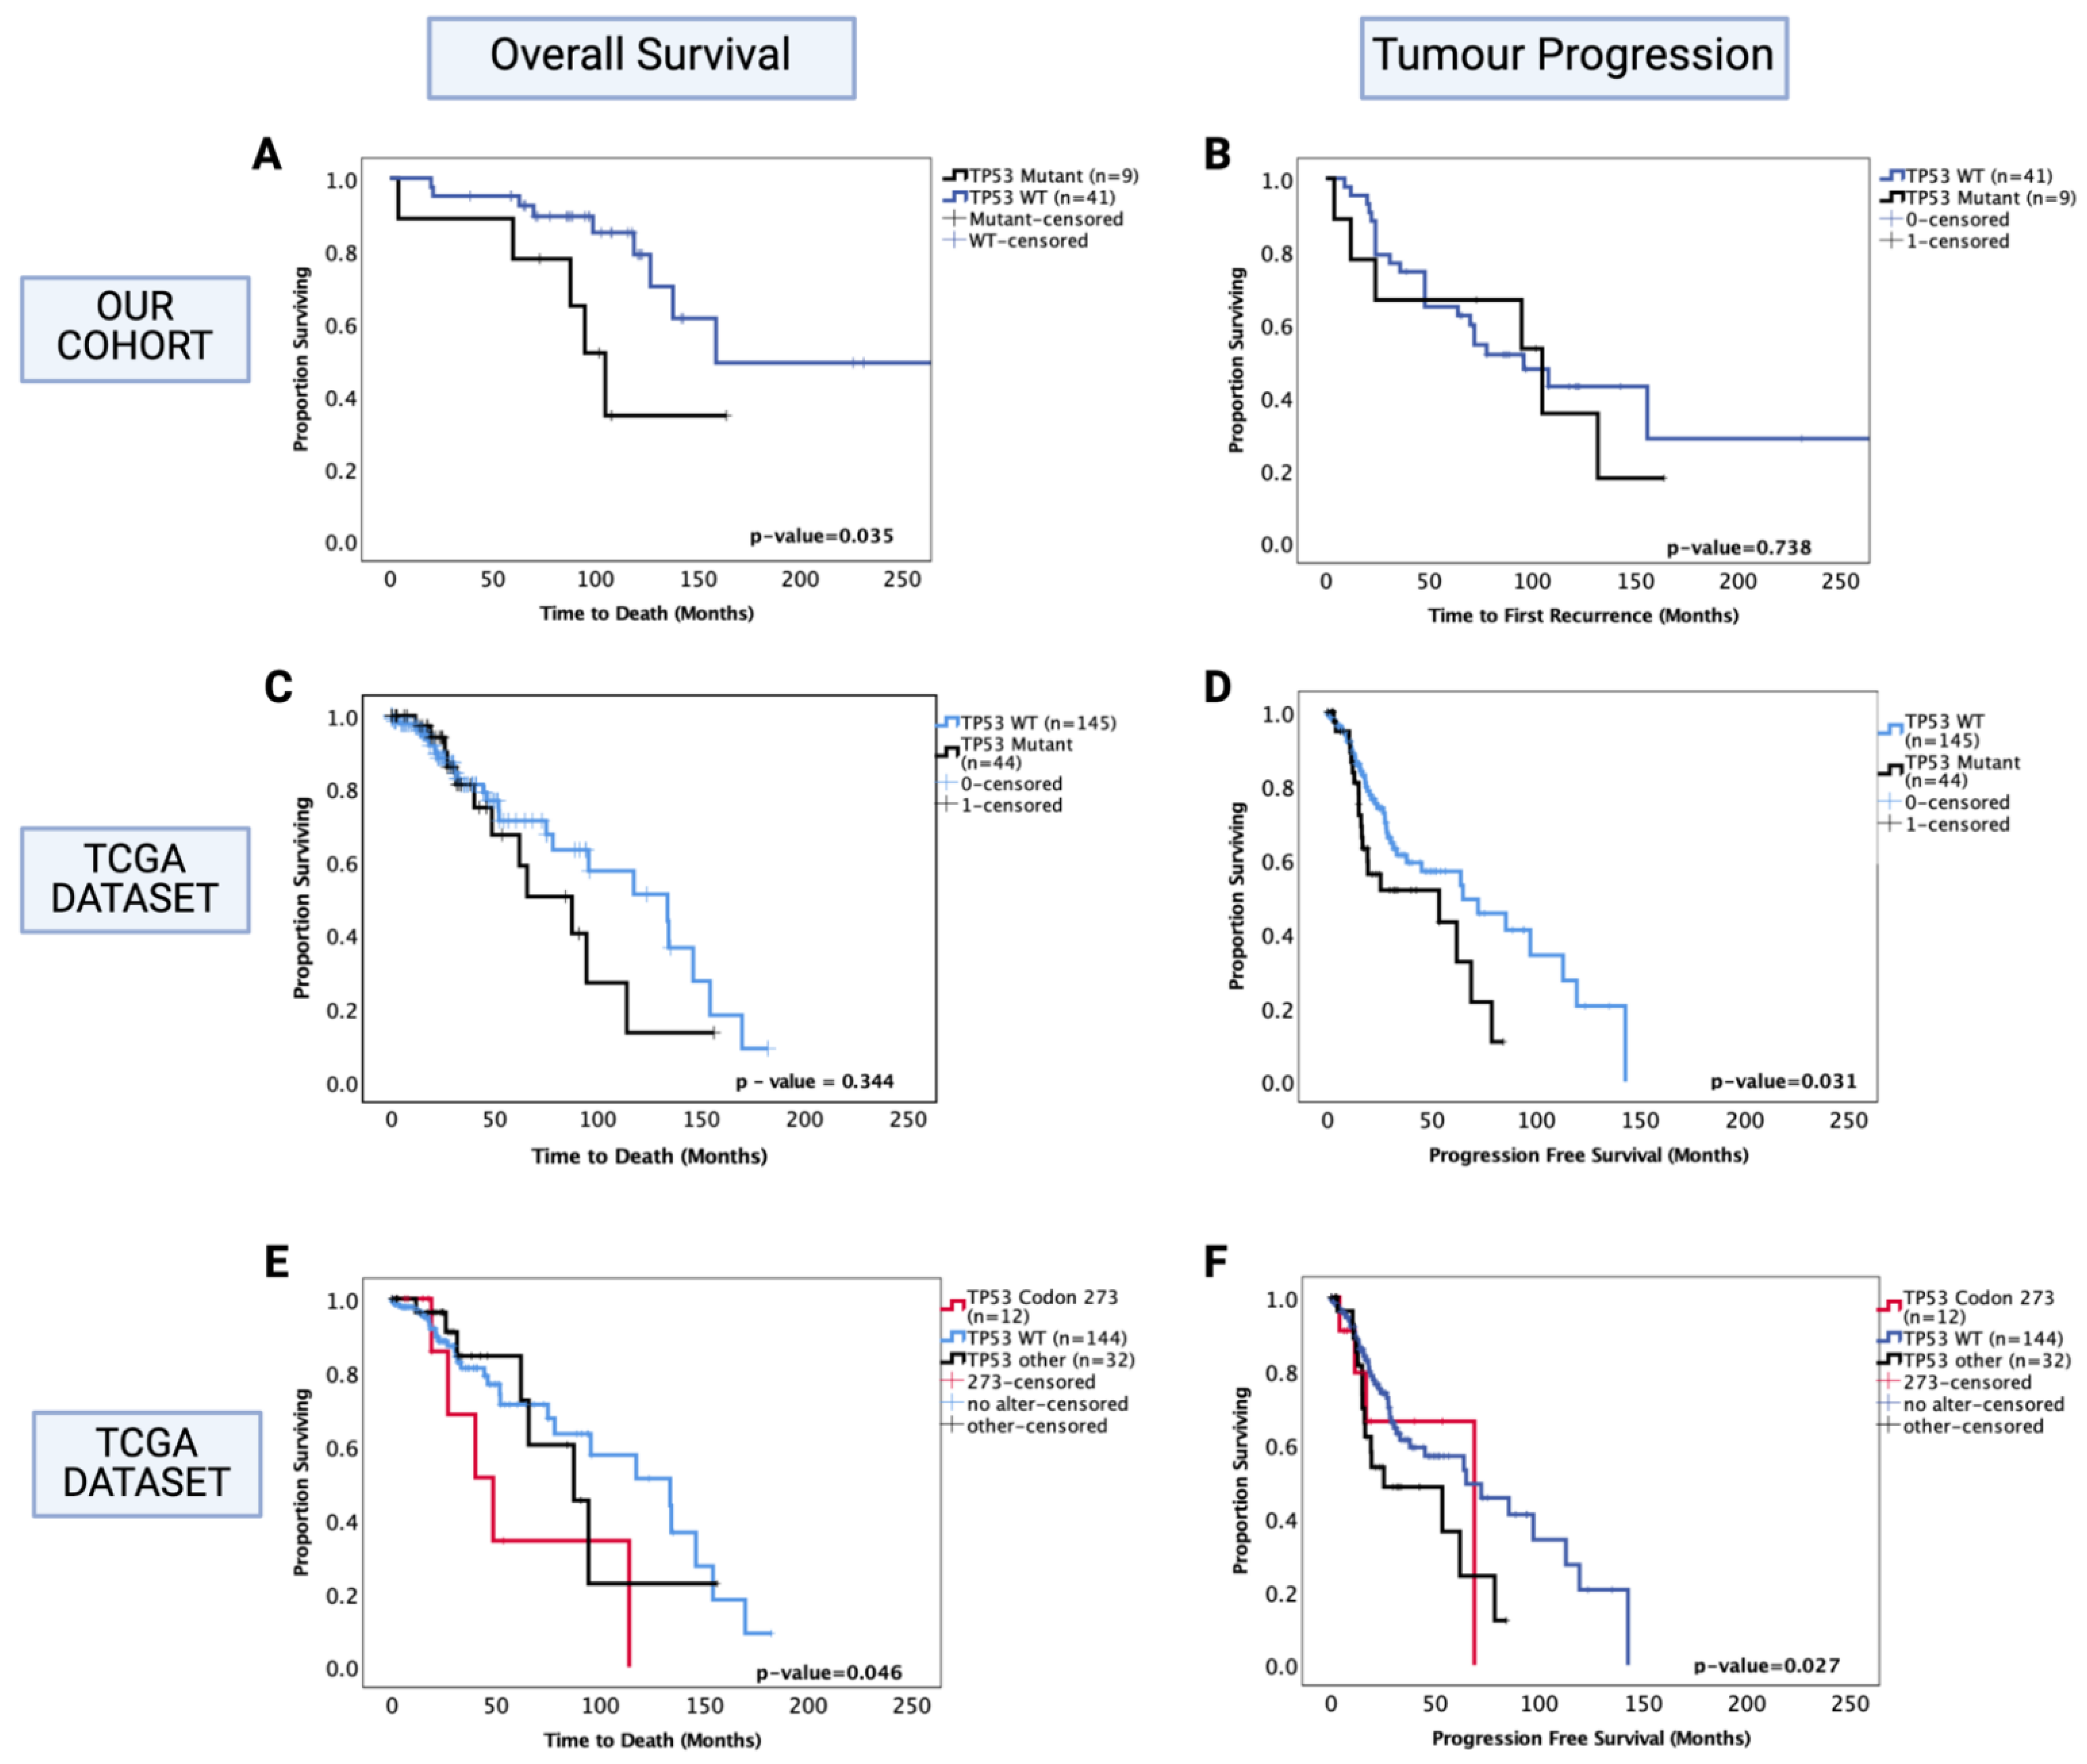
3.5.2. Prognostic Effects of TP53 Mutations in Oligodendroglioma

Separate survival analysis was conducted on the oligodendroglioma cohort to determine the role of TP53 mutation as a prognostic factor in this histological sub-type of LGG. TP53 mutation status was successfully determined in 50 out of 51 oligodendroglioma tumours, and 18% (9/50) of the tumours were TP53 mutants. Only one out of nine TP53 mutations were in codon 273 in our cohort. We found that the presence of TP53 mutation was associated with significantly decreased OS of oligodendroglioma patients (TP53 mutant vs. WT median survival: 100 mo. vs. 160 mo., HR (95% CI): 3.09 (1.023–9.32), p = 0.035) (Figure 4A). In multivariate analysis, TP53 mutation remained a prognostic factor (HR (95% CI): 6.52 (1.71–24.89), p = 0.006); however, it should be noted that 1p/19q co-deletion was not accounted for in the multivariate analysis in our cohort since this information was not available for all patients. There was a total of 30 cases with known 1p/19q co-deletion status (9 had no co-deletion and 21 were co-deleted), and 3 out of 9 non-co-deleted tumours had TP53 mutation whereas 2 out of 21 co-deleted tumours had TP53 mutation. No significant prognostic effect was observed in the PFS (p = 0.742) (Figure 4B).
The oligodendroglioma dataset from the TCGA was used to confirm these findings. In this dataset, 23% (44/189) oligodendroglioma tumours were TP53 mutants, of which 12 were mutations in the TP53 codon 273. The 1p/19q co-deletion status was known for all samples; hence, the multivariate analysis included adjustments for this molecular marker. We found no significant prognostic effect of TP53 mutation for OS (p = 0.344) (Figure 4C); however, the presence of TP53 mutation was associated with a significantly decreased PFS (Figure 4D) (TP53 mutant vs. WT, median PFS: 55 mo. vs. 75 mo., HR (95% CI): 1.78 (1.05–3.03), p = 0.031). In multivariate analysis (1p/19q co-deletion accounted for), this effect was no longer significant (HR (95% CI): 1.06 (0.49–2.31), p = 0.837).
We next analysed the codon 273 mutants separately from other TP53 mutations and found that only codon 273 mutants were associated with significantly decreased OS (codon 273 vs. WT median OS: 48.7 mo. vs. 133.7 mo., HR (95% CI): 2.63 (1.019–6.95), p = 0.046) (Figure 4E), while only other TP53 mutants were associated with significantly decreased PFS compared to TP53 WT (TP53 other vs. WT median PFS: 23 mo. vs. 65 mo., HR (95% CI): 1.89 (1.07–3.37), p = 0.027) (Figure 4F). In multivariate analysis, other TP53 mutations only showed a trend of decreased PFS (p = 0.056); however, codon 273 mutation remained a significant prognostic factor for oligodendroglioma OS in multivariate analysis (HR (95% CI): 9.05 (2.39–34.31), p = 0.001). Thus, TP53 codon 273 mutation is a key prognostic event in both astrocytoma and oligodendroglioma, having opposite effects on the survival of each sub-type. In the TCGA oligodendroglioma dataset, 9 out of 12 codon 273 mutations were present in the 1p/19q non-co-deleted sub-group and 3 out of 12 in the 1p/19q co-deleted sub-group; moreover, 57% (25/44) of TP53 mutant oligodendroglioma were 1p/19q non-co-deleted (total non-co-deleted samples in this dataset were n = 40). Hence, the observed decrease in OS in oligodendroglioma could be due to 1p/19q co-deletion or TP53 mutation. Due to this reason, we could not confirm whether TP53 mutation was an independent prognostic factor. Thus, we did not proceed with further investigation of the possible mechanism involved in oligodendroglioma. Nevertheless, the TCGA dataset findings show that although both codon 273 and other TP53 mutations were associated with 1p/19q co-deletion, it was only the codon 273 mutation in particular that corresponded to a decreased OS, establishing its importance as a prognostic factor and potential therapeutic target. Since only one tumour was a codon 273 mutant in our cohort and 1p/19q co-deletion status was missing for a number of cases, we could not confirm these findings in our cohort.

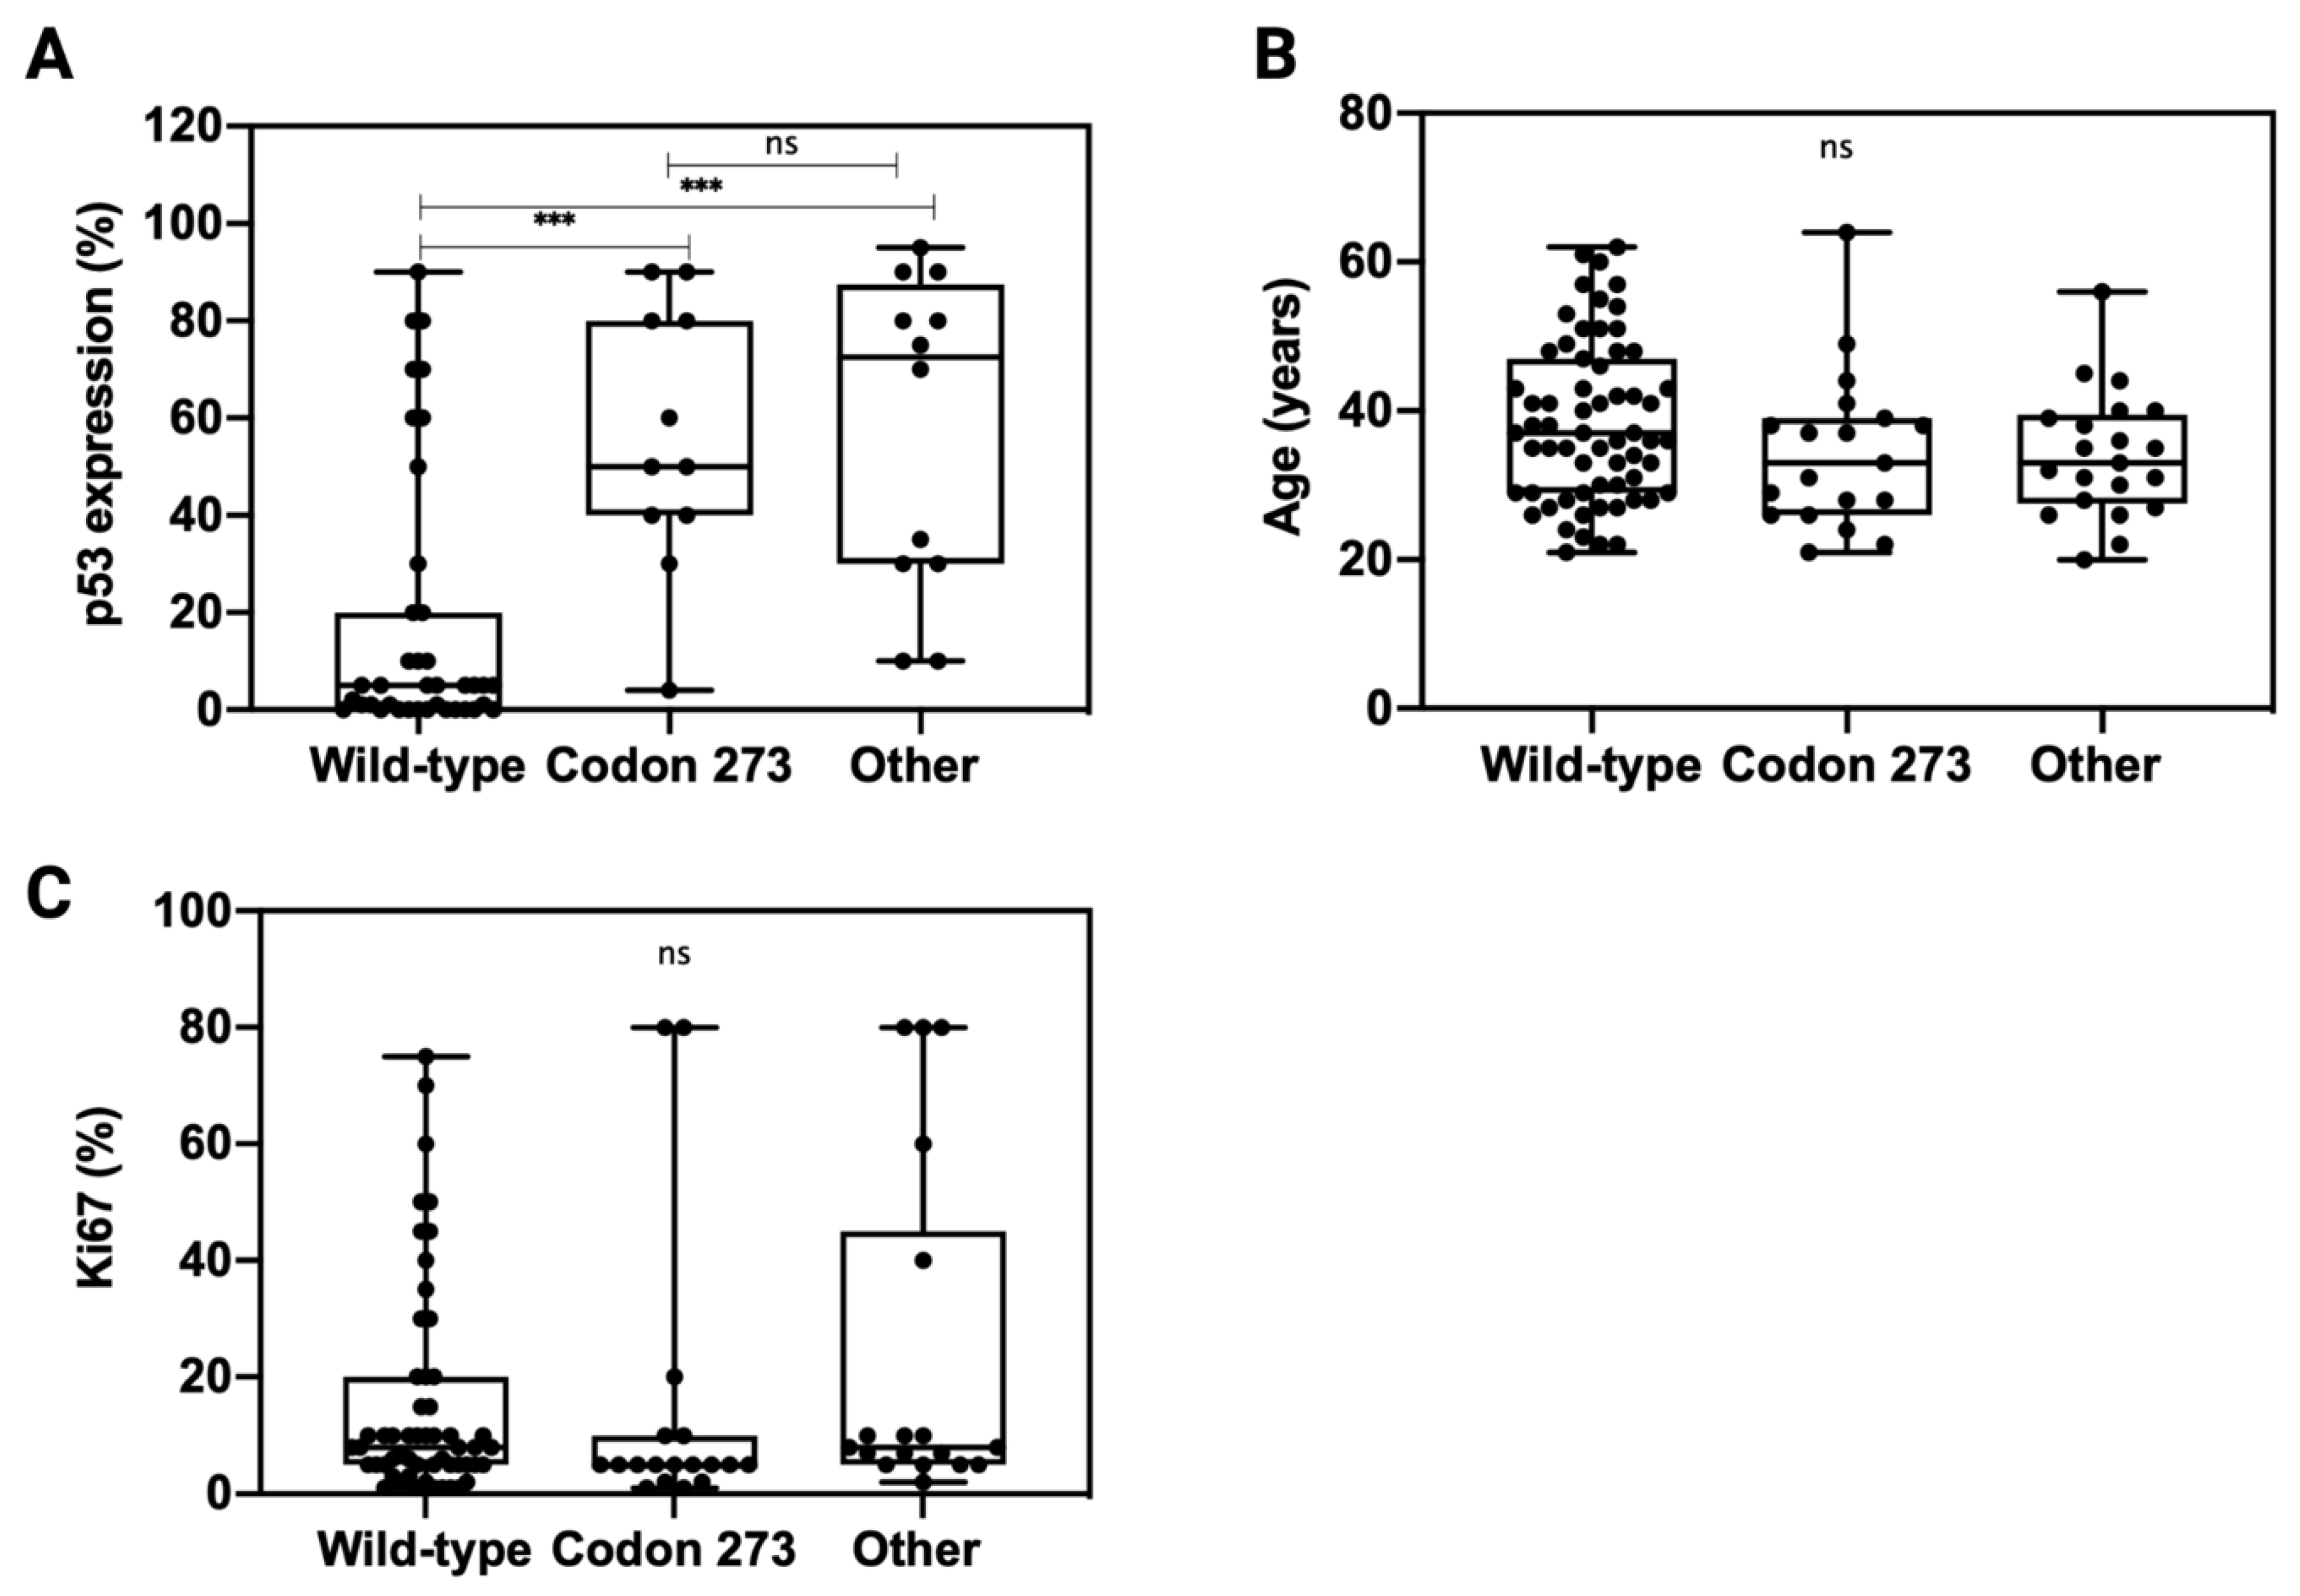
3.6. TP53 Mutation Is Associated with Elevated p53 Expression

In order to understand whether TP53 codon 273 mutations affect the expression of p53, we analysed p53 expression across TP53 mutation categories (Figure 5A). Compared to TP53 WT, both other TP53 mutations and TP53 codon 273 mutations correlated with a significantly higher p53 expression (p < 0.001). There was no significant difference in the p53 expression levels between codon 273 mutants and other TP53 mutant tumours (p = 0.94). The patient age and tumour proliferation index, Ki67% (data extracted from the pathology report), was similar across all TP53 mutant and WT categories (Figure 5B,C).
As no significant difference was observed between TP53 expression levels in the other TP53 mutant and codon 273 mutant groups, the mechanism through which codon 273 improves survival compared to the other mutant groups likely involves factors more than just the expression modulation of mutant p53 proteins. As the tumour proliferation rate was similar between codon 273 mutant, other TP53 mutant and TP53 WT groups, it suggests that the improved survival of codon 273 mutant patients might not be due to decreased tumour proliferation activity. Codon 273 mutant patients were not significantly younger than the other groups; hence, the improved survival was not related to patient age.

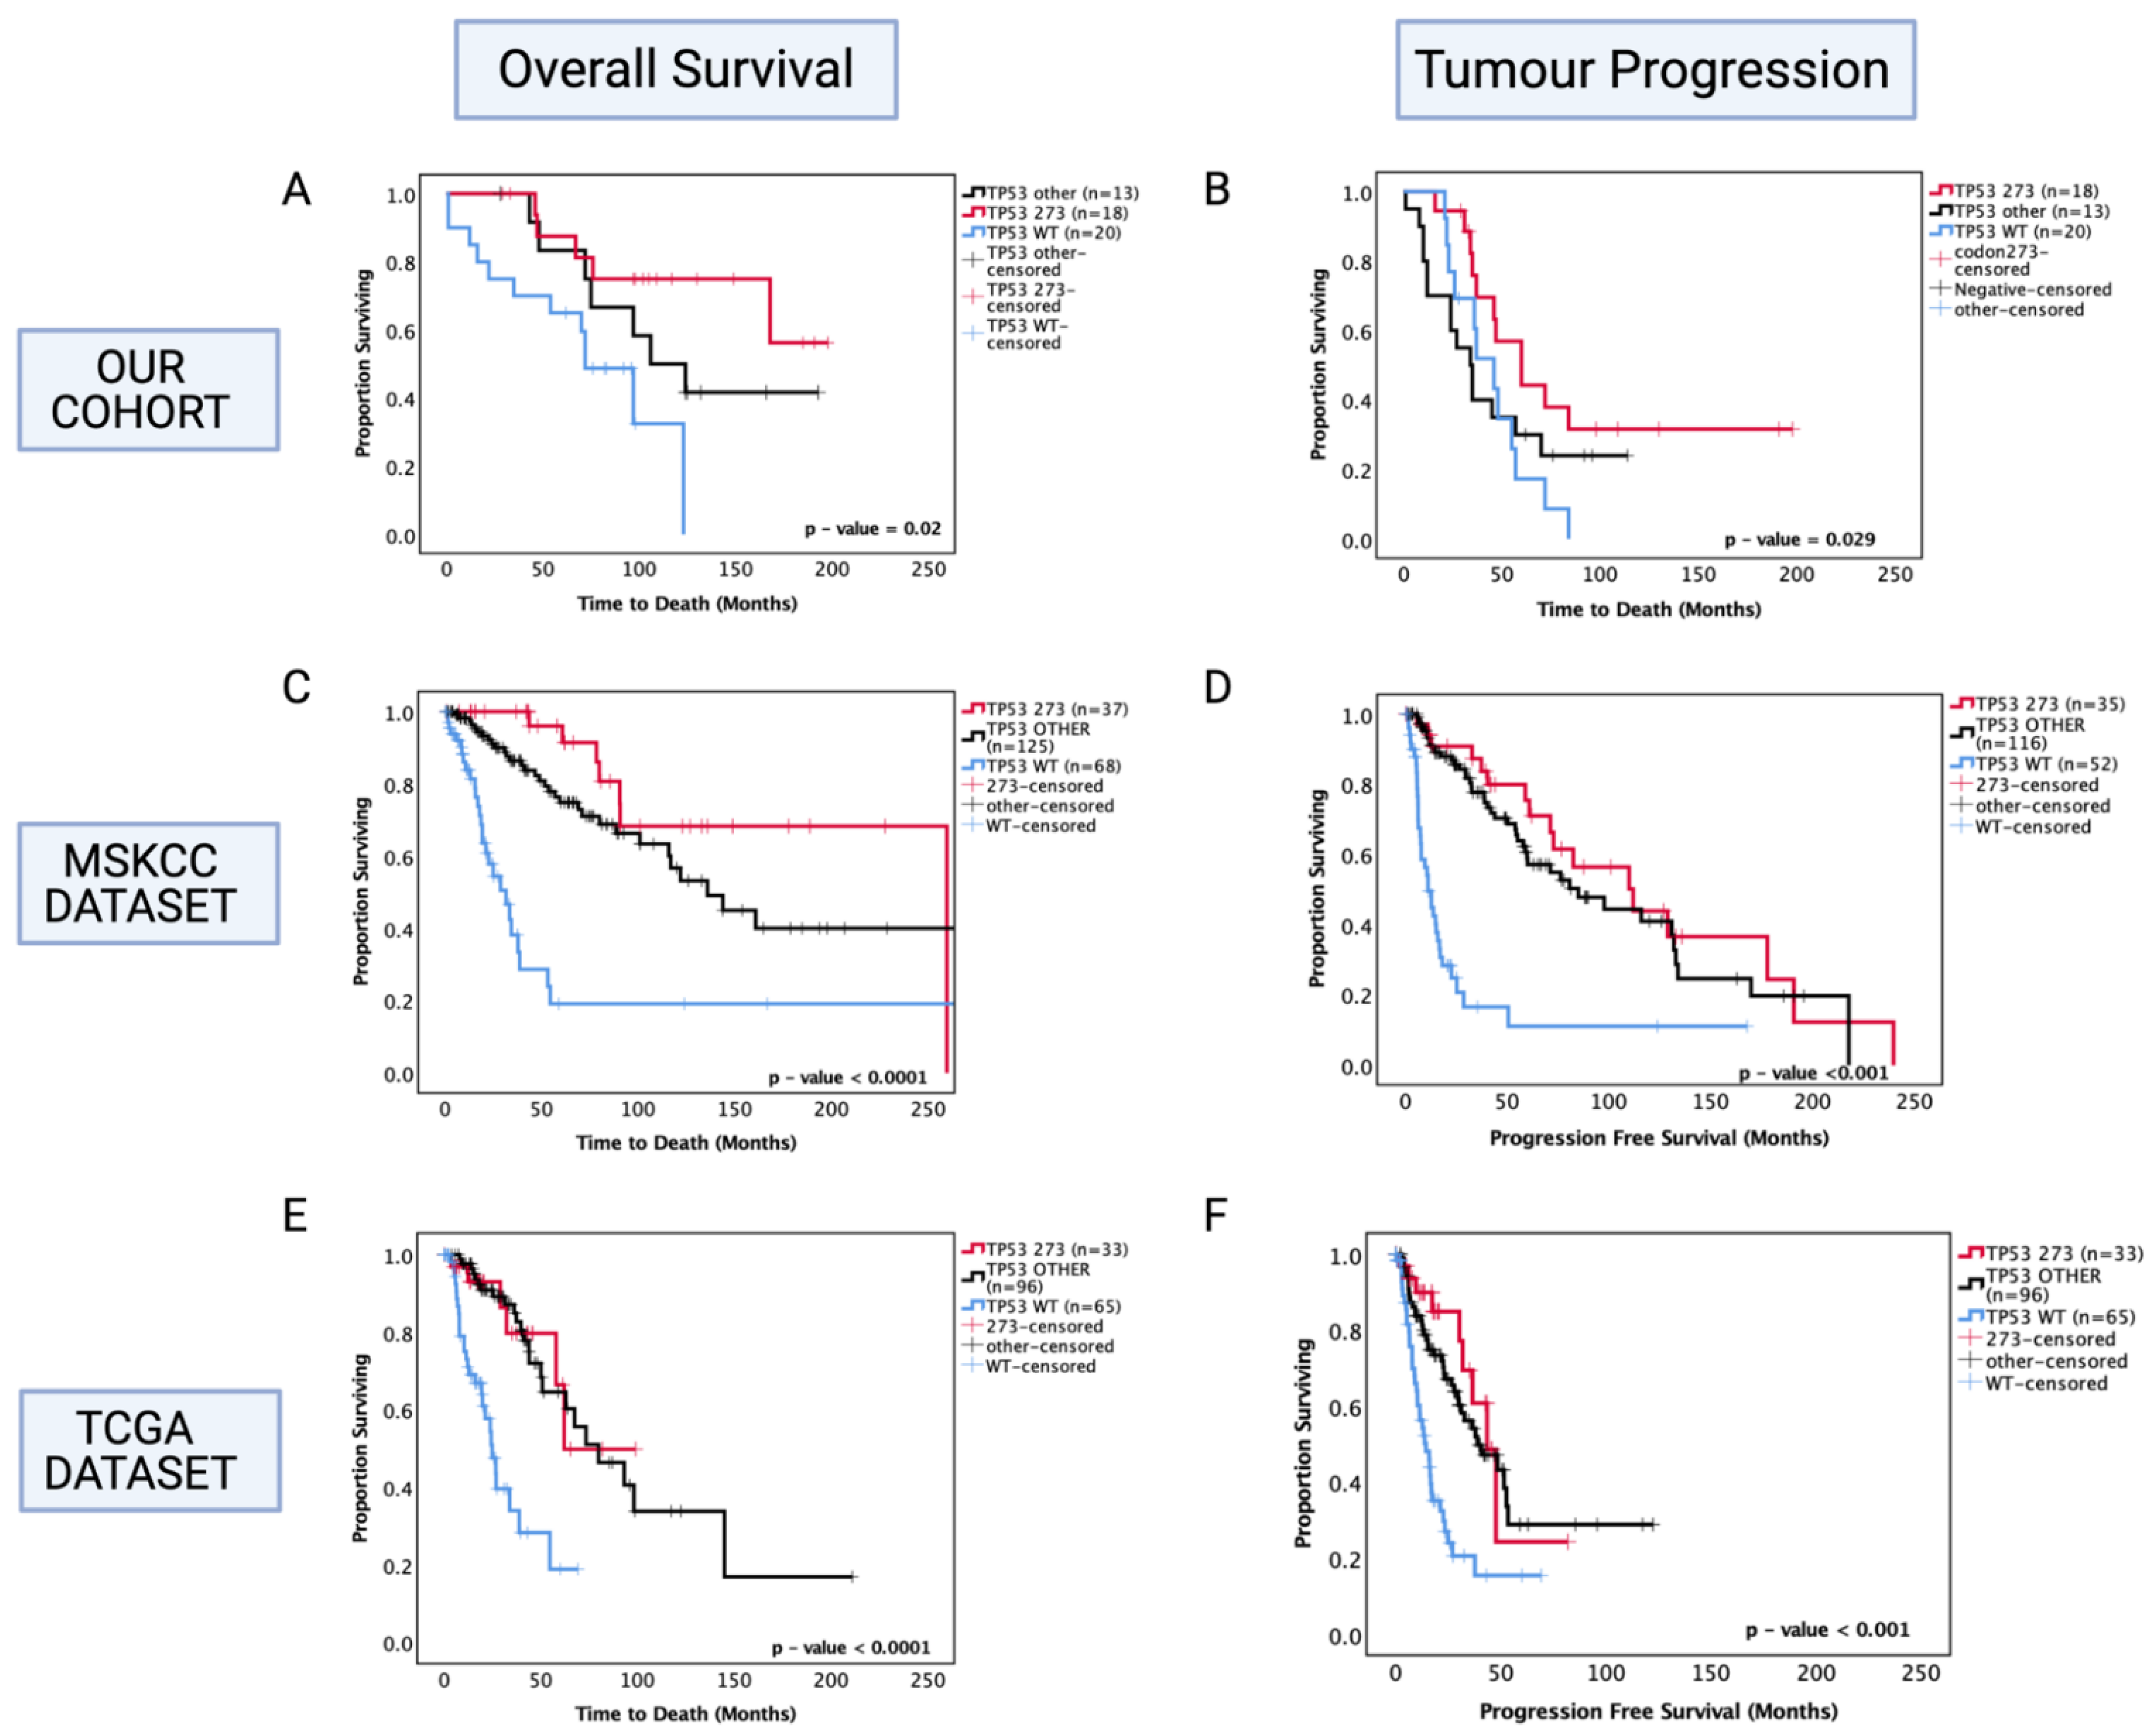
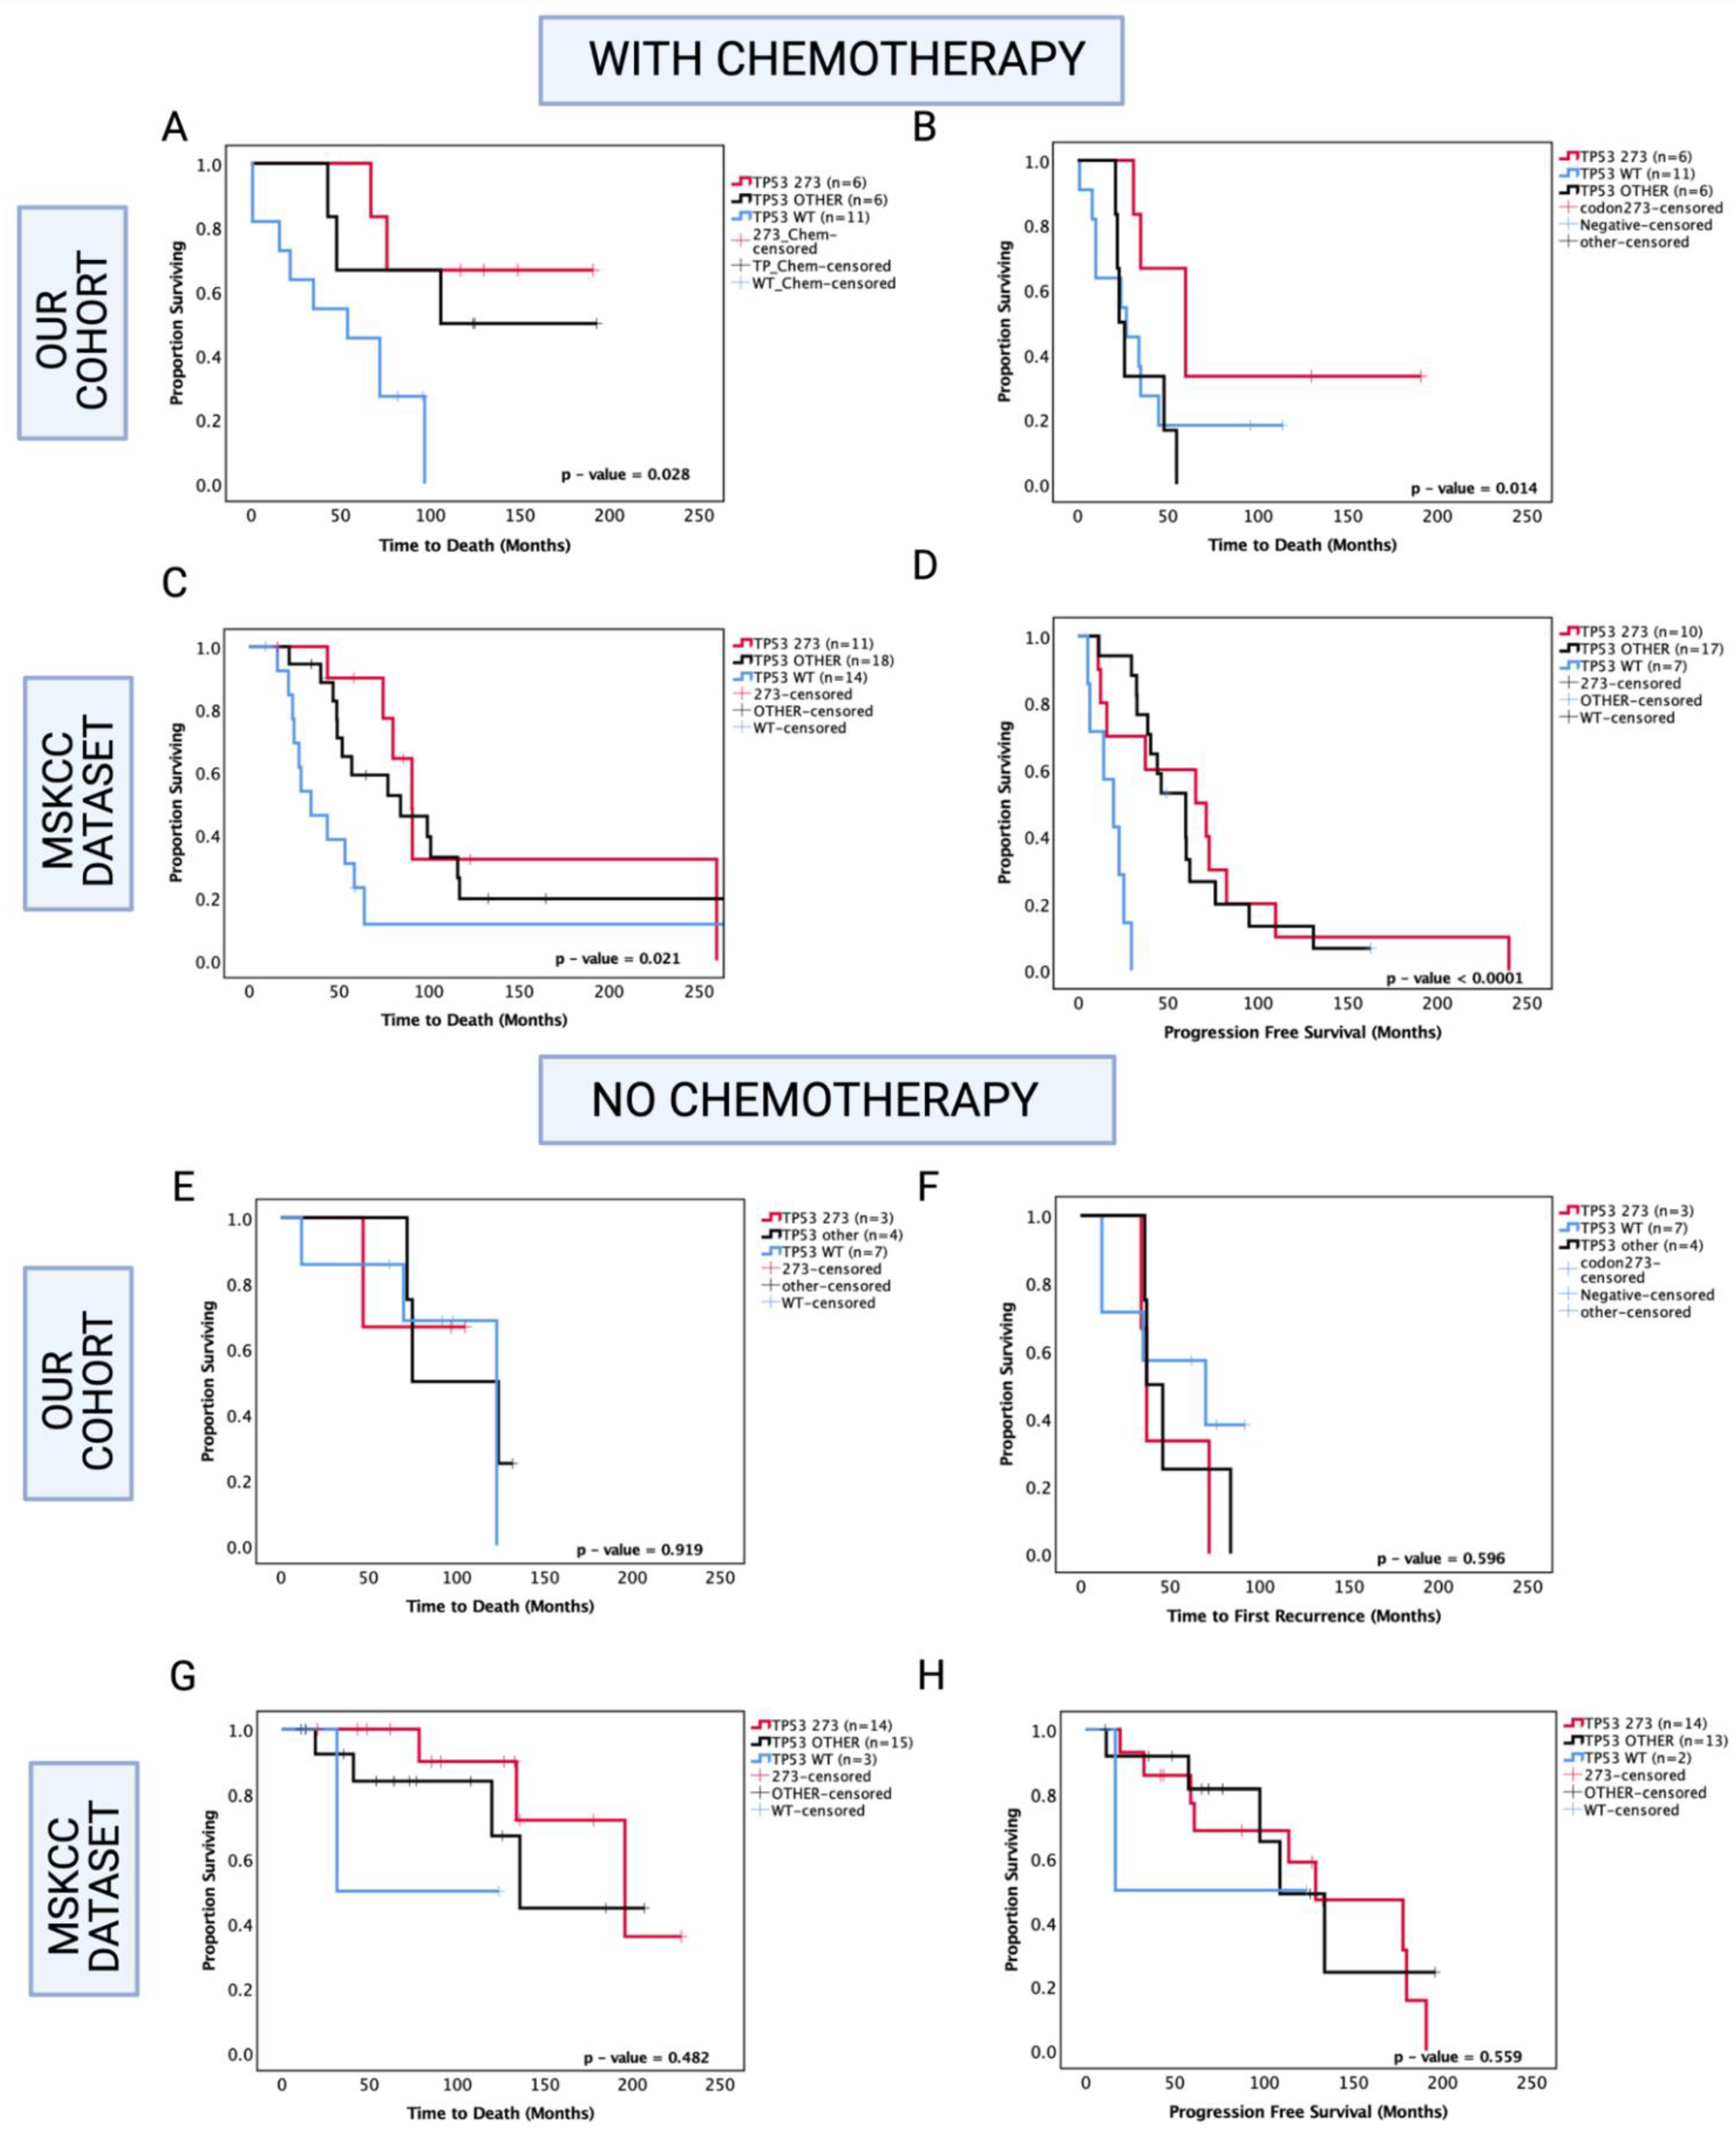
3.7. Enhanced Chemosensitivity of Codon 273 Mutant Astrocytoma May Lead to Improved Overall and Progression-Free Survival

Since chemotherapy is commonly administered in astrocytoma, one possibility is that codon 273 mutant patients are more sensitive to therapy compared with other TP53 mutant patients and TP53 WT. Hence, in our analysis, we next set out to determine the role of TP53 mutations in inducing chemosensitivity (Figure 6). In our cohort of known chemotherapy status, other TP53 mutations were associated with a trend toward increased OS within the chemotherapy-treated group (other TP53 vs. WT median survival: 149.5 mo. vs. 54 mo., HR (95% CI): 0.329 (0.11–1.02), p = 0.054), and TP53 codon 273 mutations were associated with significantly increased OS compared to TP53 WT in the chemotherapy-treated group (codon 273 vs. WT median survival: not reached vs. 54 mo., HR (95% CI): 0.225 (0.07–0.73), p = 0.028 (Figure 6A). It should be noted that in the chemotherapy group, 8/23 patients had received only chemotherapy and 15/23 patients were also radiotherapy-treated, and within the no-chemotherapy group, 9/14 patients underwent gross total resection only and 5/14 patients were radiotherapy-treated. Thus, the role of radiotherapy remains unclear in our analysis. In the PFS analysis within the chemotherapy-treated group, other TP53 mutations were not significantly associated with progression (p = 0.788); however, codon 273 mutation showed a trend toward increased PFS (codon 273 vs. WT median survival: 60 mo. vs. 24.5 mo., HR (95% CI): 0.438 (0.14–1.29), p = 0.071) compared to WT. Codon 273 mutation was associated with significantly increased PFS compared to other TP53 mutations (codon 273 vs. other TP53 median survival: 60 mo. vs. 24.5 mo., HR (95% CI): 0.235 (0.06–0.99), p = 0.014) (Figure 6B). This indicates possible chemosensitivity of TP53 codon 273 mutants and possibly some of the ‘other’ TP53 mutant tumours.
In the MSKCC cohort of chemotherapy-treated astrocytoma, both codon 273 and other TP53 mutations were associated with significantly increased OS (other vs. WT median survival: 84.2 mo. vs. 34.4 mo., HR (95% CI): 0.459 (0.19–0.93), p = 0.031; codon 273 vs. WT median survival: 90.6 vs. 34.4 mo., HR (95% CI): 0.344 (0.13–0.88), p = 0.0148) and significantly increased PFS (other vs. WT median PFS: 53.5 mo. vs. 19.6 mo., HR (95% CI): 0.177 (0.04–0.96), p < 0.0001; codon 273 vs. WT median PFS: 68.4 mo. vs. 19.6 mo., HR (95% CI): 0.332 (0.09–0.63), p = 0.009) (Figure 6C,D).
Interestingly, within the group of patients who did not receive chemotherapy, in our cohort and the MSKCC cohort, there were no significant associations between TP53 mutations and OS/PFS (Figure 6E–H).
Hence, our findings indicate that codon 273 mutant tumours are possibly more chemosensitive than TP53 WT and ‘other’ TP53 mutant groups, although, within the ‘other’ mutant group, there may be a number of less frequently occurring mutations that give the same prognostic effect as codon 273, ultimately leading to the TP53 other group trending toward an improved clinical outcome. It is, thus, important to understand the effects of individual TP53 mutation types/codons.
We next set out to examine whether the chemosensitivity mechanism may involve the binding of transactivated isoforms (TA) of p73 (other members of the p53 family) with yes-associated protein 1, YAP1. YAP1 (a core component of the Hippo pathway) is a transcriptional co-activator of TAp73, and p300-mediated acetylation of TAp73 leads to its increased binding with YAP1, resulting in TA-p73/YAP1 complexes to promote apoptosis through several target apoptotic genes [41]. Furthermore, YAP1 stabilises p73 in response to chemotherapy and DNA damage, enhancing its apoptotic function [42] and affinity to p73 [43]. The YAP-p73 complex has been shown to activate treatment-induced apoptosis in colorectal cancer, breast cancer and other malignancies [44,45,46]. Hence, we analysed the correlation of YAP1 with TP53 mRNA expression and its prognostic involvement in astrocytoma.

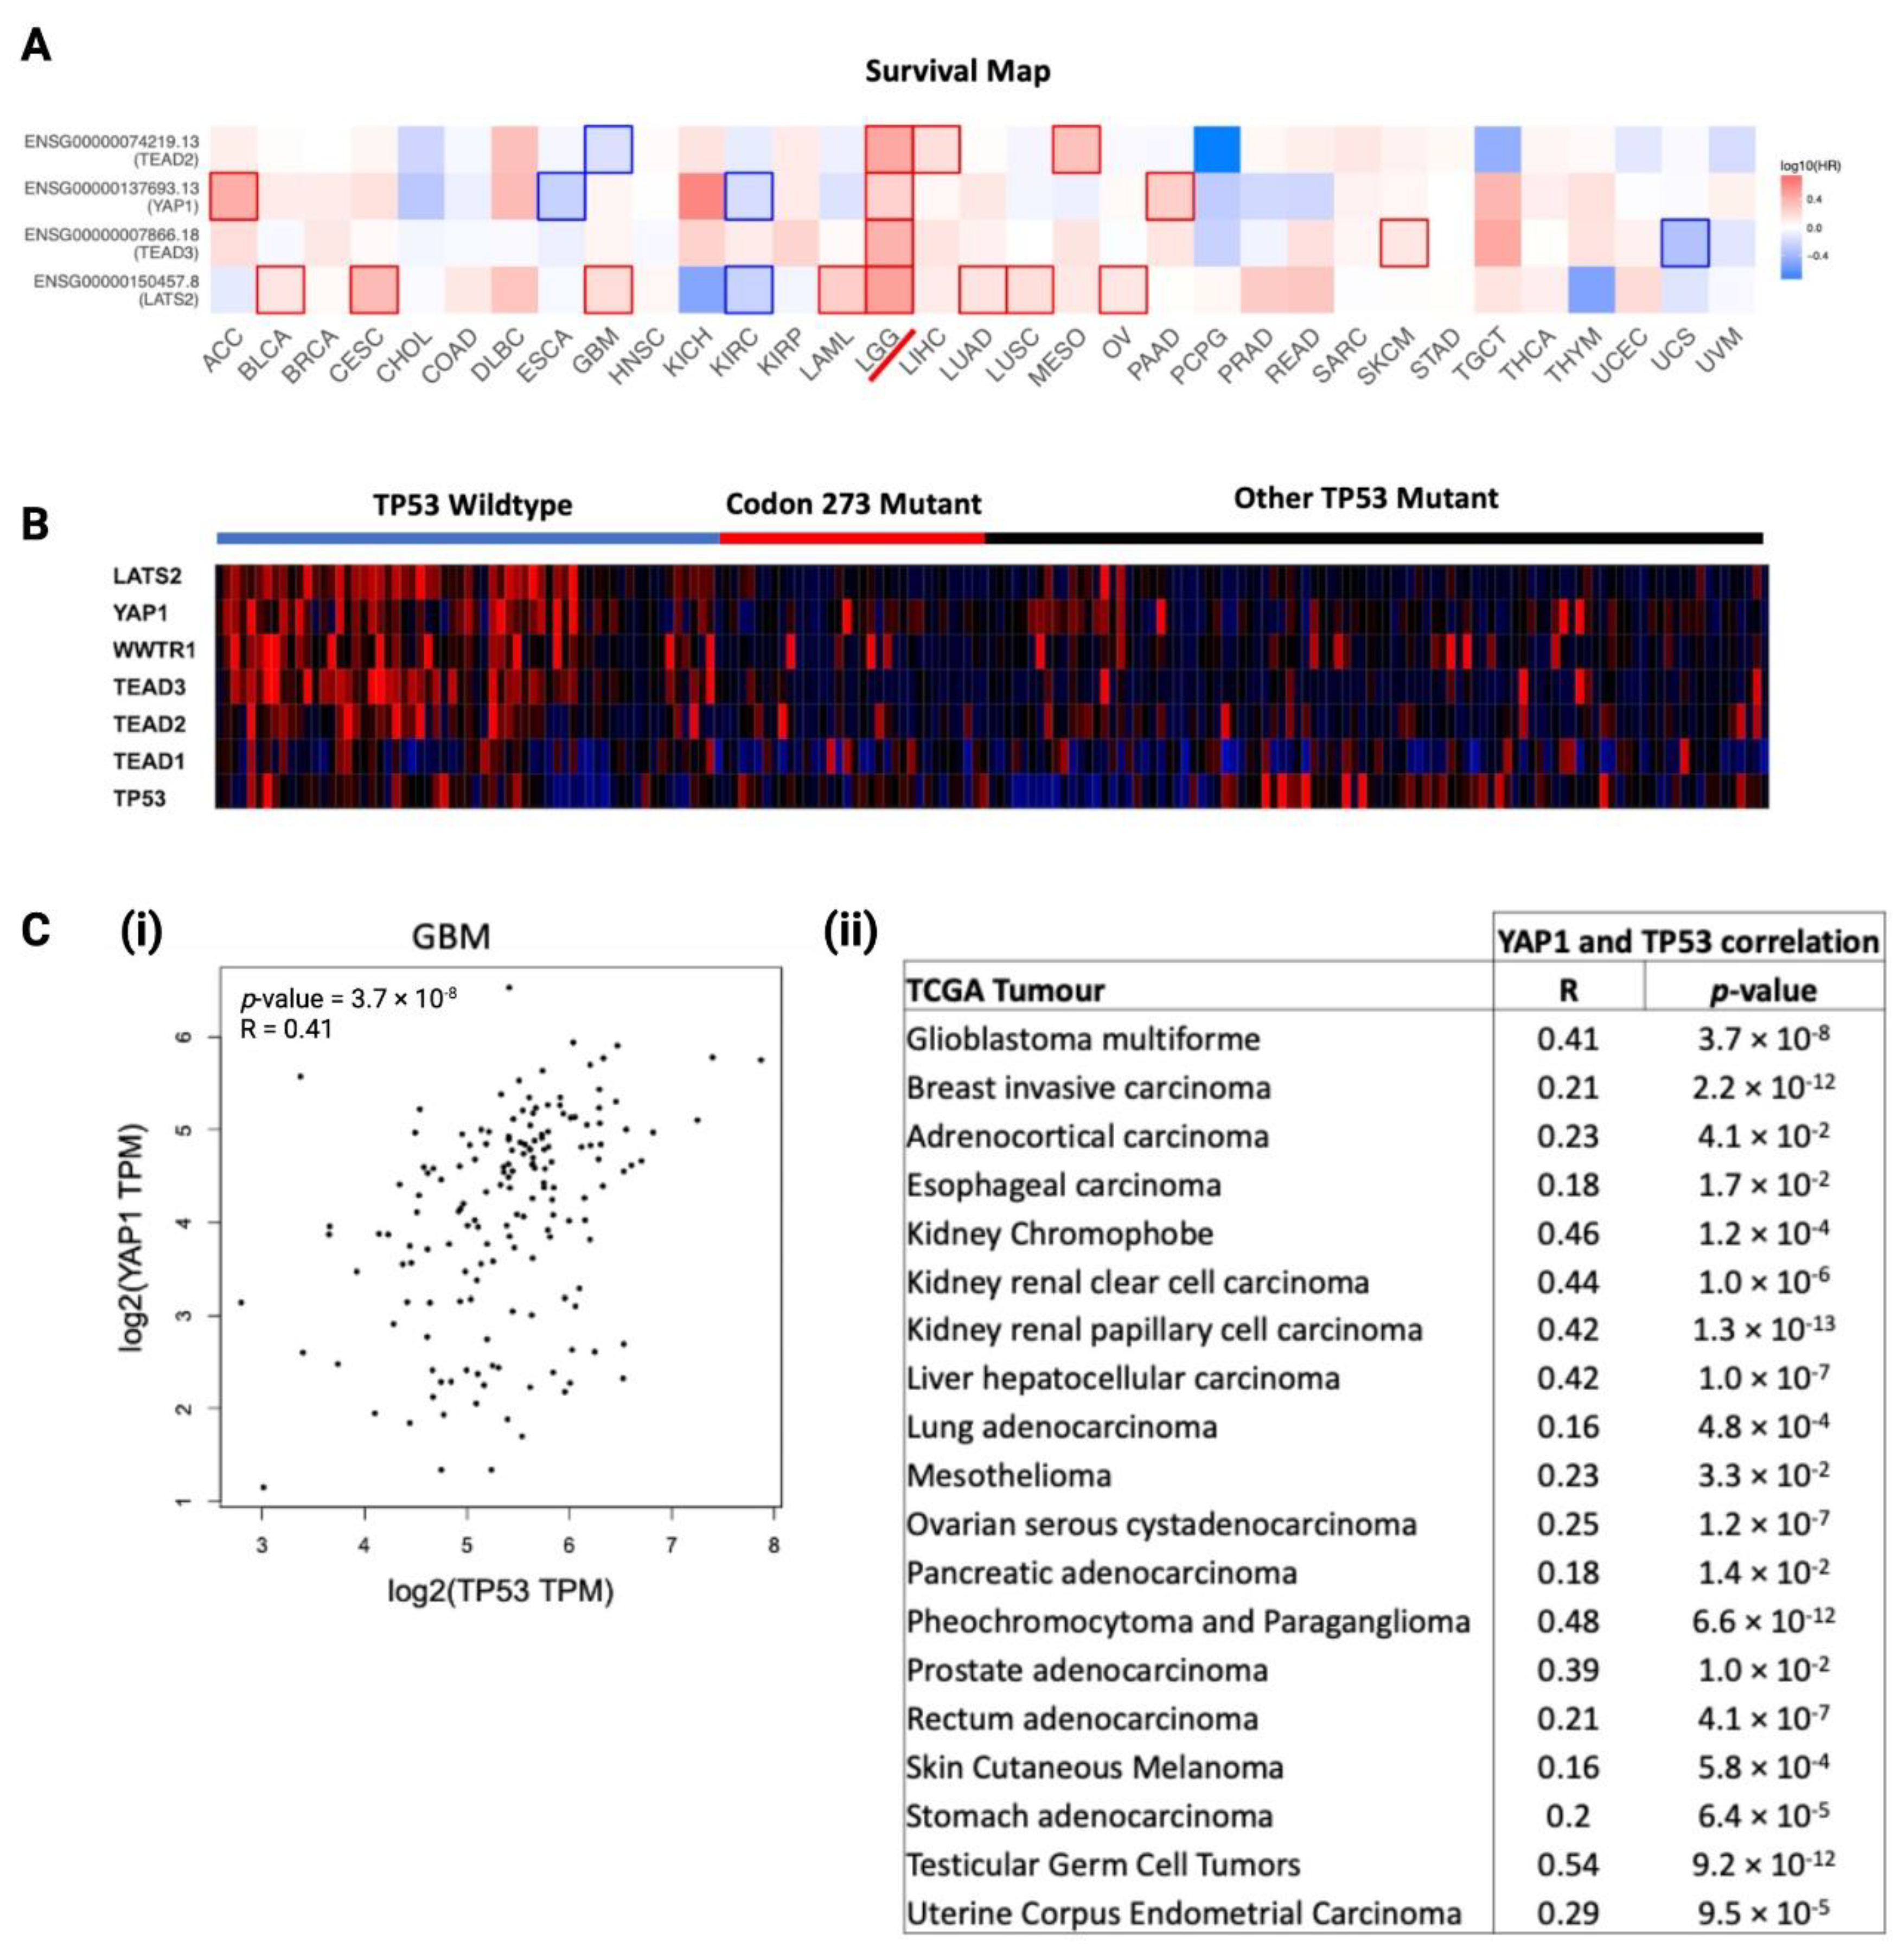
3.8. YAP1 mRNA Expression Is Associated with TP53, and Hippo Signalling Pathway Genes Are Prognostic Factors in LGG

We analysed the prognostic significance of core Hippo Signalling pathway genes, determined from existing literature [34,35,36], among TCGA cancers, visualised as a heatmap of log10(HR) in Figure 7A. LGG was the only cancer where key Hippo Signalling pathway genes were significant prognostic markers, which further substantiated the rationale for investigating the interaction between TP53 and YAP1 post-chemotherapy. To investigate the distribution of Hippo Signalling pathway gene mRNA expression among TP53 mutants and TP53 WT astrocytoma, we generated a heatmap to visualise TCGA astrocytoma samples in Figure 7B. Clearly, the TP53 WT astrocytoma group showed the highest expression of Hippo Signalling pathway genes. Codon 273 mutant and other TP53 mutant groups showed no clear difference in the gene expression profile, indicating that some of the other TP53 mutations may have similar interactions with the Hippo pathway. In order to understand the relationship between YAP1 and TP53, we analysed the correlation between the mRNA of these two genes within TCGA cancers. We found 19 cancer types showing a significant positive correlation between YAP1 and TP53 mRNA expression in primary tumours (summarised in Figure 7C(i)). The correlation plot for GBM is presented in Figure 7C(ii). LGG was not in the list of cancers showing a positive correlation, which was not unexpected, considering the significant association between these genes was observed in recurrent LGG tumours only.

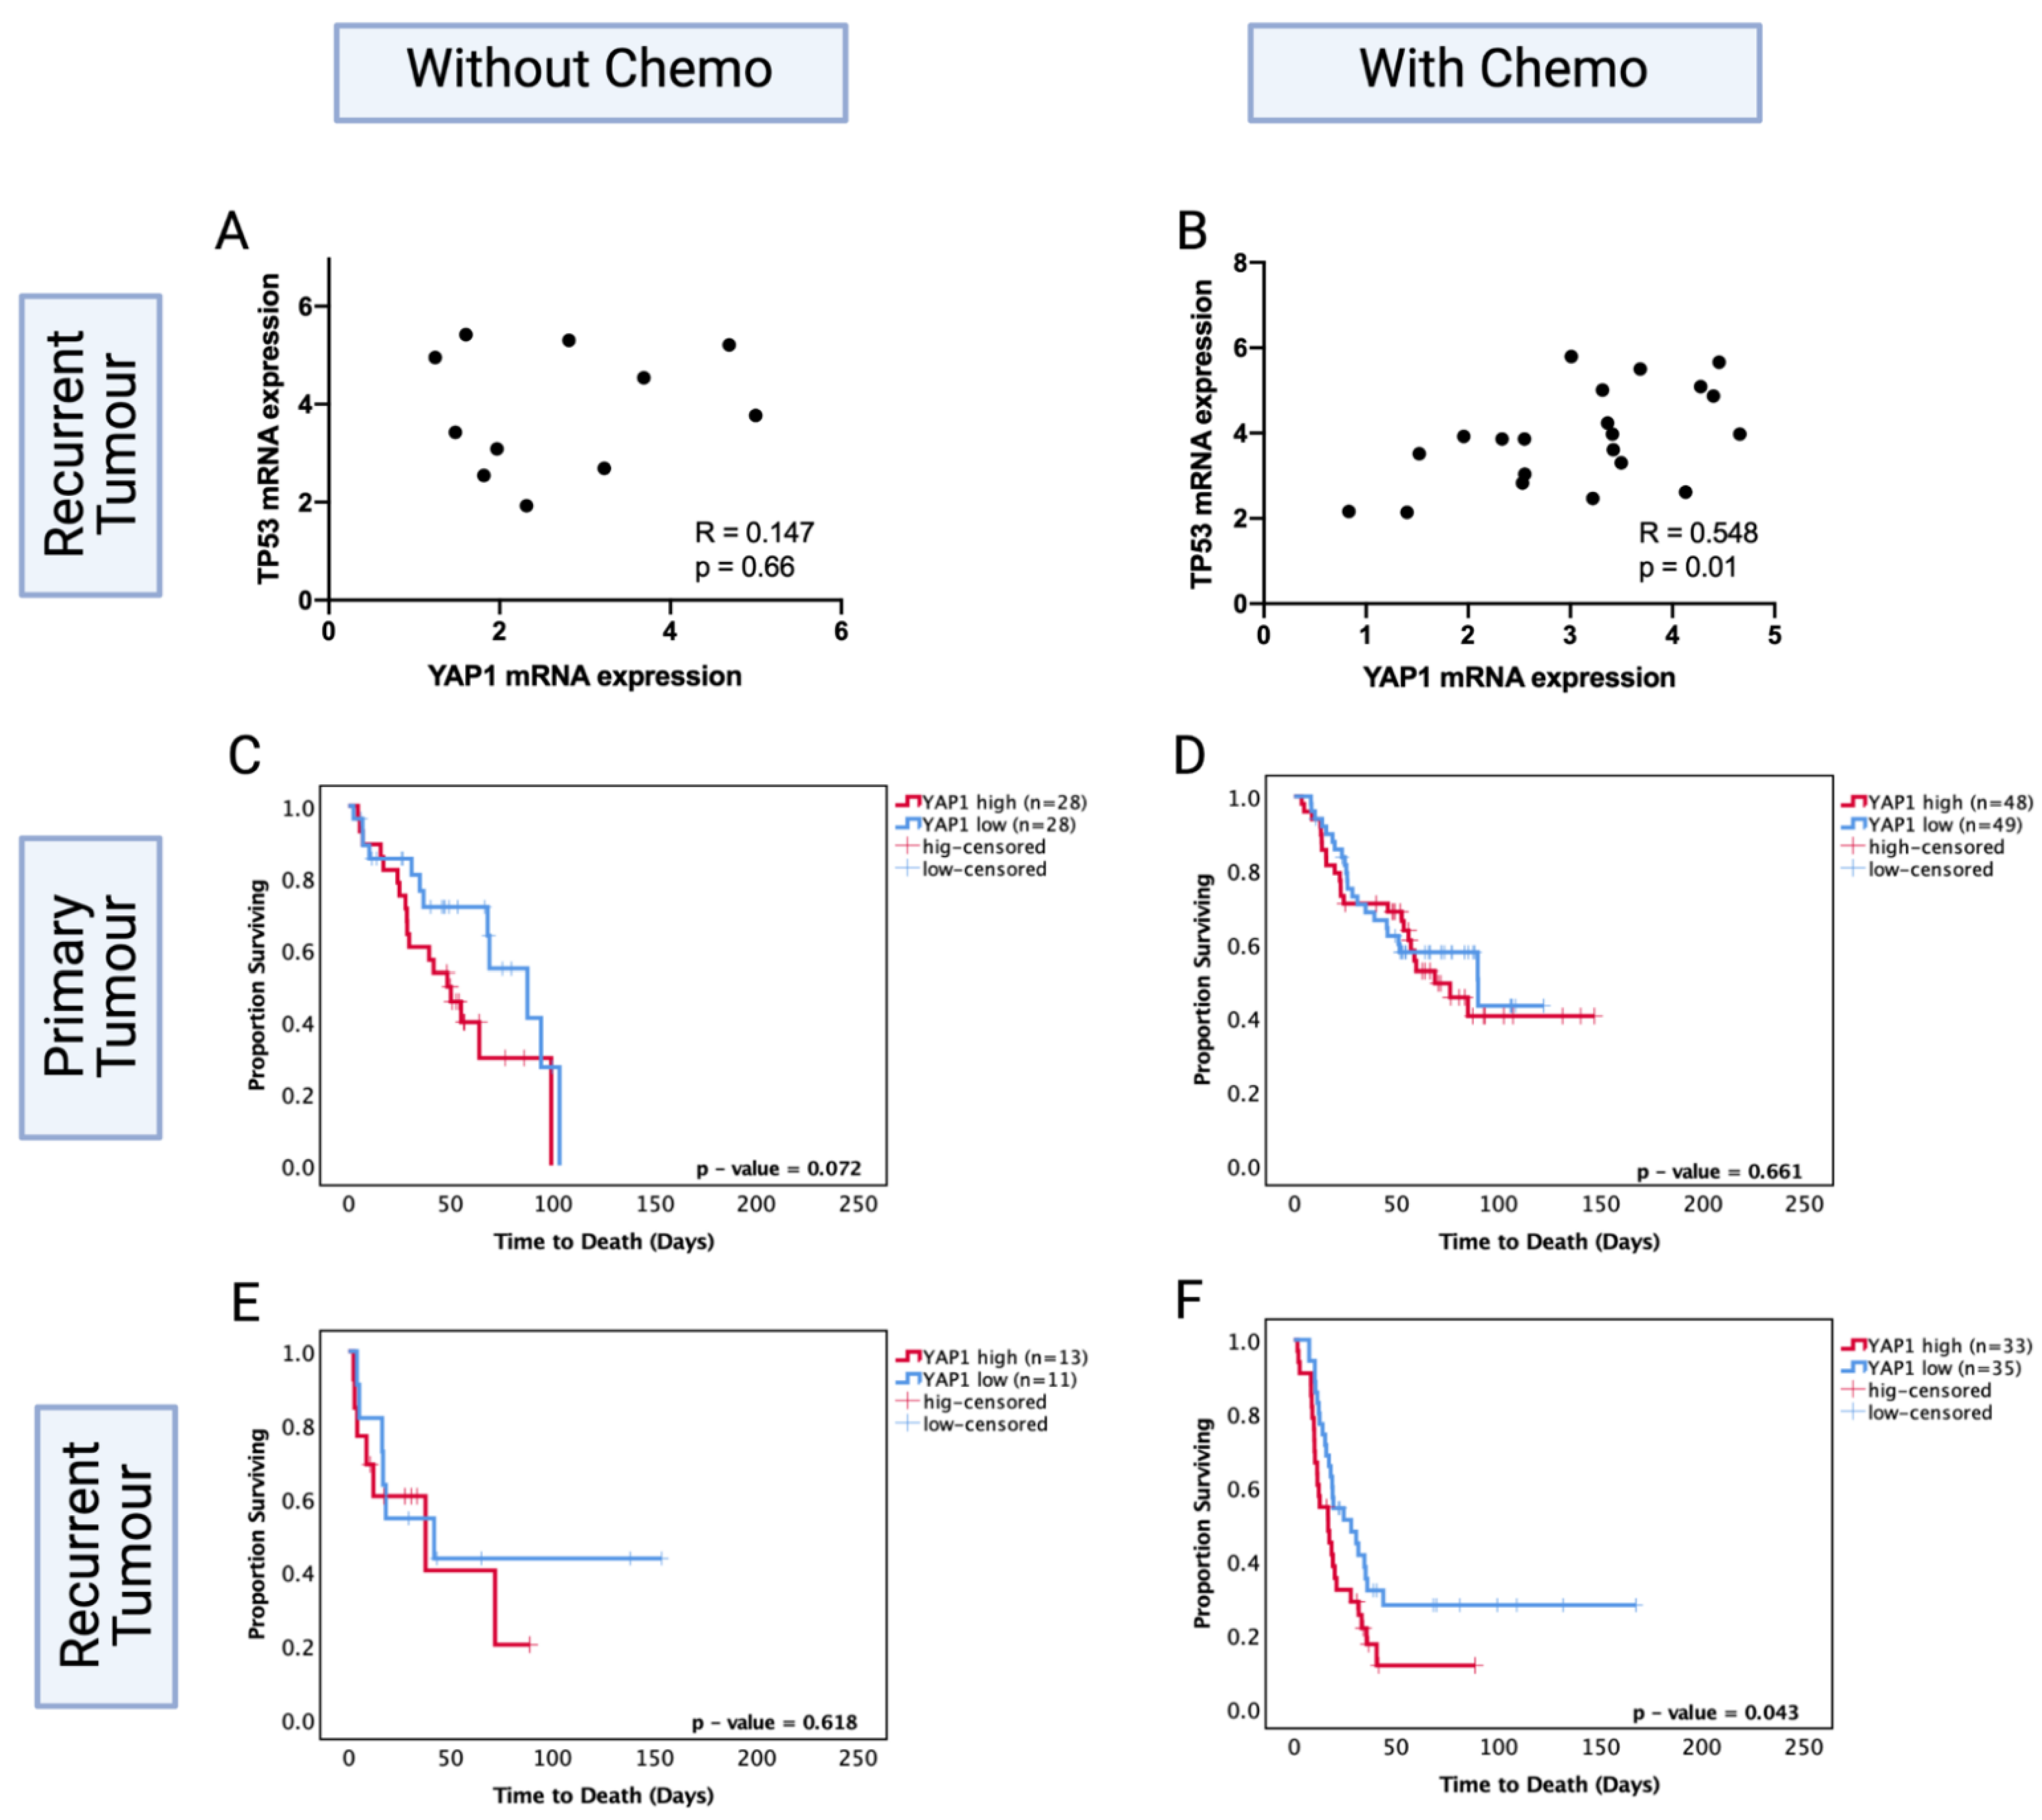
3.9. YAP1 mRNA Expression Levels Are Prognostic in Only Chemotherapy-Treated Recurrent Astrocytoma

To test the hypothesis of YAP1 involvement in TP53 mutation-mediated chemosensitivity, we investigated this mechanism in silico, using the CGGA dataset that includes clinical and transcriptomics data on recurrent gliomas. This dataset was used because recurrent LGGs were available in this dataset, unlike TCGA and MSKCC datasets, where only primary LGG data were available. Our investigation required recurrent tumours for the analysis of post-treatment effects. Investigating recurrent astrocytoma samples that were specifically treated with chemotherapy was necessary to understand the role of chemotherapy on YAP1.
While specific TP53 mutation data were not available for the CGGA dataset, thereby limiting our capacity to directly analyse the relationship with TP53 codon 273 mutation, we found that TP53 mRNA expression positively correlated with YAP1 levels in the chemotherapy group. The high YAP1 level group showed significantly higher levels of TP53 mRNA expression (R = 0.548, p < 0.05). However, the recurrent astrocytoma group that did not receive chemotherapy showed no significant correlation between TP53 and YAP1 mRNA expression levels (R = 0.147, p = 0.66) (Figure 8A,B). This suggests a role for chemotherapy in modulating the interaction of TP53 and YAP1.
We next investigated the prognostic role of YAP1 levels in primary and recurrent astrocytoma with and without chemotherapy. Within the primary tumours, YAP1 mRNA expression levels were not a significant prognostic factor with (p = 0.66) or without (p = 0.072) chemotherapy treatment (Figure 8C,D). Within the recurrent tumours, YAP1 mRNA expression was not a significant prognostic factor for patients who did not receive chemotherapy (p = 0.62) (Figure 8E); however, low YAP1 mRNA expression was associated with significantly increased OS in patients who were chemotherapy-treated (YAP1 high vs. low median survival: 28.05 mo. vs. 16.76 mo., HR (95% CI): 1.742 (1.019–3.168), p = 0.043) (Figure 8F). In multivariate analysis, after adjusting for IDH1 mutation, tumour grade, gender and age, YAP1 levels were an independent prognostic factor for chemotherapy-treated recurrent astrocytoma (HR (95% CI): 4.06 (1.32–12.27), p = 0.013). This indicates the prognostic importance of post-chemotherapy YAP1 mRNA expression and confirms YAP1 mRNA expression is not a prognostic factor in primary tumours. It should be noted that the CGGA dataset is comprised of Chinese glioma samples; due to the lack of available recurrent LGG datasets, we cannot extend these findings to the global population.

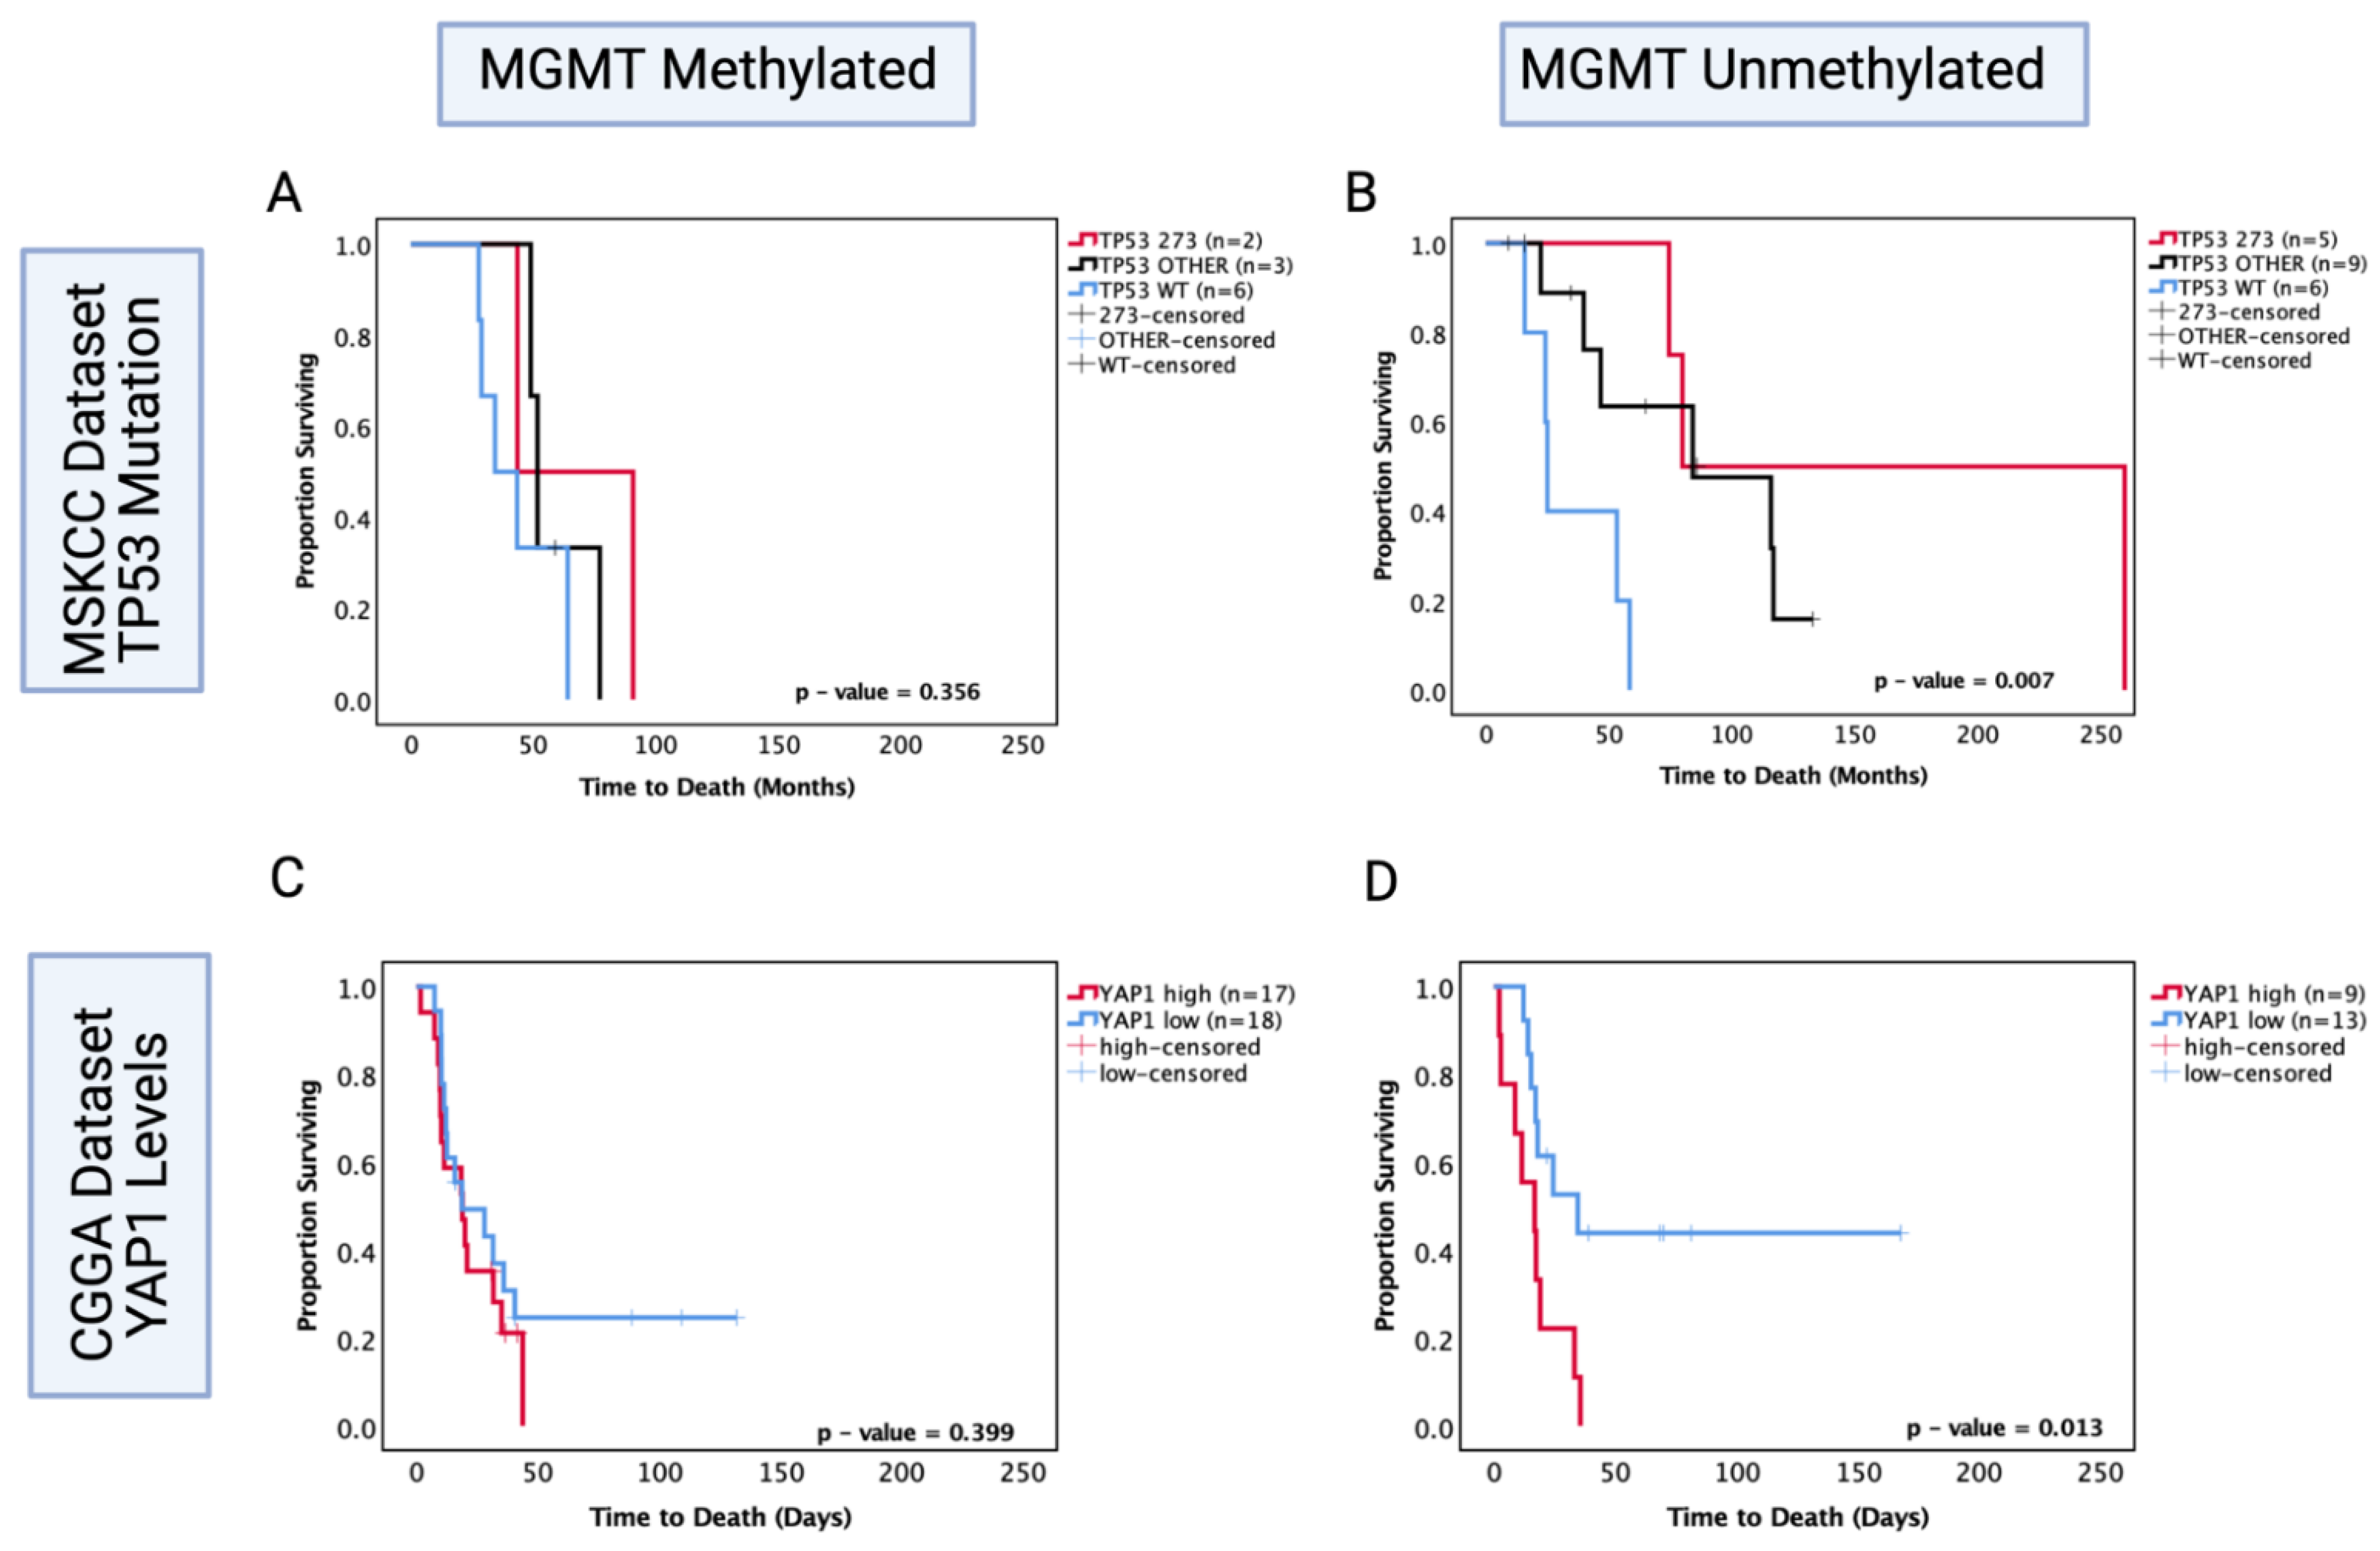
3.10. O6-Methylguanine-DNA Methyltransferase (MGMT) Methylation Status of Astrocytoma Is a Factor in TP53 Mutation/YAP1-Mediated Chemosensitivity

MGMT status is a well-known predictor of chemosensitivity in glioblastoma [47]; thus, in order to understand its role in astrocytoma, we investigated the MSKCC chemotherapy-treated cohort and the CGGA recurrent chemotherapy-treated cohort where the MGMT statuses were known and performed survival analysis based on TP53 mutation and YAP1 mRNA expression levels, respectively. In the MSKCC chemotherapy-treated cohort, the MGMT methylated group showed no significant prognostic effect of TP53 mutation (p > 0.05) (Figure 9A); however, within the MGMT unmethylated group, both other TP53 mutant and codon 273 mutant tumours were associated with a significantly increased OS (other vs. WT median survival: 84.2 mo. vs. 25 mo., HR (95% CI): 0.299 (0.034–0.799), p = 0.0.25; codon 273 vs. WT median survival: 170 mo. vs. 25 mo., HR (95% CI): 0.195 (0.039–0.976), p = 0.004) (Figure 9B). This pattern of effect was mirrored in the CGGA YAP1 survival analysis, where YAP1 mRNA expression was not a significant prognostic marker in the MGMT methylated group (p = 0.399) (Figure 9C); however, low YAP1 mRNA was associated with significantly increased OS in chemotherapy-treated MGMT unmethylated astrocytoma (YAP1 high vs. low median survival: 16.76 mo. vs. 30.5 mo., HR (95% CI): 3.078 (1.052–9.01), p = 0.013) (Figure 9D).
These data suggest that both codon 273 mutation and YAP1 mRNA expression may be prognostic markers for the MGMT unmethylated group of recurrent astrocytoma treated with chemotherapy. Thus, there may be an association between codon 273 mutant astrocytoma and post-chemotherapy YAP1 levels. It is, however, important to validate these findings with a larger cohort size where multivariate analysis can also be conducted. Importantly, LGG clinical trial results can be retrospectively re-analysed to determine whether the responders were MGMT unmethylated with TP53 codon 273 mutations and low YAP1 levels. The findings from this study may, therefore, help to identify the efficacy of chemotherapy treatment based on molecular markers and make LGG therapeutic approaches more targeted.

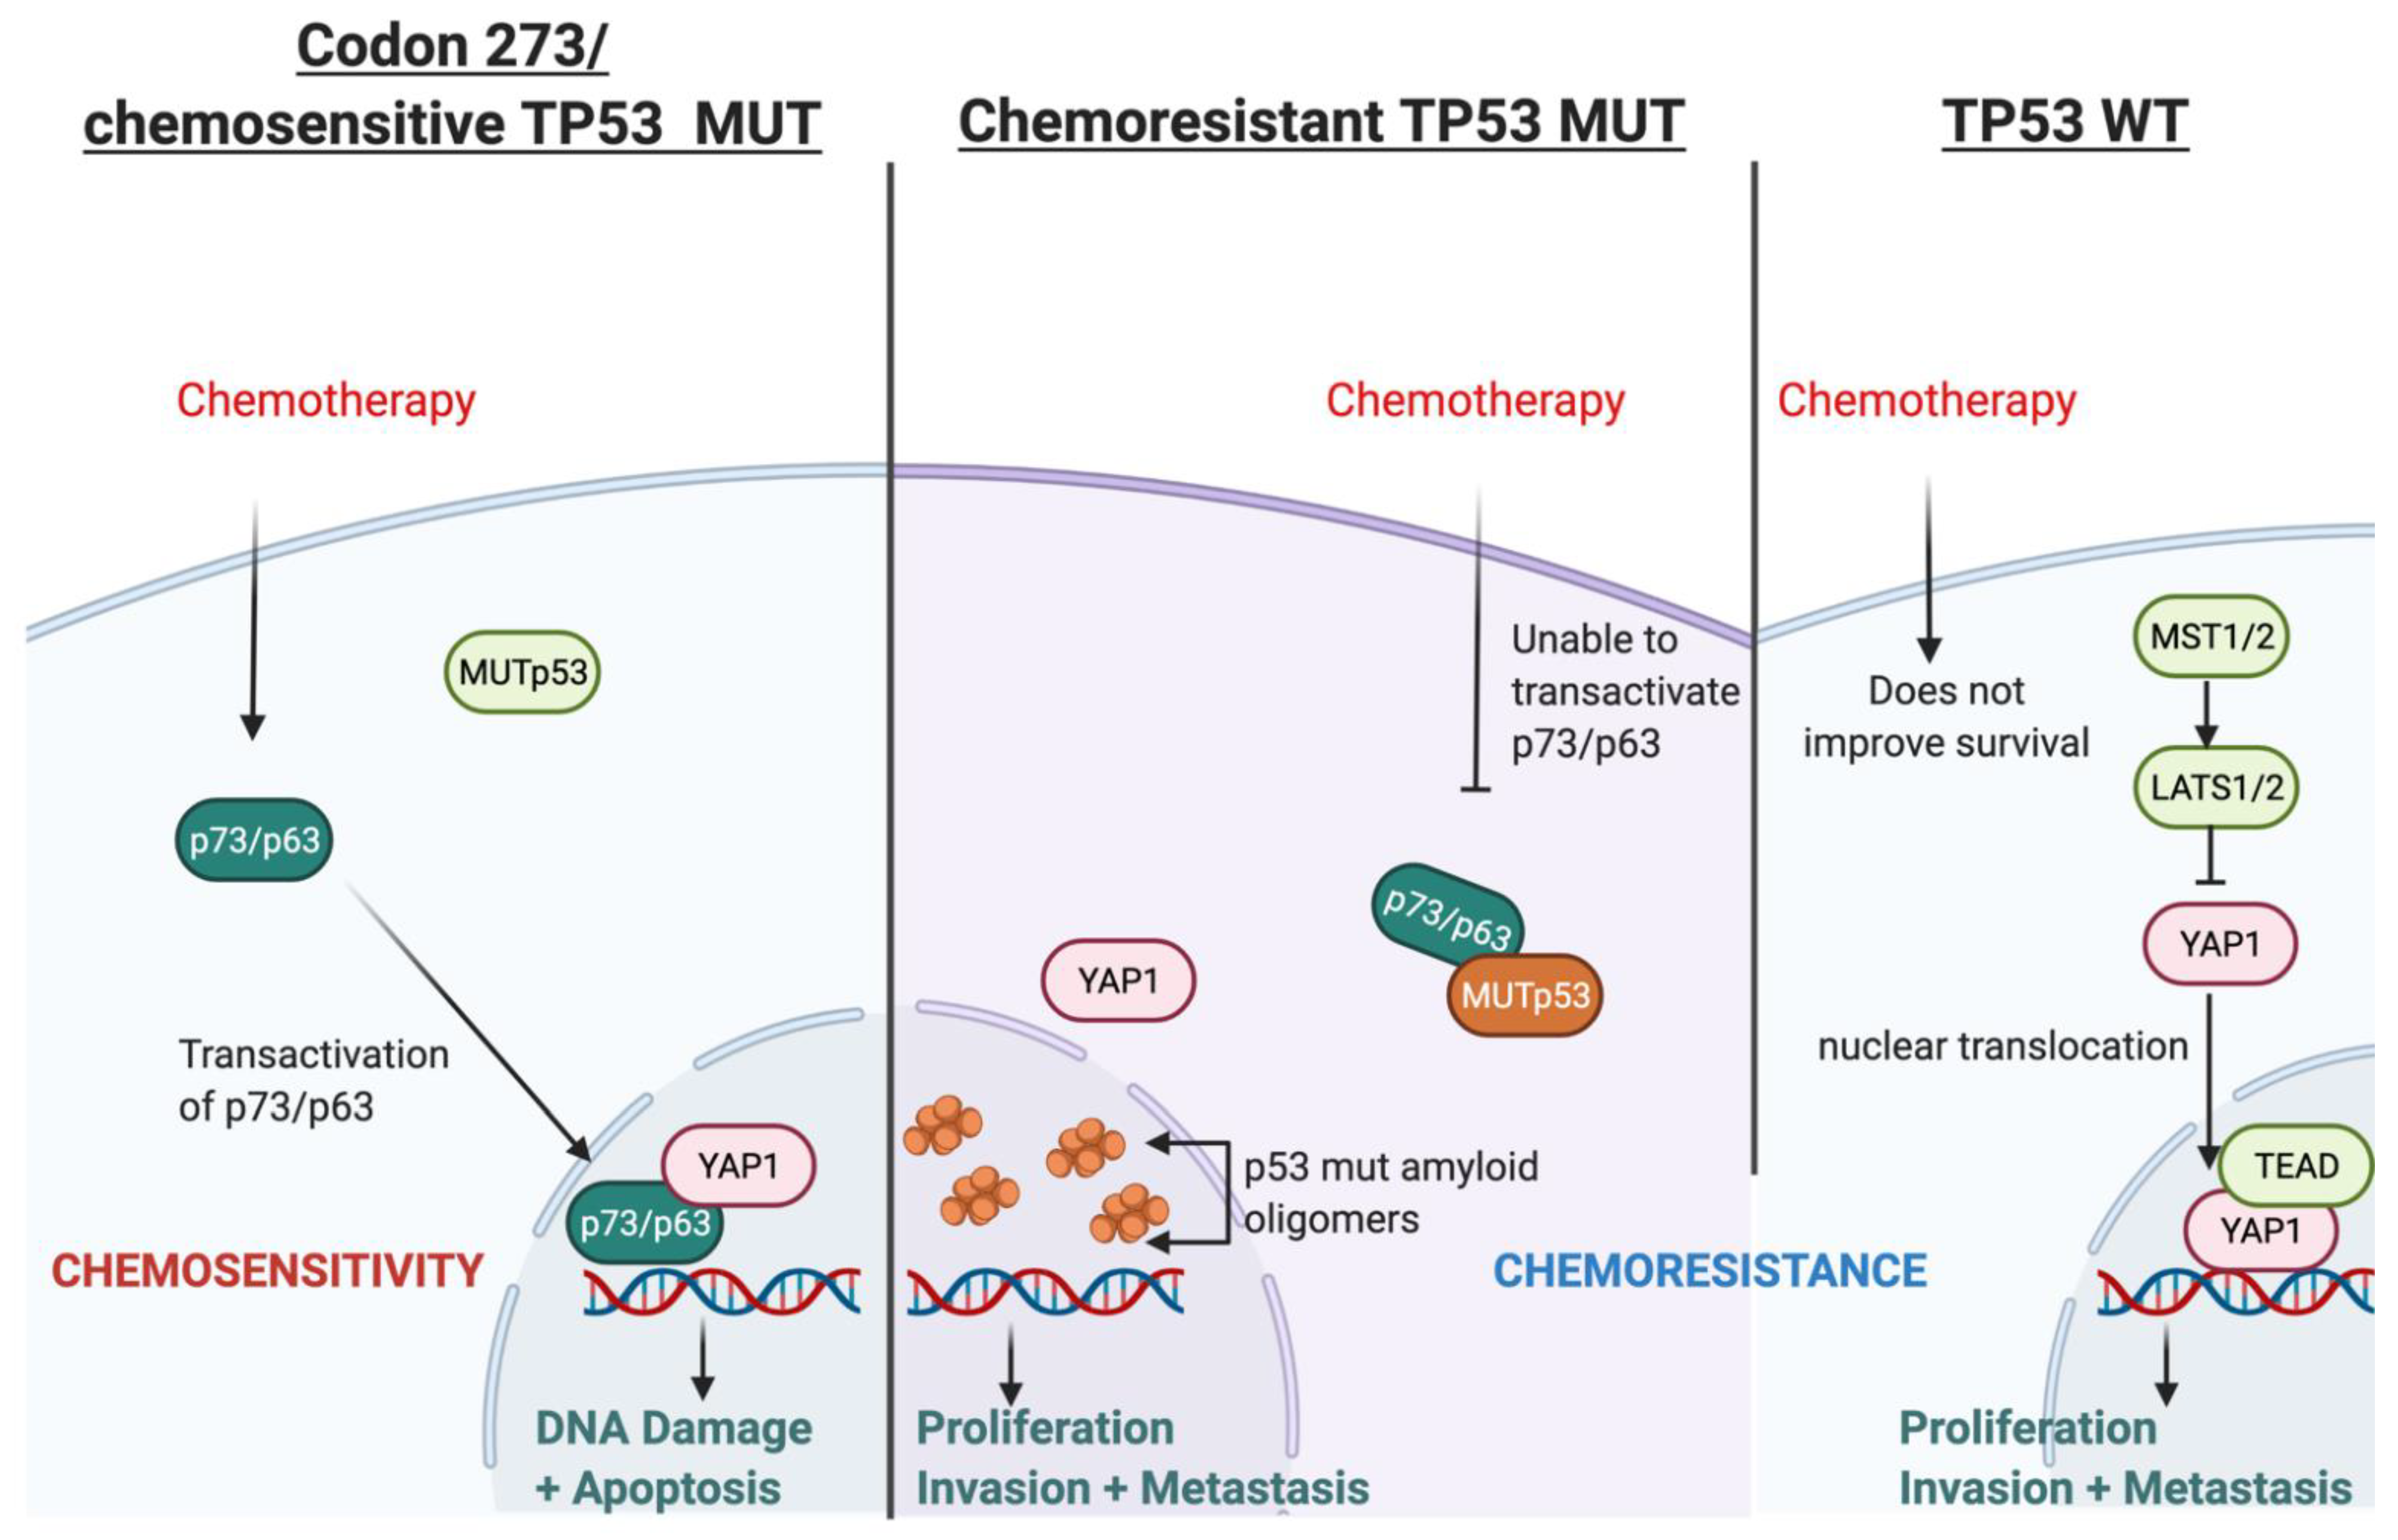
3.11. Possible Mechanism for TP53-Mutation-Dependent Chemosensitivity in Astrocytoma

Based on our findings and the current literature, we present a hypothetical mechanism of action of TP53-mutation-dependent chemosensitivity in Figure 10, which may involve p73/p63-YAP1-complex-mediated chemosensitivity. Two alternative promoters of TP63 and TP73 lead to different protein variants of p63 and p73: transactivating (TA) isoforms or N isoforms, ΔN-p63 and ΔN-p73, (that lack the N-terminal transactivating domain). The TA proteins, TAp63 or TAp73, retain the tumour-suppressive features activating tumour suppressive genes common to those transactivated by p53. In contrast, the N isoforms can inhibit tumour suppression and act as oncoproteins [48]. Chemotherapy can upregulate the levels of TA proteins and downregulate the N isoforms [49]. The DNA damage response (DDR), induced by chemotherapy, leads to the acetylation and phosphorylation of E2F1, which then upregulates TAp73 expression through the P1 promoter. Various other mechanisms of DDR-dependent TAp73 activation have also been reported [41]. TAp73 then induces apoptosis following genotoxic treatments [50]. On the other hand, ΔN-p63 induces chemo- and radio-resistance in head and neck squamous cell carcinomas via the suppression of p73 [51]; in breast cancer cell lines, the release of TA-p73 is required from ΔN-p63 to enable cisplatin response since ΔN-p63 binds to TA-p73 to inhibit its pro-apoptotic features. Cisplatin dissociates the ΔN-p63/TA-p73 complex via c-Abl-dependent phosphorylation, enabling TAp73 to induce apoptosis [52]. DDR can be induced by temozolomide, a standard chemotherapy for patients diagnosed with astrocytoma (and glioblastoma). This DDR can lead to the transactivation of p63 (TA-p63), thereby suppressing glioblastoma growth and invasion in vitro, which also correlates with a favourable prognosis in GBM [53]. The ratio of ΔN/TA-p73 is a crucial factor in the pro-apoptotic ability of p73 and, ultimately, the efficacy of chemotherapy [54,55].
The type of TP53 mutation is an important factor in this mechanism because certain TP53 mutations can inhibit the transactivation of p63 and p73 [56,57,58,59] and affect chemosensitivity [60]; however, TP53 mutation in codon 273 neither binds to nor inhibits the transcriptional activity of p63/p73 [59,61]. This has been shown in vitro, where codon 273 mutant glioma cells lines were more chemosensitive compared with TP53 WT cell lines [62,63]. The poorest survival of TP53 WT astrocytoma in our cohort may relate to this. Furthermore, the accumulation of mutant p53 amyloid oligomers associated with chemoresistance is not present in the codon 273 mutant cell line, whereas increased mutant p53 amyloid oligomers were observed in cells with other TP53 mutations [64]. Collectively, these reports indicate that certain TP53 mutations can cause chemoresistance, while TP53 codon 273 mutation may be associated with chemosensitivity. This may explain the improved clinical outcomes of codon 273 mutant astrocytoma observed in our survival analysis, although it is important to note that these studies were conducted predominantly in glioblastoma and in vitro studies for LGG are warranted to confirm this hypothesis.
YAP1 may be critically involved in this hypothesised chemosenstivity mechanism because it is a transcriptional co-activator of TAp73 and it may also form complexes with TAp73 to promote apoptosis [41]. These complexes activated apoptosis in a range of cancers following treatment [44,45,46]. YAP1 has also been shown to stabilise p73 in response to chemotherapy to induce apoptosis [42]. Thus, it is a possible chemosensitivity mechanism in codon 273 mutant astrocytomas.
We have consistently observed decreased survival in TP53 WT astrocytoma patients, which may be related to chemoresistance in this group. The transactivation of p73/p63 status is unknown in TP53 WT. However, our analysis showed that gene expression of the Hippo Signalling pathway is upregulated in the TP53 WT group of TCGA astrocytoma, and PPI analysis showed that the YAP1 high group (which was also associated with significantly decreased OS) was enriched for YAP1–TEAD complexes (Supplementary File 4: Figure S3) that drive transcription and proliferation [65]. This is strongly supported by the GO, DisGenNet and KEGG pathway analyses of this group (Supplementary File 4: Figure S3). Moreover, YAP1 does not bind with WT p53 [66,67]; hence, it may be available for YAP1–TEAD nuclear complex formation. Thus, the YAP1–TEAD nuclear complex may counteract the effect of chemotherapy by driving cellular proliferation in TP53 WT astrocytoma. There is also evidence that p53 and YAP1 cooperate in chemotherapy efficacy, with direct binding of YAP1 and p53 to each other’s promoters, increasing their expression in response to chemotherapy in hepatocellular carcinoma cells [68]. YAP1 can thus affect chemosensitivity through the modulation of p53 [69], which may also depend on p53 mutation status and mutation type. The spectrum of modalities through which YAP1 interacts, affects and coordinates with p53, p63 and p73 has been reviewed thoroughly [70]. YAP1 can direct the tumour fate to either proliferation and tumourigenesis (by binding with TEAD in the nucleus and promoting cell survival) [65] or to apoptosis (by interacting/coordinating with p53/p63/p73) [45,71]. Our data supports this, suggesting that the cellular YAP1 switch may be strongly dependent on p53 mutation status and type. However, the dynamics between YAP1 and TP53 post-chemotherapy and this putative mechanism should be validated through well-designed experimental in vitro studies, which is beyond the scope of this paper.

4. Discussion

TP53 is a pivotal gene that is extensively researched across all cancer types due to the high prevalence of TP53 mutations. In LGG, TP53 mutations have been reported to be prevalent, particularly in astrocytoma [20,72], which we confirmed in this study. We found that all TP53 mutations occurred in the region of exons 4 to 8, which is in line with the hotspot region identified in literature [73,74]. The prevalence of TP53 mutation in astrocytoma (60%) was also similar to previous findings (50–75%) [19,20]. We have found a high prevalence of 18% TP53 mutation in our oligodendroglioma cohort (9/50), while previous studies have reported up to 34% [19,20]. The significant correlation between IDH1 mutation and TP53 mutation is concordant with previous reports [74,75].
Due to the difference in OS between astrocytoma and oligodendroglioma (also confirmed in this study) [76] and the distinct genetic and epigenetic features in these LGG subtypes [77,78,79,80], it is critical to perform separate survival analyses for each histological type. When the original investigations of TP53 mutation as a prognostic factor in glioma were published between 1991 and 1999 [26,81,82,83,84,85,86,87,88,89], the molecular classifiers of LGG (1p/19q co-deletion, ATRX loss and IDH1/2 mutations) were not well-established enough to allow LGG sub-typing [90,91,92]. Thus, older studies commonly analysed combined cohorts of either ‘LGG’ or ‘gliomas’ (that also included the much more aggressive glioblastoma) [20,26,73,74,85] and concluded that there was no prognostic effect of TP53 in LGG or TP53 mutant cases corresponding to a decreased OS. These results can be attributed to the higher prevalence of TP53 mutation in astrocytoma, together with the significantly shorter OS of astrocytoma, compared to oligodendroglioma.
In our study of 102 LGG specimens, separate survival analysis was performed for astrocytoma and oligodendroglioma, and only confirmed ‘pathogenic’ mutations were considered for the analyses. Hotspot mutations were accounted for in the survival analysis, which will be discussed later in this discussion. The results comparing combined TP53 mutant vs. TP53 WT patients showed significantly increased OS for TP53 mutant astrocytoma patients. Survival analysis of the TCGA astrocytoma dataset confirmed our findings. In LGG, this is the first report of TP53 mutation being a favourable prognostic factor, although this was reported previously in other cancers, including glioblastoma [93,94], sarcomas [95], ovarian serous cystadenocarcinoma [96] and cervical cancer [97]. In multivariate analysis adjusting for IDH1 mutation, age, gender and tumour grade, the combined TP53 mutation showed a trend for improved survival compared to WT, leading us to believe there are specific TP53 mutations accounting for the improved survival in the univariate analysis. We thus investigated specific hotspot TP53 mutations.
Hotspot mutations in TP53 codon 273 were found in 33% of astrocytoma tumours in our cohort. These codon 273 mutations have been reported in LGG cohorts previously [84,98,99,100,101]. TP53 codon 273 mutations are hotspot mutations reported frequently in other cancers. R273H and R273C are contact mutations in the DNA-binding domain that disrupt DNA contact points by changing the structure of the protein and ultimately prevent DNA binding [102]. In the current study, we showed that in the cohort of astrocytoma, TP53 codon 273 mutations were significantly associated with prolonged OS compared to WT in both univariate and multivariate analysis. It is possible that codon 273 mutation (along with other TP53 mutations that may have behaved similarly, such as the codon 273 mutations) has contributed to the trend for the improved survival effect of the combined pathogenic TP53 mutations observed in our analysis.
A number of more recent studies have performed separate analyses for the histological sub-types and found no significant prognostic effect of TP53 status [20,103]. These studies used smaller or equal sized cohorts to our current study, and they did not incorporate TP53 mutation ‘pathogenic status’ in their survival analysis. Moreover, according to our findings, the frequency of TP53 codon 273 mutations in their cohorts may have affected their survival results. Interestingly, the most recent prognostic investigation of TP53 in adult LGG (cohort size, n = 61) [19] did not have any tumour harbouring a mutation in codon 273, which we found to be a hotspot mutation in our cohort. Moreover, due to the smaller number of astrocytoma in this published cohort (n = 8), the cohort was analysed as a combined cohort of ‘LGG’, and the study showed no significant prognostic effect of TP53 mutation. These examples suggest that cohort size, distribution of histological types, inclusion of ‘pathogenic’ mutations, and frequency of specific hotspot mutations in the cohorts play a crucial role in determining the prognostic value of the TP53 mutations.
To our knowledge, only one group, Peraud et al., has performed PFS analysis on LGG based on different TP53 codons, where they reported that PFS depended on the specific codon of TP53 mutation. Interestingly their study showed that codon 273 mutants had significantly increased PFS compared to codon 175 mutants [101]. However, TP53-WT cases were not included in the PFS analysis, and no codon-based OS analysis was performed. Additionally, their cohort included ‘oligoastrocytoma’, which is now considered a misdiagnosis of either oligodendroglioma or astrocytoma.
The MSKCC and TCGA datasets were analysed to confirm our findings, both of which showed that TP53 mutations (codon 273 and other) were significantly associated with increased OS and PFS. This is the first report of a specific TP53 codon mutation carrying OS and PFS prognostic value in adult LGG. Interestingly, a study of GBM (n = 108) reported significantly favourable prognosis for TP53 mutant GBM patients (n = 28). Further analysis of these data showed that the most frequent TP53 mutations in their cohort were in codon 273 [93].
In oligodendroglioma, we found TP53 mutation was associated with a significantly decreased OS in the current cohort using univariate and multivariate analyses. The TCGA dataset did not corroborate with this; however, specifically, codon 273 mutation was associated with a significantly decreased OS in both univariate and multivariate analyses of the TCGA oligodendroglioma cohort. The opposite prognostic effect of TP53 mutation in oligodendroglioma compared to astrocytoma represents the critical molecular and mechanistic differences between the two histological sub-types and emphasises the need to analyse these sub-types as separate cohorts in transcriptomic and survival studies.
Our investigation showed that codon 273 mutant astrocytomas may be more chemosensitive compared to TP53 WT as the OS of codon 273 mutant astrocytoma was significant longer in the chemotherapy-treated group, but not in the ‘no-chemotherapy’ group in two independent cohorts. YAP1, which has been previously shown to play a role in inducing sensitivity to treatment [44,45,46], correlated with TP53 expression in the chemotherapy-treated group of LGG only, suggesting the possibility of modulated interactions between p53 and YAP1 post-chemotherapy. Supporting these findings, we found that YAP1 expression was an independent prognostic factor in the chemotherapy-treated group of astrocytoma only. In a study of 117 glioma tissues, high YAP1 protein expression was previously correlated with more aggressive glioma phenotypes and survival. However, it is unclear whether these tissues were from primary or recurrent tumours [104]. It is important to analyse recurrent tumours post-chemotherapy to identify fate-driving transcriptomic changes post-treatment. Our findings suggest a role for YAP1 (and the interactions of YAP1 and TP53) in chemotherapy efficacy, and we presented a hypothesised chemosensitivity mechanism involving TP53-mutation-type-dependent modulation of TAp63/p73 and YAP1, leading to divergent chemotherapeutic outcomes, which will be explored and validated by our team in future studies. DEG, GO, KEGG pathway and DisGenNet analysis of recurrent chemotherapy-treated astrocytoma also supported our proposed mechanism of chemosensitivity. A limitation in this study, however, is the inability to understand the effect of radiotherapy since it was administered both with/without chemotherapy. However, our data showed consistent results when stratified by chemotherapy status only, suggesting that chemotherapy efficacy is more dominantly associated with the molecular markers investigated compared to radiotherapy.
We further observed the potential role of MGMT methylation in this study as YAP1 mRNA expression and codon 273 mutation were particularly prognostic in the MGMT unmethylated sub-group of astrocytoma patients treated with chemotherapy. Thus, we identified a TP53-mutation-dependent and YAP1-level-dependent chemosensitive sub-group within MGMT unmethylated astrocytoma. This is interesting because MGMT methylation has been significantly associated with certain types of TP53 mutation in astrocytoma [105], yet again hinting a possible link between TP53 mutation type and YAP1-mediated chemosensitivity. Validation with a larger cohort or retrospective analysis of past clinical trials may provide more definitive data to aid effective chemotherapeutic treatment decisions in astrocytoma.
In summary, this study reports for the first time the improved prognostic significance of TP53 mutation status in adult LGG and also the importance of considering the effect of specific TP53 mutation types/codon-wise mutations. The hotspot TP53 codon 273 mutations were associated with prolonged survival in astrocytoma patients compared with TP53 WT and other TP53 mutations.

5. Conclusions

For many years, the prognostic role of TP53 mutation in LGG has been unclear. Recent knowledge of molecular features, access to mutation databases and considerably large cohorts have enabled this study to uncover the significant prognostic role of TP53 in astrocytoma. We conclude that TP53 plays an important role in astrocytoma biology and treatment response, and TP53 mutation types can have diverse effects in gliomagenesis post-treatment. Furthermore, we identified sub-groups (codon 273 mutant and/or low YAP1 level) of MGMT unmethylated recurrent chemotherapy-treated astrocytoma that responded well to chemotherapy. Our data also suggest that TP53 WT astrocytoma tumours, which did not respond well to chemotherapy, need new targeted treatments to improve the unfavourable OS. Developing better treatments for recurrent tumours is vital in prolonging the OS of astrocytoma patients, and obtaining and analysing transcriptomic data of recurrent tumours will be a practical approach to aid in this process.
Retrospective genetic analysis of drug responders and non-responders in clinical trials can elucidate the chemosensitivity score of codon 273 mutant astrocytoma patients. There is a lack of specialised and targeted treatment options for recurrent astrocytoma; hence, the development of therapeutic options for this group is key to prolonging survival. Our data suggest that YAP1 should be further investigated as a potential druggable target in the sub-group of recurrent chemotherapy-treated MGMT unmethylated astrocytoma.

Supplementary Materials

The following are available online at https://www.mdpi.com/article/10.3390/cancers13215362/s1, Supplementary File 1 in Table S1: PCR conditions and primer sequences for TP53 sequencing. Supplementary File 2 in Figure S1: Kaplan–Meier survival curves stratified by (A) IDH1 mutation status, (B) type of LGG, and (C) TP53 mutation status for the combined cohort of astrocytoma and oligodendroglioma. Supplementary File 3 in Figure S2: Volcano plot portraying differentially expressed genes between YAP1 high and YAP1 low groups in CGGA recurrent chemotherapy-treated astrocytoma. Supplementary File 4 in Figure S3: GO enrichment terms of differentially expressed genes, KEGG pathway, and DisGenNet analysis of YAP1 low (A,C,E) and YAP1 high (B,D,F), respectively. Top three PPI network modules of YAP1 low (G) and YAP1 high groups (H).

Author Contributions

Conceptualisation: K.L.M., J.H., O.V. and H.N.; Methodology: H.N.; Investigation: H.N.; Formal analysis, Visualisation and Validation: H.N. and N.E.B.; Writing—Original Draft Preparation: H.N.; Writing—Review and Editing: O.V., J.H. and H.N.; Funding Acquisition: K.L.M.; Supervision: K.L.M., J.H. and O.V.. All authors have read and agreed to the published version of the manuscript.

Funding

This research was funded by the Higher Thinking Fund and Cure Brain Cancer Foundation Australia.

Institutional Review Board Statement

Ethics approval for this study was received from the University of New South Wales Human Research Advisory Executive Panel (Approval code: HC190501). Informed consent was obtained from all subjects involved in the study.

Informed Consent Statement

Informed consent was obtained from all subjects involved in the study.

Data Availability Statement

The datasets generated and analysed in this study are available from the corresponding author.

Acknowledgments

We thank the Commonwealth Australian Government Research Training Program Scholarship and Higher Thinking Fund for funding the Ph.D of H.N. We also thank the Steve and Lynette Waugh Brain Tumour Biobank for the access to LGG samples and STATS Central UNSW for their contribution to the statistical analysis for the paper.

Conflicts of Interest

The authors declare no conflict of interest. The funders had no role in the design of the study; in the collection, analyses, or interpretation of data; in the writing of the manuscript, or in the decision to publish the results.

References

  1. Miller, J.J.; Wen, P.Y. Emerging targeted therapies for glioma. Expert Opin. Emerg. Drugs 2016, 21, 441–452. [Google Scholar] [CrossRef]
  2. Ostrom, Q.T.; Patil, N.; Cioffi, G.; Waite, K.; Kruchko, C.; Barnholtz-Sloan, J.S. CBTRUS Statistical Report: Primary Brain and Other Central Nervous System Tumors Diagnosed in the United States in 2013–2017. Neuro-Oncology 2020, 22, iv1–iv96. [Google Scholar] [CrossRef]
  3. Claus, E.B.; Walsh, K.; Wiencke, J.K.; Molinaro, A.M.; Wiemels, J.L.; Schildkraut, J.M.; Bondy, M.L.; Berger, M.S.; Jenkins, R.B.; Wrensch, M. Survival and low-grade glioma: The emergence of genetic information. Neurosurg. Focus 2015, 38, E6. [Google Scholar] [CrossRef] [PubMed]
  4. Stupp, R.; Hegi, M.; Gilbert, M.R.; Chakravarti, A. Chemoradiotherapy in Malignant Glioma: Standard of Care and Future Directions. J. Clin. Oncol. 2007, 25, 4127–4136. [Google Scholar] [CrossRef]
  5. Bush, N.A.O.; Chang, S. Treatment Strategies for Low-Grade Glioma in Adults. J. Oncol. Pr. 2016, 12, 1235–1241. [Google Scholar] [CrossRef] [PubMed]
  6. Yan, H.; Parsons, D.W.; Jin, G.; McLendon, R.; Rasheed, B.A.; Yuan, W.; Kos, I.; Batinic-Haberle, I.; Jones, S.; Riggins, G.J.; et al. IDH1 and IDH2 Mutations in Gliomas. N. Engl. J. Med. 2009, 360, 765–773. [Google Scholar] [CrossRef] [PubMed]
  7. Cho, Y.S.; Levell, J.R.; Liu, G.; Caferro, T.; Sutton, J.; Shafer, C.M.; Costales, A.; Manning, J.R.; Zhao, Q.; Sendzik, M.; et al. Discovery and Evaluation of Clinical Candidate IDH305, a Brain Penetrant Mutant IDH1 Inhibitor. ACS Med. Chem. Lett. 2017, 8, 1116–1121. [Google Scholar] [CrossRef] [PubMed]
  8. Mellinghoff, I.K.; Touat, M.; Maher, E.; De La Fuente, M.; Cloughesy, T.F.; Holdhoff, M.; Cote, G.M.; Burris, H.; Janku, F.; Huang, R.; et al. ACTR-46. AG-120, A FIRST-IN-class Mutant IDH1 Inhibitor in Patients with Recurrent or Progressive IDH1 Mutant Glioma: Updated Results from the Phase 1 Non-Enhancing Glioma Population. Neuro-Oncology 2017, 19, vi10–vi11. [Google Scholar] [CrossRef]
  9. Kopinja, J.; Sevilla, R.S.; Levitan, D.; Dai, D.; Vanko, A.; Spooner, E.; Ware, C.; Forget, R.; Hu, K.; Kral, A.; et al. A Brain Penetrant Mutant IDH1 Inhibitor Provides In Vivo Survival Benefit. Sci. Rep. 2017, 7, 13853. [Google Scholar] [CrossRef] [PubMed] [Green Version]
  10. Matsunaga, H.; Machida, Y.; Nakagawa, M.; Yamaguchi, M.; Ogawara, Y.; Shima, Y.; Yamagata, K.; Katsumoto, T.; Hattori, A.; Itoh, M.; et al. Characterization of a novel BBB-permeable mutant IDH1 inhibitor, DS-1001b. Ann. Oncol. 2019, 30, v145–v146. [Google Scholar] [CrossRef]
  11. Natsume, A.; Wakabayashi, T.; Miyakita, Y.; Narita, Y.; Mineharu, Y.; Arakawa, Y.; Yamasaki, F.; Sugiyama, K.; Hata, N.; Muragaki, Y.; et al. Phase I study of a brain penetrant mutant IDH1 inhibitor DS-1001b in patients with recurrent or progressive IDH1 mutant gliomas. J. Clin. Oncol. 2019, 37, 2004. [Google Scholar] [CrossRef]
  12. National Cancer Genome Atlas Research; Brat, D.J.; Verhaak, R.G.; Aldape, K.D.; Yung, W.K.; Salama, S.R.; Cooper, L.A.; Rheinbay, E.; Miller, C.R.; Vitucci, M.; et al. Comprehensive, Integrative Genomic Analysis of Diffuse Lower-Grade Gliomas. N. Engl. J. Med. 2015, 372, 2481–2498. [Google Scholar] [CrossRef] [Green Version]
  13. Louis, D.N.; Perry, A.; Reifenberger, G.; von Deimling, A.; Figarella-Branger, D.; Cavenee, W.K.; Ohgaki, H.; Wiestler, O.D.; Kleihues, P.; Ellison, D.W. The 2016 World Health Organization Classification of Tumors of the Central Nervous System: A summary. Acta Neuropathol. 2016, 131, 803–820. [Google Scholar] [CrossRef] [PubMed] [Green Version]
  14. Takami, H.; Yoshida, A.; Fukushima, S.; Arita, H.; Matsushita, Y.; Nakamura, T.; Ohno, M.; Miyakita, Y.; Shibui, S.; Narita, Y.; et al. Revisiting TP53 Mutations and Immunohistochemistry-A Comparative Study in 157 Diffuse Gliomas. Brain Pathol. 2014, 25, 256–265. [Google Scholar] [CrossRef] [PubMed]
  15. Lane, D.P. Cancer. p53, guardian of the genome. Nature 1992, 358, 15–16. [Google Scholar] [CrossRef]
  16. Binayke, A.; Mishra, S.; Suman, P.; DAS, S.; Chander, H. Awakening the “guardian of genome”: Reactivation of mutant p53. Cancer Chemother. Pharmacol. 2019, 83, 1–15. [Google Scholar] [CrossRef] [PubMed]
  17. Van Meyel, D.J.; Ramsay, D.A.; Casson, A.G.; Keeney, M.; Chambers, A.F.; Cairncross, J.G. p53 Mutation, Expression, and DNA Ploidy in Evolving Gliomas: Evidence for Two Pathways of Progression. J. Natl. Cancer Inst. 1994, 86, 1011–1017. [Google Scholar] [CrossRef]
  18. Zhang, L.; Liu, Y.; Wang, M.; Wu, Z.; Li, N.; Zhang, J.; Yang, C. EZH2-, CHD4-, and IDH-linked epigenetic perturbation and its association with survival in glioma patients. J. Mol. Cell Biol. 2017, 9, 477–488. [Google Scholar] [CrossRef] [PubMed] [Green Version]
  19. Gillet, E.; Alentorn, A.; Doukouré, B.; Mundwiller, E.; Van Thuij, H.; Reijneveld, J.C.; Medina, J.A.M.; Liou, A.; Marie, Y.; Mokhtari, K.; et al. TP53 and p53 statuses and their clinical impact in diffuse low grade gliomas. J. Neuro-Oncol. 2014, 118, 131–139. [Google Scholar] [CrossRef]
  20. Okamoto, Y.; Di Patre, P.-L.; Burkhard, C.; Horstmann, S.; Jourde, B.; Fahey, M.; Schüler, D.; Probst-Hensch, N.M.; Yasargil, M.G.; Yonekawa, Y.; et al. Population-based study on incidence, survival rates, and genetic alterations of low-grade diffuse astrocytomas and oligodendrogliomas. Acta Neuropathol. 2004, 108, 49–56. [Google Scholar] [CrossRef] [PubMed]
  21. Xiong, J.; Liu, Y.; Li, C.; Zhu, J.-J.; Ye, Z.-R.; Mao, Y.; Wang, Y. Loss of heterozygosity of chromosome 1p/19q and p53 protein expression in oligodendroglioma. Chin. J. Pathol. 2009, 38, 445–450. [Google Scholar]
  22. Nayak, A.; Ralte, A.M.; Sharma, M.C.; Singh, V.P.; Mahapatra, A.K.; Mehta, V.S.; Sarkar, C. p53 protein alterations in adult astrocytic tumors and oligodendrogliomas. Neurol. India 2004, 52, 228–232. [Google Scholar] [PubMed]
  23. Hu, X.; Miao, W.; Zou, Y.; Zhang, W.; Zhang, Y.; Liu, H. Expression of p53, epidermal growth factor receptor, Ki-67 and O6-methylguanine-DNA methyltransferase in human gliomas. Oncol. Lett. 2013, 6, 130–134. [Google Scholar] [CrossRef] [Green Version]
  24. Robles, A.; Harris, C.C. Clinical Outcomes and Correlates of TP53 Mutations and Cancer. Cold Spring Harb. Perspect. Biol. 2009, 2, a001016. [Google Scholar] [CrossRef] [PubMed] [Green Version]
  25. Watanabe, T.; Katayama, Y.; Yoshino, A.; Komine, C.; Yokoyama, T. Deregulation of the TP53/p14ARF tumor suppressor pathway in low-grade diffuse astrocytomas and its influence on clinical course. Clin. Cancer Res. 2003, 9, 4884–4890. [Google Scholar] [PubMed]
  26. Kraus, J.A.; Bolln, C.; Wolf, H.K.; Neumann, J.; Kindermann, D.; Fimmers, R.; Forster, F.; Baumann, A.; Schlegel, U. TP53 alterations and clinical outcome in low grade astrocytomas. Genes Chromosom. Cancer 1994, 10, 143–149. [Google Scholar] [CrossRef] [PubMed]
  27. James, C.D.; Galanis, E.; Frederick, L.; Kimmel, D.W.; Cunningham, J.M.; Atherton-Skaff, P.J.; O’Fallon, J.R.; Jenkins, R.B.; Buckner, J.C.; Hunter, S.B.; et al. Tumor suppressor gene alterations in malignant gliomas: Histopathological associations and prognostic evaluation. Int. J. Oncol. 1999, 15, 547–600. [Google Scholar] [CrossRef] [PubMed]
  28. Rasheed, A.; Herndon, J.E.; Stenzel, T.T.; Raetz, J.G.M.; Kendelhardt, J.; Friedman, H.S.; Friedman, A.H.; Bigner, D.D.; Bigner, S.H.; McLendon, R.E. Molecular markers of prognosis in astrocytic tumors. Cancer 2002, 94, 2688–2697. [Google Scholar] [CrossRef] [Green Version]
  29. Arteche-López, A.; Ávila-Fernández, A.; Romero, R.; Riveiro-Álvarez, R.; López-Martínez, M.A.; Giménez-Pardo, A.; Vélez-Monsalve, C.; Gallego-Merlo, J.; García-Vara, I.; Almoguera, B.; et al. Sanger sequencing is no longer always necessary based on a single-center validation of 1109 NGS variants in 825 clinical exomes. Sci. Rep. 2021, 11, 5697. [Google Scholar] [CrossRef]
  30. The TCGA Legacy. Cell 2018, 173, 281–282. [CrossRef] [PubMed]
  31. Jonsson, P.; Lin, A.L.; Young, R.J.; DiStefano, N.M.; Hyman, D.M.; Li, B.T.; Berger, M.F.; Zehir, A.; Ladanyi, M.; Solit, D.B.; et al. Genomic Correlates of Disease Progression and Treatment Response in Prospectively Characterized Gliomas. Clin. Cancer Res. 2019, 25, 5537–5547. [Google Scholar] [CrossRef] [Green Version]
  32. Wang, Y.; Qian, T.; You, G.; Peng, X.; Chen, C.; You, Y.; Yao, K.; Wu, C.; Ma, J.; Sha, Z.; et al. Localizing seizure-susceptible brain regions associated with low-grade gliomas using voxel-based lesion-symptom mapping. Neuro-Oncology 2014, 17, 282–288. [Google Scholar] [CrossRef] [PubMed] [Green Version]
  33. Liu, X.; Li, Y.; Qian, Z.; Sun, Z.; Xu, K.; Wang, K.; Liu, S.; Fan, X.; Li, S.; Zhang, Z.; et al. A radiomic signature as a non-invasive predictor of progression-free survival in patients with lower-grade gliomas. NeuroImage Clin. 2018, 20, 1070–1077. [Google Scholar] [CrossRef] [PubMed]
  34. Pan, D. The Hippo Signaling Pathway in Development and Cancer. Dev. Cell 2010, 19, 491–505. [Google Scholar] [CrossRef] [PubMed] [Green Version]
  35. Zeng, R.; Dong, J. The Hippo Signaling Pathway in Drug Resistance in Cancer. Cancers 2021, 13, 318. [Google Scholar] [CrossRef] [PubMed]
  36. Badouel, C.; McNeill, H. SnapShot: The Hippo Signaling Pathway. Cell 2011, 145, 484–484.e1. [Google Scholar] [CrossRef] [PubMed] [Green Version]
  37. Chen, E.Y.; Tan, C.M.; Kou, Y.; Duan, Q.; Wang, Z.; Meirelles, G.V.; Clark, N.R.; Ma’Ayan, A. Enrichr: Interactive and collaborative HTML5 gene list enrichment analysis tool. BMC Bioinform. 2013, 14, 128. [Google Scholar] [CrossRef] [PubMed] [Green Version]
  38. Shannon, P.; Markiel, A.; Ozier, O.; Baliga, N.S.; Wang, J.T.; Ramage, D.; Amin, N.; Schwikowski, B.; Ideker, T. Cytoscape: A Software Environment for Integrated Models of Biomolecular Interaction Networks. Genome Res. 2003, 13, 2498–2504. [Google Scholar] [CrossRef] [PubMed]
  39. Bader, G.D.; Hogue, C.W.V. An automated method for finding molecular complexes in large protein interaction networks. BMC Bioinform. 2003, 4, 2–27. [Google Scholar] [CrossRef] [PubMed] [Green Version]
  40. Alentorn, A.; Van Thuijl, H.F.; Marie, Y.; Alshehhi, H.; Carpentier, C.; Boisselier, B.; Laigle-Donadey, F.; Mokhtari, K.; Scheinin, I.; Wesseling, P.; et al. Clinical value of chromosome arms 19q and 11p losses in low-grade gliomas. Neuro-Oncology 2013, 16, 400–408. [Google Scholar] [CrossRef] [PubMed] [Green Version]
  41. Costanzo, A.; Pediconi, N.; Narcisi, A.; Guerrieri, F.; Belloni, L.; Fausti, F.; Botti, E.; Levrero, M. TP63andTP73in cancer, an unresolved “family” puzzle of complexity, redundancy and hierarchy. FEBS Lett. 2014, 588, 2590–2599. [Google Scholar] [CrossRef] [PubMed] [Green Version]
  42. Donzelli, S.; Strano, S.; Blandino, G. YAP and p73: A Matter of Mutual Specificity in Tumor Suppression. In The Hippo Signaling Pathway and Cancer; Oren, M., Aylon, Y., Eds.; Springer: New York, NY, USA, 2013; Volume 1, pp. 147–172. [Google Scholar] [CrossRef]
  43. Keshet, R.; Adler, J.; Ricardo-Lax, I.; Shanzer, M.; Porat, Z.; Reuven, N.; Shaul, Y. c-Abl antagonizes the YAP oncogenic function. Cell Death Differ. 2014, 22, 935–945. [Google Scholar] [CrossRef] [PubMed] [Green Version]
  44. Cottini, F.; Anderson, K.C.; Tonon, G. Awakening the Hippo co-activator YAP1, a mercurial cancer gene, in hematologic cancers. Mol. Cell. Oncol. 2014, 1, e970055. [Google Scholar] [CrossRef] [PubMed] [Green Version]
  45. Matallanas, D.; Romano, D.; Yee, K.; Meissl, K.; Kucerova, L.; Piazzolla, D.; Baccarini, M.; Vass, J.K.; Kolch, W.; O’Neill, E. RASSF1A Elicits Apoptosis through an MST2 Pathway Directing Proapoptotic Transcription by the p73 Tumor Suppressor Protein. Mol. Cell 2007, 27, 962–975. [Google Scholar] [CrossRef] [Green Version]
  46. Lapi, E.; Di Agostino, S.; Donzelli, S.; Gal, H.; Domany, E.; Rechavi, G.; Pandolfi, P.P.; Givol, D.; Strano, S.; Lu, X.; et al. PML, YAP, and p73 Are Components of a Proapoptotic Autoregulatory Feedback Loop. Mol. Cell 2008, 32, 803–814. [Google Scholar] [CrossRef] [PubMed]
  47. Hegi, M.E.; Diserens, A.-C.; Gorlia, T.; Hamou, M.-F.; De Tribolet, N.; Weller, M.; Kros, J.M.; Hainfellner, J.A.; Mason, W.; Mariani, L.; et al. MGMT Gene Silencing and Benefit from Temozolomide in Glioblastoma. N. Engl. J. Med. 2005, 352, 997–1003. [Google Scholar] [CrossRef] [Green Version]
  48. Candi, E.; Agostini, M.; Melino, G.; Bernassola, F. How the TP53 Family ProteinsTP63andTP73Contribute to Tumorigenesis: Regulators and Effectors. Hum. Mutat. 2014, 35, 702–714. [Google Scholar] [CrossRef] [PubMed]
  49. Katoh, I.; Aisaki, K.-I.; Kurata, S.-I.; Ikawa, S.; Ikawa, Y. p51A (TAp63γ), a p53 homolog, accumulates in response to DNA damage for cell regulation. Oncogene 2000, 19, 3126–3130. [Google Scholar] [CrossRef] [PubMed] [Green Version]
  50. Muller, M.; Schilling, T.; Sayan, A.E.; Kairat, A.; Lorenz, K.; Schulze-Bergkamen, H.; Oren, M.; Koch, A.; Tannapfel, A.; Stremmel, W.; et al. TAp73/ΔNp73 influences apoptotic response, chemosensitivity and prognosis in hepatocellular carcinoma. Cell Death Differ. 2005, 12, 1564–1577. [Google Scholar] [CrossRef] [PubMed]
  51. Rocco, J.W.; Leong, C.-O.; Kuperwasser, N.; DeYoung, M.P.; Ellisen, L.W. p63 mediates survival in squamous cell carcinoma by suppression of p73-dependent apoptosis. Cancer Cell 2006, 9, 45–56. [Google Scholar] [CrossRef] [PubMed] [Green Version]
  52. Leong, C.-O.; Vidnovic, N.; Deyoung, M.P.; Sgroi, D.; Ellisen, L.W. The p63/p73 network mediates chemosensitivity to cisplatin in a biologically defined subset of primary breast cancers. J. Clin. Investig. 2007, 117, 1370–1380. [Google Scholar] [CrossRef]
  53. Yamaki, T.; Suenaga, Y.; Iuchi, T.; Alagu, J.; Takatori, A.; Itami, M.; Araki, A.; Ohira, M.; Inoue, M.; Kageyama, H.; et al. Temozolomide suppresses MYC via activation of TAp63 to inhibit progression of human glioblastoma. Sci. Rep. 2013, 3, 1160. [Google Scholar] [CrossRef] [PubMed]
  54. Irwin, M.S.; Kondo, K.; Marin, M.C.; Cheng, L.S.; Hahn, W.C.; Kaelin, W.G. Chemosensitivity linked to p73 function. Cancer Cell 2003, 3, 403–410. [Google Scholar] [CrossRef] [Green Version]
  55. Lunghi, P.; Costanzo, A.; Mazzera, L.; Rizzoli, V.; Levrero, M.; Bonati, A. The p53 Family Protein p73 Provides New Insights into Cancer Chemosensitivity and Targeting. Clin. Cancer Res. 2009, 15, 6495–6502. [Google Scholar] [CrossRef] [Green Version]
  56. Di Como, C.J.; Gaiddon, C.; Prives, C. p73 Function Is Inhibited by Tumor-Derived p53 Mutants in Mammalian Cells. Mol. Cell. Biol. 1999, 19, 1438–1449. [Google Scholar] [CrossRef] [PubMed] [Green Version]
  57. Irwin, M.; Marín, M.C.; Phillips, A.C.; Seelan, R.S.; Smith, D.I.; Liu, W.; Flores, E.R.; Tsai, K.; Jacks, T.; Vousden, K.H.; et al. Role for the p53 homologue p73 in E2F-1-induced apoptosis. Nat. Cell Biol. 2000, 407, 645–648. [Google Scholar] [CrossRef]
  58. Strano, S.; Blandino, G. p73-mediated chemosensitivity: A preferential target of oncogenic mutant p53. Cell Cycle 2003, 2, 345–346. [Google Scholar] [CrossRef] [Green Version]
  59. Gaiddon, C.; Lokshin, M.; Ahn, J.; Zhang, T.; Prives, C. A Subset of Tumor-Derived Mutant Forms of p53 Down-Regulate p63 and p73 through a Direct Interaction with the p53 Core Domain. Mol. Cell. Biol. 2001, 21, 1874–1887. [Google Scholar] [CrossRef] [PubMed] [Green Version]
  60. Bergamaschi, D.; Gasco, M.; Hiller, L.; Sullivan, A.; Syed, N.; Trigiante, G.; Yulug, I.; Merlano, M.; Numico, G.; Comino, A.; et al. p53 polymorphism influences response in cancer chemotherapy via modulation of p73-dependent apoptosis. Cancer Cell 2003, 3, 387–402. [Google Scholar] [CrossRef] [Green Version]
  61. Davison, T.S.; Vagner, C.; Kaghad, M.; Ayed, A.; Caput, D.; Arrowsmith, C. p73 and p63 Are Homotetramers Capable of Weak Heterotypic Interactions with Each Other but Not with p53. J. Biol. Chem. 1999, 274, 18709–18714. [Google Scholar] [CrossRef] [Green Version]
  62. Gomez-Manzano, C.; Fueyo, J.; Kyritsis, A.P.; Steck, P.A.; Levin, V.A.; Yung, W.K.A.; McDonnell, T.J. Characterization of p53 and p21 Functional Interactions in Glioma Cells en Route to Apoptosis. J. Natl. Cancer Inst. 1997, 89, 1036–1044. [Google Scholar] [CrossRef] [Green Version]
  63. Blough, M.D.; Beauchamp, D.C.; Westgate, M.R.; Kelly, J.J.; Cairncross, J.G. Effect of aberrant p53 function on temozolomide sensitivity of glioma cell lines and brain tumor initiating cells from glioblastoma. J. Neuro-Oncol. 2011, 102, 1–7. [Google Scholar] [CrossRef] [PubMed]
  64. Pedrote, M.M.; Motta, M.F.; Ferretti, G.D.; Norberto, D.R.; Spohr, T.C.; Lima, F.R.S.; Gratton, E.; Silva, J.L.; de Oliveira, G.A. Oncogenic Gain of Function in Glioblastoma Is Linked to Mutant p53 Amyloid Oligomers. iScience 2020, 23, 100820. [Google Scholar] [CrossRef] [PubMed]
  65. Moroishi, T.; Hansen, C.; Guan, K.-L. The emerging roles of YAP and TAZ in cancer. Nat. Rev. Cancer 2015, 15, 73–79. [Google Scholar] [CrossRef] [PubMed]
  66. Strano, S.; Munarriz, E.; Rossi, M.; Castagnoli, L.; Shaul, Y.; Sacchi, A.; Oren, M.; Sudol, M.; Cesareni, G.; Blandino, G. Physical Interaction with Yes-associated Protein Enhances p73 Transcriptional Activity. J. Biol. Chem. 2001, 276, 15164–15173. [Google Scholar] [CrossRef] [PubMed] [Green Version]
  67. Di Agostino, S.; Sorrentino, G.; Ingallina, E.; Valenti, F.; Ferraiuolo, M.; Bicciato, S.; Piazza, S.; Strano, S.; Del Sal, G.; Blandino, G. YAP enhances the pro-proliferative transcriptional activity of mutant p53 proteins. EMBO Rep. 2015, 17, 188–201. [Google Scholar] [CrossRef] [PubMed]
  68. Raj, N.; Bam, R. Reciprocal Crosstalk Between YAP1/Hippo Pathway and the p53 Family Proteins: Mechanisms and Outcomes in Cancer. Front. Cell Dev. Biol. 2019, 7, 159. [Google Scholar] [CrossRef] [PubMed] [Green Version]
  69. Bai, N.; Zhang, C.; Liang, N.; Zhang, Z.; Chang, A.; Yin, J.; Li, Z.; Li, N.; Tan, X.; Luo, N.; et al. Yes-associated protein (YAP) increases chemosensitivity of hepatocellular carcinoma cells by modulation of p53. Cancer Biol. Ther. 2013, 14, 511–520. [Google Scholar] [CrossRef] [Green Version]
  70. Furth, N.; Aylon, Y.; Oren, M. p53 shades of Hippo. Cell Death Differ. 2018, 25, 81–92. [Google Scholar] [CrossRef] [Green Version]
  71. Strano, S.; Monti, O.; Pediconi, N.; Baccarini, A.; Fontemaggi, G.; Lapi, E.; Mantovani, F.; Damalas, A.; Citro, G.; Sacchi, A.; et al. The Transcriptional Coactivator Yes-Associated Protein Drives p73 Gene-Target Specificity in Response to DNA Damage. Mol. Cell 2005, 18, 447–459. [Google Scholar] [CrossRef] [PubMed]
  72. Labussiere, M.; Idbaih, A.; Wang, X.-W.; Marie, Y.; Boisselier, B.; Falet, C.; Paris, S.; Laffaire, J.; Carpentier, C.; Criniere, E.; et al. All the 1p19q codeleted gliomas are mutated on IDH1 or IDH2. Neurology 2010, 74, 1886–1890. [Google Scholar] [CrossRef] [PubMed]
  73. Ständer, M.; Peraud, A.; Leroch, B.; Kreth, F.W. Prognostic impact of TP53 mutation status for adult patients with supratentorial World Health Organization Grade II astrocytoma or oligoastrocytoma. Cancer 2004, 101, 1028–1035. [Google Scholar] [CrossRef]
  74. Kim, Y.-H.; Nobusawa, S.; Mittelbronn, M.; Paulus, W.; Brokinkel, B.; Keyvani, K.; Sure, U.; Wrede, K.; Nakazato, Y.; Tanaka, Y.; et al. Molecular Classification of Low-Grade Diffuse Gliomas. Am. J. Pathol. 2010, 177, 2708–2714. [Google Scholar] [CrossRef] [PubMed]
  75. Xiu, J.; Piccioni, D.; Juarez, T.; Pingle, S.C.; Hu, J.; Rudnick, J.; Fink, K.; Spetzler, D.B.; Maney, T.; Ghazalpour, A.; et al. Multi-platform molecular profiling of a large cohort of glioblastomas reveals potential therapeutic strategies. Oncotarget 2016, 7, 21556–21569. [Google Scholar] [CrossRef] [Green Version]
  76. Wen, P.Y.; Kesari, S. Malignant Gliomas in Adults. N. Engl. J. Med. 2008, 359, 492–507. [Google Scholar] [CrossRef] [PubMed] [Green Version]
  77. Ames, H.; Yuan, M.; Vizcaíno, M.A.; Yu, W.; Rodriguez, F.J. MicroRNA profiling of low-grade glial and glioneuronal tumors shows an independent role for cluster 14q32.31 member miR-487b. Mod. Pathol. 2016, 30, 204–216. [Google Scholar] [CrossRef] [PubMed]
  78. Ceccarelli, M.; Barthel, F.; Malta, T.; Sabedot, T.S.; Salama, S.; Murray, B.A.; Morozova, O.; Newton, Y.; Radenbaugh, A.; Pagnotta, S.M.; et al. Molecular Profiling Reveals Biologically Discrete Subsets and Pathways of Progression in Diffuse Glioma. Cell 2016, 164, 550–563. [Google Scholar] [CrossRef] [PubMed] [Green Version]
  79. Lee, J.E.; Jeun, S.S.; Kim, S.H.; Yoo, C.Y.; Baek, H.-M.; Yang, S.H. Metabolic profiling of human gliomas assessed with NMR. J. Clin. Neurosci. 2019, 68, 275–280. [Google Scholar] [CrossRef]
  80. Chen, B.; Liang, T.; Yang, P.; Wang, H.; Liu, Y.; Yang, F.; You, G. Classifying lower grade glioma cases according to whole genome gene expression. Oncotarget 2016, 7, 74031–74042. [Google Scholar] [CrossRef] [PubMed] [Green Version]
  81. Fults, D.; Brockmeyer, D.; Tullous, M.W.; Pedone, C.A.; Cawthon, R.M. p53 mutation and loss of heterozygosity on chromosomes 17 and 10 during human astrocytoma progression. Cancer Res. 1992, 52, 674–679. [Google Scholar]
  82. Tsuzuki, T.; Tsunoda, S.; Sakaki, T.; Konishi, N.; Hiasa, Y.; Nakamura, M. Alterations of retinoblastoma, p53, p16(CDKN2), and p15 genes in human astrocytomas. Cancer 1996, 78, 287–293. [Google Scholar] [CrossRef]
  83. Thangnipon, W.; Mizoguchi, M.; Kukita, Y.; Inazuka, M.; Iwaki, T.; Fukui, M.; Hayashi, K. Distinct pattern of PCR–SSCP analysis of p53 mutations in human astrocytomas. Cancer Lett. 1999, 141, 195–201. [Google Scholar] [CrossRef]
  84. Watanabe, K.; Sato, K.; Biernat, W.; Tachibana, O.; Von Ammon, K.; Ogata, N.; Yonekawa, Y.; Kleihues, P.; Ohgaki, H. Incidence and timing of p53 mutations during astrocytoma progression in patients with multiple biopsies. Clin. Cancer Res. 1997, 3, 523–530. [Google Scholar] [PubMed]
  85. Ishii, N.; Maier, D.; Merlo, A.; Tada, M.; Sawamura, Y.; Diserens, A.-C.; Van Meir, E.G. Frequent Co-Alterations of TP53, p16/CDKN2A, p14ARF, PTEN Tumor Suppressor Genes in Human Glioma Cell Lines. Brain Pathol. 1999, 9, 469–479. [Google Scholar] [CrossRef]
  86. Hagel, C.; Laking, G.; Laas, R.; Scheil, S.; Jung, R.; Milde-Langosch, K.; Stavrou, D. Demonstration of p53 protein and TP53 gene mutations in oligodendrogliomas. Eur. J. Cancer 1996, 32, 2242–2248. [Google Scholar] [CrossRef]
  87. Patt, S.; Gries, H.; Giraldo, M.; Cervos-Navarro, J.; Martin, H.; Jänisch, W.; Brockmoller, J. p53 gene mutations in human astrocytic brain tumors including pilocytic astrocytomas. Hum. Pathol. 1996, 27, 586–589. [Google Scholar] [CrossRef]
  88. Rasheed, B.K.A.; Wiltshire, R.N.; Bigner, S.H.; Bigner, D.D. Molecular pathogenesis of malignant gliomas. Curr. Opin. Oncol. 1999, 11, 162–167. [Google Scholar] [CrossRef]
  89. Weber, R.; Sabel, M.; Reifenberger, J.; Sommer, C.; Oberstrass, J.; Reifenberger, G.; Kiessling, M.; Cremer, T. Characterization of genomic alterations associated with glioma progression by comparative genomic hybridization. Oncogene 1996, 13, 983–994. [Google Scholar] [PubMed]
  90. Kraus, J.A.; Koopmann, J.; Kaskel, P.; Maintz, D.; Brandner, S.; Schramm, J.; Louis, D.N.; Wiestler, O.D.; von Deimling, A. Shared Allelic Losses on Chromosomes 1p and 19q Suggest a Common Origin of Oligodendroglioma and Oligoastrocytoma. J. Neuropathol. Exp. Neurol. 1995, 54, 91–95. [Google Scholar] [CrossRef]
  91. Parsons, D.W.; Jones, S.; Zhang, X.; Lin, J.C.-H.; Leary, R.J.; Angenendt, P.; Mankoo, P.; Carter, H.; Siu, I.-M.; Gallia, G.L.; et al. An Integrated Genomic Analysis of Human Glioblastoma Multiforme. Science 2008, 321, 1807–1812. [Google Scholar] [CrossRef] [PubMed] [Green Version]
  92. Liu, X.-Y.; Gerges, N.; Korshunov, A.; Sabha, N.; Khuong-Quang, D.-A.; Fontebasso, A.M.; Fleming, A.; Hadjadj, D.; Schwartzentruber, J.; Majewski, J.; et al. Frequent ATRX mutations and loss of expression in adult diffuse astrocytic tumors carrying IDH1/IDH2 and TP53 mutations. Acta Neuropathol. 2012, 124, 615–625. [Google Scholar] [CrossRef] [PubMed]
  93. Chen, Y.-J.; Hakin-Smith, V.; Teo, M.; Xinarianos, G.E.; Jellinek, D.A.; Carroll, T.; McDowell, D.; Macfarlane, M.R.; Boet, R.; Baguley, B.C.; et al. Association of Mutant TP53 with Alternative Lengthening of Telomeres and Favorable Prognosis in Glioma. Cancer Res. 2006, 66, 6473–6476. [Google Scholar] [CrossRef] [Green Version]
  94. Wang, K.; Wang, Y.-Y.; Ma, J.; Wang, J.-F.; Li, S.-W.; Jiang, T.; Dai, J.-P. Prognostic value of MGMT promoter methylation and TP53 mutation in glioblastomas depends on IDH1 mutation. Asian Pac. J. Cancer Prev. 2015, 15, 10893–10898. [Google Scholar] [CrossRef] [PubMed] [Green Version]
  95. Koehler, K.; Liebner, D.; Chen, J.L. TP53 mutational status is predictive of pazopanib response in advanced sarcomas. Ann. Oncol. 2016, 27, 539–543. [Google Scholar] [CrossRef] [PubMed]
  96. Li, V.D.; Li, K.H.; Li, J.T. TP53 mutations as potential prognostic markers for specific cancers: Analysis of data from The Cancer Genome Atlas and the International Agency for Research on Cancer TP53 Database. J. Cancer Res. Clin. Oncol. 2018, 145, 625–636. [Google Scholar] [CrossRef]
  97. Freier, C.P.; Stiasny, A.; Kuhn, C.; Mayr, D.; Alexiou, C.; Janko, C.; Wiest, I.; Jeschke, U.; Kost, B. Immunohistochemical Evaluation of the Role of p53 Mutation in Cervical Cancer: Ser-20 p53-Mutant Correlates with Better Prognosis. Anticancer. Res. 2016, 36, 3131–3137. [Google Scholar] [PubMed]
  98. Groenendijk, F.H.; Taal, W.; Dubbink, H.J.; Haarloo, C.R.; Kouwenhoven, M.C.; Bent, M.J.V.D.; Kros, J.M.; Dinjens, W.N.M. MGMT promoter hypermethylation is a frequent, early, and consistent event in astrocytoma progression, and not correlated with TP53 mutation. J. Neuro-Oncol. 2011, 101, 405–417. [Google Scholar] [CrossRef] [PubMed] [Green Version]
  99. Ono, Y.; Tamiya, T.; Ichikawa, T.; Matsumoto, K.; Furuta, T.; Ohmoto, T.; Akiyama, K.; Seki, S.; Ueki, K.; Louis, D.N. Accumulation of wild-type p53 in astrocytomas is associated with increased p21 expression. Acta Neuropathol. 1997, 94, 21–27. [Google Scholar] [CrossRef] [PubMed]
  100. Mellai, M.; Piazzi, A.; Caldera, V.; Monzeglio, O.; Cassoni, P.; Valente, G.; Schiffer, D. IDH1 and IDH2 mutations, immunohistochemistry and associations in a series of brain tumors. J. Neuro-Oncol. 2011, 105, 345–357. [Google Scholar] [CrossRef]
  101. Peraud, A.; Kreth, F.W.; Wiestler, O.D.; Kleihues, P.; Reulen, H.-J. Prognostic impact of TP53 mutations and P53 protein overexpression in supratentorial WHO grade II astrocytomas and oligoastrocytomas. Clin. Cancer Res. 2002, 8, 1117–1124. [Google Scholar] [PubMed]
  102. Sarma, P.P.; Dutta, D.; Mirza, Z.; Saikia, K.K.; Baishya, B.K. Point mutations in the DNA binding domain of p53 contribute to glioma progression and poor prognosis. Mol. Biol. 2017, 51, 334–341. [Google Scholar] [CrossRef]
  103. Hartmann, C.; Hentschel, B.; Tatagiba, M.; Schramm, J.; Schnell, O.; Seidel, C.; Stein, R.; Reifenberger, G.; Pietsch, T.; von Deimling, A.; et al. Molecular Markers in Low-Grade Gliomas: Predictive or Prognostic? Clin. Cancer Res. 2011, 17, 4588–4599. [Google Scholar] [CrossRef] [PubMed] [Green Version]
  104. Guichet, P.-O.; Masliantsev, K.; Tachon, G.; Petropoulos, C.; Godet, J.; Larrieu-Ciron, D.; Milin, S.; Wager, M.; Karayan-Tapon, L. Fatal correlation between YAP1 expression and glioma aggressiveness: Clinical and molecular evidence. J. Pathol. 2018, 246, 205–216. [Google Scholar] [CrossRef] [PubMed]
  105. Watanabe, T.; Katayama, Y.; Komine, C.; Yoshino, A.; Ogino, A.; Ohta, T.; Fukushima, T. O6-methylguanine-DNA methyltransferase methylation and TP53 mutation in malignant astrocytomas and their relationships with clinical course. Int. J. Cancer 2004, 113, 581–587. [Google Scholar] [CrossRef] [PubMed]
Figure 1. TP53 hotspot mutations in codon 273: (A) R273C (c.817C>T) (B) R273H (c.818G>A). The nucleotide of interest is highlighted in black. The top row of the sequence is the reference sequence, and the bottom row is the mutant sequence.
Cancers 13 05362 g001
Figure 2. Kaplan–Meier survival curves for grades II and III astrocytoma in our cohort and the TCGA astrocytoma dataset based on TP53 mutation status. (A) Overall survival and (B) progression-free survival curves for our astrocytoma cohort. (C) Overall survival and (D) progression-free survival curves for the TCGA astrocytoma cohort. WT: wild-type, MUT: TP53 mutant. Log-rank test was used for analysis and a p-value < 0.05 for statistical significance.
Cancers 13 05362 g002
Figure 3. Kaplan–Meier survival curves for astrocytoma based on TP53 codon 273 mutation, other TP53 mutations, and TP53 wild-type status. (A) Overall survival and (B) progression-free survival stratified by TP53 wild-type, TP53 codon 273 mutant, and other TP53 mutants in our dataset. (C) Overall survival and (D) progression-free survival curves for the MSKCC dataset. (E) Overall survival and (F) progression-free survival curves for the TCGA astrocytoma cohort stratified by TP53 wild-type, TP53 codon 273 mutant, and other TP53 mutants in the TCGA dataset. TP53 273: TP53 codon 273 mutant, TP53 OTHER: all pathogenic TP53 mutations except in codon 273, TP53 WT: wild-type TP53 status. Log-rank test was used for analysis and a p-value < 0.05 for statistical significance.
Cancers 13 05362 g003
Figure 4. Kaplan–Meier survival curves for oligodendroglioma based on TP53 mutation status. (A) Overall survival and (B) progression-free survival stratified by TP53 wild-type and TP53 mutant cases in our dataset. (C) Overall survival and (D) progression-free survival curves for the TCGA oligodendroglioma dataset, stratified by TP53 wild-type and TP53 mutant cases. (E) Overall survival and (F) progression-free survival curves for the TCGA oligodendroglioma dataset, stratified by TP53 wild-type, TP53 codon 273 mutant, and other TP53 mutant cases. TP53 273: TP53 codon 273 mutant, TP53 OTHER: all pathogenic TP53 mutations except in codon 273, TP53 WT: wild-type TP53 status. Log-rank test was used for analysis and a p-value < 0.05 for statistical significance.
Cancers 13 05362 g004
Figure 5. Distribution of p53 expression (A), patient age (B) and Ki67 (C) across TP53 mutation types: codon 273 mutant, wild-type and other TP53 mutations. Unpaired t-test was used for statistical analysis. *** p < 0.001, ns: not significant.
Cancers 13 05362 g005
Figure 6. Kaplan–Meier survival curves comparing effects of TP53 mutation status in the prognosis of chemotherapy-treated and no-chemotherapy groups. OS and PFS of chemotherapy-treated groups in our cohort (A,B) and the MSKCC cohort (C,D). OS and PFS of no-chemotherapy groups in our cohort (E,F), and the MSKCC cohort (G,H). TP53 273: TP53 codon 273 mutant, TP53 OTHER: all pathogenic TP53 mutations except in codon 273, TP53 WT: wild-type TP53 status. Log-rank test was used for analysis and a p-value < 0.05 for statistical significance.
Cancers 13 05362 g006
Figure 7. Association between TP53 mutation/mRNA expression with YAP1 mRNA expression, and the prognostic significance of YAP1 in cancers. (A) Log10 hazard ratio (log10HR) of YAP1 mRNA expression (median cut-off) in TCGA cancers. LGG is marked with a red line. Statistically significant log10 hazard ratios (p < 0.05) are outlined with solid borders. (B) Hippo Signalling pathway and TP53 gene expression heatmap distribution among TP53 mutation statuses in TCGA astrocytoma as a gradient of high expression (red), neutral expression (black) and low expression (blue). (C) (i) Correlation between YAP1 and TP53 mRNA expressions in GBM. (ii) Correlation between YAP1 and TP53 mRNA expressions in selected TCGA cancers.
Cancers 13 05362 g007
Figure 8. TP53 mRNA levels in YAP1 high and low groups in the CGGA dataset in patients (A) without chemotherapy and (B) with chemotherapy. Kaplan–Meier survival curves comparing effects of YAP1 mRNA levels in the prognosis of (C) no-chemotherapy and (D) chemotherapy-treated groups in primary tumours. Kaplan–Meier survival curves comparing effects of YAP1 mRNA levels in the prognosis of (E) no-chemotherapy and (F) chemotherapy-treated groups in recurrent tumours. Log-rank test was used for analysis and a p-value < 0.05 for statistical significance.
Cancers 13 05362 g008
Figure 9. Kaplan–Meier survival curves comparing effects of TP53 mutation status on the OS of chemotherapy-treated (A) MGMT methylated and (B) MGMT unmethylated astrocytoma in the MSKCC dataset. Kaplan–Meier survival curves comparing the effects of YAP1 mRNA expression levels on the OS of chemotherapy-treated (C) MGMT methylated and (D) MGMT unmethylated astrocytoma in the CGGA dataset. TP53 273: TP53 codon 273 mutant, TP53 OTHER: all pathogenic TP53 mutations except in codon 273, TP53 WT: wild-type TP53 status. Log-rank test was used for analysis and a p-value < 0.05 for statistical significance.
Cancers 13 05362 g009
Figure 10. Illustration of the hypothesised mechanism through which TP53 mutation type determines chemosensitivity in astrocytoma involving transactivated p63/p73 and YAP1.
Cancers 13 05362 g010
Table 1. Patient and tumour characteristics.
Age at diagnosis, median ± SD (years) 36 ± 10
Median follow-up (years, 95% CI)9.0 (7.9–10.1)
Gender, n (%)F53 (51.9%)
M49 (48.0%)
Diagnosis, n (%)Astrocytoma grade II32 (31.1%)
Astrocytoma grade III19 (18.4%)
Oligodendroglioma grade II26 (26.2%)
Oligodendroglioma grade III25 (24.3%)
IDH1 mutation, n (%)Wild-type17 (17%)
Mutant85 (83%)
Anatomical Location of Tumour, n (%)Frontal45 (44.1%)
Insular6 (5.9%)
Motor Cortex1 (1.0%)
Parietal13 (12.7%)
Temporal22 (21.6%)
Unknown15 (14.7%)
Treatment, n (%)Surgery and chemoradiation28 (27.5%)
Surgery and chemotherapy15 (14.7%)
Surgery and radiotherapy11 (10.8%)
Surgery only27 (26.5%)
Unknown adjuvant therapy21 (20.5%)
Table 2. TP53 mutation information and their pathogenic status.
Mutation SyntaxAmino Acid ChangeFrequencyType of MutationRef SNP IDOutcome
c.215C>Gp.P72R24Missensers1042522Neutral
c.321C>Gp.Y107 *1Nonsensers770776262Neutral
c.377A>Gp.Y126C2Missensers1555526335Pathogenic
c.469_470delGT 1Frameshift DeletionNovel mutationPathogenic
c.473G>Ap.R158H1Missensers587782144Pathogenic
c.476C>Ap.A159D1MissenseunavailablePathogenic
c.480G>Ap.M160I1Missensers193920817Pathogenic
c.488A>Gp.Y163C1Missensers148924904Pathogenic
c.517G>Cp.V173L1Missensers876660754Pathogenic
c.524G>Cp.R175P2Missensers28934578Pathogenic
c.526T>Gp.C176G1Missensers967461896Pathogenic
c.537T>Ap.H179Q1Missensers876660821Neutral
c.581T>Gp.L194R1Missensers1057519998Pathogenic
c.639A>Gp.R213R3Silentrs1800372Neutral
c.643A>Gp.S215G1Missensers886039484Pathogenic
c.659A>Gp.Y220C2Missensers121912666Pathogenic
c.700T>Cp.Y234H1Missensers864622237Pathogenic
c.711G>Ap.M237I1Missensers587782664Pathogenic
c.734G>Ap.G245D1Missensers121912656Pathogenic
c.742C>Tp.R248W1Missensers121912651Pathogenic
c.743G>Ap.R248Q1Missensers11540652Pathogenic
c.797G>Ap.G266E1Missensers193920774Pathogenic
c.817C>Tp.R273C15Missensers121913343Pathogenic
c.818G>Ap.R273H3Missensers28934576Pathogenic
c.823T>Gp.C275G1Missensers1029688274Pathogenic
c.861G>Ap.E287E1Silentrs748891343Neutral
* Substitution—nonsense mutation.
Table 3. Clinicopathological features and TP53 mutation status.
TP53 Mutation Statusp-Value
Wild-TypeMutant
n (%)n (%)
Age at diagnosis, mean ± SD 1, (years) 38 ± 1134 ± 90.046
GenderF32 (52%)20 (50%)0.694
M29 (48%)20 (50%)
DiagnosisAstrocytoma II8 (13%)24 (60%)<0.001
Astrocytoma III12 (19%)7 (18%)
Oligodendroglioma II21 (34%)5 (12%)
Oligodendroglioma III20 (34%)4 (10%)
IDH1 mutation statusWild-type14 (23%)2 (5%)0.009
Mutant47 (77%)37 (95%)
1p/19q co-deletion statusCo-deleted22 (36%)0 (0%)<0.001
Non-co-deleted9 (15%)18 (45%)
Unknown30 (49%)22 (55%)
p53 expression level 2Unknown22 (36%)17 (43%)<0.001
Low25 (41%)1 (1%)
High14 (23%)22 (55%)
TreatmentSurgery and chemoradiation16 (26%)12 (30%)0.016
Surgery and chemotherapy10 (16%)5 (13%)
Surgery and radiotherapy8 (13%)3 (7%)
Surgery only Unknown21 (35%)6 (15%)
6 (10%)14 (35%)
1 SD = standard deviation; 2 p53 expression considered high >10%.
Table 4. Univariate and multivariate survival analyses of astrocytoma in this study.
Overall Survival
Univariate AnalysisMultivariate Analysis
TP53 MutationHazard Ratio (95% CI)p-ValueHazard Ratio (95% CI)p-Value
TP53 combined vs. WT0.331 (0.138–0.796)0.0140.392 (0.132–1.163)0.091
TP53 codon 273 vs. other 0.466 (0.172–1.262)0.1330.175 (0.04–0.759)0.02
TP53 codon 273 vs. WT 0.232 (0.076–0.711)0.0110.169 (0.036–0.766)0.021
Other vs. WT0.500 (0.150–1.590)0.2411.042 (0.278–3.906)0.951
Table 5. Univariate survival analysis of TCGA and MSKCC datasets.
DatasetTP53 MutationHazard Ratio (95% CI)p-Value
TCGA OSTP53 combined vs. WT0.199 (0.113–0.350)<0.0001
Codon 273 vs. WT 0.182 (0.0069–0.479)<0.001
Other vs. WT0.210 (0.116–0.379)<0.0001
TCGA PFSTP53 combined vs. WT0.336 (0.218–0.517)<0.0002
Codon 273 vs. WT 0.260 (0.125–0.539)<0.0001
Other vs. WT0.360 (0.229–0.567)<0.0001
MSKCC OSCodon 273 vs. WT0.124 (0.053–0.289)<0.0001
Other vs. WT0.231 (0.136–0.392)<0.0001
MSKCC PFSCodon 273 vs. WT0.154 (0.83–0.286)<0.0001
Other vs. WT0.187 (0.117–0.297)<0.0001
Publisher’s Note: MDPI stays neutral with regard to jurisdictional claims in published maps and institutional affiliations.

