
Artificial Intelligence in Gastric Cancer: Identifying Gastric Cancer Using Endoscopic Images with Convolutional Neural Network

 ,
,  , and
, and
Abstract
Simple Summary
Abstract
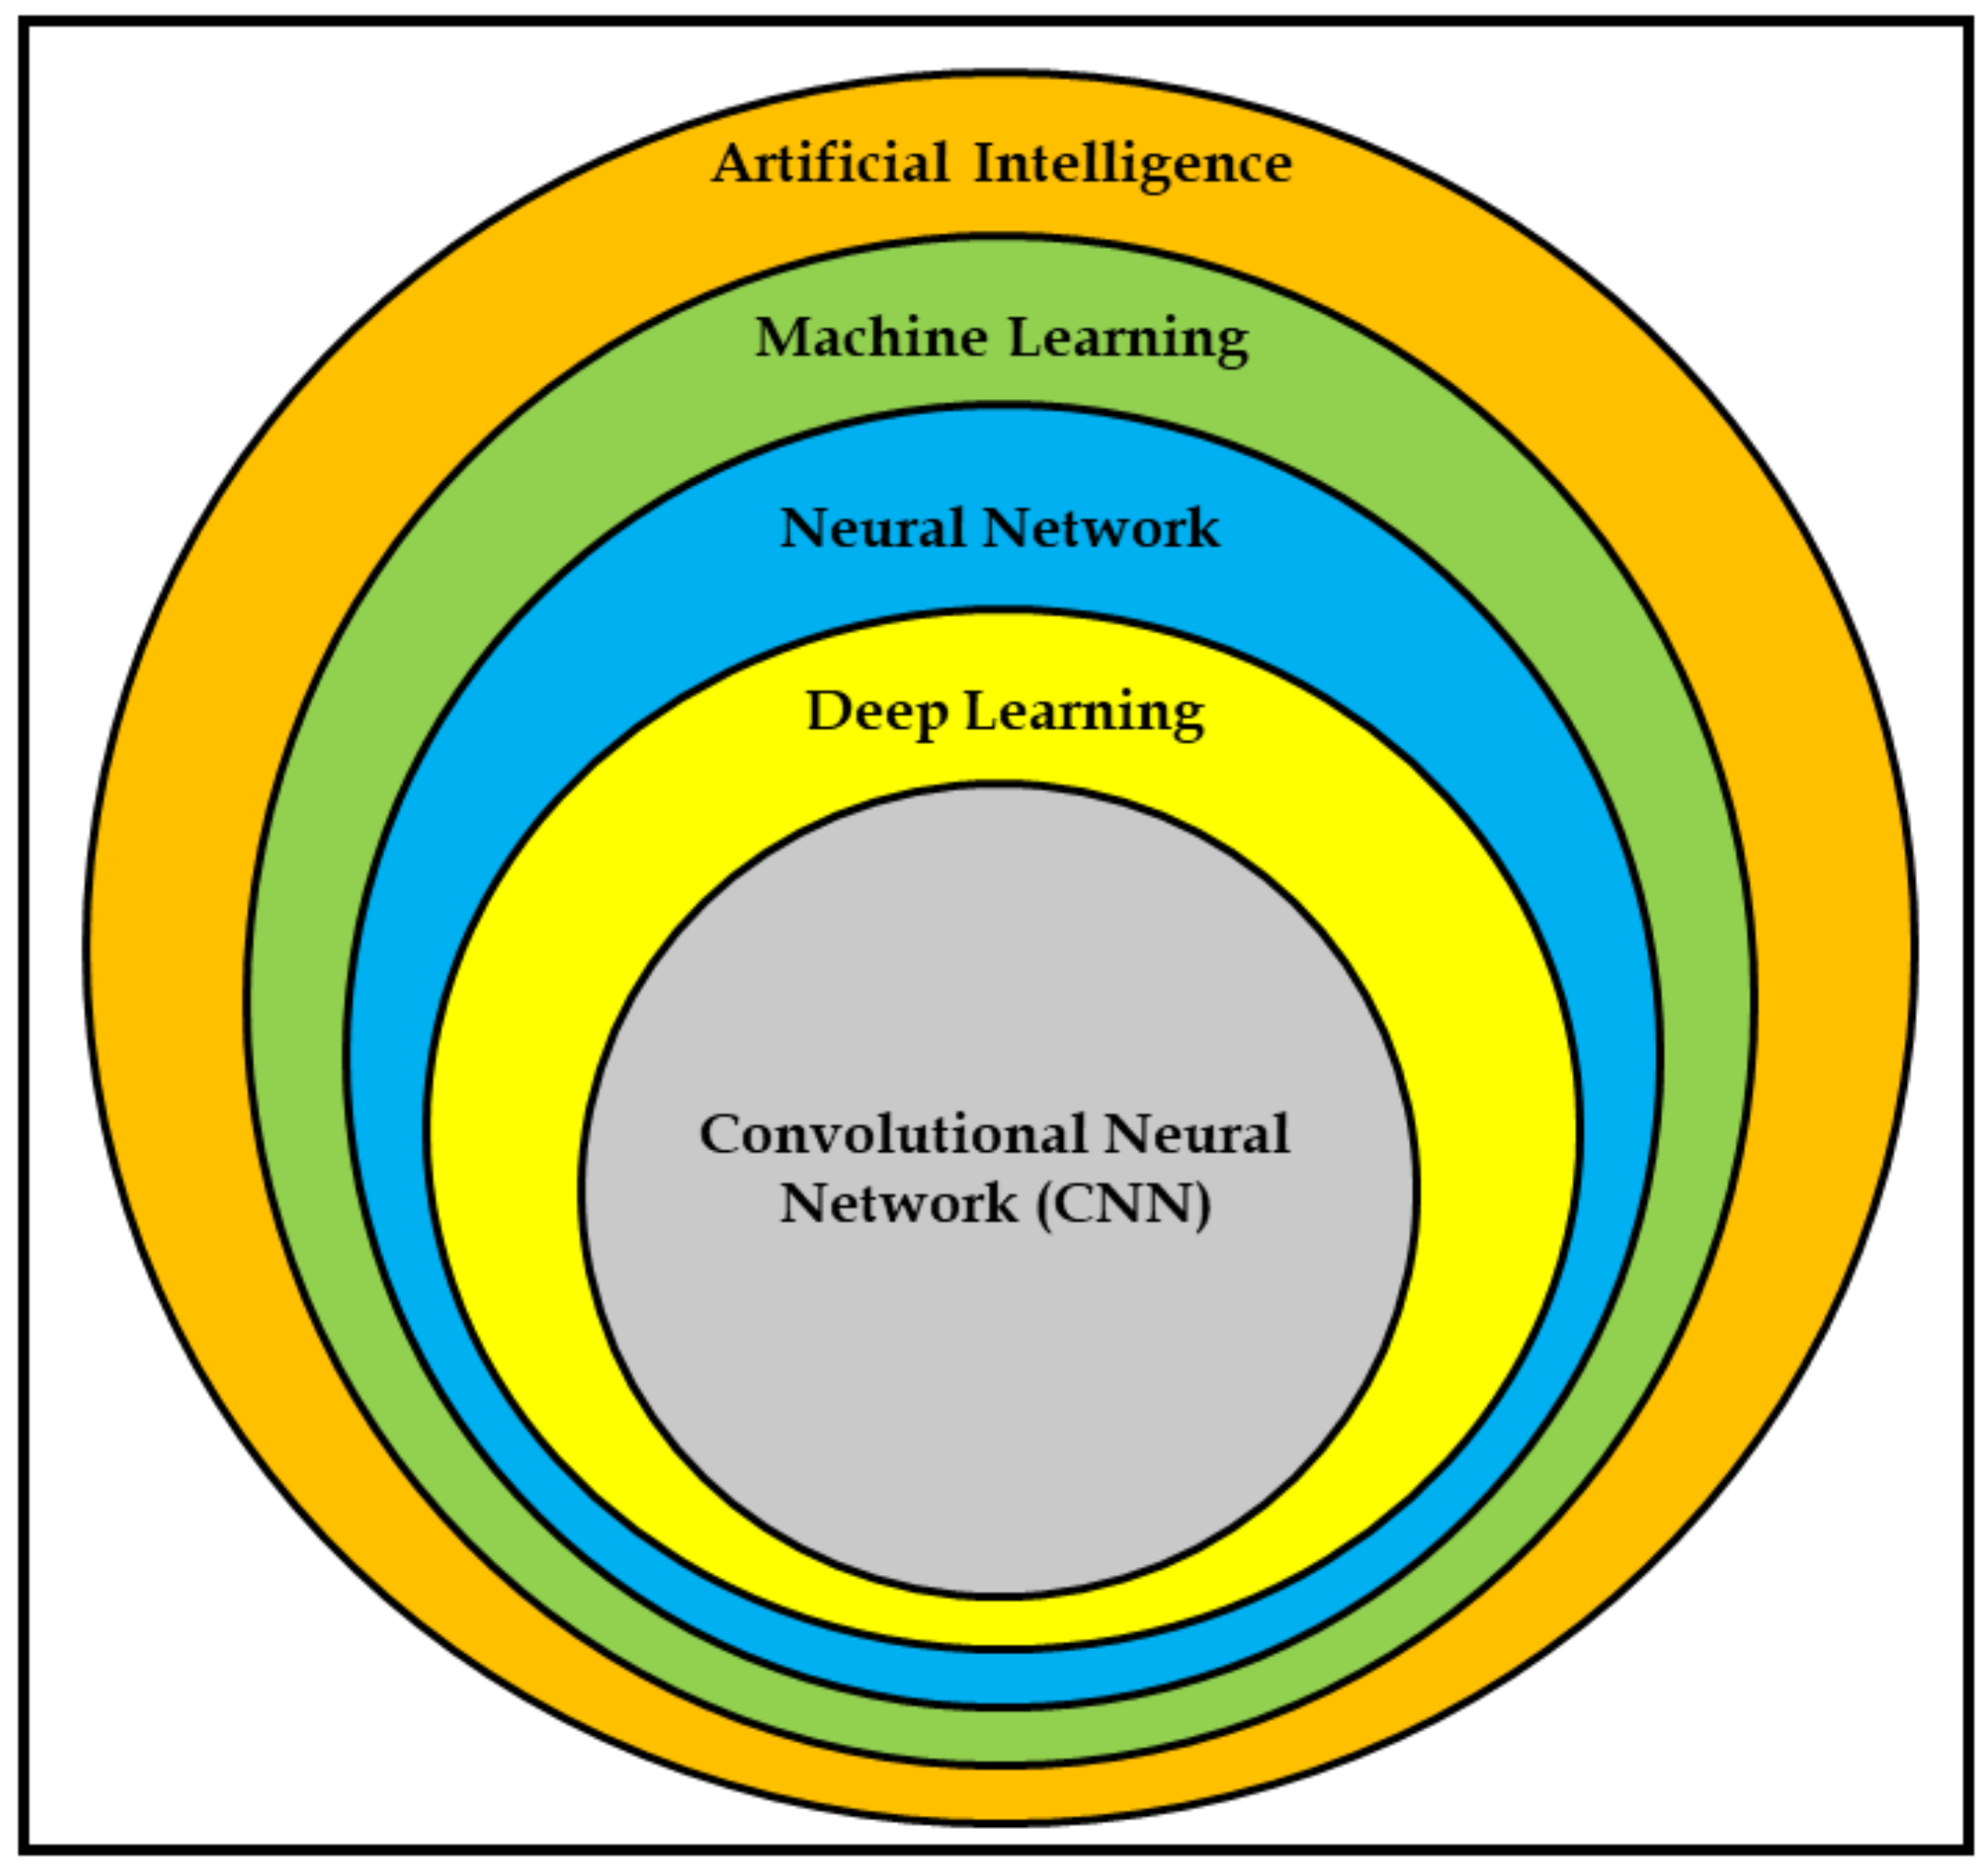
1. Introduction
2. Materials and Methods
2.1. Study Protocol
2.2. Electronic Databases Search
2.3. Eligibility Criteria
2.4. Data Extraction
2.5. Quality Assessment and Risk of Bias
2.6. Statistical Analysis
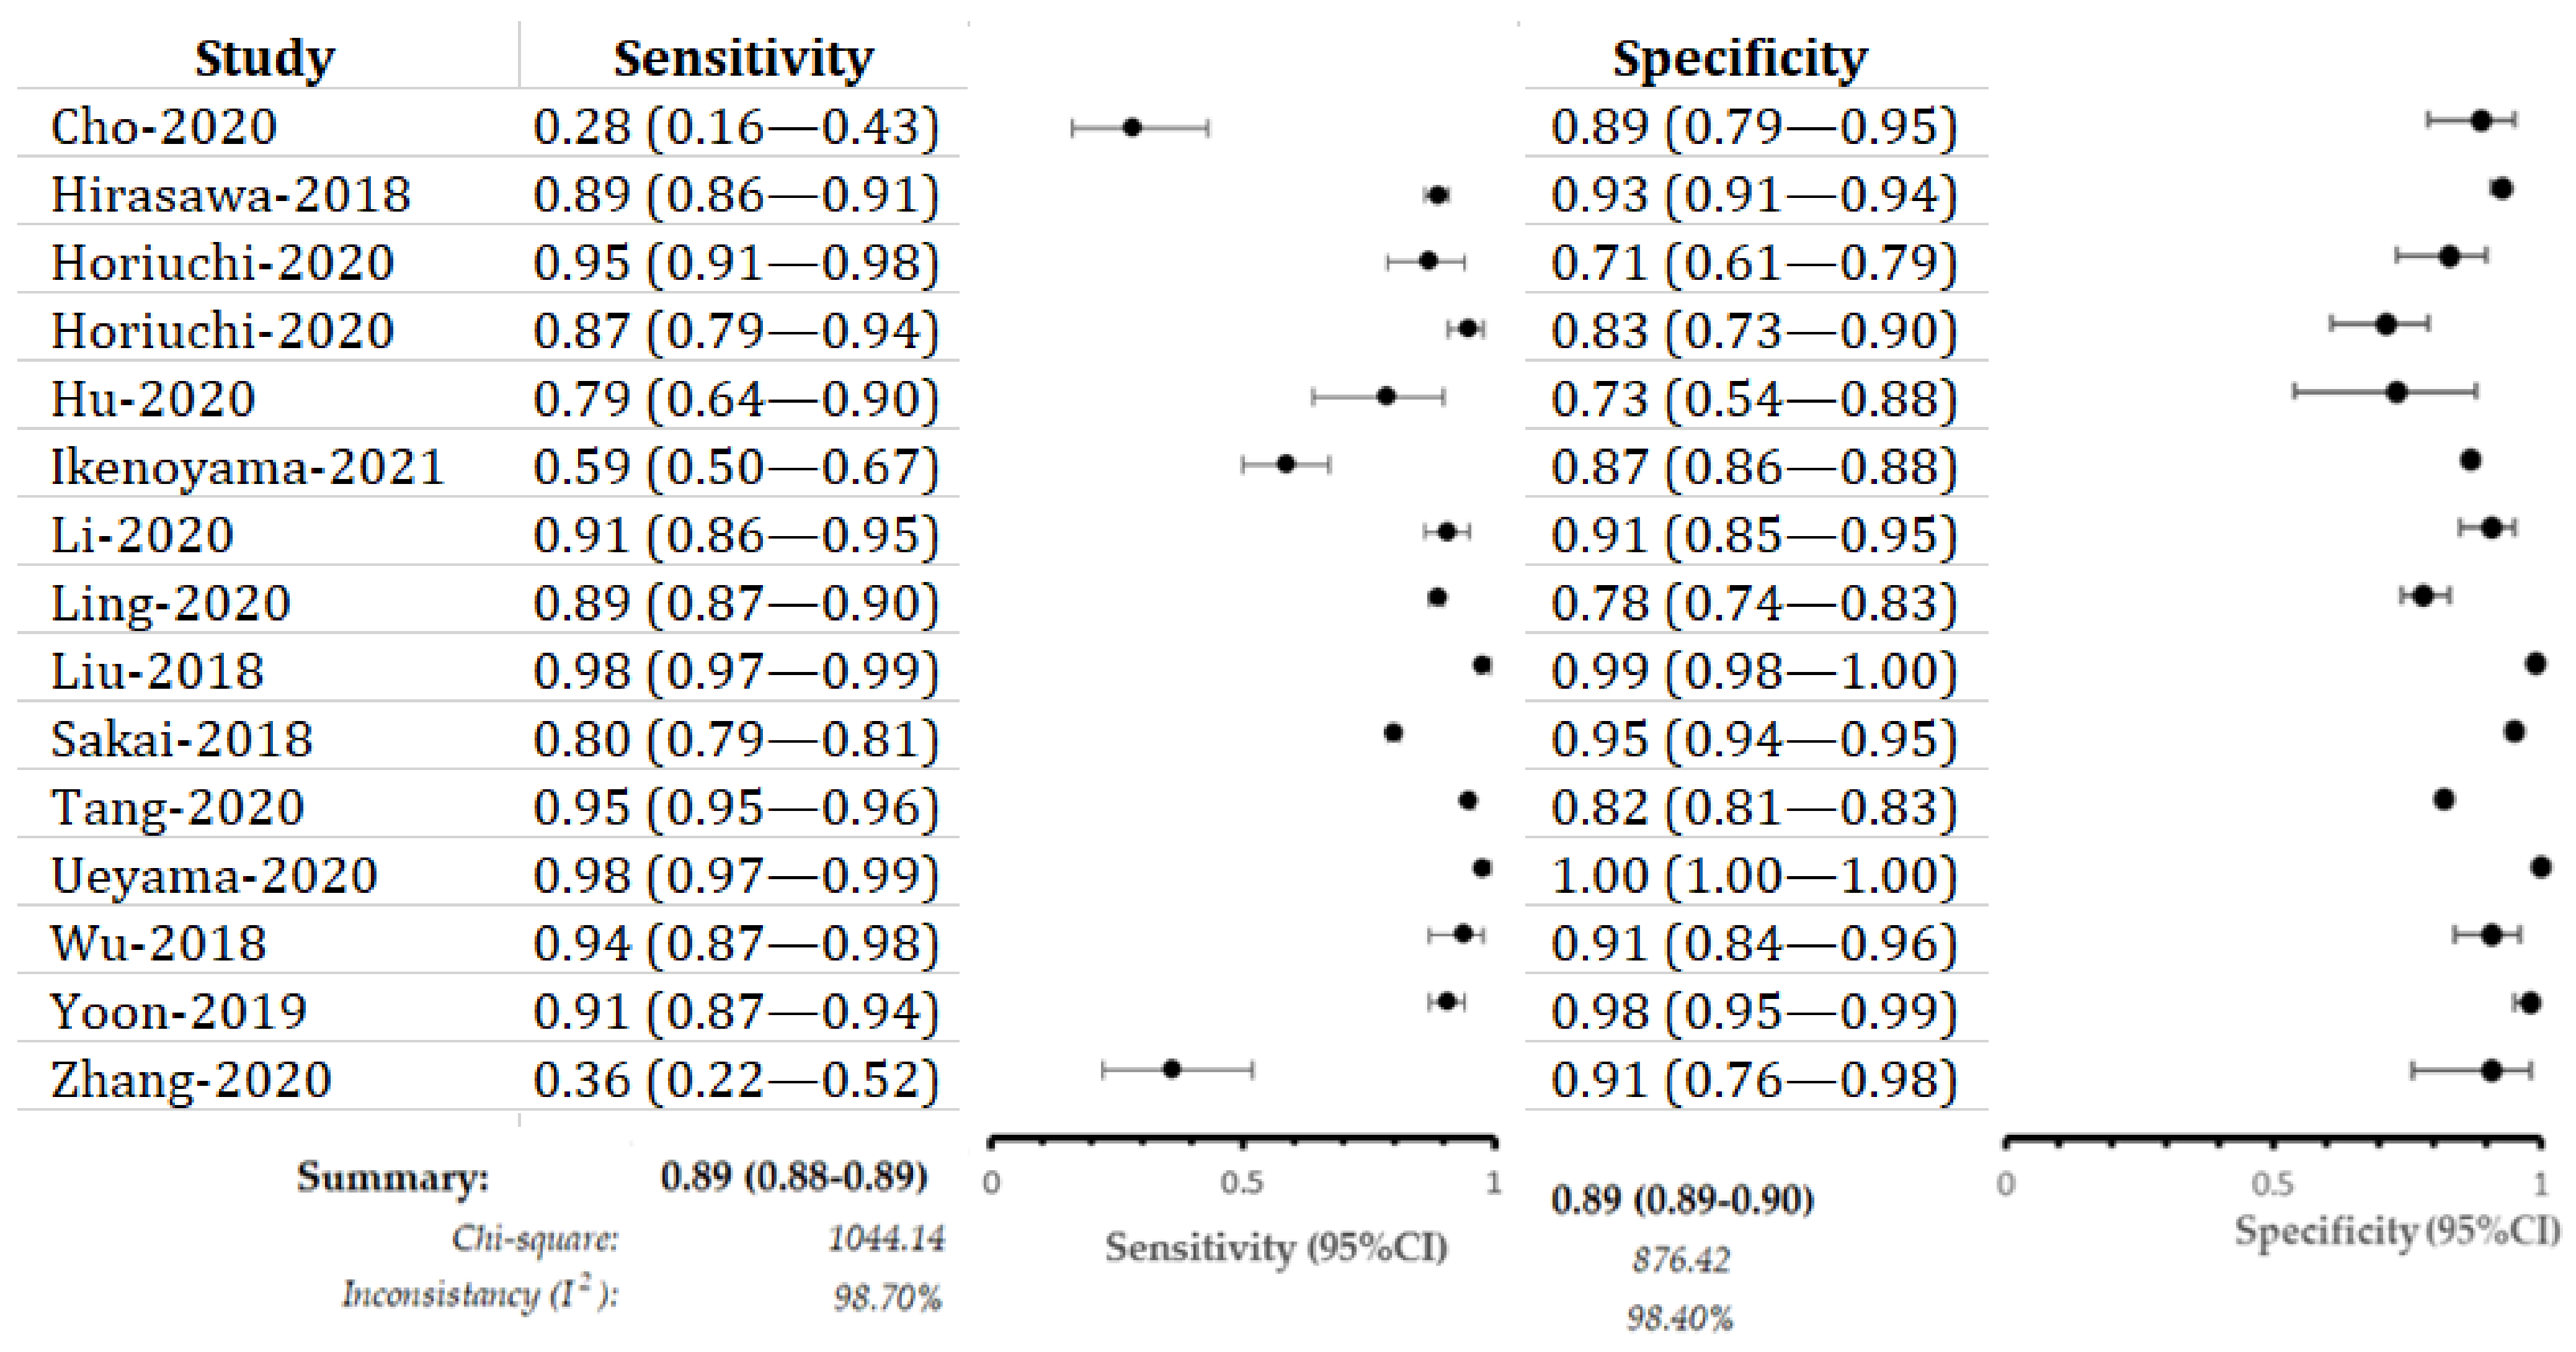
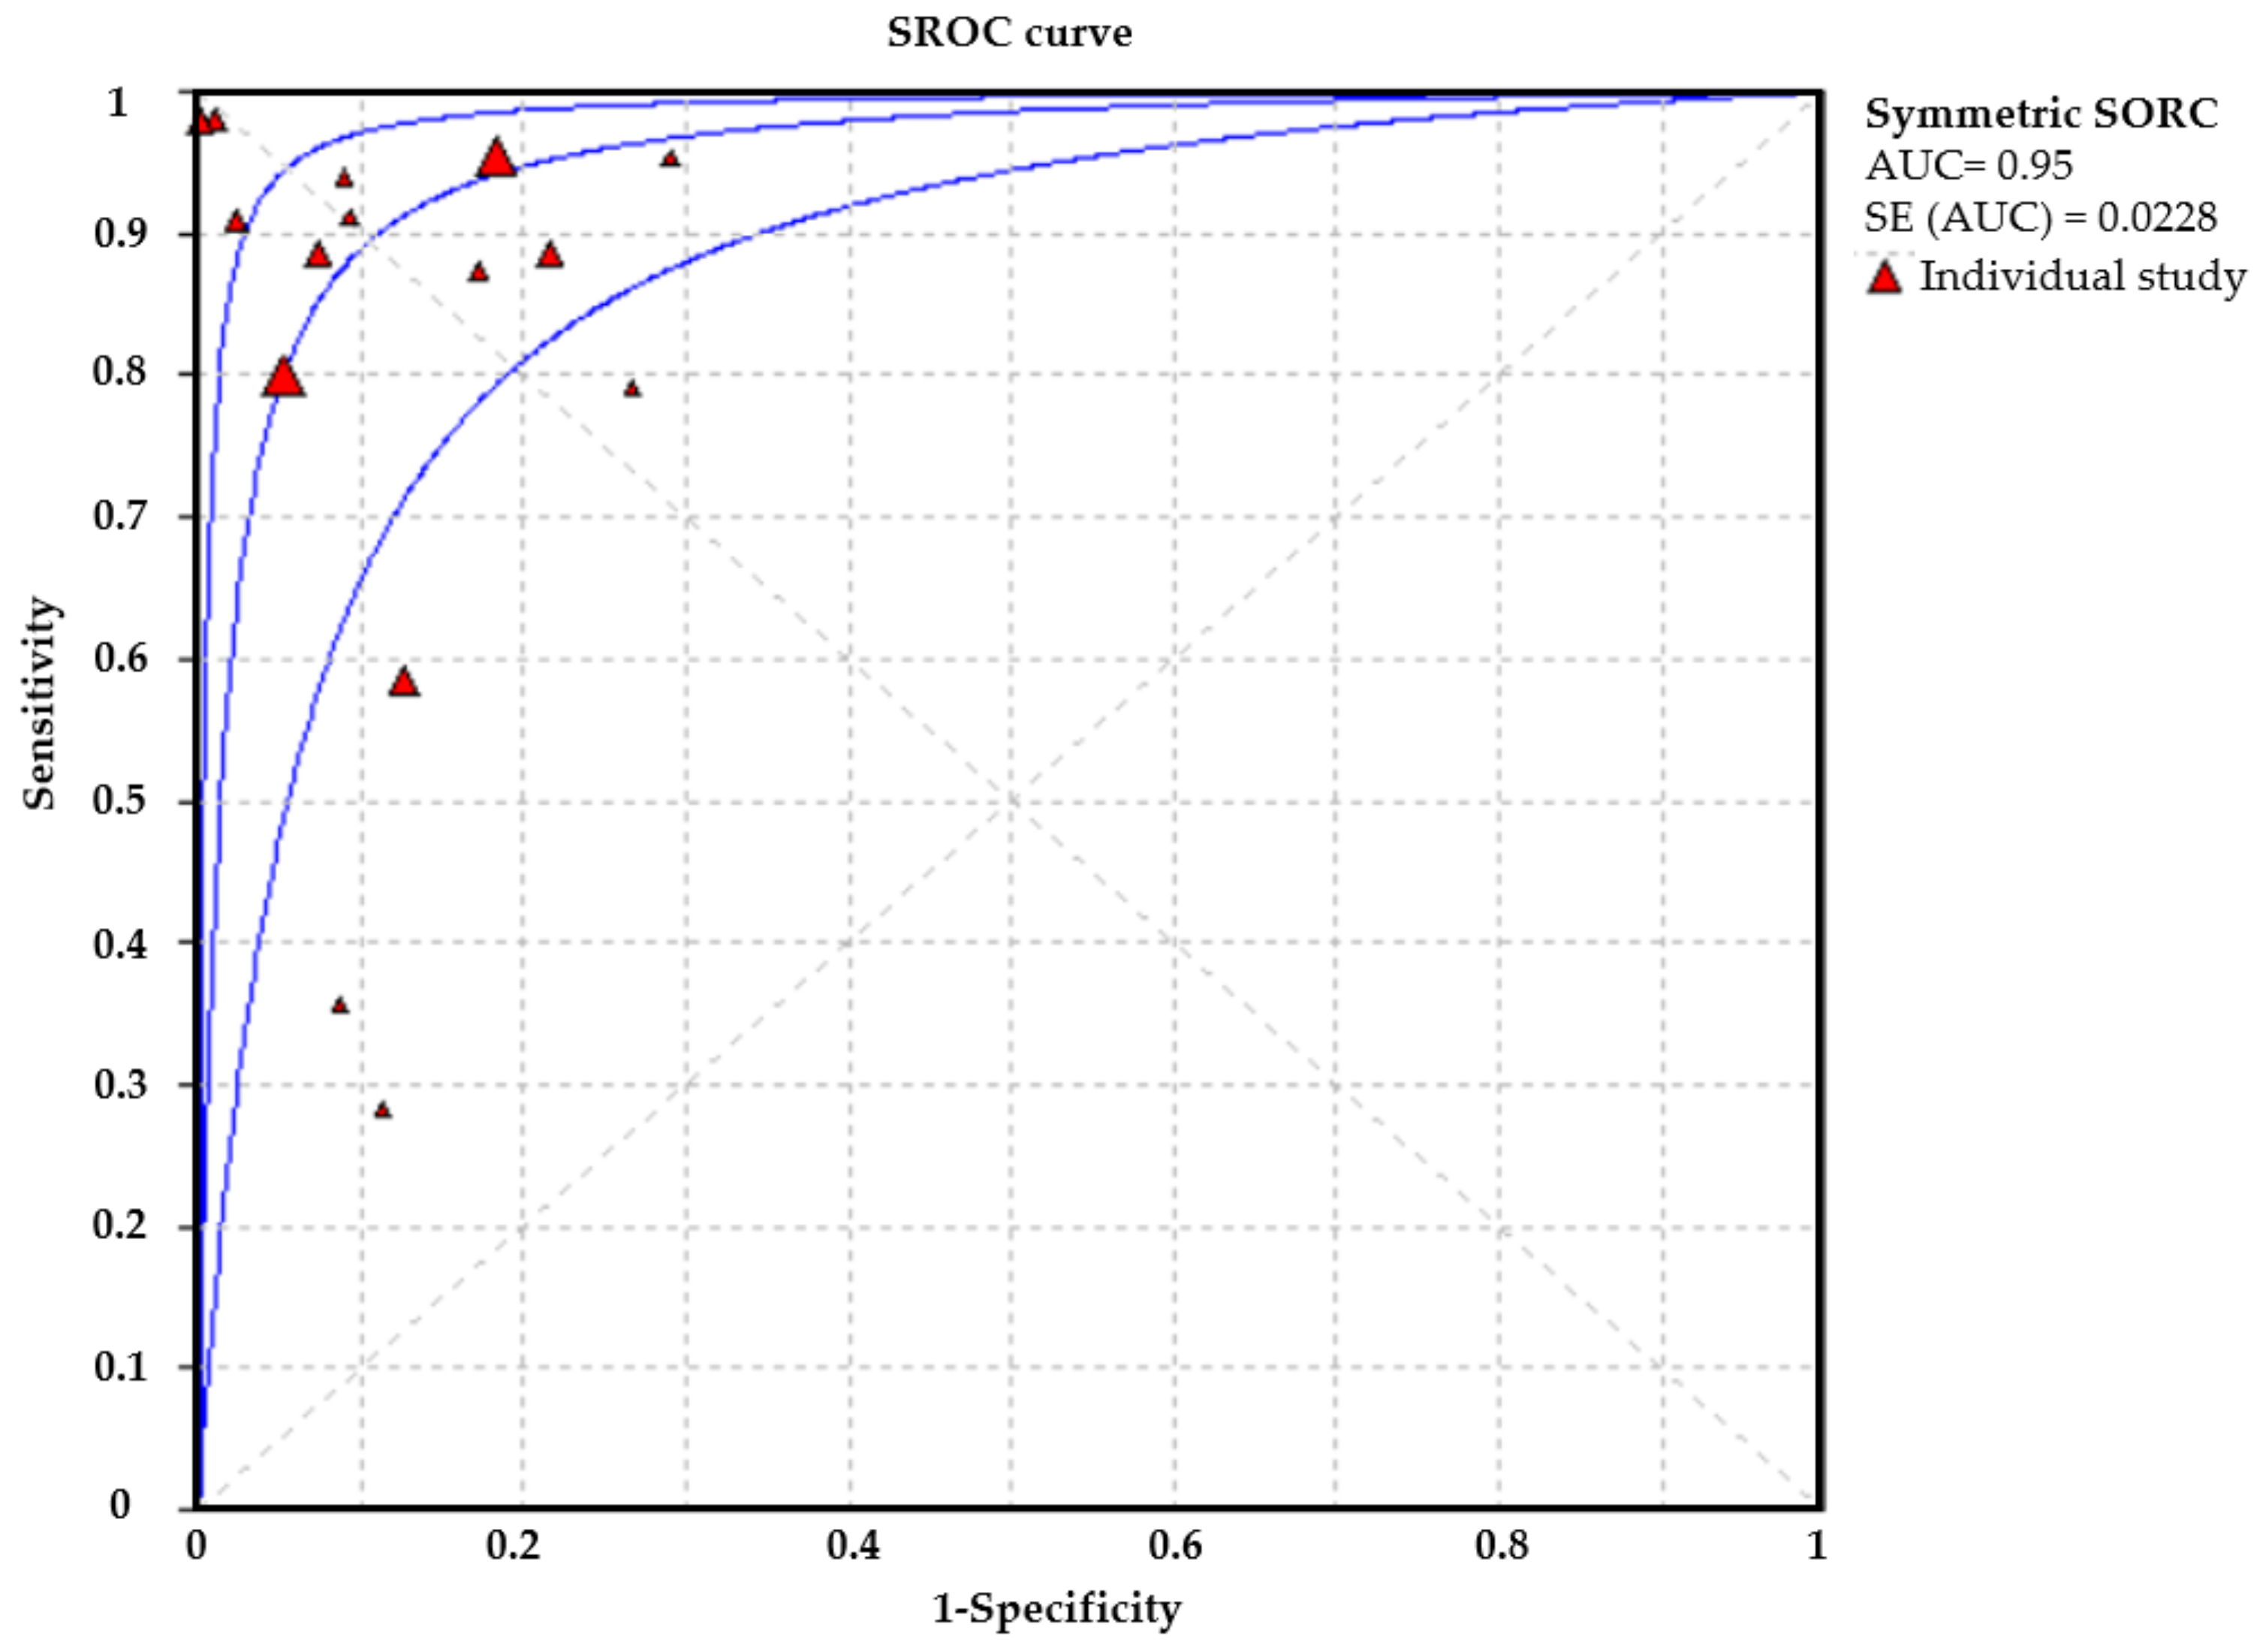
3. Results
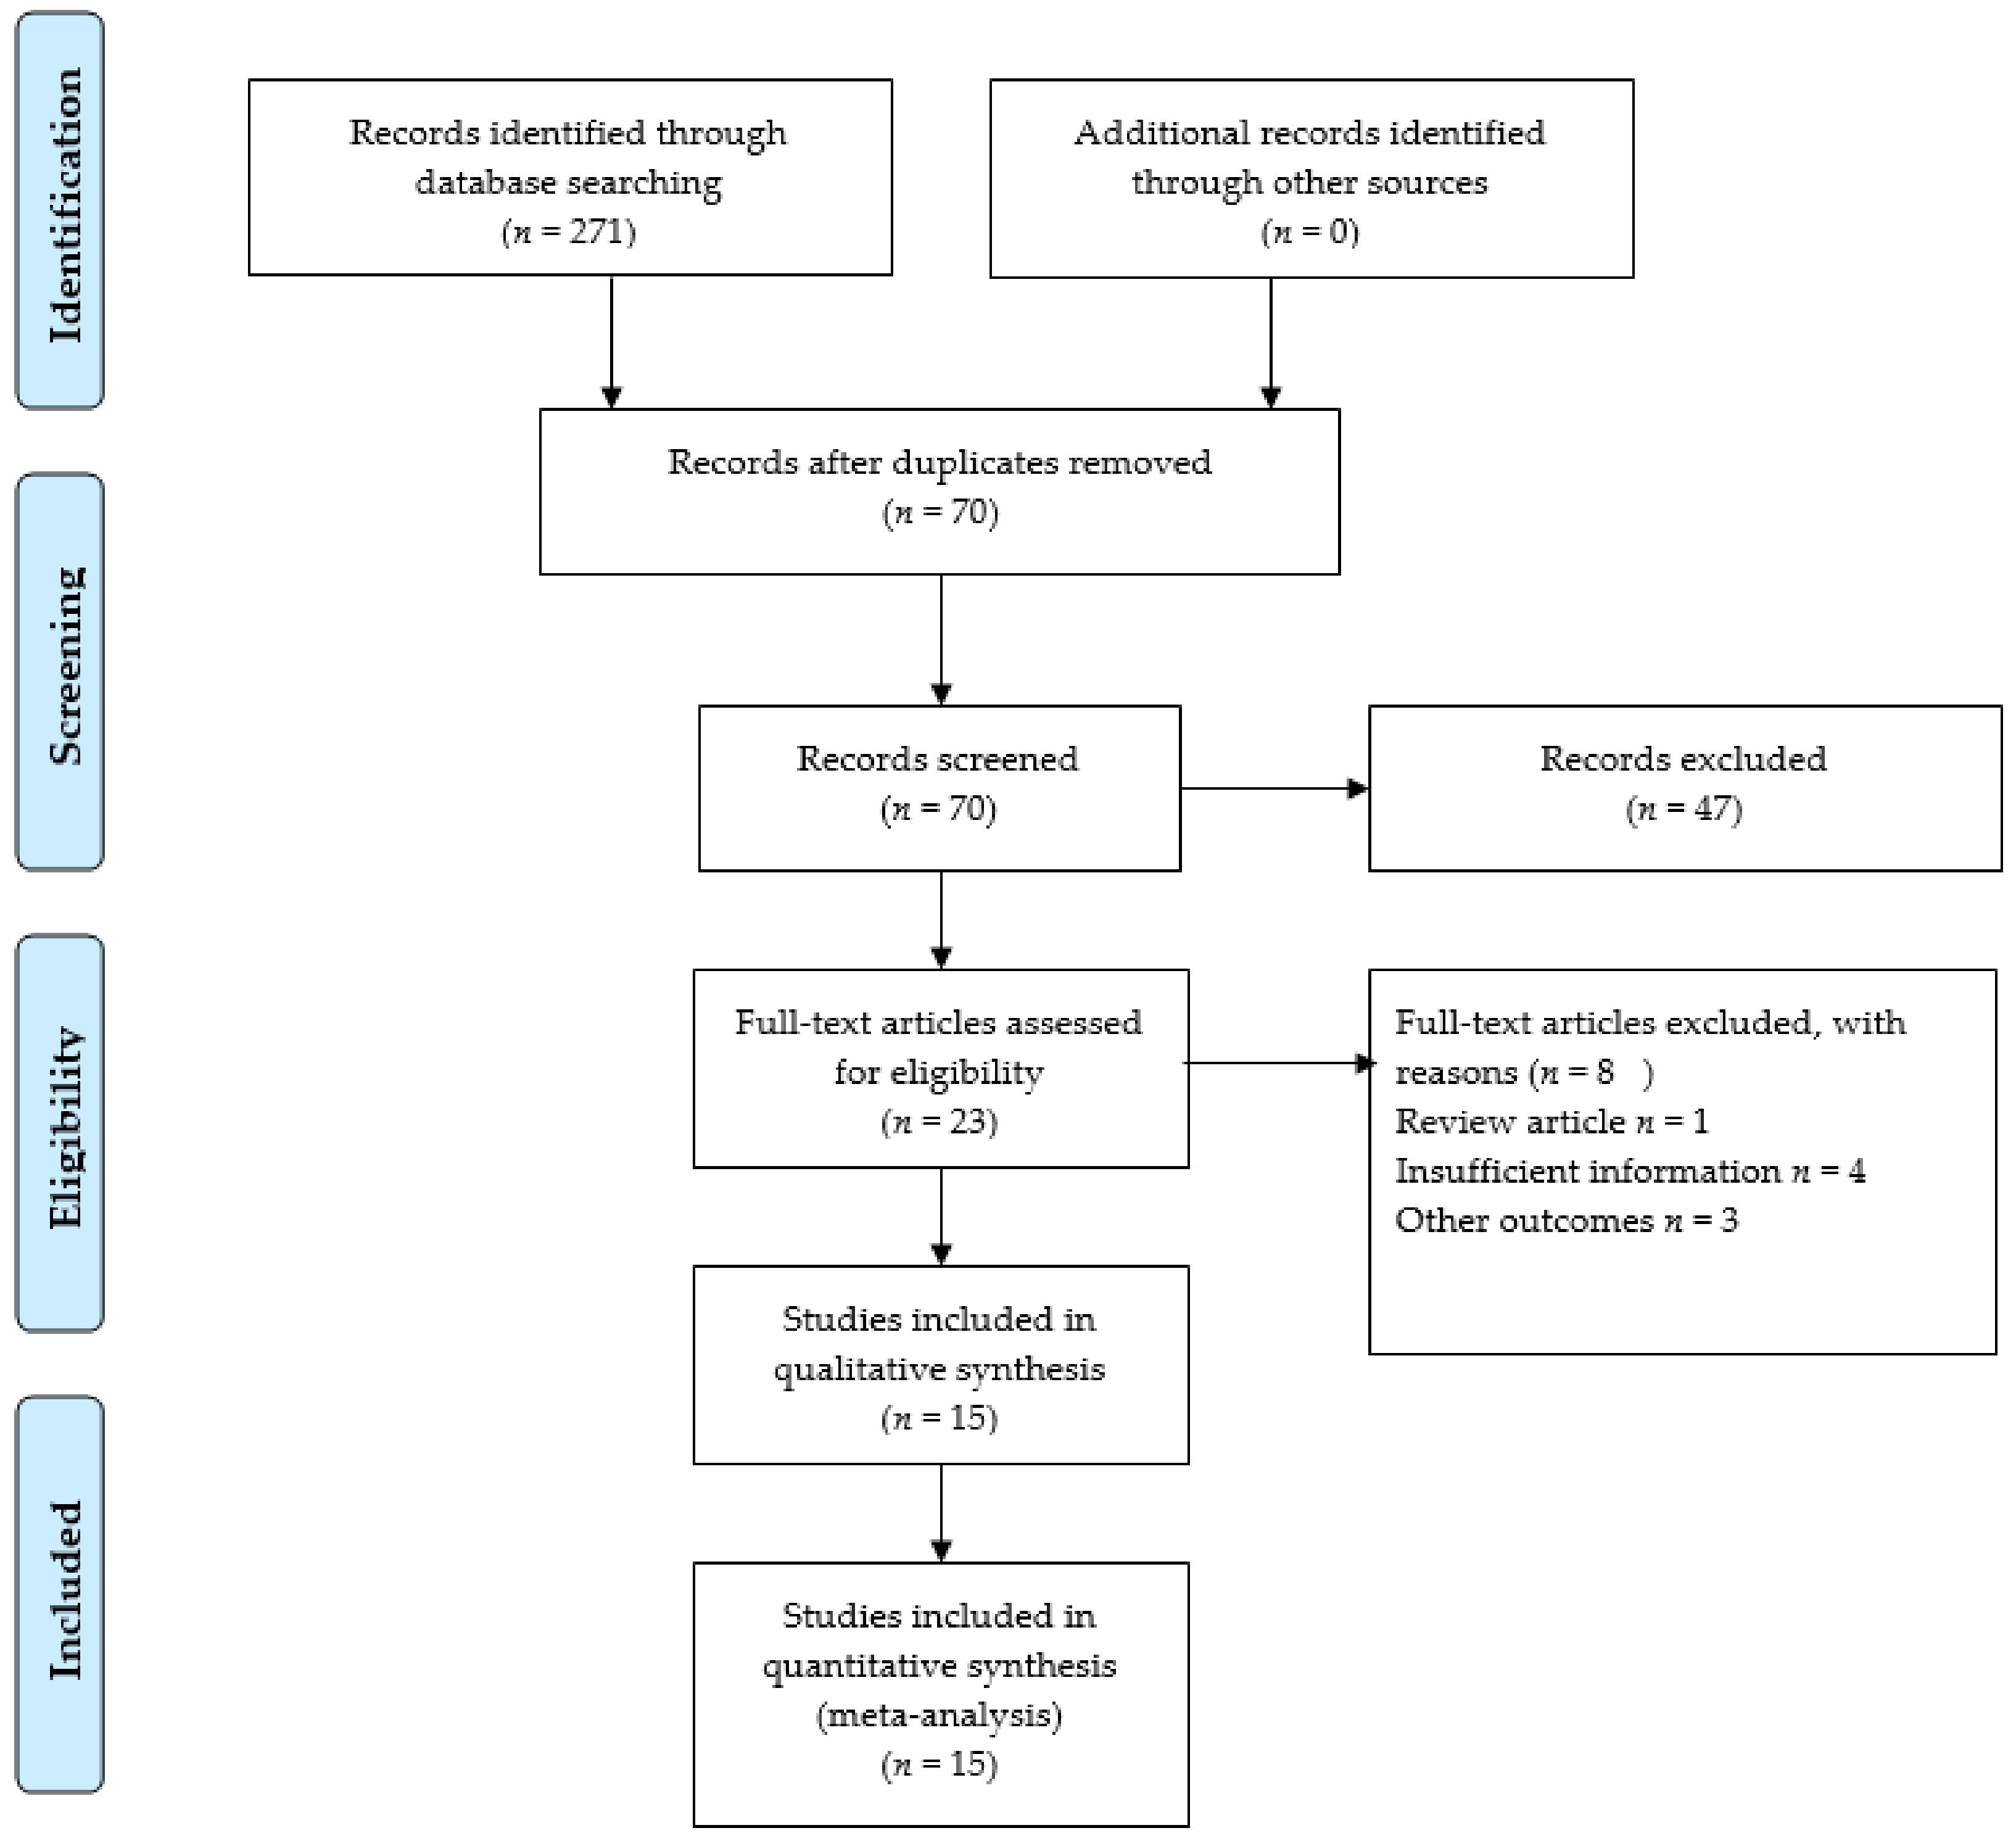
3.1. Study Selection
3.2. Study Characteristics
3.3. Deep Learning Model for EGC:
3.4. Performance Evaluation in Different Image Modalities
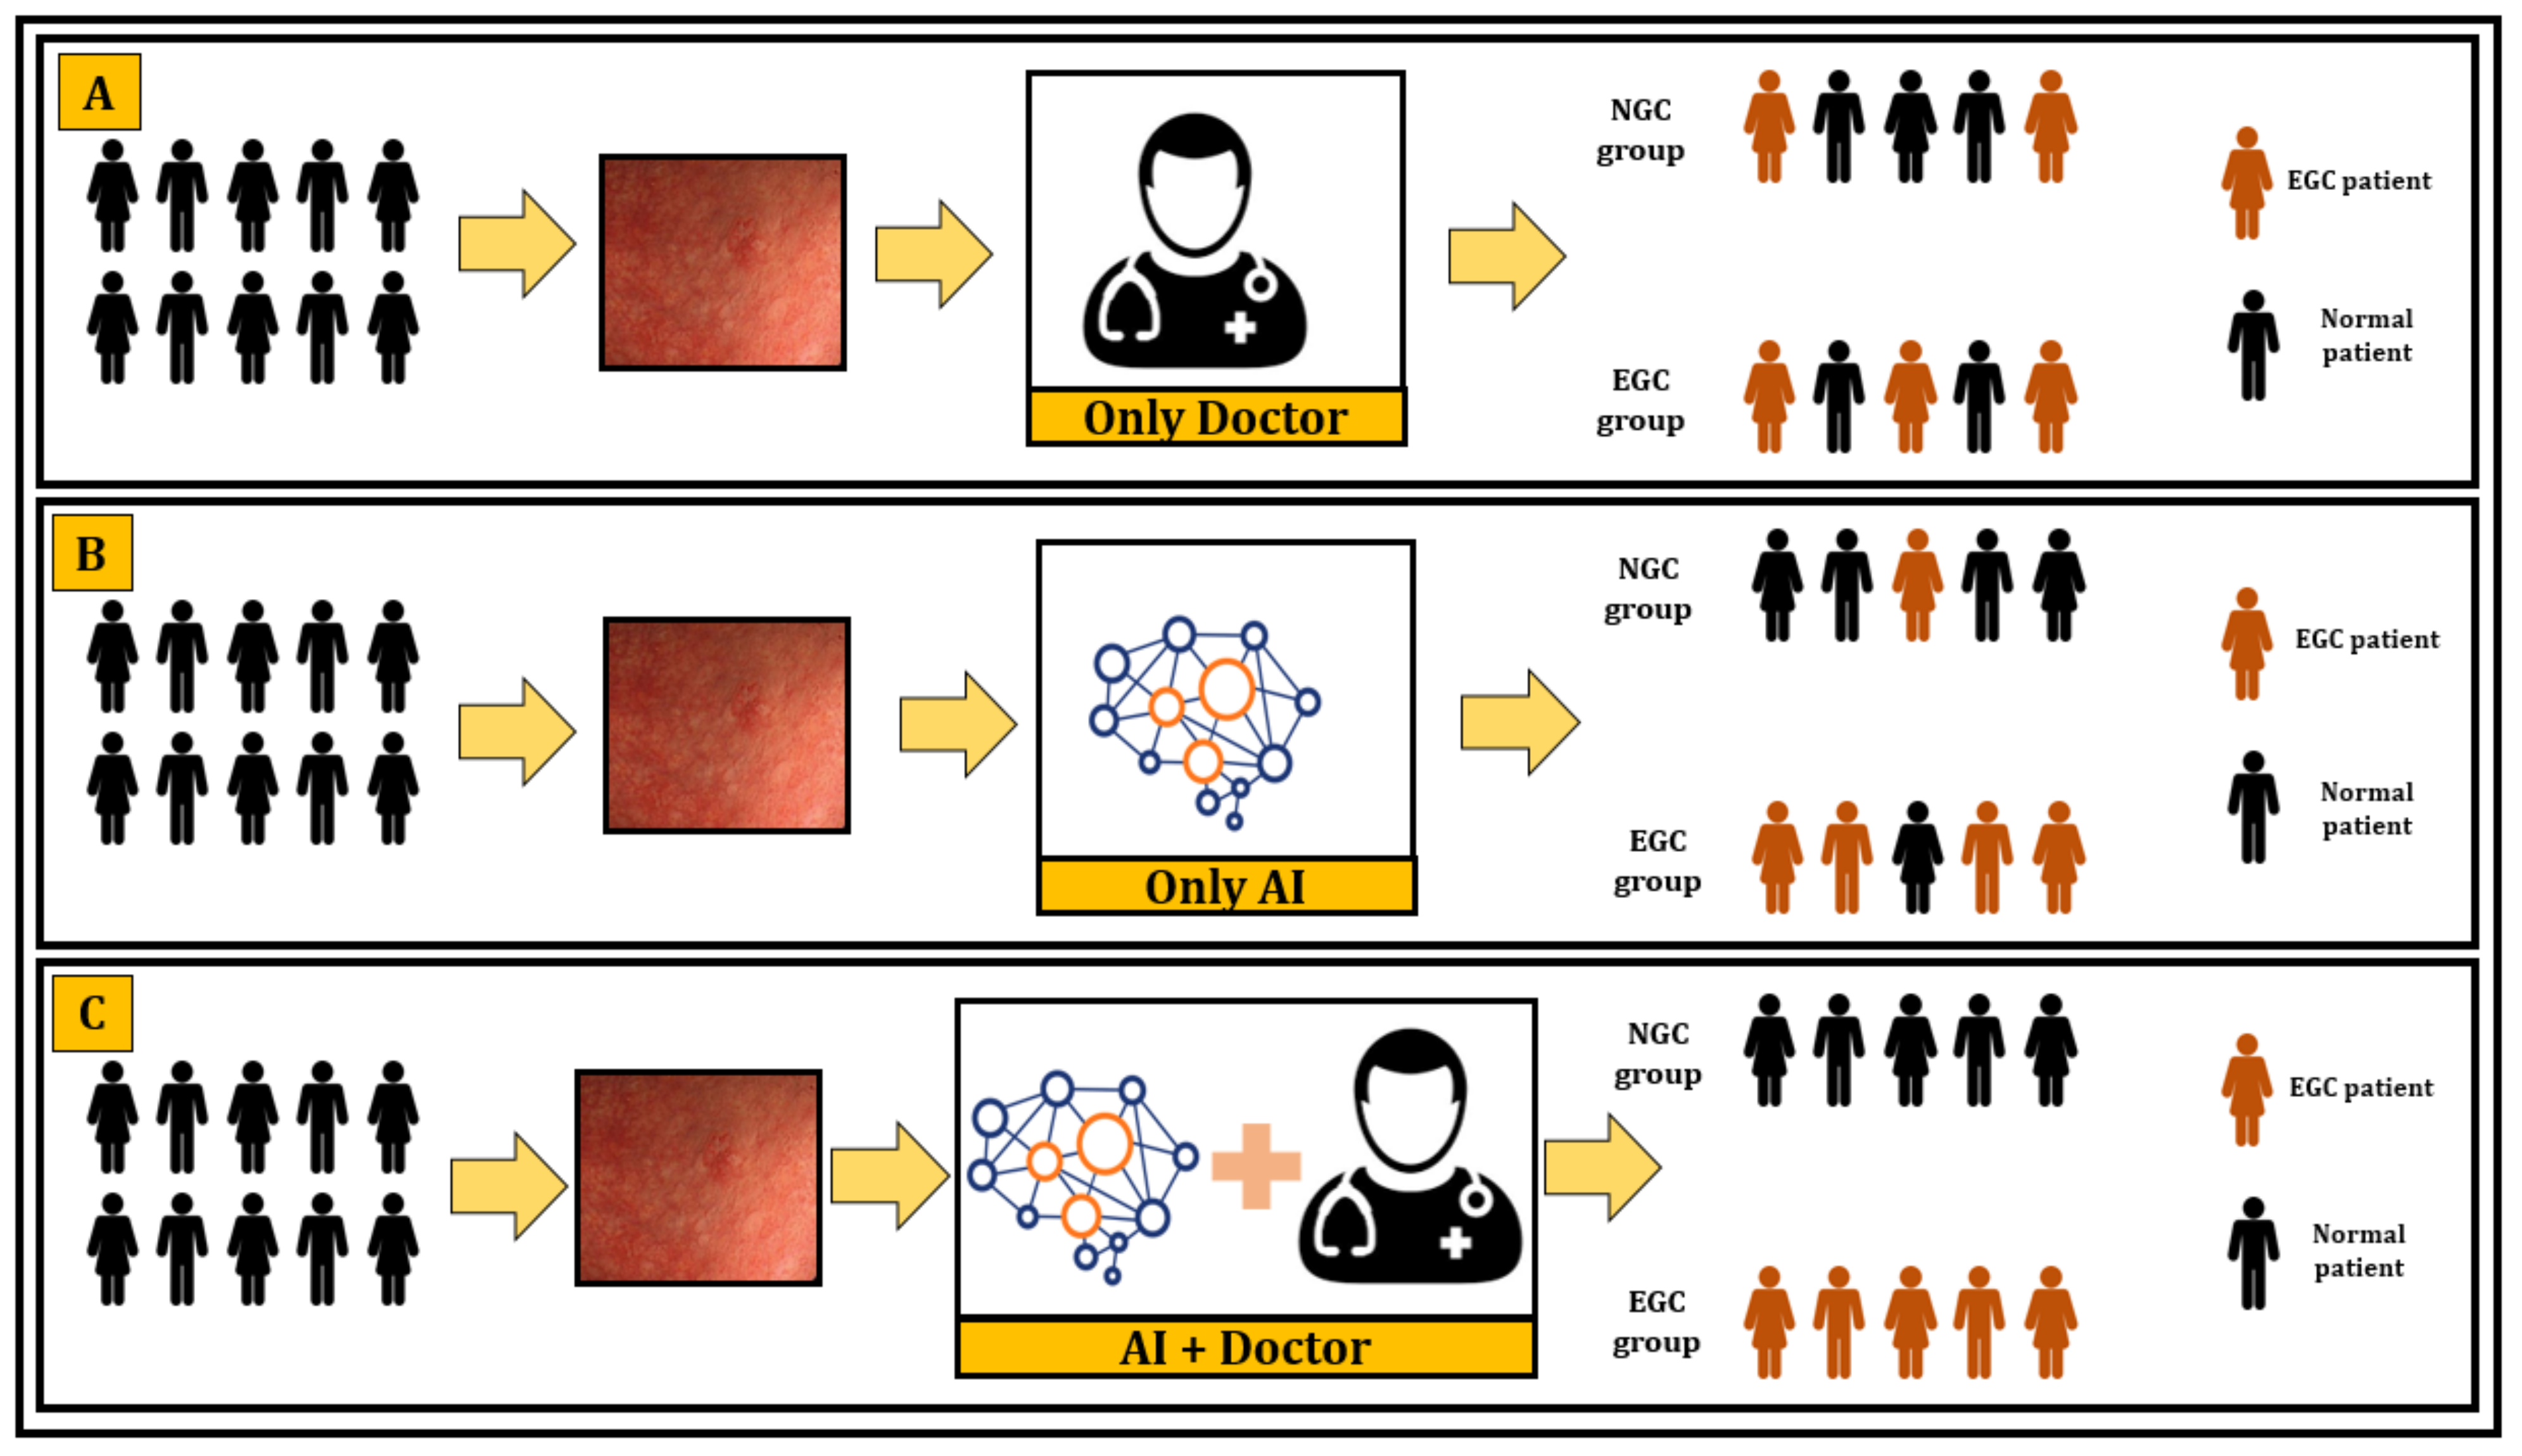
3.5. Deep Learning versus Endoscopists
3.6. Quality Assessment
4. Discussion
4.1. Main Findings
4.2. Clinical Implications
4.3. Strengths and Limitations
5. Conclusions
Supplementary Materials
Author Contributions
Funding
Institutional Review Board Statement
Informed Consent Statement
Data Availability Statement
Conflicts of Interest
References
- Bray, F.; Me, J.F.; Soerjomataram, I.; Siegel, R.L.; Torre, L.A.; Jemal, A. Global cancer statistics 2018: GLOBOCAN estimates of incidence and mortality worldwide for 36 cancers in 185 countries. CA Cancer J. Clin. 2018, 68, 394–424. [Google Scholar] [CrossRef]
- Thrift, A.P.; El-Serag, H.B. Burden of gastric cancer. Clin. Gastroenterol. Hepatol. 2020, 18, 534–542. [Google Scholar] [CrossRef] [PubMed]
- Zong, L.; Abe, M.; Seto, Y.; Ji, J. The challenge of screening for early gastric cancer in China. Lancet 2016, 388, 2606. [Google Scholar] [CrossRef]
- Katai, H.; Ishikawa, T.; Akazawa, K.; Isobe, Y.; Miyashiro, I.; Oda, I.; Tsujitani, S.; Ono, H.; Tanabe, S.; Fukagawa, T.; et al. Five-year survival analysis of surgically resected gastric cancer cases in Japan: A retrospective analysis of more than 100,000 patients from the nationwide registry of the Japanese Gastric Cancer Association (2001–2007). Gastric Cancer 2018, 21, 144–154. [Google Scholar] [CrossRef] [PubMed]
- Chun, H.J.; Keum, B.; Kim, J.H.; Seol, S.Y. Current status of endoscopic submucosal dissection for the management of early gastric cancer: A Korean perspective. World J.Gastroenterol. 2011, 17, 2592. [Google Scholar] [CrossRef]
- Ikenoyama, Y.; Hirasawa, T.; Ishioka, M.; Namikawa, K.; Yoshimizu, S.; Horiuchi, Y.; Ishiyama, A.; Yoshio, T.; Tsuchida, T.; Takeuchi, Y.; et al. Detecting early gastric cancer: Comparison between the diagnostic ability of convolutional neural networks and endoscopists. Dig. Endosc. 2021, 33, 141–150. [Google Scholar] [CrossRef]
- Zhang, Q.; Chen, Z.Y.; Chen, C.D.; Liu, T.; Tang, X.W.; Ren, Y.T.; Huang, S.L.; Cui, X.B.; An, S.L.; Xiao, B.; et al. Training in early gastric cancer diagnosis improves the detection rate of early gastric cancer: An observational study in China. Medicine 2015, 94, e384. [Google Scholar] [CrossRef]
- Ren, W.; Yu, J.; Zhang, Z.M.; Song, Y.K.; Li, Y.H.; Wang, L. Missed diagnosis of early gastric cancer or high-grade intraepithelial neoplasia. World J.Gastroenterol. 2013, 19, 2092. [Google Scholar] [CrossRef] [PubMed]
- Amin, A.; Gilmour, H.; Graham, L.; Paterson-Brown, S.; Terrace, J.; Crofts, T.J. Gastric adenocarcinoma missed at endoscopy. J. R. Coll. Surg. Edinb. 2002, 47, 681–684. [Google Scholar]
- Yalamarthi, S.; Witherspoon, P.; McCole, D.; Auld, C.D. Missed diagnoses in patients with upper gastrointestinal cancers. Endoscopy 2004, 36, 874–879. [Google Scholar] [CrossRef]
- Menon, S.; Trudgill, N. How commonly is upper gastrointestinal cancer missed at endoscopy? A meta-analysis. Endosc. Int. Open 2014, 2, E46. [Google Scholar] [CrossRef] [PubMed]
- Hosokawa, O.; Hattori, M.; Douden, K.; Hayashi, H.; Ohta, K.; Kaizaki, Y. Difference in accuracy between gastroscopy and colonoscopy for detection of cancer. Hepatogastroenterology 2007, 54, 442–444. [Google Scholar] [PubMed]
- Canakis, A.; Pani, E.; Saumoy, M.; Shah, S.C. Decision model analyses of upper endoscopy for gastric cancer screening and preneoplasia surveillance: A systematic review. Ther. Adv. Gastroenterol. 2020, 13, 1756284820941662. [Google Scholar] [CrossRef]
- Nakayoshi, T.; Tajiri, H.; Matsuda, K.; Kaise, M.; Ikegami, M.; Sasaki, H. Magnifying endoscopy combined with narrow band imaging system for early gastric cancer: Correlation of vascular pattern with histopathology (including video). Endoscopy 2004, 36, 1080–1084. [Google Scholar] [CrossRef]
- Ezoe, Y.; Muto, M.; Horimatsu, T.; Minashi, K.; Yano, T.; Sano, Y.; Chiba, T.; Ohtsu, A. Magnifying narrow-band imaging versus magnifying white-light imaging for the differential diagnosis of gastric small depressive lesions: A prospective study. Gastrointest. Endosc. 2010, 71, 477–484. [Google Scholar] [CrossRef]
- Ezoe, Y.; Muto, M.; Uedo, N.; Doyama, H.; Yao, K.; Oda, I.; Kaneko, K.; Kawahara, Y.; Yokoi, C.; Sugiura, Y.; et al. Magnifying narrowband imaging is more accurate than conventional white-light imaging in diagnosis of gastric mucosal cancer. Gastroenterology 2011, 141, 2017–2025.e3. [Google Scholar] [CrossRef] [PubMed]
- Uedo, N.; Ishihara, R.; Iishi, H.; Yamamoto, S.; Yamada, T.; Imanaka, K.; Takeuchi, Y.; Higashino, K.; Ishiguro, S.; Tatsuta, M. A new method of diagnosing gastric intestinal metaplasia: Narrow-band imaging with magnifying endoscopy. Endoscopy 2006, 38, 819–824. [Google Scholar] [CrossRef] [PubMed]
- Pimenta-Melo, A.R.; Monteiro-Soares, M.; Libânio, D.; Dinis-Ribeiro, M. Missing rate for gastric cancer during upper gastrointestinal endoscopy: A systematic review and meta-analysis. Eur. J. Gastroenterol. Hepatol. 2016, 28, 1041–1049. [Google Scholar] [CrossRef]
- Miyaki, R.; Yoshida, S.; Tanaka, S.; Kominami, Y.; Sanomura, Y.; Matsuo, T.; Oka, S.; Raytchev, B.; Tamaki, T.; Koide, T.; et al. A computer system to be used with laser-based endoscopy for quantitative diagnosis of early gastric cancer. J. Clin. Gastroenterol. 2015, 49, 108–115. [Google Scholar] [CrossRef]
- Wang, C.-C.; Chiu, Y.-C.; Chen, W.-L.; Yang, T.-W.; Tsai, M.-C.; Tseng, M.-H.A. A Deep Learning Model for Classification of Endoscopic Gastroesophageal Reflux Disease. Int. J. Environ. Res. Public Health 2021, 18, 2428. [Google Scholar]
- Ichimasa, K.; Kudo, S.-E.; Mori, Y.; Misawa, M.; Matsudaira, S.; Kouyama, Y.; Baba, T.; Hidaka, E.; Wakamura, K.; Hayashi, T.; et al. Artificial intelligence may help in predicting the need for additional surgery after endoscopic resection of T1 colorectal cancer. Endoscopy 2018, 50, 230–240. [Google Scholar] [PubMed]
- Boorn, H.G.V.D.; Engelhardt, E.; Van Kleef, J.; Sprangers, M.A.G.; Van Oijen, M.G.H.; Abu-Hanna, A.; Zwinderman, A.H.; Coupe, V.; Van Laarhoven, H.W.M. Prediction models for patients with esophageal or gastric cancer: A systematic review and meta-analysis. PLoS ONE 2018, 13, e0192310. [Google Scholar]
- McInnes, M.D.F.; Moher, D.; Thombs, B.D.; McGrath, T.A.; Bossuyt, P.M.; the PRISMA-DTA Group; Clifford, T.; Cohen, J.F.; Deeks, J.J.; Gatsonis, C.; et al. Preferred reporting items for a systematic review and meta-analysis of diagnostic test accuracy studies: The PRISMA-DTA statement. JAMA 2018, 319, 388–396. [Google Scholar] [CrossRef] [PubMed]
- Whiting, P.F.; Rutjes, A.W.S.; Westwood, M.E.; Mallett, S.; Deeks, J.; Reitsma, J.B.; Leeflang, M.; Sterne, J.; Bossuyt, P. M QUADAS-2: A revised tool for the quality assessment of diagnostic accuracy studies. Ann. Intern. Med. 2011, 155, 529–536. [Google Scholar] [CrossRef]
- Islam, M.; Poly, T.N.; Walther, B.A.; Yang, H.C.; Li, Y.-C. Artificial intelligence in ophthalmology: A meta-analysis of deep learning models for retinal vessels segmentation. J. Clin. Med. 2020, 9, 1018. [Google Scholar] [CrossRef]
- Cho, B.-J.; Bang, C.S.; Park, S.W.; Yang, Y.J.; Seo, S.I.; Lim, H.; Shin, W.G.; Hong, J.T.; Yoo, Y.T.; Hong, S.H.; et al. Automated classification of gastric neoplasms in endoscopic images using a convolutional neural network. Endoscopy 2019, 51, 1121–1129. [Google Scholar] [CrossRef]
- Hirasawa, T.; Aoyama, K.; Tanimoto, T.; Ishihara, S.; Shichijo, S.; Ozawa, T.; Ohnishi, T.; Fujishiro, M.; Matsuo, K.; Fujisaki, J.; et al. Application of artificial intelligence using a convolutional neural network for detecting gastric cancer in endoscopic images. Gastric Cancer 2018, 21, 653–660. [Google Scholar] [CrossRef]
- Horiuchi, Y.; Aoyama, K.; Tokai, Y.; Hirasawa, T.; Yoshimizu, S.; Ishiyama, A.; Yoshio, T.; Tsuchida, T.; Fujisaki, J.; Tada, T. Convolutional neural network for differentiating gastric cancer from gastritis using magnified endoscopy with narrow band imaging. Dig. Dis. Sci. 2019, 65, 1355–1364. [Google Scholar] [CrossRef]
- Horiuchi, Y.; Hirasawa, T.; Ishizuka, N.; Tokai, Y.; Namikawa, K.; Yoshimizu, S.; Ishiyama, A.; Yoshio, T.; Tsuchida, T.; Fujisaki, J.; et al. Performance of a computer-aided diagnosis system in diagnosing early gastric cancer using magnifying endoscopy videos with narrow-band imaging (with videos). Gastrointest. Endosc. 2020, 92, 856–865.e1. [Google Scholar] [CrossRef]
- Hu, H.; Gong, L.; Dong, D.; Zhu, L.; Wang, M.; He, J.; Shu, L.; Cai, Y.; Cai, S.; Su, W.; et al. Identifying early gastric cancer under magnifying narrow-band images via deep learning: A multicenter study. Gastrointest. Endosc. 2020, 93, 1333–1341. [Google Scholar] [CrossRef]
- Li, L.; Chen, Y.; Shen, Z.; Zhang, X.; Sang, J.; Ding, Y.; Yang, X.; Li, J.; Chen, M.; Jin, C.; et al. Convolutional neural network for the diagnosis of early gastric cancer based on magnifying narrow band imaging. Gastric Cancer 2020, 23, 126–132. [Google Scholar] [CrossRef]
- Ling, T.; Wu, L.; Fu, Y.; Xu, Q.; An, P.; Zhang, J.; Hu, S.; Chen, Y.; He, X.; Wang, J.; et al. A Deep Learning-based System for Identifying Differentiation Status and Delineating Margins of Early Gastric Cancer in Magnifying Narrow-band Imaging Endoscopy. Endoscopy 2020, 53, 469–477. [Google Scholar] [CrossRef]
- Liu, X.; Wang, C.; Hu, Y.; Zeng, Z.; Bai, J.Y.; Liao, G.B. Transfer learning with convolutional neural network for early gastric cancer classification on magnifiying narrow-band imaging images. In Proceedings of the 2018 25th IEEE International Conference on Image Processing (ICIP), Athens, Greece, 7–10 October 2018; IEEE: Athens, Greece, 2018; pp. 1388–1392. [Google Scholar]
- Sakai, Y.; Takemoto, S.; Hori, K.; Nishimura, M.; Ikematsu, H.; Yano, T.; Yokota, H. Automatic detection of early gastric cancer in endoscopic images using a transferring convolutional neural network. In Proceedings of the 2018 40th Annual International Conference of the IEEE Engineering in Medicine and Biology Society (EMBC), Honolulu, HI, USA, 18–21 July 2018; IEEE: Piscataway, NJ, USA, 2018; pp. 4138–4141. [Google Scholar]
- Tang, D.; Wang, L.; Ling, T.; Lv, Y.; Ni, M.; Zhan, Q.; Fu, Y.; Zhuang, D.; Guo, H.; Dou, X.; et al. Development and validation of a real-time artificial intelligence-assisted system for detecting early gastric cancer: A multicentre retrospective diagnostic study. EBio Med. 2020, 62, 103146. [Google Scholar]
- Ueyama, H.; Kato, Y.; Akazawa, Y.; Yatagai, N.; Komori, H.; Takeda, T.; Matsumoto, K.; Ueda, K.; Matsumoto, K.; Hojo, M.; et al. Application of artificial intelligence using a convolutional neural network for diagnosis of early gastric cancer based on magnifying endoscopy with narrow—Band imaging. J. Gastroenterol. Hepatol. 2021, 36, 482–489. [Google Scholar] [CrossRef]
- Wu, L.; Zhou, W.; Wan, X.; Zhang, J.; Shen, L.; Hu, S.; Ding, Q.; Mu, G.; Yin, A.; Huang, X.; et al. A deep neural network improves endoscopic detection of early gastric cancer without blind spots. Endoscopy 2019, 51, 522–531. [Google Scholar] [CrossRef] [PubMed]
- Yoon, H.J.; Kim, S.; Kim, J.-H.; Keum, J.-S.; Oh, S.-I.; Jo, J.; Chun, J.; Youn, Y.H.; Park, H.; Kwon, I.G.; et al. A lesion-based convolutional neural network improves endoscopic detection and depth prediction of early gastric cancer. J. Clin. Med. 2019, 8, 1310. [Google Scholar] [CrossRef]
- Zhang, L.; Zhang, Y.; Wang, L.; Wang, J.; Liu, Y. Diagnosis of gastric lesions through a deep convolutional neural network. Dig. Endosc. 2020, 33, 788–796. [Google Scholar] [CrossRef] [PubMed]
- Rahman, R.; Asombang, A.W.; Ibdah, J.A. Characteristics of gastric cancer in Asia. World J. Gastroenterol. 2014, 20, 4483. [Google Scholar] [CrossRef] [PubMed]
- Shiota, S.; Matsunari, O.; Watada, M.; Yamaoka, Y. Serum Helicobacter pylori CagA antibody as a biomarker for gastric cancer in east-Asian countries. Future Microbiol. 2010, 5, 1885–1893. [Google Scholar] [CrossRef]
- Lopez-Ceron, M.; Broek, F.J.V.D.; Mathus-Vliegen, E.M.; Boparai, K.S.; van Eeden, S.; Fockens, P.; Dekker, E. The role of high-resolution endoscopy and narrow-band imaging in the evaluation of upper GI neoplasia in familial adenomatous polyposis. Gastrointest. Endosc. 2013, 77, 542–550. [Google Scholar] [CrossRef]
- Malekzadeh, R.; Sotoudeh, M.; Derakhshan, M.; Mikaeli, J.; Yazdanbod, A.; Merat, S.; Yoonessi, A.; Tavangar, S.M.; Abedi, B.A.; Sotoudehmanesh, R.; et al. Prevalence of gastric precancerous lesions in Ardabil, a high incidence province for gastric adenocarcinoma in the northwest of Iran. J. Clin. Pathol. 2004, 57, 37–42. [Google Scholar] [CrossRef][Green Version]
- Morii, Y.; Arita, T.; Shimoda, K.; Yasuda, K.; Yoshida, T.; Kitano, S. Effect of periodic endoscopy for gastric cancer on early detection and improvement of survival. Gastric Cancer 2001, 4, 132–136. [Google Scholar] [CrossRef][Green Version]
- Kim, G.H.; Liang, P.S.; Bang, S.J.; Hwang, J.H. Screening and surveillance for gastric cancer in the United States: Is it needed? Gastrointest. Endosc. 2016, 84, 18–28. [Google Scholar] [CrossRef]
- Kato, M.; Asaka, M. Recent development of gastric cancer prevention. Jpn. J. Clin. Oncol. 2012, 42, 987–994. [Google Scholar] [CrossRef]
- Ali, H.; Yasmin, M.; Sharif, M.; Rehmani, M.H. Computer assisted gastric abnormalities detection using hybrid texture descriptors for chromoendoscopy images. Comput. Methods Programs Biomed. 2018, 157, 39–47. [Google Scholar] [CrossRef] [PubMed]
- Yuan, Y.; Meng, M.Q.-H. Automatic bleeding frame detection in the wireless capsule endoscopy images. In Proceedings of the 2015 IEEE International Conference on Robotics and Automation (ICRA), Seattle, WA, USA, 26–30 May 2015; IEEE: Piscataway, NJ, USA, 2015; pp. 1310–1315. [Google Scholar]
- Lee, J.H.; Cho, J.Y.; Choi, M.G.; Kim, J.S.; Choi, K.D.; Lee, Y.C.; Jang, J.Y.; Chun, H.J.; Seol, S.Y. Usefulness of autofluorescence imaging for estimating the extent of gastric neoplastic lesions: A prospective multicenter study. Gut Liver 2008, 2, 174. [Google Scholar] [CrossRef] [PubMed]
- Zhu, L.Y.; Li, X.B. Narrow band imaging: Application for early—Stage gastrointestinal neoplasia. J. Dig. Dis. 2014, 15, 217–223. [Google Scholar] [CrossRef] [PubMed]
- Yao, K.; Anagnostopoulos, G.; Ragunath, K. Magnifying endoscopy for diagnosing and delineating early gastric cancer. Endoscopy 2009, 41, 462–467. [Google Scholar] [CrossRef] [PubMed]
- Buhrmester, V.; Münch, D.; Arens, M. Analysis of explainers of black box deep neural networks for computer vision: A survey. arXiv 2019, arXiv:191112116 2019. [Google Scholar]
- Castelvecchi, D. Can we open the black box of AI? Nat. News 2016, 538, 20. [Google Scholar] [CrossRef] [PubMed]
- Dayhoff, J.E.; DeLeo, J.M. Artificial neural networks: Opening the black box. Cancer Interdiscip. Int. J. Am. Cancer Soc. 2001, 91, 1615–1635. [Google Scholar] [CrossRef]
- Watson, D.S.; Krutzinna, J.; Bruce, I.N.; Griffiths, C.E.; McInnes, I.B.; Barnes, M.R.; Floridi, L. Clinical applications of machine learning algorithms: Beyond the black box. BMJ 2019, 364, 1886. [Google Scholar]


| Study | Country | Year | Design | Model (Algorithm) | Total Images | Total Patients | Data Partition Process | External Validation | Sen/Spe | Level |
|---|---|---|---|---|---|---|---|---|---|---|
| Cho-2020 [26] | Korea | 2010–2017 | Retrospective | CNN (Inception-Resnet-v2) | 5017 | 200 | Split | Yes | 0.283/0.883 | AGC, EGC, HGD, LGD, and non-neoplasm |
| Hirasawa-2018 [27] | Japan | 2004–2016 | Retrospective | CNN (SSD) | 2296 | 69 | Split | No | 0.885/0.927 | EGC, NGC |
| Horiuchi-2020 [28] | Japan | 2005–2016 | Retrospective | CNN (GoogLeNet) | 2570 | NR | Split | No | 0.954/0.710 | EGC, gastritis |
| Horiuchi-2020 [29] | Japan | 2005–2016 | Retrospective | CNN (GoogLeNet) | 2570 | 82 | Split | No | 0.874/0.828 | EGC, NGC |
| Hu-2020 [30] | China | 2017–2020 | Retrospective | CNN (VGG-19) | 1777 | 295 | Split | Yes | 0.792/0.745 | NN, MLGN, LC, SIC, EGC |
| Ikenoyama-2021 [6] | Japan | 2004–2016 | Retrospective | CNN (SSD) | 13,584 | 2639 | Split | No | 0.59/0.87 | EGC, NGC |
| Yoon-2019 [38] | Korea | 2012–2018 | Retrospective | CNN (VGG-16) | 11,539 | 800 | Split | No | 0.910/0.976 | EGC, NGC |
| Li-2019 [31] | China | 2017–2018 | Retrospective | CNN (Inception-v3) | 10,000 | NR | Split | No | 0.9118/0.906 | EGC, NGC |
| Ling-2020 [32] | China | 2015–2020 | Retrospective | CNN (VGG-16) | 9025 | 561 | Split | Yes | 0.886/0.786 | EGC, NGC |
| Liu-2018 [33] | China | NR | Retrospective | CNN (Inception-v3) | 2331 | NR | Split | No | 0.981/0.988 | EGC, NGC |
| Sakai-2018 [34] | Japan | NR | Retrospective | CNN (GoogLeNet) | 926 | 58 | Split | No | 0.800/0.948 | EGC, NGC |
| Tang-2020 [35] | China | 2016–2019 | Retrospective | CNN (DCNN) | l45,240 | 1364 | Split | Yes | 0.955/0.817 | EGC, NGC |
| Ueyama-2020 [36] | Japan | 2013–2018 | Retrospective | CNN (ResNet50) | 5574 | 349 | Split | No | 0.98/1.0 | EGC, NGC |
| Wu-2018 [37] | China | 2016–2018 | Retrospective | CNN (VGG-16+ResNet50) | NR | NR | Split | Yes | 0.940/0.910 | EGC, NGC |
| Zhang-2020 [39] | China | 2012–2018 | Retrospective | CNN (ResNet34) | 21,217 | 1121 | Split | No | 0.360/0.910 | EGC, NGC |
| Study | Data Source | Format | Rotation | Resolutio | Level of Annotator Experience | Gold Standard | Image Terminology | Endoscope |
|---|---|---|---|---|---|---|---|---|
| Cho-2020 | Two Hospitals(CHH & DTSHH) | JPEG | 35-field view | 1280 * 640 | Expert | Histopathology | WL | GIF-Q260, H260 or H290, CV-260 SL or Elite CV-290 |
| Hirasawa-2018 | Two Hospitals (CIH & TTH); Two Clinics (TTIG & LYC) | NR | NR | 300 * 300 | Expert | Japanese classification | WL, ME-NBI, Chromoendoscopy | GIF-H290Z, GIF-H290, GIF-XP290N, GIF-H260Z, GIF-Q260NS, EVIS LUCERA CV-260/CLV-260 EVIS LUCERA ELITE CV-290/ CLV-290SL |
| Horiuchi-2020 | Single Center (CIH) | NR | NR | 224 * 224 | Expert | Histopathology | ME-NBI | GIF-H260Z and GIF-H290Z |
| Horiuchi-2020. | Single Center (CIH) | NR | NR | 224 * 224 | Expert | Histopathology | ME-NBI | GIF-H240Z, GIF-H260Z, and GIF-H290Z: |
| Hu-2020 | Single Center (ZH) | NR | NR | 224 * 224 | Expert | Histopathology | ME-NBI | GIF-H260Z or GIF-H290Z |
| Ikenoyama-2021 | Single Center (CIH) | NR | Anterograde & retroflexed view | 300 * 300 | Expert | Histopathology | WL, NBI, Chromoendoscopy | GIF-H290Z, GIF-H290, GIF-XP290N, GIF-H260Z, GIF-Q260J, GIF-XP260, GIF-XP260NS, GIF-N260 |
| Yoon-2019 | Single Hospital (GSH) | NR | both close-up and a distant view | NR | Expert | WHO classification of tumor & Japanese classification | WL | GIF-Q260J, GIF-H260; GIF-H290 |
| Li-2019 | Four Hospitals | NR | NR | 512 * 512 | Expert | Vienna classification | ME-NBI | GIF-H260Z; GIF-H290Z |
| Ling-2020 | Renmin Hospital | NR | NR | 512 * 512 | Expert | Japanese classification | ME-NBI | GIF-H260Z |
| Liu-2018 | Chongqing Xinqiao Hospital | JPEG | Horizontally, and vertically | 768 * 576, 720 * 480, 1920 * 1080, 1280 * 720 | Expert | NR | ME-NBI | GIF Q140Z; GIF-H260Z |
| Sakai-2018 | NR | NR | NR | 224 * 224 | Expert | Histopathology | WL | GIF-H290Z; GIF TYPE H260Z |
| Tang-2020 | Multi-center | NR | NR | NR | Expert | WHO classification; Japanese classification; European society of gastrointestinal endoscopy | ME-NBI | GIF-H260, GIF-H260Z, GIFHQ290, GIF-H290Z, EVIS LUCERA CV260/CLV260SL, EVIS LUCERA ELITECV290/CLV290SL |
| Ueyama-2020 | Saitama Medical Center | NR | NR | 224 * 224 | Expert | Japanese classification | ME-NBI | (GIF-H260Z; GIF-H290Z |
| Wu-2018 | Renmin Hospital | NR | NR | 224 * 224 | Expert | Histopathology | WL, ME-NBI | CVL-290SL, VP-4450HD |
| Zhang-2020 | Peking University People’s Hospital | NR | NR | NR | Expert | Japanese classification | WL | GIF-H260, GIF-Q260J, GIF-H290, EVIS LUCERA CV-260/CLV-260 |
| Model | SROC | SN | SP | PPV | NPV | +LR | −LR | DOR |
|---|---|---|---|---|---|---|---|---|
| CNNWLI | 0.99 | 0.80 | 0.95 | 0.94 | 0.83 | 9.32 | 0.33 | 28.47 |
| CNNME−NBI | 0.97 | 0.95 | 0.85 | 0.87 | 0.93 | 7.84 | 0.07 | 123.45 |
| CNNWLI+ME−NBI+C | 0.96 | 0.85 | 0.89 | 0.63 | 0.96 | 8.27 | 0.16 | 51.44 |
| Comparison | SROC | SN | SP | PPV | NPV | +LR | −LR | DOR |
|---|---|---|---|---|---|---|---|---|
| CNN | 0.95 | 0.86 | 0.89 | 0.87 | 0.87 | 10.00 | 0.13 | 75.17 |
| Experts | 0.90 | 0.77 | 0.92 | 0.80 | 0.90 | 5.84 | 0.22 | 27.99 |
| Seniors | 0.92 | 0.73 | 0.95 | 0.89 | 0.84 | 7.90 | 0.24 | 33.88 |
| Junior | 0.82 | 0.69 | 0.80 | 0.78 | 0.71 | 3.83 | 0.36 | 11.09 |
| CNN + Expert † | - | 0.97 | 0.91 | 0.91 | 0.98 | - | - | - |
| CNN + Junior † | - | 0.94 | 0.97 | 0.98 | 0.95 | - | - | - |
Publisher’s Note: MDPI stays neutral with regard to jurisdictional claims in published maps and institutional affiliations. |
© 2021 by the authors. Licensee MDPI, Basel, Switzerland. This article is an open access article distributed under the terms and conditions of the Creative Commons Attribution (CC BY) license (https://creativecommons.org/licenses/by/4.0/).
Share and Cite
Islam, M.M.; Poly, T.N.; Walther, B.A.; Lin, M.-C.; Li, Y.-C. Artificial Intelligence in Gastric Cancer: Identifying Gastric Cancer Using Endoscopic Images with Convolutional Neural Network. Cancers 2021, 13, 5253. https://doi.org/10.3390/cancers13215253
Islam MM, Poly TN, Walther BA, Lin M-C, Li Y-C. Artificial Intelligence in Gastric Cancer: Identifying Gastric Cancer Using Endoscopic Images with Convolutional Neural Network. Cancers. 2021; 13(21):5253. https://doi.org/10.3390/cancers13215253
Chicago/Turabian StyleIslam, Md. Mohaimenul, Tahmina Nasrin Poly, Bruno Andreas Walther, Ming-Chin Lin, and Yu-Chuan (Jack) Li. 2021. "Artificial Intelligence in Gastric Cancer: Identifying Gastric Cancer Using Endoscopic Images with Convolutional Neural Network" Cancers 13, no. 21: 5253. https://doi.org/10.3390/cancers13215253
APA StyleIslam, M. M., Poly, T. N., Walther, B. A., Lin, M.-C., & Li, Y.-C. (2021). Artificial Intelligence in Gastric Cancer: Identifying Gastric Cancer Using Endoscopic Images with Convolutional Neural Network. Cancers, 13(21), 5253. https://doi.org/10.3390/cancers13215253