Article

The Tumor Microenvironment-Dependent Transcription Factors AHR and HIF-1α Are Dispensable for Leukemogenesis in the Eµ-TCL1 Mouse Model of Chronic Lymphocytic Leukemia

1
Tumor Stroma Interactions, Department of Oncology, Luxembourg Institute of Health, L-1526 Luxembourg, Luxembourg
2
Faculty of Science, Technology and Medicine, University of Luxembourg, L-4365 Esch-sur-Alzette, Luxembourg
*
Authors to whom correspondence should be addressed.
These authors contributed equally to this paper as senior authors.
Cancers 2021, 13(18), 4518; https://doi.org/10.3390/cancers13184518
Submission received: 20 August 2021 / Revised: 1 September 2021 / Accepted: 3 September 2021 / Published: 8 September 2021
(This article belongs to the Special Issue Novel Drug Targets and Advances in Treatment of CLL)

Abstract

:

Simple Summary

Chronic lymphocytic leukemia (CLL) is the most common leukemia in Western countries, mostly affecting the elderly. The survival of leukemic cells depends on multiple soluble factors and on the stimulation of the BCR signaling pathway. Microenvironment-dependent transcription factors also contribute to CLL biology. Here, we generated new transgenic murine conditional knock-out models of CLL to study the role of the two transcription factors HIF-1α and AHR. Unexpectedly, we observed that both factors are dispensable for leukemia development in these models.

Abstract

Chronic lymphocytic leukemia (CLL) is the most frequent leukemia in the elderly and is characterized by the accumulation of mature B lymphocytes in peripheral blood and primary lymphoid organs. In order to proliferate, leukemic cells are highly dependent on complex interactions with their microenvironment in proliferative niches. Not only soluble factors and BCR stimulation are important for their survival and proliferation, but also the activation of transcription factors through different signaling pathways. The aryl hydrocarbon receptor (AHR) and hypoxia-inducible factor (HIF)-1α are two transcription factors crucial for cancer development, whose activities are dependent on tumor microenvironment conditions, such as the presence of metabolites from the tryptophan pathway and hypoxia, respectively. In this study, we addressed the potential role of AHR and HIF-1α in chronic lymphocytic leukemia (CLL) development in vivo. To this end, we crossed the CLL mouse model Eµ-TCL1 with the corresponding transcription factor-conditional knock-out mice to delete one or both transcription factors in CD19+ B cells only. Despite AHR and HIF-1α being activated in CLL cells, deletion of either or both of them had no impact on CLL progression or survival in vivo, suggesting that these transcription factors are not crucial for leukemogenesis in CLL.

1. Introduction

In western countries, chronic lymphocytic leukemia (CLL) is the most common B cell malignancy in adults [1]. The disease occurs mostly in elderly patients and is characterized by the accumulation of mature monoclonal CD5+ B cells in peripheral blood, bone marrow, and lymphoid organs [2].
Genome instability is a well-known hallmark of cancer [3]. Indeed, alterations in the DNA and, by consequence, transcriptional programs increase the probability of neoplastic transformation and potentially enhance tumor immune evasion [4]. Also in CLL, gene mutations and dysfunction affecting transcriptional programs are essential prognostic factors for the disease outcome. In particular, given multiple its molecular abnormalities, CLL is considered a highly heterogeneous disease, including patients not requiring any therapy and patients having an aggressive course with poor response to therapy [5]. Major mutations in CLL affect many cellular components including inflammatory receptors (e.g., MYD88), kinases such as MAPK (e.g., BRAF), NF-kB-related molecules (e.g., BIRC3), transcription (e.g., EGR2 and NOTCH1) and splicing factors (e.g., SF3B1), DNA damage and cell cycle control factors (e.g., ATM and TP53) [6]. These genetic abnormalities have supported the generation of novel agents against CLL which have been translated into the clinical practice towards a more targeted treatment strategy for patients [7]. Treatments for CLL patients include chemotherapy, chemoimmunotherapy, and small molecules mostly targeting important signaling pathways in CLL cells (e.g., BCR and BCL2) [8]. Even after a long remission phase, patients can relapse and develop resistance to treatments. For this reason, investigating new strategies for the development of treatments against CLL is key for the improvement of patients’ health.
In the past decades, the transcription factors (TFs) aryl hydrocarbon receptor (AHR) and hypoxia inducible factor-1α (HIF-1α) have been recognized to strongly impact cancer progression and escape mechanisms [9,10,11,12]. AHR is a ligand-activated TF involved in many biological processes, such as cell division, quiescence, and inflammation [13]. The most known agonist of AHR is 2,3,7,8 tetrachlorodibenzo-p-dioxin (TCDD); however, more importantly for the field of tumor immunology, is the endogenous agonist kynurenine, which originates from tryptophan, in a reaction catalyzed by indoleamine 2,3-dioxygenase 1 (IDO1) and tryptophan 2,3-dioxygenase 2 (TDO2) [14]. Importantly, AHR activation by this pathway has been shown to contribute to immune escape mechanisms leading to an immunosuppressive tumor microenvironment (TME) [15,16].
On the other hand, HIF-1α is an oxygen-sensitive TF, stabilized in a hypoxic environment and by certain non-canonical mechanisms, called pseudohypoxia [17]. Here, for example, metabolites of the Krebs cycle can block prolyl hydroxylases (PHDs), which under normoxic conditions, hydoxylate HIF-1α in order to trigger ubiquitination by the von Hippel–Lindau protein (pVHL) and to start proteasomal degradation [18]. HIF-1α is known to be involved in tumor progression and is mostly associated with poor patient’s outcome [19]. Interestingly, AHR and HIF-1α share the dimerization partner ARNT/HIF1β, showing linked processes of tumor progression, metabolic pathways, and vascular development [20]. Moreover, these TFs have an impact on proliferation and functions of B lymphocytes and CLL cells [21,22]. Villa et al. showed that AHR is necessary for B cell proliferation and that cyclin O is directly impacted by AHR deficiency [23]. Furthermore, AHR seems to contribute to the transcriptional program of IL-10-producing regulatory B cells [24], which is a B cell subset sharing regulatory functions with CLL cells [25]. On the other hand, HIF-1α has been already described as highly involved in CLL pathogenesis and in the interaction with the TME. In 2016, Valsecchi and colleagues showed that this interaction is regulated by HIF-1α and promotes tumor survival and tumor propagation [26]. Indeed, HIF-1α is overexpressed in leukemic cells from TP53-disrupted patients and, thus, would be an interesting target for new therapies for CLL [27].
Currently, the impact of AHR and HIF1α in CLL development in vivo has not been fully evaluated. In this article, we generated conditional knock-out mice for Ahr, Hif1a, or both genes restricted to B cells of the Eµ-TCL1 transgenic mouse model, the most extensively used and studied animal model for CLL [28].

2. Materials and Methods

2.1. Mice

Animals were kept in a specific pathogen-free facility, and animal experiments were approved by the internal Animal Welfare Structure and the Luxembourg Ministry for Agriculture. Mice were treated in accordance with the European Union guidelines.
C57BL/6 mice were purchased from Janvier Labs (France). To generate B cell-specific Ahr-, Hif1a-, and Ahr-Hif1a-deficient mice, Ahrfl/fl(#006203), Hif1afl/fl (#007561), and Ahrfl/fl Hif1afl/fl were crossed with CD19WT/Cre (#006785) mice. These mice were bred with Eµ-TCL1 mice to introduce the TCL1 oncogene under the IgVH promoter. These mice were described previously [28]. The mice were bred and maintained on a C57BL/6 background, and Eµ-TCL1 CD19Cre/WTHif1aWT/WTAhrWT/WT mice were used as WT controls. CLL progression in the transgenic mouse models was monitored over several months by determining the percentage of CD5+CD19+ CLL cells in peripheral blood mononuclear cells (PBMC) by flow cytometry analysis on a Cytoflex (Beckman Coulter, Brea, CA, USA) using CD19-APC and CD5-PE (Biolegend, San Diego, CA, USA). Mice reaching the humane endpoint were euthanized by cervical dislocation. All deaths unrelated to leukemia were excluded from this study. To perform adoptive transfer in healthy conditional knock-out mice, CLL cells were isolated from the spleen of diseased Eµ-TCL1 mice. Then, 10 × 106 CLL cells were injected intravenously in 100 µL of DMEM, and CLL progression was followed by weekly bleeding, as described previously.

2.2. B Cell Isolation

B cells were purified from the spleen by negative selection using the MojoSort™ Mouse Pan B Cell Isolation Kit II (Biolegend, San Diego, CA, USA) following the manufacturer’s instructions. The isolated B cell population contained at least 90% of CD19+CD5+-double positive cells. B cells were cultured in RPMI supplemented with 10% FBS, 50 µM 2-β-mercaptoethanol, 100 U/mL penicillin, and 100 µg/mL streptomycin. To mimic hypoxia, 150 µM cobalt chloride (Sigma-Aldrich, Burlington, MA, USA) was added, and the cells were cultured overnight at 37 °C and 5% CO2. In order to activate AHR, the cells were incubated with 250 nM FICZ (Sigma-Aldrich, Burlington, MA, USA) for 2 hours at 37 °C and 5% CO2.

2.3. Validation of the Models at the gDNA, RNA, and Protein Levels

Genomic DNA was extracted using NucleoSpin Tissue Mini kit for DNA from cells and tissue (Macherey-Nagel, Düren, Germany) following the manufacturer’s instructions. To perform the PCR on gDNA for Ahr, the PCR mix 2x M-PCR OPTI™ Mix (Bimake, Houston, TX, USA) was used as described in the instructions, and the specific primer sequences were: 5′-GTCACTCAGCATTACACTTTCTA-3′, 5′-CAGTGGGAATAAGGCAAGAGTGA-3′, and 5′-GGTACAAGTGCACATGCCTGC-3′. The use of these three primers enables the detection of wild-type (106 bp), floxed (140 bp), and excised (180 bp) alleles. The amplification of Ahr was performed with the following program: 94 °C for 5 min, 30 cycles of 94 °C for 15 s, 56 °C for 15 s, and 72 °C for 30 s. After amplification, the product was run on a 3% agarose gel with SYBR™ Safe DNA Gel Stain (ThermoFisher, Waltham, MA, USA) and visualized by Image Quant Las 4000 (GE Healthcare, Chicago, IL, USA). For Hif1a, we used the HIF1a TaqMan copy number assay Mm00375032_cn with the TaqMan™ Copy Number Reference Assay, mouse, Tfrc (Thermo Scientific, Waltham, MA, USA). Quantitative PCRs were performed using Takyon Low Rox Probe 2X mastermix (Eurogentec, Seraing, Belgium) according to manufacturer’s instructions. The qPCRs were run on the QuantStudio™ 3 or 5 (Applied Biosystems, Waltham, MA, USA) with the following program for the Taqman assay: 50 °C 2 min, 95 °C for 10 min, 40 cycles of 95 °C for 15 s, and 60 °C for 1 min.
RNA from B cells was extracted using Nucleozol reagent and the NucleoSpin® RNA Set for NucleoZOL (Macherey-Nagel, Düren, Germany) and quantified using the Nanophotometer N60 (Implen, München, Germany). The complementary DNA was synthesized from 500 ng of RNA by using FastGene Scriptase II cDNA 5x ReadyMix (Nippon Genetics, Düren, Germany) according to the manufacturer’s instructions. Quantitative PCRs were performed using Takyon for SYBR Assay Low Rox or Takyon Low Rox Probe 2X mastermix (Eurogentec, Seraing, Belgium). The specific primer sequences were: Ahr: 5′-AGCCGGTGCAGAAAACAGTAA-3′ and 5′-AGGCGGTCTAACTCTGTGTTC-3′; Hprt: 5′-TGGATACAGGCCAGACTTTGTTF-3′ and 5′-CAGATTCAACTTGCGCTCATC-3′; Tbp: 5′-GTCATTTTCTCCGCAGTGCC-3′ and 5′-GCTGTTGTTCTGGTCCATGAT-3′. For Hif1a, we used the HIF1a TaqMan assay Mm00375032_cn (Thermo Scientific, Waltham, MA, USA). The qPCR was performed similarly as described above.
The comparative Ct method was used to calculate gene expression relative to housekeeping gene Hprt and Tpb.
For protein isolation, cultured B cells were washed twice with ice-cold PBS, and proteins were extracted using RIPA buffer including the cOmplete™ Protease Inhibitor Cocktail (Roche, Basel, Switzerland) and the Phosphatase Inhibitor Cocktail 2 and 3 (Sigma-Aldrich, Burlington, MA, USA). Then, 10 µg of cell lysates were resolved on 10% SDS-PAGE and transferred to a nitrocellulose membrane. To confirm equivalent loading between lanes, a Ponceau red staining was performed. Membranes were incubated in 1x PBS-T (0.1%) and fat-free dry milk (5%, Roth) blocking buffer during one hour at room temperature. Membranes were then incubated with primary antibodies against HIF-1α (#36169, Cell Signaling), AHR (#694502, Biolegend, San Diego, CA, USA), and beta-actin-HRP (#A3854, Sigma-Aldrich, Burlington, MA, USA) in blocking buffer at 4 °C overnight. Membranes were washed three times in 1xPBS-T (0.1%) for 10 min each time. Secondary antibodies coupled to HRP were from Jackson ImmunoResearch. For detection, the ECL western blot detection kit was purchased from Amersham, and the radiographic films from Santa Cruz Biotechnology.

2.4. Sample Preparation for RNA Sequencing

Control C57BL/6 and diseased Eµ-TCL1, or Eµ-TCL1 CD19 Cre/WT Hif1αfl/fl, Eµ-TCL1 CD19Cre/WT Ahrfl/fl, Eµ-TCL1 CD19Cre/WT Hif1afl/fl Ahrfl/fl, and the corresponding control mice Eµ-TCL1 CD19Cre/WT Hif1αWT/WTAhrWT/WT were euthanized at humane endpoint by CO2 inhalation or cervical dislocation. Spleens were collected, and single cell suspensions were prepared as previously described [29,30]. CD19+ B cells or CD5+CD19+ CLL cells were sorted with a BD FACSAria III at 4 °C. Then, 1–5 × 10⁶ sorted cells were centrifuged and resuspended in 500 µL of Nucleozol reagent. Total cellular RNA was extracted using the NucleoSpin RNA Set for NucleoZOL and eluted in 30 µL of RNAse-free water. Libraries were prepared with the QuantSeq 3’ mRNA-Seq Library Prep Kit FWD for Illumina (Lexogen, Vienna, Austria) with dual indexing, according to the manufacturer’s instructions, with the addition of UMI. Barcoded samples were diluted, pooled, loaded onto a NextSeq 500/500 Mid Output flowcell or a NovaSeq SP flowcell (Illumina, San Diego, CA, USA), and single-end sequencing was performed using a NextSeq 550 or a NovaSeq 6000 system (Illumina, San Diego, CA, USA).

2.5. RNA Sequencing Analysis

After initial QCs using FastQC (www.bioinformatics.babraham.ac.uk/projects/fastqc/, accessed on 19 March 2021) and FastQ Screen (www.bioinformatics.babraham.ac.uk/projects/fastq_screen/, accessed on 19 March 2021), fastq files were processed using a local Snakemake workflow including the following main steps. First, raw reads were trimmed from their UMI index, poly A, and adapter sequences using a combination of dedicated scripts and cutadapt (v2.10). Next, the filtered reads were submitted for mapping (STAR v2.5.3a) on the Mouse Reference genome (GRCm38). Collapsing of reads originating from the same fragment was achieved with umi_tools (v 1.0.0), and counting was performed with featureCounts (subread v2.0.0).
Counts were filtered and transformed with EdgeR for clustering and principal component analysis (PCA). For k-means clustering, the 2500 most variable genes were included, and 6 clusters were defined according to the elbow method (online tool iDEP.93). Top genes were mapped with the dimension reduction algorithm t-SNE. Differential expression of genes across C57BL/6 and Eµ-TCL1 samples (DEG) was assessed using the DESeq2 package, and FDR < 0.05 and log2 fold change cut-off of 1 were imposed. Raw and processed data were deposited in the NCBI GEO database (GSE175564).
Differential expression of genes across Eµ-TCL1 CD19Cre/WT Hif1aWT/WTAhrWT/WT, Eµ-TCL1 CD19Cre/WTHif1αfl/fl, Eµ-TCL1 CD19Cre/WTAhrfl/fl, Eµ-TCL1 CD19Cre/WT Hif1afl/fl Ahrfl/fl samples (DEG) was assessed using the EdgeR package, and FDR < 0.05 and log2 fold change cut-off of 1 were imposed. Pheatmap and EnhancedVolcano packages were used for data visualization. Raw and processed data were deposited in the NCBI GEO database (GSE179196).

2.6. Murine B Cell-Specific Ahr-Induced Gene Signature

The murine B cell-specific Ahr-induced gene signature (mouse_B_Ahr) was defined based on the gene expression data from Kovalova et al. (2017, GSE80953). Briefly, CEL files corresponding to murine B cells treated with vehicle (VH) or TCDD (2,3,7,8-tetrachlorodibenzo-p-dioxin) for 4 h, 8 h, or 24 h were loaded into the Transcriptome Analysis Console (TAC 4.0, Applied Biosystems), and the 153 genes induced by TCDD (fold change >1.5 and FDR < 0.05) at any time points (TCDD vs. VH) were included in the signature.

2.7. Gene Set Enrichment Analysis

We performed GSEA using the GSEA Broad Institute stand-alone software (http://www.gsea-msigdb.org/gsea/index.jsp, accessed on 20 April 2021). Gene counts from both groups (C57BL/6 and Eµ-TCL1) were loaded into GSEA according to recommendations. Data were tested against the above-described mouse_B_Ahr signature and the GSEA Hallmarks signatures. Normalized enrichment scores (NES) and FDR < 0.1 were taken into consideration.

2.8. Transcription Factor Enrichment Analysis

DEGs significantly upregulated in leukemic B cells from Eµ-TCL1 were subjected to transcription factor enrichment analysis with the online tool ChEA3 (Ma’ayan Laboratory, Icahn School of Medicine at Mount Sinai) predicting transcription factors associated with user-input sets of genes. DEGs were also submitted for Integrated System for Motif Activity Response Analysis performed with the free online ISMARA tool that recognizes the most important transcription factors impacting on the transcription profiles of a set of samples. The network of protein–protein interactions for transcription factors was constructed with string-db (v11.0, STRING Database).

2.9. Statistical Analysis

Statistical analysis was performed using GraphPad Prism software (version 9.1.2). The unpaired t test was used for Z-values analyses and qPCRs (Figure 1H, Figure 2B, Figure 2C, Figure 3C and Figure 4B,D,E). The log-rank test was used for the survival curves (Figure 2E, Figure 3E and Figure 4G). For the percentage of CLL cells in the transgenic mouse models overtime (Figure 2F, Figure 3F, and Figure 4H), we used mixed-effects analysis followed by Bonferroni’s multiple comparison test. The percentage of CLL in the blood at one time point (Figure 2G, Figure 3G and Figure 4I) was tested with the unpaired t test. To test significance in the adoptive transfer models (Figure 2J, Figure 3J and Figure 4L), we performed two-way ANOVA followed by Bonferroni’s multiple comparison test. A p-value lower than 0.05 was considered statistically significant.

3. Results

3.1. RNA Sequencing of CD5+CD19+ Leukemic B Cells from Eµ-TCL1 Mice

The development of leukemia involves the regulation of complex transcriptional programs allowing the cancer cells to proliferate, benefit from the support of the microenvironment, and escape the anti-tumor immune response [31,32]. In order to understand the biology of the leukemic cells in vivo, we performed RNA sequencing analysis of B cells sorted from control C57BL/6 (WT) and leukemic Eµ-TCL1 (TCL1) mice. Principal component analysis and correlation analysis showed a distinct transcriptional profile in leukemic B cells when compared with WT B cells, the gene expression profiles of leukemic B cells being more variable (Figure 1A and Supplementary Materials Figure S1A). Cluster analysis identified six clusters of deregulated genes in TCL1 B cells (K-means clustering, Figure 1B and Supplementary Materials Figure S1B–C). In particular, a decreased expression of genes involved in immune functions and lymphocyte activation was noticed, while genes involved in cell cycle, cell adhesion, locomotion, and cytoskeleton were upregulated. About 2457 genes were found statistically differentially expressed between WT and TCL1, with 1416 genes being more expressed in leukemic B cells, and 1041 genes being more expressed in WT B cells (Figure 1C,D).
Next, we performed a Gene Set Enrichment Analysis (GSEA) to identify hallmark pathways regulated in TCL1 and WT B cells. Among the 33 gene sets upregulated in TCL1 B cells and presenting a nominal enrichment score (NES > 1), we selected 22 gene sets as relevant for immune cells (Table 1). The most regulated gene sets were related to the TFs MYC, E2F, and TP53 and to several metabolic pathways linked to energy production, cholesterol/lipids, and glucose metabolism, indicating highly activated and proliferating cells. In addition, many signaling pathways involved in immune functions and cytokine secretion were enriched (IL-2/STAT5, mTORC1, IL-6/JAK/STAT3, and β-catenin). Finally, we observed the regulation of the two microenvironment-modulated pathways (hypoxia and xenobiotic stress) regulated by the TFs HIF family members and AHR, respectively (Figure 1E and Table 1). These two pathways are often regulated in cancer by a reduced oxygen concentration (hypoxia) and by tryptophan derivatives such as kynurenine [20]. Protein–protein interaction analysis (STRING) confirmed the tight connection between the transcription factors regulating these pathways (Figure 1F).
While the response to hypoxia and glycolysis are both mediated by HIF-1α [33], the response to xenobiotic stress is complex and more diverse, in terms of transcriptional regulation. To confirm the potential role of AHR in TCL1 leukemic cells, we established a murine B cell-specific AHR gene signature from the publicly available gene expression dataset GSE80953 [34]. A list of 153 genes was identified as induced by the AHR agonist TCDD in murine B cells and used as a gene set database to run a GSEA. The analysis confirmed the enrichment of the AHR gene signature in TCL1 leukemic cells compared to normal B cells (NES = 1.16, FDR = 0.1, Figure 1G).
Then, we performed a transcription factor enrichment analysis (TFEA) with the online tool ChEA3 to better understand the regulation of transcriptional programs in leukemic cells. Again, both AHR and HIF-1α were listed among the top 50 TFs contributing to the regulation of DEGs in leukemic B cells (ranked 37 and 43 over 1632 TFs, respectively, Table 2). A second analysis with the ISMARA tool detected the use of specific and different TFs in WT and TCL1 B cells. For example, TAF1 was specifically used in WT cells, while Fos was more used by leukemic TCL1 cells (Supplementary Materials Figure S1D). Concerning HIF-1α and AHR, an enrichment of binding motifs was detected in DEGs from TCL1 leukemic cells compared to WT cells (Figure 1H).
Given the enrichment of HIF-1α and AHR gene signatures in Eµ-TCL1 mice compared to WT mice, their important role in cancer, and their ability to heterodimerize with the same binding partner called HIF-1β/Arnt [35,36], we decided to study the role of both AHR and HIF-1α in leukemogenesis in the Eµ-TCL1 murine model of CLL.

3.2. HIF-1α Knock-Out in Murine CLL Cells Does Not Impact Leukemogenesis

HIF-1α is important in many cancers, also in CLL. However, the impact of HIF-1α on CLL leukemogenesis in vivo has not been fully investigated yet. For this purpose, we generated conditional transgenic knock-out mice using the Cre-loxP system (Figure 2A). First, by crossing CD19Cre/WT mice with Hif1afl/fl mice, we ensured the gene knock-out specifically in B cells, then we crossed the newly generated strain (CD19Cre/WT Hif1afl/fl) with Eµ-TCL1, creating the Eµ-TCL1 CD19Cre/WT Hif1afl/fl transgenic model. In order to validate if HIF1α knock-out in Eµ-TCL1 CD19Cre/WT Hif1afl/fl was efficient compared to the control mice (Eµ-TCL1 CD19Cre/WT Hif1aWT/WT), we isolated DNA, RNA, and proteins from CD19+ cells. As shown in Figure 2B–D and Supplementary Materials Figure S2, the knock-out of HIF-1α in the mice was validated on all levels. To further investigate the impact of HIF-1α knock-out in leukemic cells, we monitored CLL development in the transgenic mice over several months. In the Eµ-TCL1 CD19Cre/WTHif1αfl/fl mouse model, we could not observe any difference in the survival compared to the control mice (Figure 2E). This finding was in accordance with the percentage of the circulating neoplastic cells in the peripheral blood, progressively accumulating over time (Figure 2F,G). Additionally, we performed RNA sequencing of leukemic B cells, comparing Eµ-TCL1 CD19Cre/WT Hif1afl/fl mice with the control mice. Here, we could not observe any major differences in the gene expression profiles (Figure 2H,I and Supplementary Materials Table S1).
To investigate the importance of HIF-1α in healthy B cells in the CLL tumor microenvironment, we adoptively transferred Eµ-TCL1 CLL cells into mice lacking HIF-1α in healthy B cells, CD19Cre/WT Hif1afl/fl. Here, we could not observe any difference in the development of CLL in knock-out compared to control mice (Figure 2J).
These results led us to conclude that in this model of CLL, HIF-1α seems not to be an important transcription factor in healthy and leukemic B cells for proliferation in WT mice and leukemogenesis in the transgenic murine model.

3.3. AHR Knock-Out in Murine CLL Cells Does Not Impact Leukemogenesis

The transcription factor AHR plays a role in B cell proliferation and development [23,37]. Here, we investigated the importance of AHR in the development of leukemic B cells. To do so, we used the same strategy as described above for the HIF-1α knock-out model (Figure 3A). In accordance with this, DNA, RNA, and proteins from CD19+ cells of the Eµ-TCL1 CD19Cre/WTAhrfl/fl mice were isolated for the validation of the knock-out. Compared to the control mice Eµ-TCL1 CD19Cre/WTAhrWT/WT, the knock-out mice showed the excised allele of exon 2 of Ahr at the DNA level in B cells, no expression of exon 2 at the RNA level, and absence of the corresponding protein (Figure 3B–D and Supplementary Materials Figure S2), confirming that the knock-out was efficient.
Next, in order to analyze the impact of AHR knock-out in leukemic B cells, CLL development in the new transgenic model (Eµ-TCL1 CD19Cre/WT Ahrfl/fl) and corresponding control (Eµ-TCL1 CD19Cre/WT AhrWT/WT) was monitored over several months. Eµ-TCL1 CD19Cre/WT Ahrfl/fl mice compared to the control mice did not show any difference in survival (Figure 3E). In addition, the percentage of the AHR knock-out CLL cells in the blood did not differ compared to the control at different time points (Figure 3F,G). RNA sequencing performed on CLL cells did not reveal any relevant changes in the RNA profile of the knock-out mice compared to the control (Figure 3H, I and Supplementary Materials Table S2).
Furthermore, in order to investigate whether AHR knock-out in normal B cells could impact CLL development, we injected Eµ-TCL1 CLL cells into mice lacking AHR in normal B cells (CD19Cre/WT Ahrfl/fl). As observed for the transgenic model, we could not detect any difference in CLL development for the adoptive transfer in either CD19Cre/WT Ahrfl/fl or CD19WT/WT Ahrfl/fl recipient mice (Figure 3J).
Based on the results of our AHR knock-out experiments in leukemic and in healthy B cells, AHR does not appear to be an essential factor in CLL development.

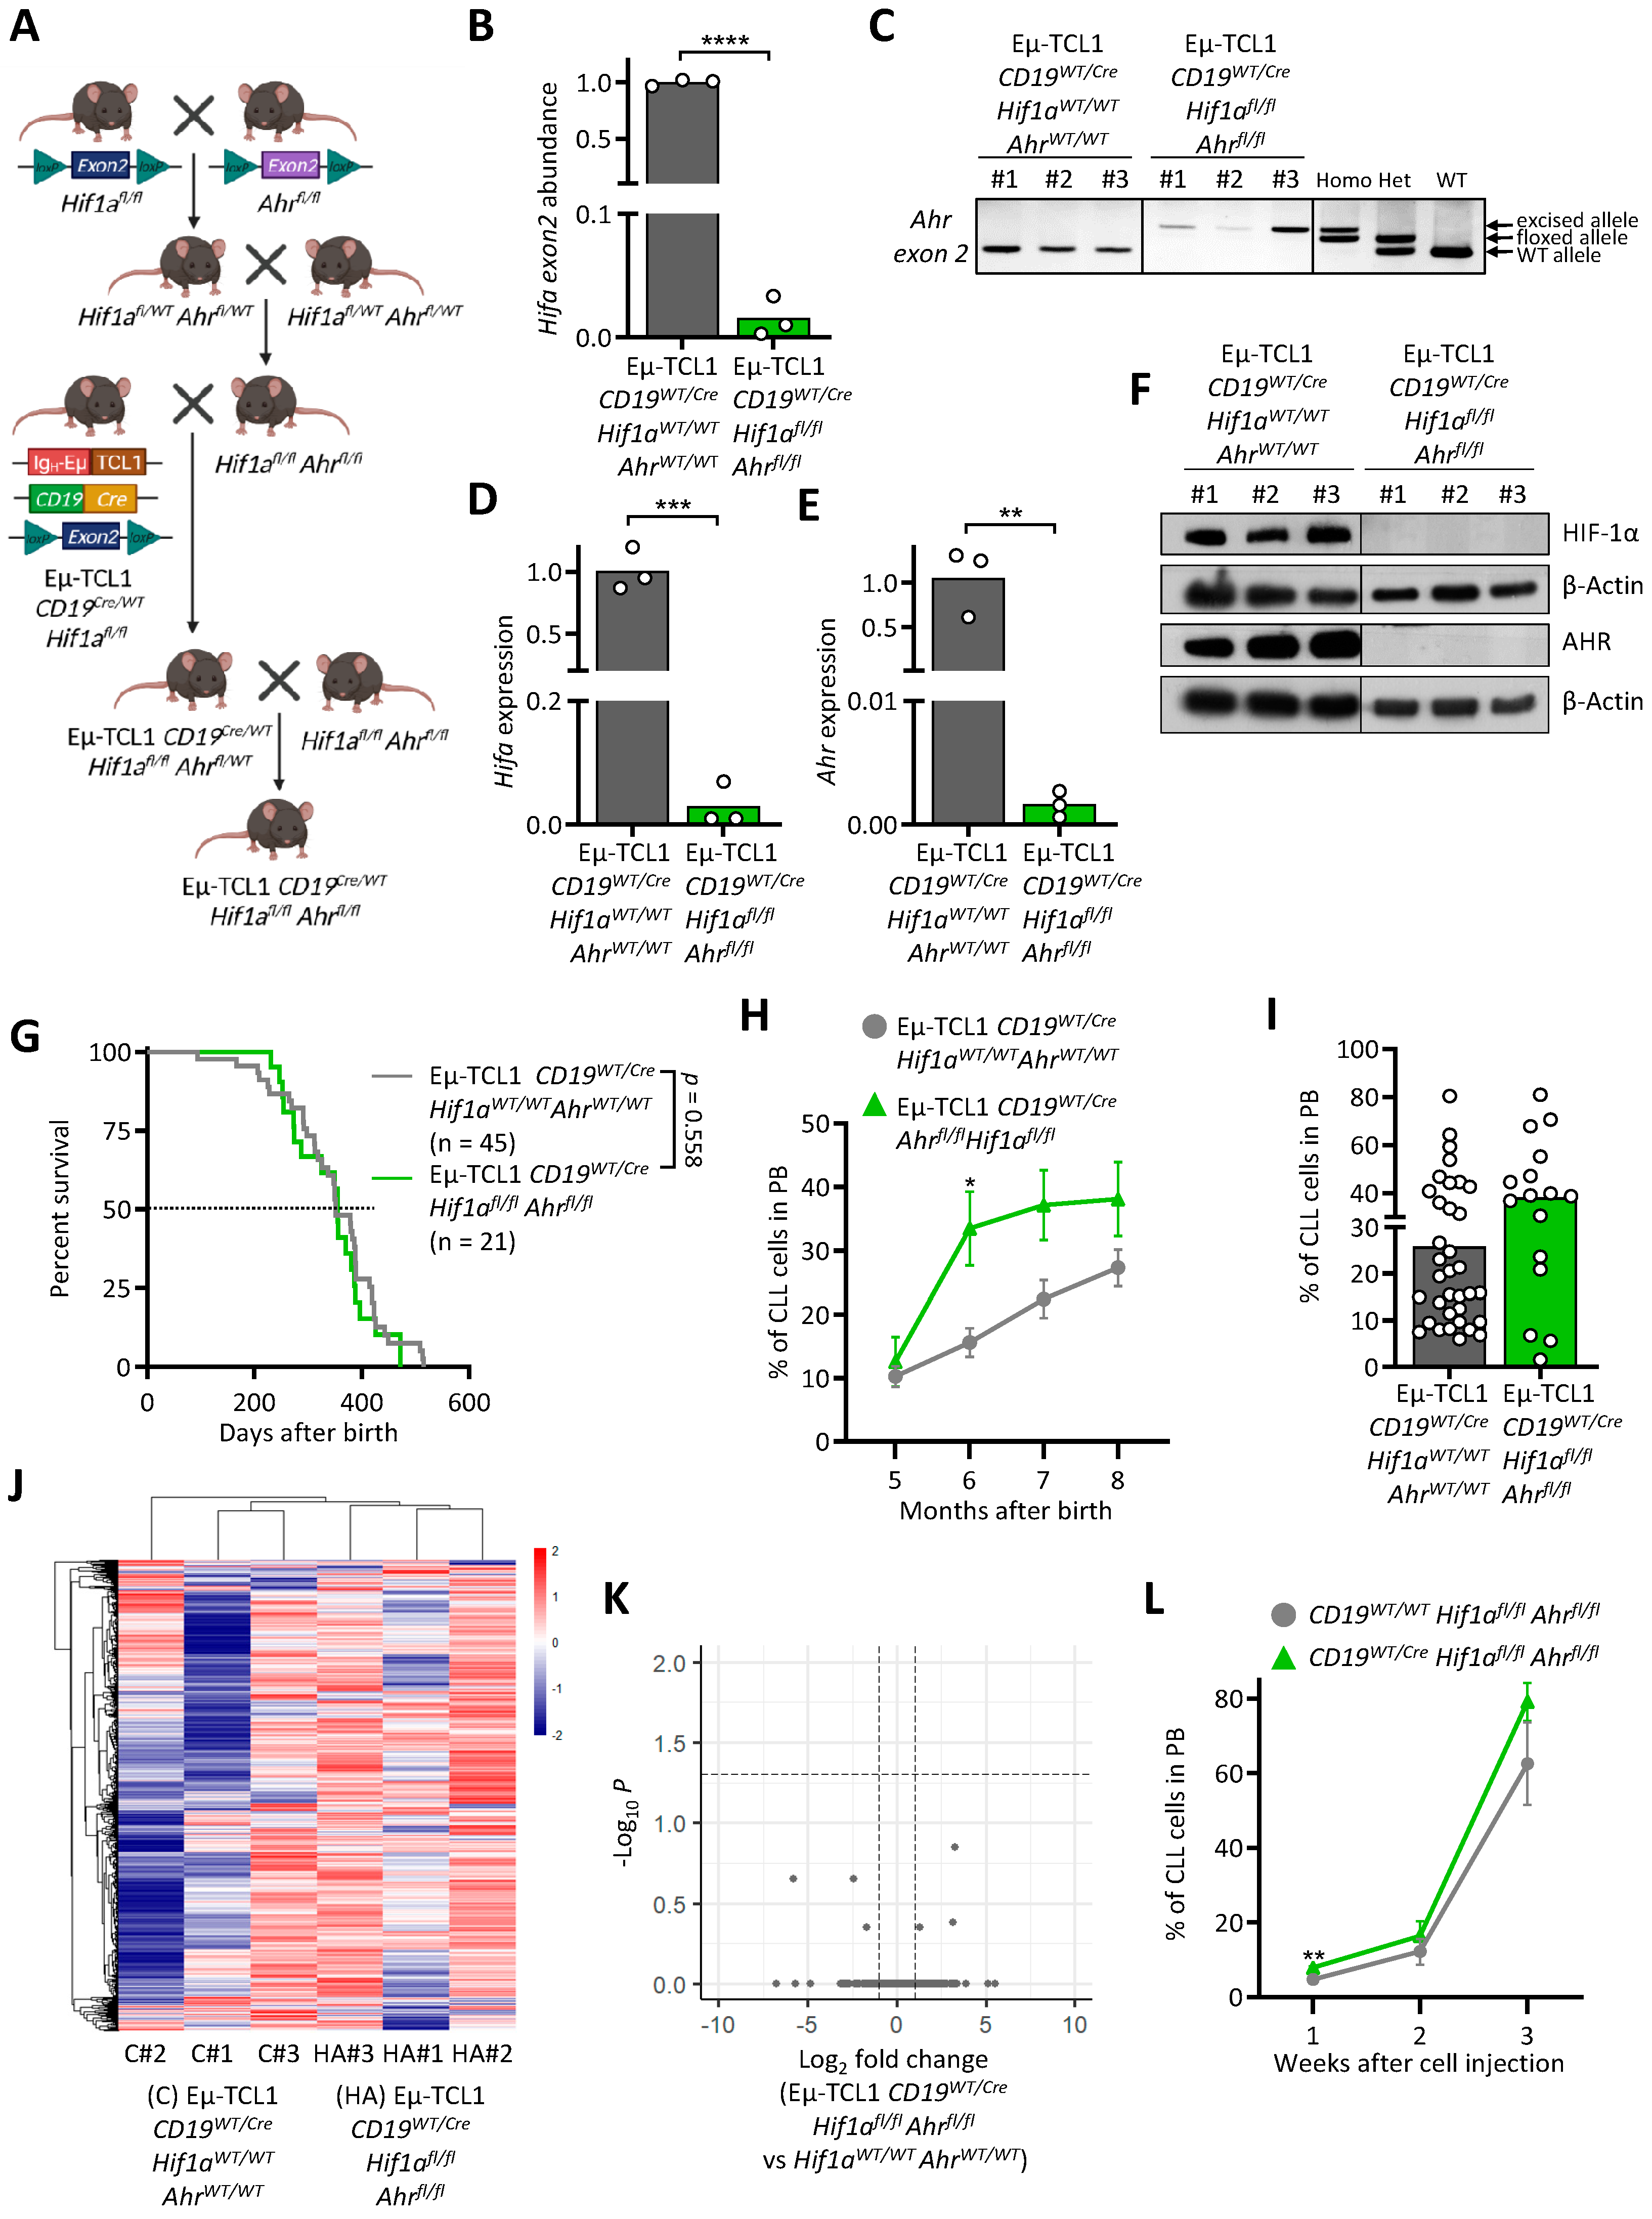
3.4. AHR and HIF-1α Double Knock-Out Does Not Interfere with Murine CLL Development

The dimerization partner ARNT/HIF1β connects the pathways of HIF-1α and AHR, as both TFs share it in order to bind to DNA. As we could not observe a difference by removing these two TFs separately, we decided to investigate the potential synergistic role of HIF-1α and AHR in leukemogenesis by knocking them out together in our CLL murine model.
To achieve this, we crossed the Ahrfl/fl and Hif1αfl/fl mice, and the resulting strain was further crossed with the Eµ-TCL1 CD19Cre/WT Hif1αfl/fl model (Figure 4A). This strain was further bred with Hif1αfl/fl Ahrfl/fl mice. After obtaining the double knock-out mice (Eµ-TCL1 CD19Cre/WT Hif1afl/fl Ahrfl/fl), we validated the conditional knock-out at DNA (Figure 4B,C), RNA (Figure 4D,E), and protein (Figure 4F and Supplementary Materials Figure S2) levels in CD19+ B cells. Similar to the previous results in single conditional knock-out mice, we could not observe any difference between Eµ-TCL1 CD19Cre/WT Hif1afl/fl Ahrfl/fl and the control mice (Figure 4G). Although a slight increase in CLL cells in the blood of Eµ-TCL1 CD19Cre/WT Hif1αfl/fl Ahrfl/fl mice was visible at month 6, this difference evened out in the following months (Figure 4H,I). RNA sequencing of CLL cells did not reveal differences in gene expression between Eµ-TCL1 CD19Cre/WTHif1αfl/fl Ahrfl/fl and the control mice (Figure 4J,K and Supplementary Materials Table S3). Finally, adoptive transfer of Eµ-TCL1 CLL cells into mice carrying the double knock-out in normal B cells showed no differences in disease development (Figure 4L).
Taken together, the deletion of the transcription factors HIF1α and AHR does not appear to be crucial in our murine CLL models. It is possible that the two TFs are not involved in CLL development and are not crucial for the function of healthy B cells in the clearance of CLL.

4. Discussion

In recent years, targeted therapy has shown to be highly efficient against CLL, improving patients living conditions and overall survival. Most of the current treatments are focusing on anti-apoptotic molecules (Bcl-2) and BCR-signaling kinases (BTK, PI3K), due to the highly stimulated state of CLL cells in the microenvironment. Innovative molecular therapy also aims to target leukemic cells’ vulnerabilities more precisely. The use of conventional DNA-damage-based chemotherapy drugs in the past decades and the understanding of molecular mechanisms led to the discovery of potential new targets (e.g., WEE1 kinase) [38].
As heavily mutated and regulated in cancers, transcription factors naturally attracted attention for the development of new therapeutics. Around 300 TFs were described as oncogenes and could therefore become druggable candidates (e.g., TP53, MYC, and Stat family members) [39]. AHR and HIF-1α are not oncogenes but are crucial regulators of transcription programs in the microenvironment as sensors/responders to microenvironment conditions in both cancer and immune cells [40].
Previous research has shown that AHR and HIF-1α are important in hematological malignancies [13,41]. The impairment of HIF-1α and AHR provided promising results against leukemia and myeloma. Indeed, HIF-1α silencing by shRNA impaired the homing of CLL cells to the bone marrow and spleen, and the chemical inhibition of HIF-1α with EZN-2208 prolonged the survival of mice challenged with MEC-1 cells [26]. In addition, the FDA-approved AHR antagonist clofazimine showed high efficacy in a transgenic model of multiple myeloma [42]. However, these observations are not sufficient to understand the exact mechanism of action and the cells targeted by the therapy. Whether the molecule directly kills cancer cells or impacts the immune microenvironment should be understood to refine treatments and propose new combinatory therapeutics for improved patient outcome. Therefore, we made use of transgenic murine models to specifically study the importance of both TFs in in leukemic cells in the context of CLL. We used the well-established Eµ-TCL1 murine model, where we showed that both AHR and HIF-1α transcriptional programs are enriched. We crossed this model with Hif1a or Ahr conditional knock-out mice to delete these genes only in CD19+ B cells and investigated their role in the leukemogenesis of CLL. The unexpected results in this article show that knocking-out these two transcription factors does not affect the development of CLL in vivo. The gene expression profile of leukemic cells compared to that of cells from the control group was also unaffected by both knock-outs. Although we cannot rule out that there might be a different expression profile at early stages of the disease, this does not affect the final outcome of CLL progression. In addition, using our adoptive transfer model of TCL1 CLL cells into Hif1a or Ahr conditional knock-out, we could infer their role in normal B cells in the leukemic microenvironment. Indeed, the role of B cells in the context of cancer is still poorly defined and needs more investigations to better elucidate B cells pro-tumoral or anti-tumoral impact in different types of cancer [43]. Here, we could show that knocking out AHR and HIF-1α in healthy B cells did not impact the progression of CLL, which led to the conclusion that AHR and HIF-1α do not play a crucial role either in the development of CLL B cells or in the function of B cells in the TME.
From the literature, HIF-1α seems to be an interesting new target for CLL therapy, as it regulates the interaction of CLL cells with the TME and is upregulated in unmutated immunoglobulin heavy-chain variable region genes (IGHV) and TP53-disrupted CLL patients [26,27]. Interestingly, Meng et al. showed that the HIF-1α pathway directly affects IL-10 production in B cells [33], a feature also used by CLL B cells to favor an immunosuppressive tumor microenvironment and increase their survival [44]. Despite this, deletion of HIF-1α in leukemic cells of the Eµ-TCL1 mouse model had no impact on disease development, leading to the hypotheses that the importance of HIF-1α could depend on the oncogenic drivers and/or on compensatory mechanism (e.g., HIF-2α and/or on other cells of the TME). Griggio et al. nicely showed that the combination of an HIF-1α inhibitor with ibrutinib, a BTK inhibitor, showed a synergistic cytotoxic effect in TP53-disrupted CLL cells [27]. Considering this, it would be interesting to further investigate the effect of TP53 mutation in the TCL1 mouse model including the HIF-1α knock-out. Further, the use of a HIF-1α inhibitor in a co-culture of CLL cells and stromal cells in vitro showed that the inhibition also affected the stromal cells, resulting in decreased transcriptional regulation of target genes in the stromal compartment [45]. Considering the intricate regulation of the immune response by HIF-1α/A2A adenosine receptor signaling pathways [46], it would be worth investigating HIF-1α and its inhibition in the tumor microenvironment, including T cells, regulatory T cells, and nurse-like cells.
Regarding AHR, it also plays an important role in carcinogenesis and other diseases, especially the IDO–Kyn–AHR axis [47]. IDO activity is increased in CLL patients [48]. Furthermore, AHR is important in B cell development by controlling cell proliferation and apoptosis [21,23] and is involved in regulatory B cell (Bregs) differentiation and in the regulation of IL-10 production [24]. As CLL cells and Bregs share similar functions [25], AHR appears as an interesting therapeutic target in CLL. Nevertheless, and similarly to HIF-1α, its deletion did not influence disease outcome in the Eµ-TCL1 mouse model. According to previous studies, AHR is an important player in the establishment of an immunosuppressive TME. Jitschin et al. showed that untreated CLL patients have increased IDOhiCD62LhiPD-L1hiHLA-Ghi CD11b+CD33+CD14+HLA-DRlo monocytic cells, supporting an immune suppression [49]. In addition, Sadik et al. recently demonstrated that IL4I1, which catalyzes the formation of the AHR-activating ligand kynurenine, enhances CLL development due to a highly immunosuppressive TME [50]. Thus, increased AHR activation could influence disease outcome by an enhanced suppressive environment, by regulating the function of regulatory T cells (Tregs), and by turning the phenotype of effector CD8+ T cells into an exhausted one [10,50]. Hence, targeting AHR in the TME of the proliferative CLL niche might still represent an interesting therapeutic option.
As HIF-1α and AHR share the dimerization partner ARNT/HIF1β, we could speculate on a reciprocal compensation, as for instance, both were shown to regulate IL-10 expression in B cells [24,33]. Therefore, we asked whether knocking out both factors would then be effective in decreasing CLL progression. However, as for single knock-outs, the survival of the mice did not differ compared to the control group. The percentage of CLL cells in the blood showed a slight increase in the double knock-out mice. However, this difference evened out when the disease was progressing. A possible explanation for CLL growth in the double knock-out might be the presence of an immunosuppressive tumor microenvironment. Indeed, CLL cells may overcompensate the loss of both HIF-1α and AHR, by another TF. For instance, Sp1 can regulate IL-10 production in CLL following BCR activation and signaling. It could supply CLL cells with enough survival signals and provide an IL-10-mediated suppression of the host immune system [44].

5. Conclusions

In conclusion, our results demonstrate that targeting HIF-1α or AHR by deleting them in CLL cells does not influence disease development in the Eµ-TCL1 mouse model. However, our results are not contradictory to previous results, as targeting the surrounding cells by specific inhibitors of these TFs could decrease the pro-survival signals for CLL cells and restore a more active anti-tumor immunity leading to reduced tumor burden. In vivo studies in relevant mouse models are therefore crucial to determine the importance of specific targets and also to investigate the effect of targeted inhibitors on tumor cells as well as on surrounding TME cells. This is crucial to validate interesting new targets and determine the mode of action of targeted treatments.

Supplementary Materials

The following are available online at https://www.mdpi.com/article/10.3390/cancers13184518/s1, Figure S1: RNA sequencing data of B cells from C57BL/6 and Eµ-TCL1 mice. Figure S2: Full gel pictures corresponding to Figures 2D, 3D and 4F, Table S1: Differentially expressed genes in leukemic cells from TCL1 CD19Cre/WTHif1afl/fl versus Eµ-TCL1 CD19Cre/WTHif1aWT/WT, Table S2: Differentially expressed genes in leukemic cells from TCL1 CD19Cre/WTAhrfl/fl versus Eµ-TCL1 CD19Cre/WTAhrWT/WT, Table S3: Differentially expressed genes in leukemic cells from TCL1 CD19Cre/WTAhrfl/flHif1afl/fl versus Eµ-TCL1 CD19Cre/WTAhrWT/WTHif1aWT/WT.

Author Contributions

S.G. designed and performed experiments, analyzed the results, and wrote the manuscript. E.G., A.L., S.P., I.F.B. and G.P. helped in performing experiments and writing the manuscript. E.M. and J.P. designed and supervised the study and wrote the final version of the manuscript. All authors have read and agreed to the published version of the manuscript.

Funding

This work was supported by grants from FNRS “Télévie” to S.G., A.L., I.F.B. and G.P. (7.4502.19, 7.4503.19, 7.4529.19, 7.6518.20), from Fonds National de la Recherche Luxembourg to E.G., S.P., J.P, and E.M. (PRIDE15/10675146/CANBIO, C20/BM/14592342, and C20/BM/14582635).

Institutional Review Board Statement

Animal experimentation protocols were approved by the by the local ethics committee (Animal Welfare Structure) and by the Luxembourg Ministry for Agriculture (protocols LUPA 2019/57 and LUPA 2019/71).

Informed Consent Statement

Not applicable.

Data Availability Statement

The data presented in this study are openly available in the public functional genomics data repository GEO under the references GSE175564 and GSE179196.

Acknowledgments

We thank Carlo Croce and John Byrd (OSU, OH) for the kind gift of Eµ-TCL1 mouse.

Conflicts of Interest

The authors declare no conflict of interest. The funders had no role in the design of the study; in the collection, analyses, or interpretation of data; in the writing of the manuscript, or in the decision to publish the results.

References

  1. Chiorazzi, N.; Chen, S.S.; Rai, K.R. Chronic Lymphocytic Leukemia. Cold Spring Harb. Perspect. Med. 2021, 11, a035220. [Google Scholar] [CrossRef] [PubMed] [Green Version]
  2. Herishanu, Y.; Katz, B.Z.; Lipsky, A.; Wiestner, A. Biology of chronic lymphocytic leukemia in different microenvironments: Clinical and therapeutic implications. Hematol. Oncol. Clin. 2013, 27, 173–206. [Google Scholar] [CrossRef] [Green Version]
  3. Hanahan, D.; Weinberg, R.A. Hallmarks of Cancer: The Next Generation. Cell 2011, 144, 646–674. [Google Scholar] [CrossRef] [Green Version]
  4. Belluti, S.; Rigillo, G.; Imbriano, C. Transcription Factors in Cancer: When Alternative Splicing Determines Opposite Cell Fates. Cells 2020, 9, 760. [Google Scholar] [CrossRef] [Green Version]
  5. Kandoth, C.; McLellan, M.D.; Vandin, F.; Ye, K.; Niu, B.; Lu, C.; Xie, M.; Zhang, Q.; McMichael, J.F.; Wyczalkowski, M.; et al. Mutational landscape and significance across 12 major cancer types. Nat. Cell Biol. 2013, 502, 333–339. [Google Scholar] [CrossRef] [Green Version]
  6. Venkatraman, S.; Meller, J.; Hongeng, S.; Tohtong, R.; Chutipongtanate, S. Transcriptional Regulation of Cancer Immune Checkpoints: Emerging Strategies for Immunotherapy. Vaccines 2020, 8, 735. [Google Scholar] [CrossRef] [PubMed]
  7. Moia, R.; Patriarca, A.; Deambrogi, C.; Rasi, S.; Favini, C.; Kodipad, A.A.; Schipani, M.; Gaidano, G. An update on: Molecular genetics of high-risk chronic lymphocytic leukemia. Expert Rev. Hematol. 2019, 13, 109–116. [Google Scholar] [CrossRef]
  8. Hallek, M. Chronic lymphocytic leukemia: 2020 update on diagnosis, risk stratification and treatment. Am. J. Hematol. 2019, 94, 1266–1287. [Google Scholar] [CrossRef] [Green Version]
  9. Vito, A.; El-Sayes, N.; Mossman, K. Hypoxia-Driven Immune Escape in the Tumor Microenvironment. Cells 2020, 9, 992. [Google Scholar] [CrossRef] [PubMed]
  10. Campesato, L.F.; Budhu, S.; Tchaicha, J.; Weng, C.-H.; Gigoux, M.; Cohen, I.J.; Redmond, D.; Mangarin, L.; Pourpe, S.; Liu, C.; et al. Blockade of the AHR restricts a Treg-macrophage suppressive axis induced by L-Kynurenine. Nat. Commun. 2020, 11, 4011. [Google Scholar] [CrossRef] [PubMed]
  11. Irigoyen, M.; Garcia-Ruiz, J.C.; Berra, E. The hypoxia signalling pathway in haematological malignancies. Oncotarget 2017, 8, 36832–36844. [Google Scholar] [CrossRef] [Green Version]
  12. Paris, A.; Tardif, N.; Galibert, M.-D.; Corre, S. AhR and Cancer: From Gene Profiling to Targeted Therapy. Int. J. Mol. Sci. 2021, 22, 752. [Google Scholar] [CrossRef]
  13. Gentil, M.; Hugues, P.; Desterke, C.; Telliam, G.; Sloma, I.; Souza, L.E.B.; Baykal, S.; Artus, J.; Griscelli, F.; Guerci, A.; et al. Aryl hydrocarbon receptor (AHR) is a novel druggable pathway controlling malignant progenitor proliferation in chronic myeloid leukemia (CML). PLoS ONE 2018, 13, e0200923. [Google Scholar] [CrossRef]
  14. Cheong, J.E.; Sun, L. Targeting the IDO1/TDO2-KYN-AhR Pathway for Cancer Immunotherapy—Challenges and Opportunities. Trends Pharmacol. Sci. 2018, 39, 307–325. [Google Scholar] [CrossRef]
  15. Liu, Y.; Liang, X.; Dong, W.; Fang, Y.; Lv, J.; Zhang, T.; Fiskesund, R.; Xie, J.; Liu, J.; Yin, X.; et al. Tumor-Repopulating Cells Induce PD-1 Expression in CD8+ T Cells by Transferring Kynurenine and AhR Activation. Cancer Cell 2018, 33, 480–494. [Google Scholar] [CrossRef] [Green Version]
  16. Xue, P.; Fu, J.; Zhou, Y. The Aryl Hydrocarbon Receptor and Tumor Immunity. Front. Immunol. 2018, 9, 286. [Google Scholar] [CrossRef] [Green Version]
  17. Iommarini, L.; Porcelli, A.M.; Gasparre, G.; Kurelac, I. Non-Canonical Mechanisms Regulating Hypoxia-Inducible Factor 1 Alpha in Cancer. Front. Oncol. 2017, 7, 286. [Google Scholar] [CrossRef] [Green Version]
  18. Selak, M.A.; Armour, S.M.; MacKenzie, E.D.; Boulahbel, H.; Watson, D.G.; Mansfield, K.D.; Pan, Y.; Simon, M.C.; Thompson, C.B.; Gottlieb, E. Succinate links TCA cycle dysfunction to oncogenesis by inhibiting HIF-α prolyl hydroxylase. Cancer Cell 2005, 7, 77–85. [Google Scholar] [CrossRef] [PubMed] [Green Version]
  19. Kontos, C.; Papageorgiou, S.G.; Diamantopoulos, M.A.; Scorilas, A.; Bazani, E.; Vasilatou, D.; Gkontopoulos, K.; Glezou, E.; Stavroulaki, G.; Dimitriadis, G.; et al. mRNA overexpression of the hypoxia inducible factor 1 alpha subunit gene (HIF1A): An independent predictor of poor overall survival in chronic lymphocytic leukemia. Leuk. Res. 2016, 53, 65–73. [Google Scholar] [CrossRef] [PubMed]
  20. Wagage, S.; Hunter, C.A. Interrelated Roles for the Aryl Hydrocarbon Receptor and Hypoxia Inducible Factor-1α in the Immune Response to Infection. Curr. Med. Chem. 2015, 11, 43–54. [Google Scholar] [CrossRef] [Green Version]
  21. Sherr, D.H.; Monti, S. The role of the aryl hydrocarbon receptor in normal and malignant B cell development. Semin. Immunopathol. 2013, 35, 705–716. [Google Scholar] [CrossRef] [PubMed] [Green Version]
  22. Burrows, N.; Maxwell, P.H. Hypoxia and B cells. Exp. Cell Res. 2017, 356, 197–203. [Google Scholar] [CrossRef] [PubMed]
  23. Villa, M.; Gialitakis, M.; Tolaini, M.; Ahlfors, H.; Henderson, C.J.; Wolf, C.R.; Brink, R.; Stockinger, B. Aryl hydrocarbon receptor is required for optimal B-cell proliferation. EMBO J. 2017, 36, 116–128. [Google Scholar] [CrossRef] [PubMed]
  24. Piper, C.J.; Rosser, E.C.; Oleinika, K.; Nistala, K.; Krausgruber, T.; Rendeiro, A.; Banos, A.; Drozdov, I.; Villa, M.; Thomson, S.; et al. Aryl Hydrocarbon Receptor Contributes to the Transcriptional Program of IL-10-Producing Regulatory B Cells. Cell Rep. 2019, 29, 1878–1892. [Google Scholar] [CrossRef] [Green Version]
  25. DiLillo, D.J.; Weinberg, J.B.; Yoshizaki, A.; Horikawa, M.; Bryant, J.M.; Iwata, Y.; Matsushita, T.; Matta, K.M.; Chen, Y.; Venturi, G.M.; et al. Chronic lymphocytic leukemia and regulatory B cells share IL-10 competence and immunosuppressive function. Leukemia 2013, 27, 170–182. [Google Scholar] [CrossRef] [Green Version]
  26. Valsecchi, R.; Coltella, N.; Belloni, D.; Ponente, M.; Hacken, E.T.; Scielzo, C.; Scarfo’, L.; Bertilaccio, M.T.S.; Brambilla, P.; Lenti, E.; et al. HIF-1α regulates the interaction of chronic lymphocytic leukemia cells with the tumor microenvironment. Blood 2016, 127, 1987–1997. [Google Scholar] [CrossRef] [Green Version]
  27. Griggio, V.; Vitale, C.; Todaro, M.; Riganti, C.; Kopecka, J.; Salvetti, C.; Bomben, R.; Bo, M.D.; Magliulo, D.; Rossi, D.; et al. HIF-1α is over-expressed in leukemic cells from TP53-disrupted patients and is a promising therapeutic target in chronic lymphocytic leukemia. Haematologica 2019, 105, 1042–1054. [Google Scholar] [CrossRef] [PubMed] [Green Version]
  28. Bichi, R.; Shinton, S.A.; Martin, E.S.; Koval, A.; Calin, G.; Cesari, R.; Russo, G.; Hardy, R.R.; Croce, C.M. Human chronic lymphocytic leukemia modeled in mouse by targeted TCL1 expression. Proc. Natl. Acad. Sci. USA 2002, 99, 6955–6960. [Google Scholar] [CrossRef] [Green Version]
  29. Gonder, S.; Botana, I.F.; Wierz, M.; Pagano, G.; Gargiulo, E.; Cosma, A.; Moussay, E.; Paggetti, J.; Largeot, A. Method for the Analysis of the Tumor Microenvironment by Mass Cytometry: Application to Chronic Lymphocytic Leukemia. Front. Immunol. 2020, 11, 578176. [Google Scholar] [CrossRef]
  30. Wierz, M.; Pierson, S.; Chouha, N.; Désaubry, L.; François, J.-H.; Berchem, G.; Paggetti, J.; Moussay, E. The prohibitin-binding compound fluorizoline induces apoptosis in chronic lymphocytic leukemia cells ex vivo but fails to prevent leukemia development in a murine model. Haematologica 2018, 103, e154–e157. [Google Scholar] [CrossRef]
  31. Wierz, M.; Janji, B.; Berchem, G.; Moussay, E.; Paggetti, J. High-dimensional mass cytometry analysis revealed microenvironment complexity in chronic lymphocytic leukemia. OncoImmunology 2018, 7, e1465167. [Google Scholar] [CrossRef] [Green Version]
  32. Wierz, M.; Pierson, S.; Guyonnet, L.; Viry, E.; Lequeux, A.; Oudin, A.; Niclou, S.P.; Ollert, M.; Berchem, G.; Janji, B.; et al. Dual PD1/LAG3 immune checkpoint blockade limits tumor development in a murine model of chronic lymphocytic leukemia. Blood 2018, 131, 1617–1621. [Google Scholar] [CrossRef] [Green Version]
  33. Meng, X.; Grötsch, B.; Luo, Y.; Knaup, K.X.; Wiesener, M.S.; Chen, X.-X.; Jantsch, J.; Fillatreau, S.; Schett, G.; Bozec, A. Hypoxia-inducible factor-1α is a critical transcription factor for IL-10-producing B cells in autoimmune disease. Nat. Commun. 2018, 9, 251. [Google Scholar] [CrossRef] [Green Version]
  34. Kovalova, N.; Nault, R.; Crawford, R.; Zacharewski, T.R.; Kaminski, N.E. Comparative analysis of TCDD-induced AhR-mediated gene expression in human, mouse and rat primary B cells. Toxicol. Appl. Pharmacol. 2017, 316, 95–106. [Google Scholar] [CrossRef] [Green Version]
  35. Wang, G.L.; Jiang, B.-H.; Rue, E.A.; Semenza, G.L. Hypoxia-inducible factor 1 is a basic-helix-loop-helix-PAS heterodimer regulated by cellular O2 tension. Proc. Natl. Acad. Sci. USA 1995, 92, 5510–5514. [Google Scholar] [CrossRef] [PubMed] [Green Version]
  36. Bacsi, S.G.; Reisz-Porszasz, S.; Hankinson, O. Orientation of the heterodimeric aryl hydrocarbon (dioxin) receptor complex on its asymmetric DNA recognition sequence. Mol. Pharmacol. 1995, 47, 432–438. [Google Scholar] [PubMed]
  37. Vaidyanathan, B.; Chaudhry, A.; Yewdell, W.T.; Angeletti, D.; Yen, W.-F.; Wheatley, A.; Bradfield, C.A.; McDermott, A.B.; Yewdell, J.W.; Rudensky, A.Y.; et al. The aryl hydrocarbon receptor controls cell-fate decisions in B cells. J. Exp. Med. 2017, 214, 197–208. [Google Scholar] [CrossRef] [PubMed]
  38. Vakili-Samiani, S.; Jalil, A.T.; Abdelbasset, W.K.; Yumashev, A.V.; Karpisheh, V.; Jalali, P.; Adibfar, S.; Ahmadi, M.; Feizi, A.A.H.; Jadidi-Niaragh, F. Targeting Wee1 kinase as a therapeutic approach in Hematological Malignancies. DNA Repair 2021, 107, 103203. [Google Scholar] [CrossRef]
  39. Lambert, M.; Jambon, S.; Depauw, S.; David-Cordonnier, M.-H. Targeting Transcription Factors for Cancer Treatment. Molecules 2018, 23, 1479. [Google Scholar] [CrossRef] [PubMed] [Green Version]
  40. Ramsay, G.; Cantrell, D. Environmental and metabolic sensors that control T cell biology. Front. Immunol. 2015, 6, 99. [Google Scholar] [CrossRef] [PubMed]
  41. Magliulo, D.; Bernardi, R. HIF-α factors as potential therapeutic targets in leukemia. Expert Opin. Ther. Targets 2018, 22, 917–928. [Google Scholar] [CrossRef]
  42. Bianchi-Smiraglia, A.; Bagati, A.; Fink, E.E.; Affronti, H.C.; Lipchick, B.C.; Moparthy, S.; Long, M.D.; Rosario, S.R.; Lightman, S.M.; Moparthy, K.; et al. Inhibition of the aryl hydrocarbon receptor/polyamine biosynthesis axis suppresses multiple myeloma. J. Clin. Investig. 2018, 128, 4682–4696. [Google Scholar] [CrossRef]
  43. Largeot, A.; Pagano, G.; Gonder, S.; Moussay, E.; Paggetti, J. The B-side of Cancer Immunity: The Underrated Tune. Cells 2019, 8, 449. [Google Scholar] [CrossRef] [PubMed] [Green Version]
  44. Alhakeem, S.; McKenna, M.K.; Oben, K.Z.; Noothi, S.K.; Rivas, J.R.; Hildebrandt, G.C.; Fleischman, R.A.; Rangnekar, V.M.; Muthusamy, N.; Bondada, S. Chronic Lymphocytic Leukemia–Derived IL-10 Suppresses Antitumor Immunity. J. Immunol. 2018, 200, 4180–4189. [Google Scholar] [CrossRef] [PubMed]
  45. Vitale, C.; Griggio, V.; Riganti, C.; Todaro, M.; Kopecka, J.; Jones, R.; Salvetti, C.; Boccellato, E.; Perutelli, F.; Voena, C.; et al. Targeting HIF-1α Regulatory Pathways as a Strategy to Hamper Tumor-Microenvironment Interactions in CLL. Cancers 2021, 13, 2883. [Google Scholar] [CrossRef]
  46. Serra, S.; Vaisitti, T.; Audrito, V.; Bologna, C.; Buonincontri, R.; Chen, S.-S.; Arruga, F.; Brusa, D.; Coscia, M.; Jaksic, O.; et al. Adenosine signaling mediates hypoxic responses in the chronic lymphocytic leukemia microenvironment. Blood Adv. 2016, 1, 47–61. [Google Scholar] [CrossRef] [PubMed] [Green Version]
  47. Ye, Z.; Yue, L.; Shi, J.; Shao, M.; Wu, T. Role of IDO and TDO in Cancers and Related Diseases and the Therapeutic Implications. J. Cancer 2019, 10, 2771–2782. [Google Scholar] [CrossRef] [Green Version]
  48. Lindström, V.; Aittoniemi, J.; Jylhävä, J.; Eklund, C.; Hurme, M.; Paavonen, T.; Oja, S.S.; Itälä-Remes, M.; Sinisalo, M. Indoleamine 2,3-Dioxygenase Activity and Expression in Patients with Chronic Lymphocytic Leukemia. Clin. Lymphoma Myeloma Leuk. 2012, 12, 363–365. [Google Scholar] [CrossRef] [PubMed]
  49. Jitschin, R.; Braun, M.; Büttner, M.; Dettmer-Wilde, K.; Bricks, J.; Berger, J.; Eckart, M.J.; Krause, S.; Oefner, P.J.; Le Blanc, K.; et al. CLL-cells induce IDOhi CD14+HLA-DRlo myeloid-derived suppressor cells that inhibit T-cell responses and promote TRegs. Blood 2014, 124, 750–760. [Google Scholar] [CrossRef] [Green Version]
  50. Sadik, A.; Patterson, L.F.S.; Öztürk, S.; Mohapatra, S.R.; Panitz, V.; Secker, P.F.; Pfänder, P.; Loth, S.; Salem, H.; Prentzell, M.T.; et al. IL4I1 Is a Metabolic Immune Checkpoint that Activates the AHR and Promotes Tumor Progression. Cell 2020, 182, 1252–1270. [Google Scholar] [CrossRef]
Figure 1. RNA sequencing of B cells from C57BL/6 and Eµ-TCL1 mice. Splenic B cells were FACS-sorted from three mice of each genotype, and mRNA was sequenced. (A) Principal component analysis of individual animals. (B) K-means clustering and Gene Ontology enrichment analysis. (C) Scatterplot depicting the expression of genes in the groups. (D) Unsupervised hierarchical clustering showing 1416 genes upregulated and 1041 genes downregulated in TCL1. (E,G) Gene Set Enrichment Analysis showing the enrichment of hypoxia (E) and AHR (G) signatures in Eµ-TCL1 versus C57BL/6 mice. (F) Protein–protein interactions network (STRING) for transcription factors involved in enriched hallmark pathways (GSEA). (H) Transcription factor activity (Z-values, ISMARA) for HIF-1α and AHR motifs in WT and TCL1 B cells.
Cancers 13 04518 g001
Figure 2. Knocking out HIF-1α does not show an effect on the leukemogenesis of CLL cells in the murine Eµ-TCL1 model. (A) Scheme of the breeding strategy to generate Eµ-TCL1 CD19Cre/WT Hif1afl/fl (cKO). (BD) Validation of the knock-out of exon 2 of Hif1a in isolated B cells from cKO mice incubated with CoCl2 at the DNA (B), RNA (C), and protein (D) levels compared to control mice (n = 3). ** p < 0.01, **** p < 0.0001. (E) Survival curve of cKO compared to control mice shows no significant difference. (FG) Flow cytometry analysis of CLL cells (CD19+ CD5+) in the peripheral blood (PB) of cKO and control mice over time (Ctrl: n = 45, cKO: n = 39) (F) and at month 8 (Ctrl: n = 42, cKO: n = 35) (G). (HI) CLL cells from cKO and control mice (n = 3) were subjected to RNA sequencing. (H) Unsupervised hierarchical clustering showing the top 10,000 most expressed genes. (I) Volcano plot showing DEG between cKO and control mice. (J) CLL development of the adoptive transfer of Eµ-TCL1 CLL cells in CD19Cre/WT Hif1afl/fl mice (Ctrl: n = 5, cKO: n = 6).
Cancers 13 04518 g002
Figure 3. AHR knock-out does not influence CLL development in the murine Eµ-TCL1 model. (A) Scheme of the breeding strategy to generate Eµ-TCL1 CD19Cre/WT Ahrfl/fl (cKO) mice. (BD) Validation of the knock-out of exon 2 of Ahr in isolated B cells from cKO mice incubated with FICZ at the DNA (B), RNA (C), and protein (D) levels compared to control mice (n = 3). ** p < 0.01. (E) Survival curve of cKO compared to control mice shows no significant difference. (Ctrl: n = 45, cKO: n = 38). (F,G) Flow cytometry analysis of CLL cells (CD19+ CD5+) in the peripheral blood (PB) of cKO and control mice over time (Ctrl: n = 45, cKO: n = 38) (F) and at month 8 (Ctrl: n = 42, cKO: n = 34) (G). (H,I) CLL cells from cKO and control mice (n = 3) were subjected to RNA sequencing. (H) Unsupervised hierarchical clustering showing the top 10,000 most expressed genes. (I) Volcano plot showing DEG between cKO and control mice. (J) CLL development of the adoptive transfer of Eµ-TCL1 CLL cells in CD19Cre/WT Ahrfl/fl mice (Ctrl: n = 5, cKO: n = 5).
Cancers 13 04518 g003
Figure 4. Double knock-out of AHR and HIF-1α does not appear to have an impact on the development of neoplastic B cells. (A) Scheme of the breeding strategy to generate Eµ-TCL1 CD19Cre/WT Hif1afl/flAhrfl/fl (cDKO) mice. (BF) Validation of the knock-out of exon 2 of Hif1a and Ahr, respectively, in isolated B cells from cDKO mice incubated with CoCl2 and FICZ at the DNA (B,C), RNA (D,E), and protein (F) levels compared to control mice (n = 3). ** p < 0.01, *** p < 0.001, **** p < 0.0001. (G) Survival curve of cDKO compared to control mice shows no significant difference. (Ctrl: n = 45, cDKO: n = 21). (H,I) Flow cytometry analysis of CLL cells (CD19+ CD5+) in the peripheral blood (PB) of cDKO and control mice over time (Ctrl: n = 45, cDKO: n = 21) (H) and at month 8 (Ctrl: n = 35, cDKO: n = 16) (I). (J,K) CLL cells from cDKO and control mice (n = 3) were subjected to RNA sequencing. (L) Unsupervised hierarchical clustering showing the top 10,000 most expressed genes. (I) Volcano plot showing DEG between cDKO and control mice. (J) CLL development of the adoptive transfer of Eµ-TCL1 CLL cells in CD19Cre/WT Hif1afl/fl Ahrfl/fl mice (Ctrl: n = 4, cDKO: n = 4).
Cancers 13 04518 g004
Table 1. Relevant Gene Sets enriched in leukemic B cells compared to normal B cells as revealed by RNA sequencing analysis and GSEA. NES, normalized enrichment score. NOM p-val, nominal p-value.
RankGeneSetsSIZENESNOM p-Val
1HALLMARK_MYC_TARGETS_V12001.460.000
2HALLMARK_CHOLESTEROL_HOMEOSTASIS731.450.000
3HALLMARK_GLYCOLYSIS2001.40.000
4HALLMARK_E2F_TARGETS2001.40.185
6HALLMARK_MYC_TARGETS_V2571.380.000
7HALLMARK_OXIDATIVE_PHOSPHORYLATION1971.350.000
8HALLMARK_REACTIVE_OXYGEN_SPECIES_PATHWAY491.340.000
9HALLMARK_FATTY_ACID_METABOLISM1571.340.000
10HALLMARK_G2M_CHECKPOINT1961.290.185
11HALLMARK_UV_RESPONSE_UP1561.280.000
15HALLMARK_HYPOXIA1981.220.000
16HALLMARK_P53_PATHWAY2001.220.084
18HALLMARK_IL2_STAT5_SIGNALING1991.20.094
20HALLMARK_MTORC1_SIGNALING1991.180.287
21HALLMARK_UNFOLDED_PROTEIN_RESPONSE1121.150.185
24HALLMARK_MITOTIC_SPINDLE1991.130.269
25HALLMARK_DNA_REPAIR1481.130.084
28HALLMARK_XENOBIOTIC_METABOLISM1961.090.299
30HALLMARK_APOPTOSIS1611.010.376
31HALLMARK_IL6_JAK_STAT3_SIGNALING871.010.381
32HALLMARK_PROTEIN_SECRETION961.010.472
33HALLMARK_WNT_BETA_CATENIN_SIGNALING4110.362
Table 2. Top50 ranking of transcription factors whose putative transcriptional targets are most closely similar to those in the query set. CHEA3 results for transcription factors enrichment analysis (TFEA). Lower scores indicate more relevancy to the related transcription factor. Full query = 1632 TFs.
RankTFScoreRankTFScore
1FOXM14.33326CEBPB88.83
2CENPA5.027NFE2L289.4
3ZNF3678.33328ARNTL294.67
4PA2G415.529JDP295.67
5HMGA224.6730ZNF88897.0
6AHRR26.531BHLHE4097.75
7ZNF69529.032ZNF67098.5
8E2F729.233OSR199.5
9E2F133.8334GLMP101.5
10FOSL135.435HMGN3105.0
11ELK349.036ZNF93106.7
12FOXD151.537AHR107.4
13MYBL255.1738PPARG108.0
14TFDP156.039TAL1109.0
15E2F265.3340ATF3110.3
16RFX868.041TEAD4119.8
17CENPX68.042NR1H3120.0
18KLF672.043HIF1A120.2
19CREB3L275.3344VDR120.8
20ETV476.545KLF9123.8
21ZNF87878.046GLIS2126.3
22E2F880.047RELB128.3
23DNMT181.048PLSCR1131.0
24NR2F685.549TEAD3132.7
25KLF487.050HLX136.3
Publisher’s Note: MDPI stays neutral with regard to jurisdictional claims in published maps and institutional affiliations.

