Article

The Expression Profiles and Deregulation of UDP-Glycosyltransferase (UGT) Genes in Human Cancers and Their Association with Clinical Outcomes

1
Dicipline of Clinical Pharmacology, College of Medicine and Public Health, Flinders University, Bedford Park, SA 5042, Australia
2
Dicipline of Molecular Medicine and Pathology, College of Medicine and Public Health, Flinders University, Bedford Park, SA 5042, Australia
*
Author to whom correspondence should be addressed.
Cancers 2021, 13(17), 4491; https://doi.org/10.3390/cancers13174491
Submission received: 19 July 2021 / Revised: 25 August 2021 / Accepted: 2 September 2021 / Published: 6 September 2021
(This article belongs to the Section Cancer Biomarkers)

Abstract

:

Simple Summary

The human UDP-glycosyltransferase (UGT) superfamily plays a critical role in the metabolism of numerous endogenous and exogenous small lipophilic compounds, including carcinogens, drugs, and bioactive molecules with pro- or anti-cancer activity. Previous studies have documented the expression of UGT genes in several cancers derived from drug-metabolizing organs (e.g., liver, colon, kidney). The present study represents the first to comprehensively assess the expression profiles of UGT genes and their impact on patient survival in nearly 30 different cancers primarily derived from non-drug-metabolizing organs. Briefly, our comprehensive analysis of the transcriptomic (RNAseq) and clinical datasets of 9514 patients from 33 different cancers shows the widespread expression of UGT genes, indicative of active drug metabolism within the tumor through the UGT conjugation pathway. We further identified the UGT genes whose intratumoral expression was associated with patient survival, highlighting the potential of UGT genes as prognostic biomarkers and therapeutic targets in various cancers.

Abstract

The human UDP-glycosyltransferase (UGTs) superfamily has 22 functional enzymes that play a critical role in the metabolism of small lipophilic compounds, including carcinogens, drugs, steroids, lipids, fatty acids, and bile acids. The expression profiles of UGT genes in human cancers and their impact on cancer patient survival remains to be systematically investigated. In the present study, a comprehensive analysis of the RNAseq and clinical datasets of 9514 patients from 33 different TCGA (the Genome Cancer Atlas) cancers demonstrated cancer-specific UGT expression profiles with high interindividual variability among and within individual cancers. Notably, cancers derived from drug metabolizing tissues (liver, kidney, gut, pancreas) expressed the largest number of UGT genes (COAD, KIRC, KIRP, LIHC, PAAD); six UGT genes (1A6, 1A9, 1A10, 2A3, 2B7, UGT8) showed high expression in five or more different cancers. Kaplan–Meier plots and logrank tests revealed that six UGT genes were significantly associated with increased overall survival (OS) rates [UGT1A1 (LUSC), UGT1A6 (ACC), UGT1A7 (ACC), UGT2A3 (KIRC), UGT2B15 (BLCA, SKCM)] or decreased OS rates [UGT2B15 (LGG), UGT8 (UVM)] in specific cancers. Finally, differential expression analysis of 611 patients from 12 TCGA cancers identified 16 UGT genes (1A1, 1A3, 1A6, 1A7, 1A8, 1A9, 1A10, 2A1, 2A3, 2B4, 2B7, 2B11, 2B15, 3A1, 3A2, UGT8) that were up/downregulated in at least one cancer relative to normal tissues. In conclusion, our data show widespread expression of UGT genes in cancers, highlighting the capacity for intratumoural drug metabolism through the UGT conjugation pathway. The data also suggests the potentials for specific UGT genes to serve as prognostic biomarkers or therapeutic targets in cancers.

1. Introduction

The human UDP-glycosyltransferase (UGT) superfamily contains 22 functional genes that are divided into four subfamilies (UGT1, UGT2, UGT3, UGT8) [1,2]. UGTs conjugate numerous small lipophilic endogenous and exogenous compounds at functional groups (e.g., hydroxyl, carboxyl, amine) with sugars (e.g., glucuronic acid, glucose, xylose, N-acetylglucosamine, galactose), and the resultant products are generally inactive and water-soluble, thus eliminating the biological activity of the parent compounds and facilitating their excretion from the body through the bile, urine or feces [3]. The 9 UGT1 (1A1, 1A3-1A10) and 10 UGT2 (2A1, 2A2, 2A3, 2B4, 2B7, 2B10, 2B11, 2B15, 2B17, and 2B28) enzymes conjugate substrates with glucuronic acid and are hence traditionally termed UDP-glucuronosyltransferases [4]. UGTs play a critical role in the metabolism and clearance of numerous endogenous (e.g., steroid hormones, bile acids, bilirubin, fatty acids) and exogenous (dietary constituents, environmental toxins and carcinogens, therapeutic drugs) compounds [3,5].
The expression profiles of UGT genes in human tissues have been investigated at RNA and protein levels using multiple approaches. Due to the lack of specific antibodies for most UGT enzymes, there is the only analysis of protein expression in human tissues for a subset of UGT genes (e.g., 1A1, 1A6, 2B7, 2B15, 2B17, 2B28) using custom-developed antibodies via immunohistochemistry, immunoblotting, or tissue microarrays [6,7,8,9,10,11,12]. There are commercial UGT antibodies from several companies (e.g, Sigma, Abcam), but their specificities have not yet been vigorously validated and have been reported to recognize several highly homologous UGT enzymes [11,13]. To overcome this limitation, recent studies have used stable isotope-labeled peptide-based liquid chromatography-tandem mass spectrometry (LC-MS/MS) [14,15,16,17,18,19,20]. However, there is more extensive data on UGT mRNA expression in human tissues and cell lines that have been generated using isoform-specific reverse transcriptase quantitative real-time polymerase chain reaction (RT-qPCR) [21,22,23,24,25,26,27] and RNA sequencing technology (RNAseq) [28,29,30]. RNAseq studies are particularly powerful as they provide accurate isoform-specific and high-throughput quantification of UGT transcripts. Collectively, these studies have demonstrated the widespread expression of UGT genes in normal human tissues. Tissues involved in detoxification, particularly liver, and to a lesser degree, kidney and gut, express the widest range of UGT isoforms and typically the highest transcript levels. However, a subset of UGTs shows high expression in tissues that are not generally associated with drug metabolism and detoxification. These UGTs may be important for local control of endogenous metabolites (such as steroids) and could, therefore, mediate intra-tissular drug metabolism.
Several studies have assessed the expression profiles of UGT genes and their deregulation in human cancers that are derived from drug-metabolizing tissues/organs, including liver cancer [31,32], kidney cancer [20], colon cancer [7,33,34], and gastric cancers [35,36]. However, little is known about the expression profiles of UGT genes and their deregulation in human cancers that are derived from non-drug-metabolizing tissues.
As recently reviewed [37], case-control studies have shown that a large number of genetic polymorphisms of UGT genes are associated with cancer development and progression. This is believed to be related to the critical roles of UGT enzymes in the systemic metabolism and clearance of carcinogens, cancer-modulating molecules, and anticancer drugs. The expression and activity of UGT genes within the tumor may also impact cancer development and progression through intratumoral inactivation of carcinogens and anticancer drugs. For example, high UGT2B17 expression has recently been shown to be associated with poor prognosis in chronic lymphocytic leukaemia (CLL), partly due to enhanced local inactivation of anti-leukaemic drugs (e.g., fludarabine) within CLL cells [38,39]. Therefore, it is necessary to systematically assess whether the intratumoral expression of UGT genes could be associated with clinical outcomes in different human cancers.
The Cancer Genome Atlas (TCGA) project analysed over 20,000 primary cancer patients from 33 different cancer types and provides freely-accessible databases for genome-wide molecular profiles (e.g., RNAseq datasets) as well as clinicopathological data (e.g., survival times) for cancer patients (https://gdc.cancer.gov, accessed on 20 June 2021) [40]. Using the RNAseq and clinical datasets from the TCGA project, we recently reported the expression profiles of core ADME genes and their association with patient survival in 21 different TCGA cancer types [41]. Through analyses of the RNAseq and clinical datasets from the TCGA project, the present study defines the expression profiles of all UGT genes in 33 different TCGA cancer types and reports a subset of UGT genes that are significantly associated with survival rates in specific cancers. We further identify the UGT genes that are deregulated in 12 cancer types.

2. Materials and Methods

2.1. Assessment of the Expression Profiles of UGT Genes in Human Cancers

The expression profiles of UGT genes in cancers were assessed using RNAseq data of 9514 tumor samples from 33 different TCGA cancer types [42] (Table 1). RSEM is one of the most frequently used methods for quantifying transcript abundances from RNASeq data [43]. The mRNA levels (RNASeqV2) of UGT genes in 5 TCGA cancers (ESCA, LAML, STAD, OV, UCEC) were obtained as normalized RSEM values from the TCGA database Firehose (http://gdac.broadinstitute.org/, accessed on 20 June 2021; data and analysis version: 2016_01_28). The normalized RSEM values of UGT genes for the remaining 28 TCGA cancer types were obtained from the PanCanAtlas database (EBPlusPlusAdjustPANCAN_IlluminaHiSeq_RNASeqV2.geneExp.tsv, accessed on 20 June 2021) (https://gdc.cancer.gov/about-data/publications/pancanatlas, accessed on 20 June 2021).
There are 22 functional UGT genes in the human genome [44]. The RSEM values of 2 UGT genes (UGT2B17, UGT2A2) were not available from the Firehose and PanCanAtlas databases, and thus, these 2 UGT genes were excluded from our analysis in this study. The normalized RSEM values of the assessed 20 UGT genes in 9514 tumor samples are provided in Table S1. The expression levels (e.g., medians, means) of each UGT gene in each of the 33 different cancer types were calculated using GraphPad Prism (version 8.1.2, GraphPad Software Inc, San Diego, CA, USA) and are presented in Table S2. For simplicity, we defined high, low, and no expression of a UGT gene by a median normalized RSEM level of >32, between 1–32, and <1, respectively. The variable expression of UGT genes within and between cancers are presented using the box-and-whisker plots (Figures S1–S4).

2.2. Assessment of the Deregulation of UGT Genes in Human Cancers

Of the 33 TCGA cancer datasets, 12 had at least 20 patients with RNAseq data (RNAseqV2) available for both tumor tissues and matched adjacent non-cancerous tissues (Table 1). Using RNAseq data from these patients, we assessed whether UGT genes were differentially expressed in cancer tissues as compared to matched adjacent non-cancerous tissues. Briefly, the RNAseq data (RNASeqV2) was downloaded as high-throughput sequencing (HT-seq) counts from the TCGA legacy database (the human genome hg19 reference assembly) using the “TCGAbiolinks” R package (https://bioconductor.org/packages/release/bioc/html/TCGAbiolinks.html, accessed on 10 May 2021). To remove the distributional differences between within-lane and between-lane read counts, the EDAseq package in R (https://bioconductor.org/packages/release/bioc/html/EDASeq.html, accessed on 10 May 2021) was used, and genes were filtered with a quantile threshold of 0.25 [45]. Table S3 provides HT-seq counts for UGT genes in matched tumor and adjacent non-cancerous tissues for 611 patients from the assessed 12 TCGA cancer types.
The differential gene expression analysis between matched cancerous and adjacent non-cancerous tissues were assessed using the DESeq2 program as recently reported [31]. DESeq2 is one of the most frequently used programs for differential gene expression analysis [46]. Briefly, DESeq2 uses a Wald test for statistically significant testing. The Wald test p-values from the genes that pass the independent filtering step are adjusted for multiple testings using the Benjamini–Hochberg test. An adjusted p-value of <0.01 was considered statistically significant. DESeq2 reports a log2FoldChange for the differential expression of each gene and the associated Standard Error for the log2FoldChange estimate (lfcSE). Differentially expressed genes were defined by a log2FoldChange of >2 (equivalent to an upregulation of >4-fold) or <−2 (equivalent to downregulation of >4-fold). Table S4 shows the results from DESeq2 analysis pertaining to UGT genes.
Oncomine is a publicly accessible database that analysed hundreds of whole-genome gene expression datasets from normal and cancer tissues (www.oncomine.org, accessed on 10 May 2021) [47]. Using this platform, we further analysed six non-TCGA cancer datasets to verify our findings from TCGA cancer types: prostate cancer [48], lung cancer [49,50], colon cancer [51], gastric cancer [52], and kidney cancer [53]. All of these studies quantified whole-genome gene expression profiles using DNA microarrays, including Affymetrix U133plus 2.0 arrays [49,50,51], Affymetrix “U95a” arrays [48], Affymetrix HG-U133A arrays [53], or custom-made cDNA microarrays containing 44,500 cDNA clones, representing 30,300 genes [52].

2.3. Assessment of Associations between the Intratumoral Expression Levels of UGT Genes and Overall Survival of Cancer Patients Using Kaplan–Meier Survival Analysis

The TCGA Pan-Cancer Clinical Data Resources (TCGA-CDR) demonstrated the values of the clinical survival data of 33 TCGA cancer types for reliable survival analyses [42]. The TCGA-CDR collected overall survival data and other clinicopathological parameters for 11,160 patients from 33 different TCGA cancer types. We downloaded these survival data (i.e., TCGA-CDR-Supplemental Table S1) from the PanCanAtlas database (https://gdc.cancer.gov/about-data/publications/pancanatlas, accessed on 4 June 2021). Of these patients, only 9514 patients with RNAseq data (normalized RSEM values as described above) available for tumour samples were included in our survival analyses (Table 1 and Table S1).
Overall survival (OS) time was defined as the time from the day at diagnosis to the date of death (dead patients) or the date of the last follow-up (censored patients). The Kaplan–Meier survival analysis is a common approach for clinical survival analysis [54]. Using GraphPad Prism (version 8.1.2), we performed Kaplan–Meier plots and logrank tests to assess the potential associations between intratumoral mRNA levels (normalized RSEM values) of UGT genes and OS rates for each of the 33 TCGA cancer types. For UGT genes that were expressed in over 50% of the tumor samples, we separated the patients by gene expression into a high-expression group (upper 50 percentile) and low/no-expression group (lower 50 percentile) and performed logrank tests. For UGT genes that were expressed in 10–50% of the tumor samples, we separated the patients by gene expression into expression group and no-expression group and performed logrank tests. UGT genes that were expressed in less than 10% of the tumor samples were excluded from survival analysis. As a varying number of UGT genes were expressed in different cancer types (Table S1), the number of independent logrank tests performed varied among different cancers, ranging from 20 tests in LIHC to 3 tests in UVM. To control false-positive discovery rates, we adjusted the logrank p-values for each cancer type using Bonferroni correction, the most stringent test for multiple testing correction as recently reported [41]. A Bonferroni-corrected cutoff logrank p-value of <0.05 was considered statistically significant. Table S2 lists both logrank and Bonferroni-corrected p-values and the associated hazard ratios (HR) and 95% confidence intervals (CI) for all independent logrank tests that assessed the potential associations between intratumoral expression levels of UGT genes and overall survival rates in 33 different TCGA cancer types.

3. Results

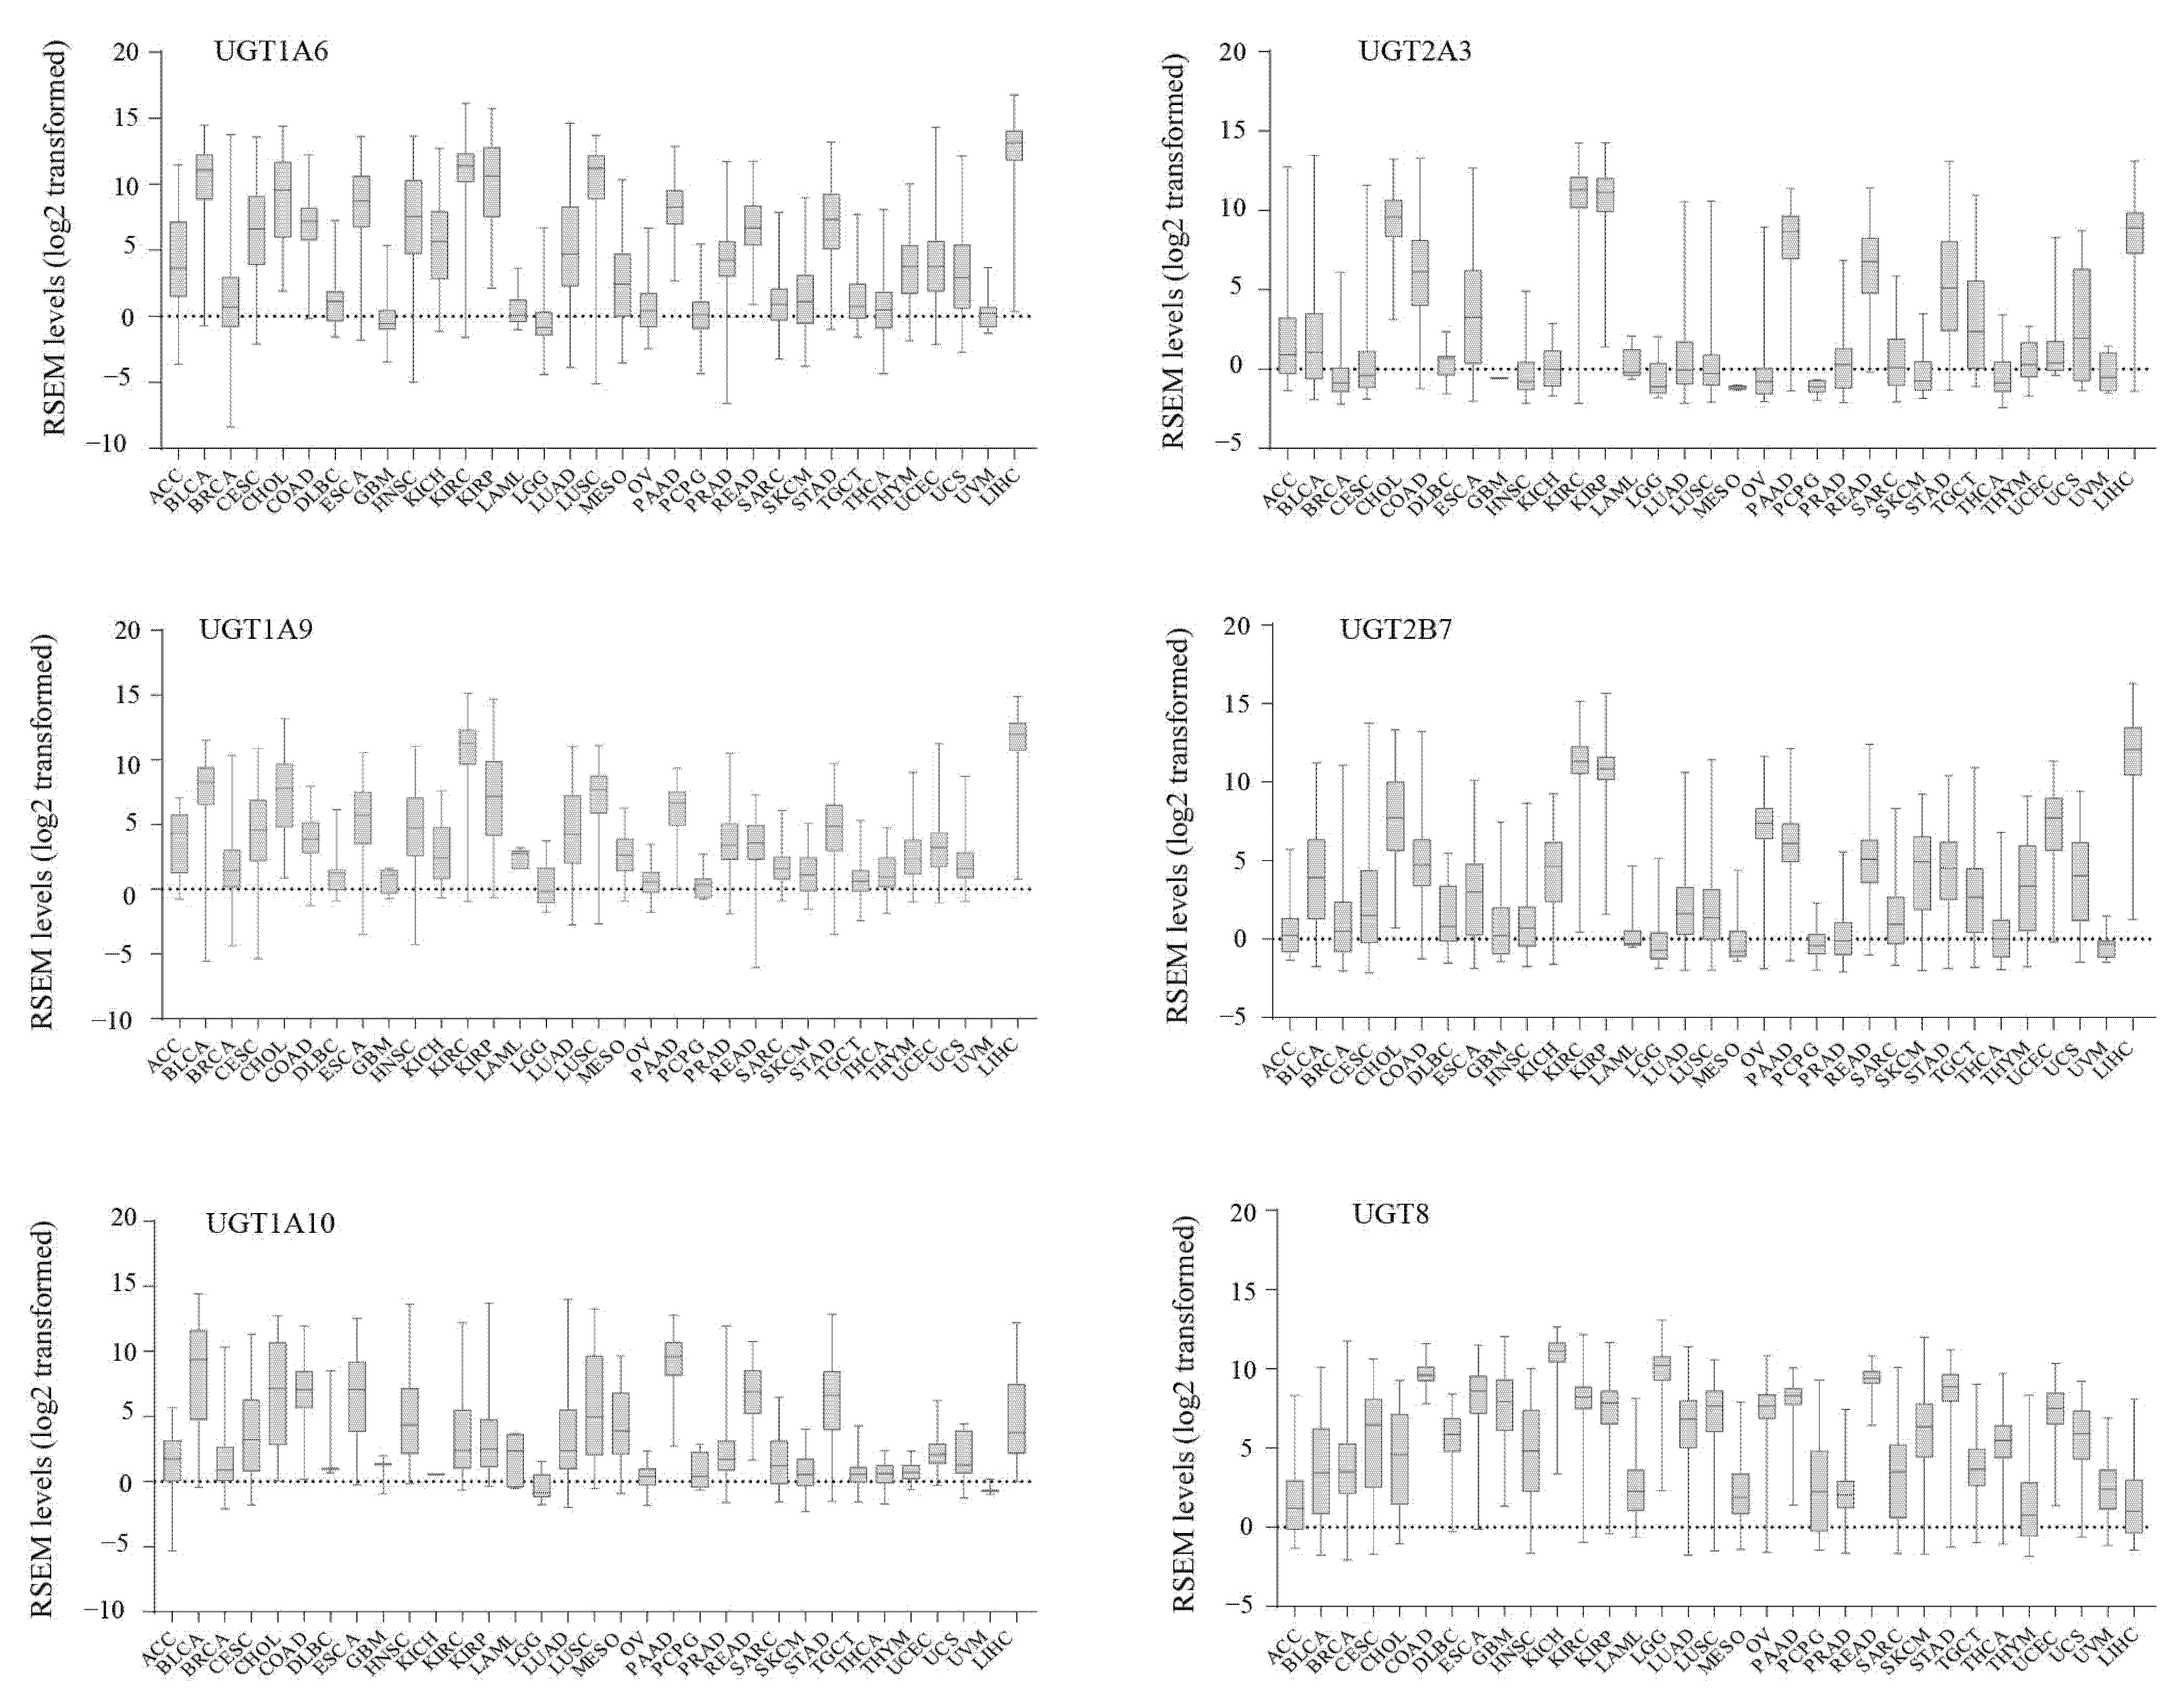
3.1. The Expression Profiles of UGT Genes in Human Cancers

We examined the expression profiles of UGT genes in 9514 tumors of 33 different cancer types using RNAseq data from the TCGA project. Table 1 lists the number of patients for each cancer type that was analysed in this study. The distribution of UGT expression levels within each cohort are represented using box-and-whisker plots; however, to simplify the discussion, we also defined high, moderate, and low expression criteria (see Methods). Overall, a unique set of UGT genes was expressed in different cancers (Figure 1, Figures S1 and S2). LIHC (Liver Hepatocellular Carcinoma) showed high level expression of the broadest range of UGT genes (12 genes: 1A1, 1A3, 1A4, 1A6, 1A9, 2A3, 2B4, 2B7, 2B10, 2B11, 2B15, 3A1) (Figure 1), which is consistent with the abundant expression of these UGTs in normal liver tissues [44]. Five other cancer types also highly expressed at least 6 UGT genes: 1) CHOL (1A1, 1A6, 1A9, 1A10, 2A3, 2B4, 2B7, 2B15), 2) COAD (1A6, 1A9, 2A3, 2B7, 2B15, UGT8), 3) KIRC (1A6, 1A9, 2A3, 2B7, 3A1, UGT8), 4) KIRP (1A6, 1A8, 2A3, 2B7, 3A1, UGT8) and 5) PAAD (1A6, 1A10, 2A3, 2B7, 2B15, UGT8) (Figure 1). However, eight cancer types (ACC, BRCA, LAML, MESO, PCPG, PRAD, SARC, UVM) did not show high expression of any UGT gene (Figure S2).
Of the 20 UGT genes assessed, 6 (1A6, 1A9, 1A10, 2A3, 2B7, UGT8) showed high expression in at least 5 different cancer types. The findings for these 6 genes are presented in Figure 2. Expression profiles of the remaining UGTs are provided in Figures S3 and S4. UGT8 was the most broadly expressed and abundant UGT, showing high expression in 18 cancers (CESC, COAD, DLBC, ESCA, GBM, KICH, KIRC, KIRP, LGG, LUAD, LUSC, OV, PAAD, READ, SKCM, STAD, UCEC, UCS) (Figure 2) that are derived from a wide range of tissues including the gut, brain, kidney, lung, ovary, uterus, pancreas, skin and lymphoid system; however, UGT8 was low/absent in LIHC. This pattern is consistent with its high expression in a broad range of normal human tissues but lack of expression in the liver [44]. UGT1A6 showed high expression in 13 cancer types (BLCA, CESC, CHOL, COAD, ESCA, HNSC, KIRC, KIRP, LIHC, LUSC, PAAD, READ, STAD) (Figure 2) that are derived from a variety of tissues, including many drug-metabolizing tissues (e.g., liver, kidney, gut). However, 8 UGT genes (1A3, 1A4, 1A5, 2A1, 2B4, 2B10, 2B11, 2B28) were highly expressed in LIHC, but none of them showed high expression in any of the remaining 32 cancer types (Figure S3). Consistent with their extrahepatic expression profiles in normal tissues, 3 UGT1As (1A7, 1A8, 1A10) had low expression in LIHC, but they were moderately/highly expressed in several non-hepatic cancer types (Figure S3). In particular, UGT1A10, which is generally highly expressed in the gut [44], showed high expression in 8 cancer types, including those spanning the whole proximal-distal gut axis (BLCA, CHOL, COAD, ESCA, LUSC, PAAD, READ, STAD) (Figure 2). Expression of UGT3A1 was high in cancers associated with the hepatobiliary and renal excretion systems (CHOL, KIRC, KIRP, LIHC). This pattern was distinct from that of UGT3A2, which was only highly expressed in cancers derived from the uterus and testis (TGTC, UCEC, UCS) (Figure S4). These 2 UGT3A genes had low/no expression in all other cancer types.

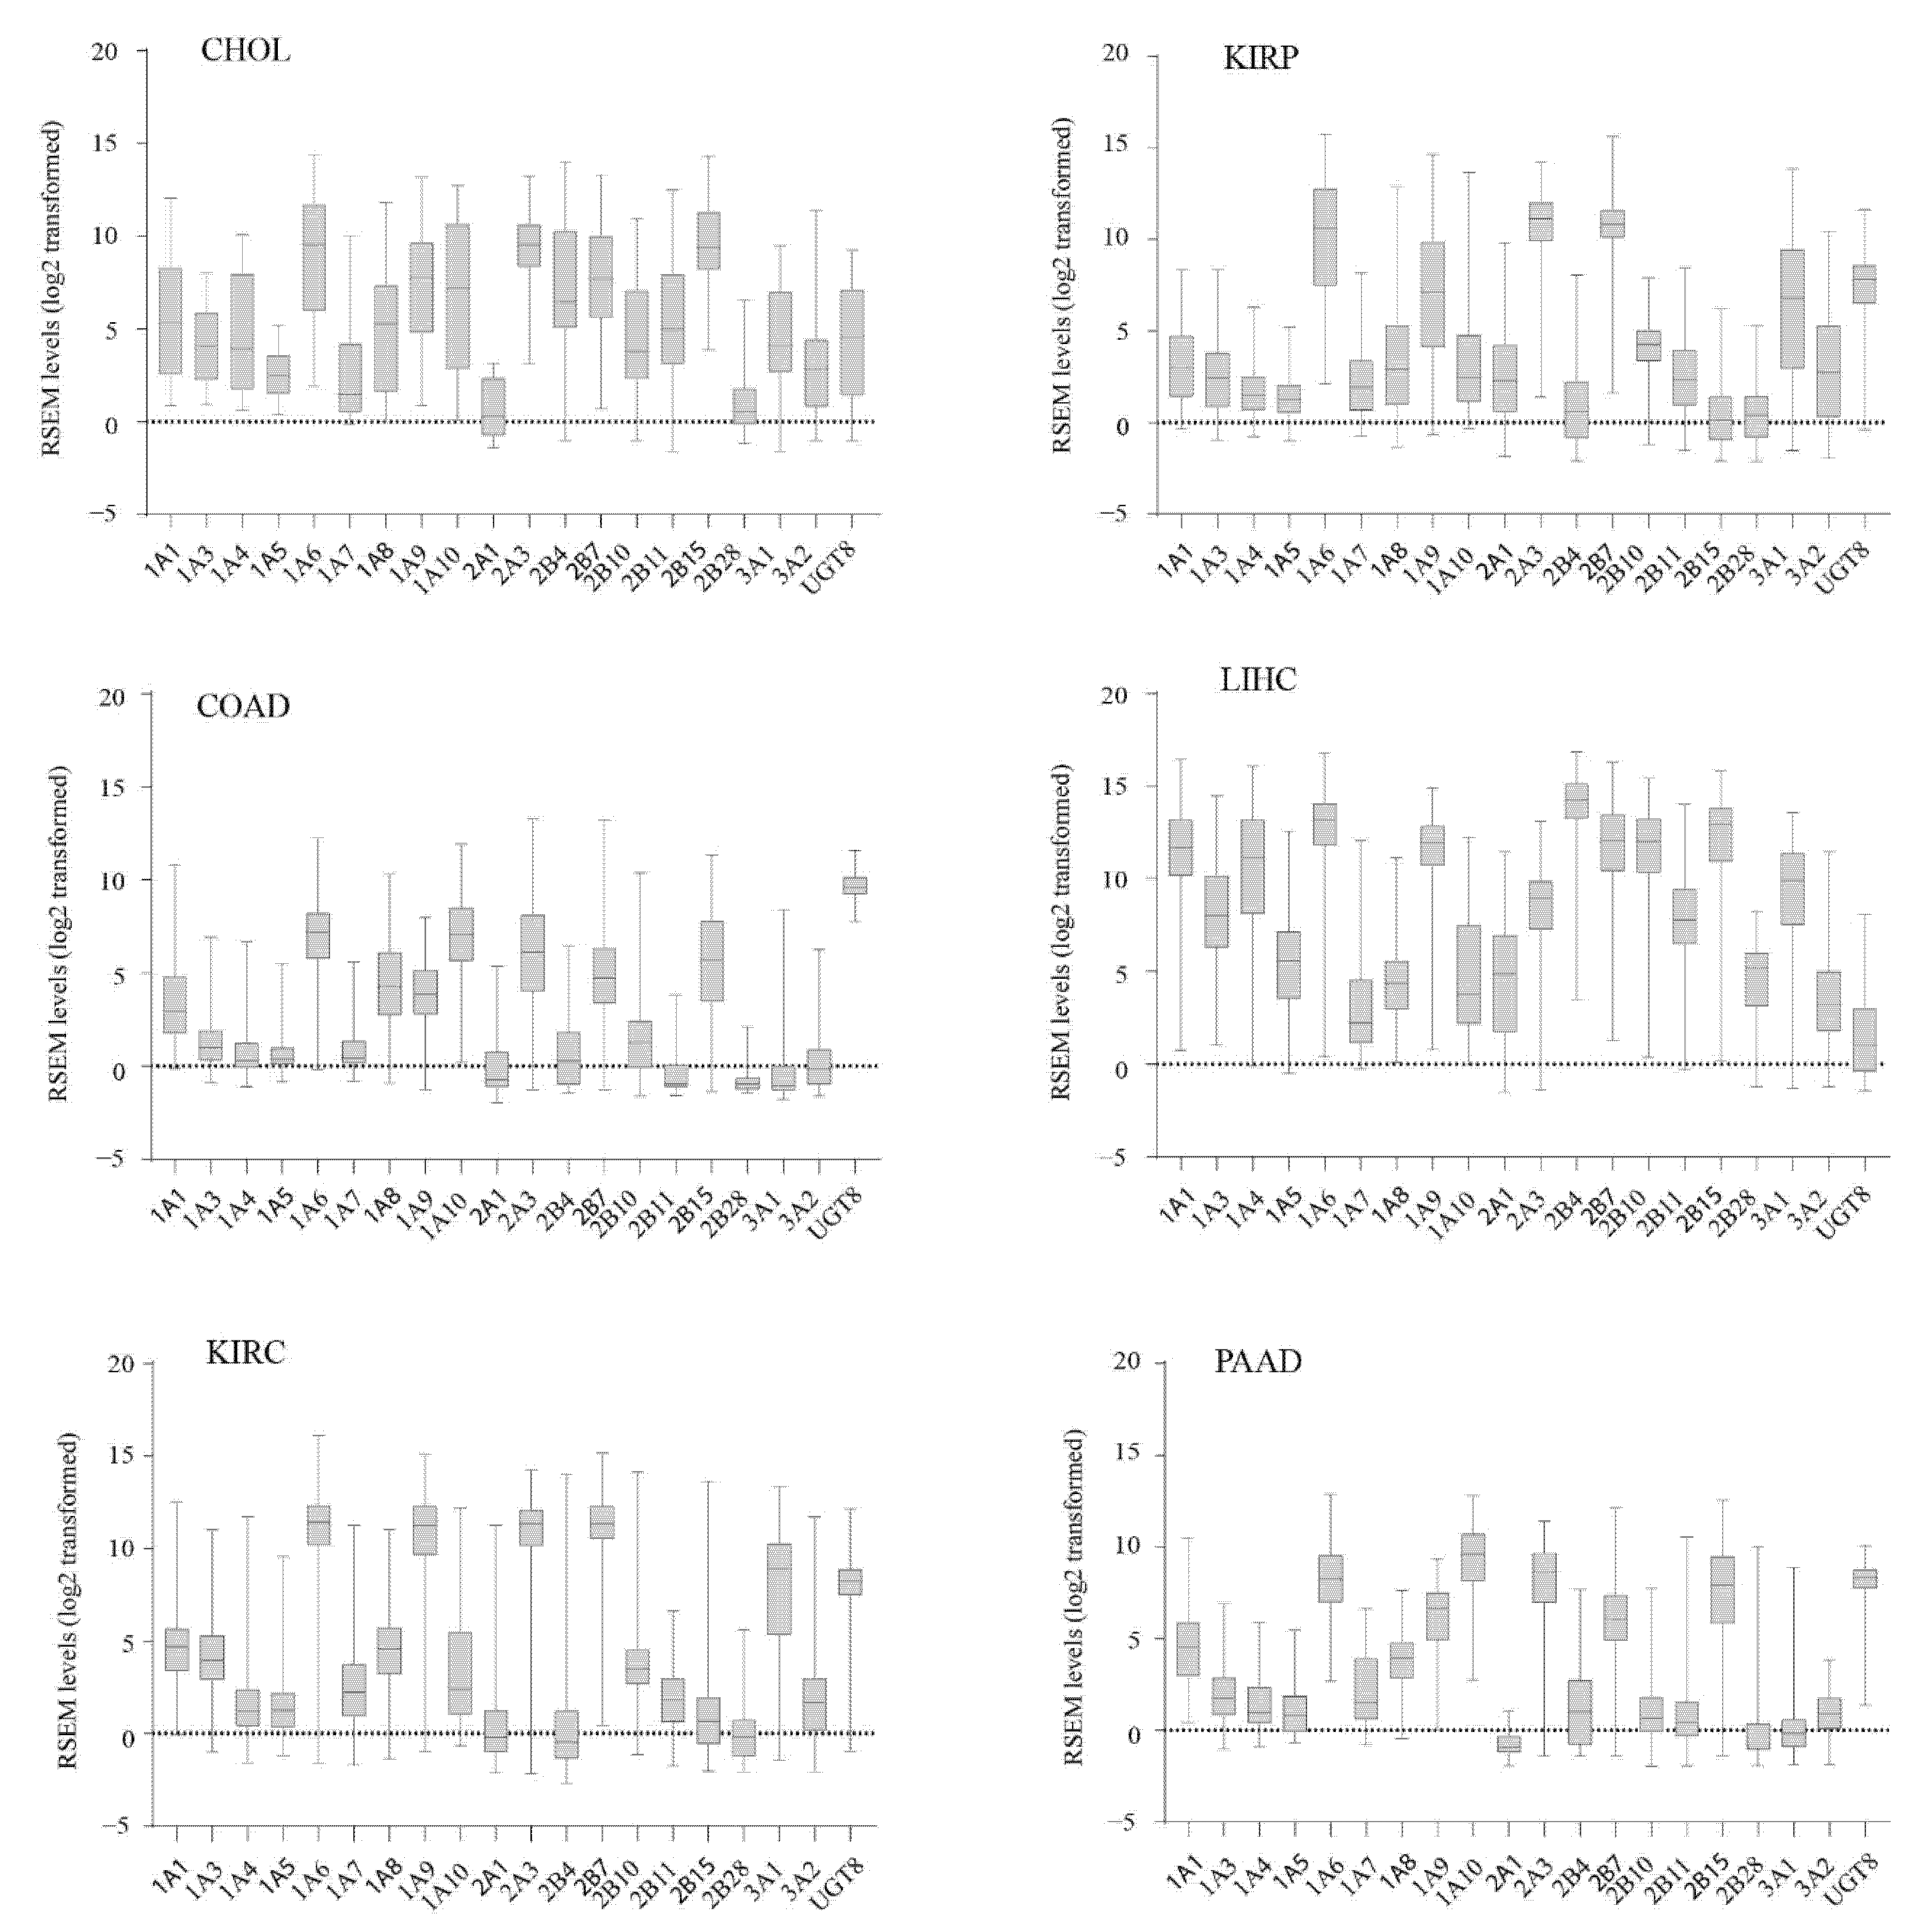
3.2. Inter-Individual Variation in UGT Expression within Human Cancers

The expression of UGT genes is highly dynamic and influenced by multiple extrinsic stimuli and signaling pathways; as such, many UGTs show exceptionally wide interindividual variation in normal tissues, particularly in the liver [3,44]. Thus, it was of interest to determine the inter-individual variability of UGT expression within cancer cohorts. The variable expression of UGT genes within 33 different cancer types are presented using the box-and-whisker plots that show the distribution of the expression levels (minimum, first quartile, median, third quartile, and maximum) in each of these cancers (Figure 2, Figures S3 and S4). Overall, all UGT genes showed inter-individual variable expression in each of the 33 cancer types. For example, UGT1A1 was detected in 362 of the 365 LIHC tumors with RSEM ranging from 1.6 to 87,075. A total of 82 tumours had an expression level of >10,000, whereas 88 tumours had an expression level of <1000 (Table S1). This high interindividual variable expression for UGT1A1 and other UGT genes may result in intratumoral variabilities in the conjugation of UGT substrates and hence impact cancer progression and patient survival as assessed in Section 3.4.

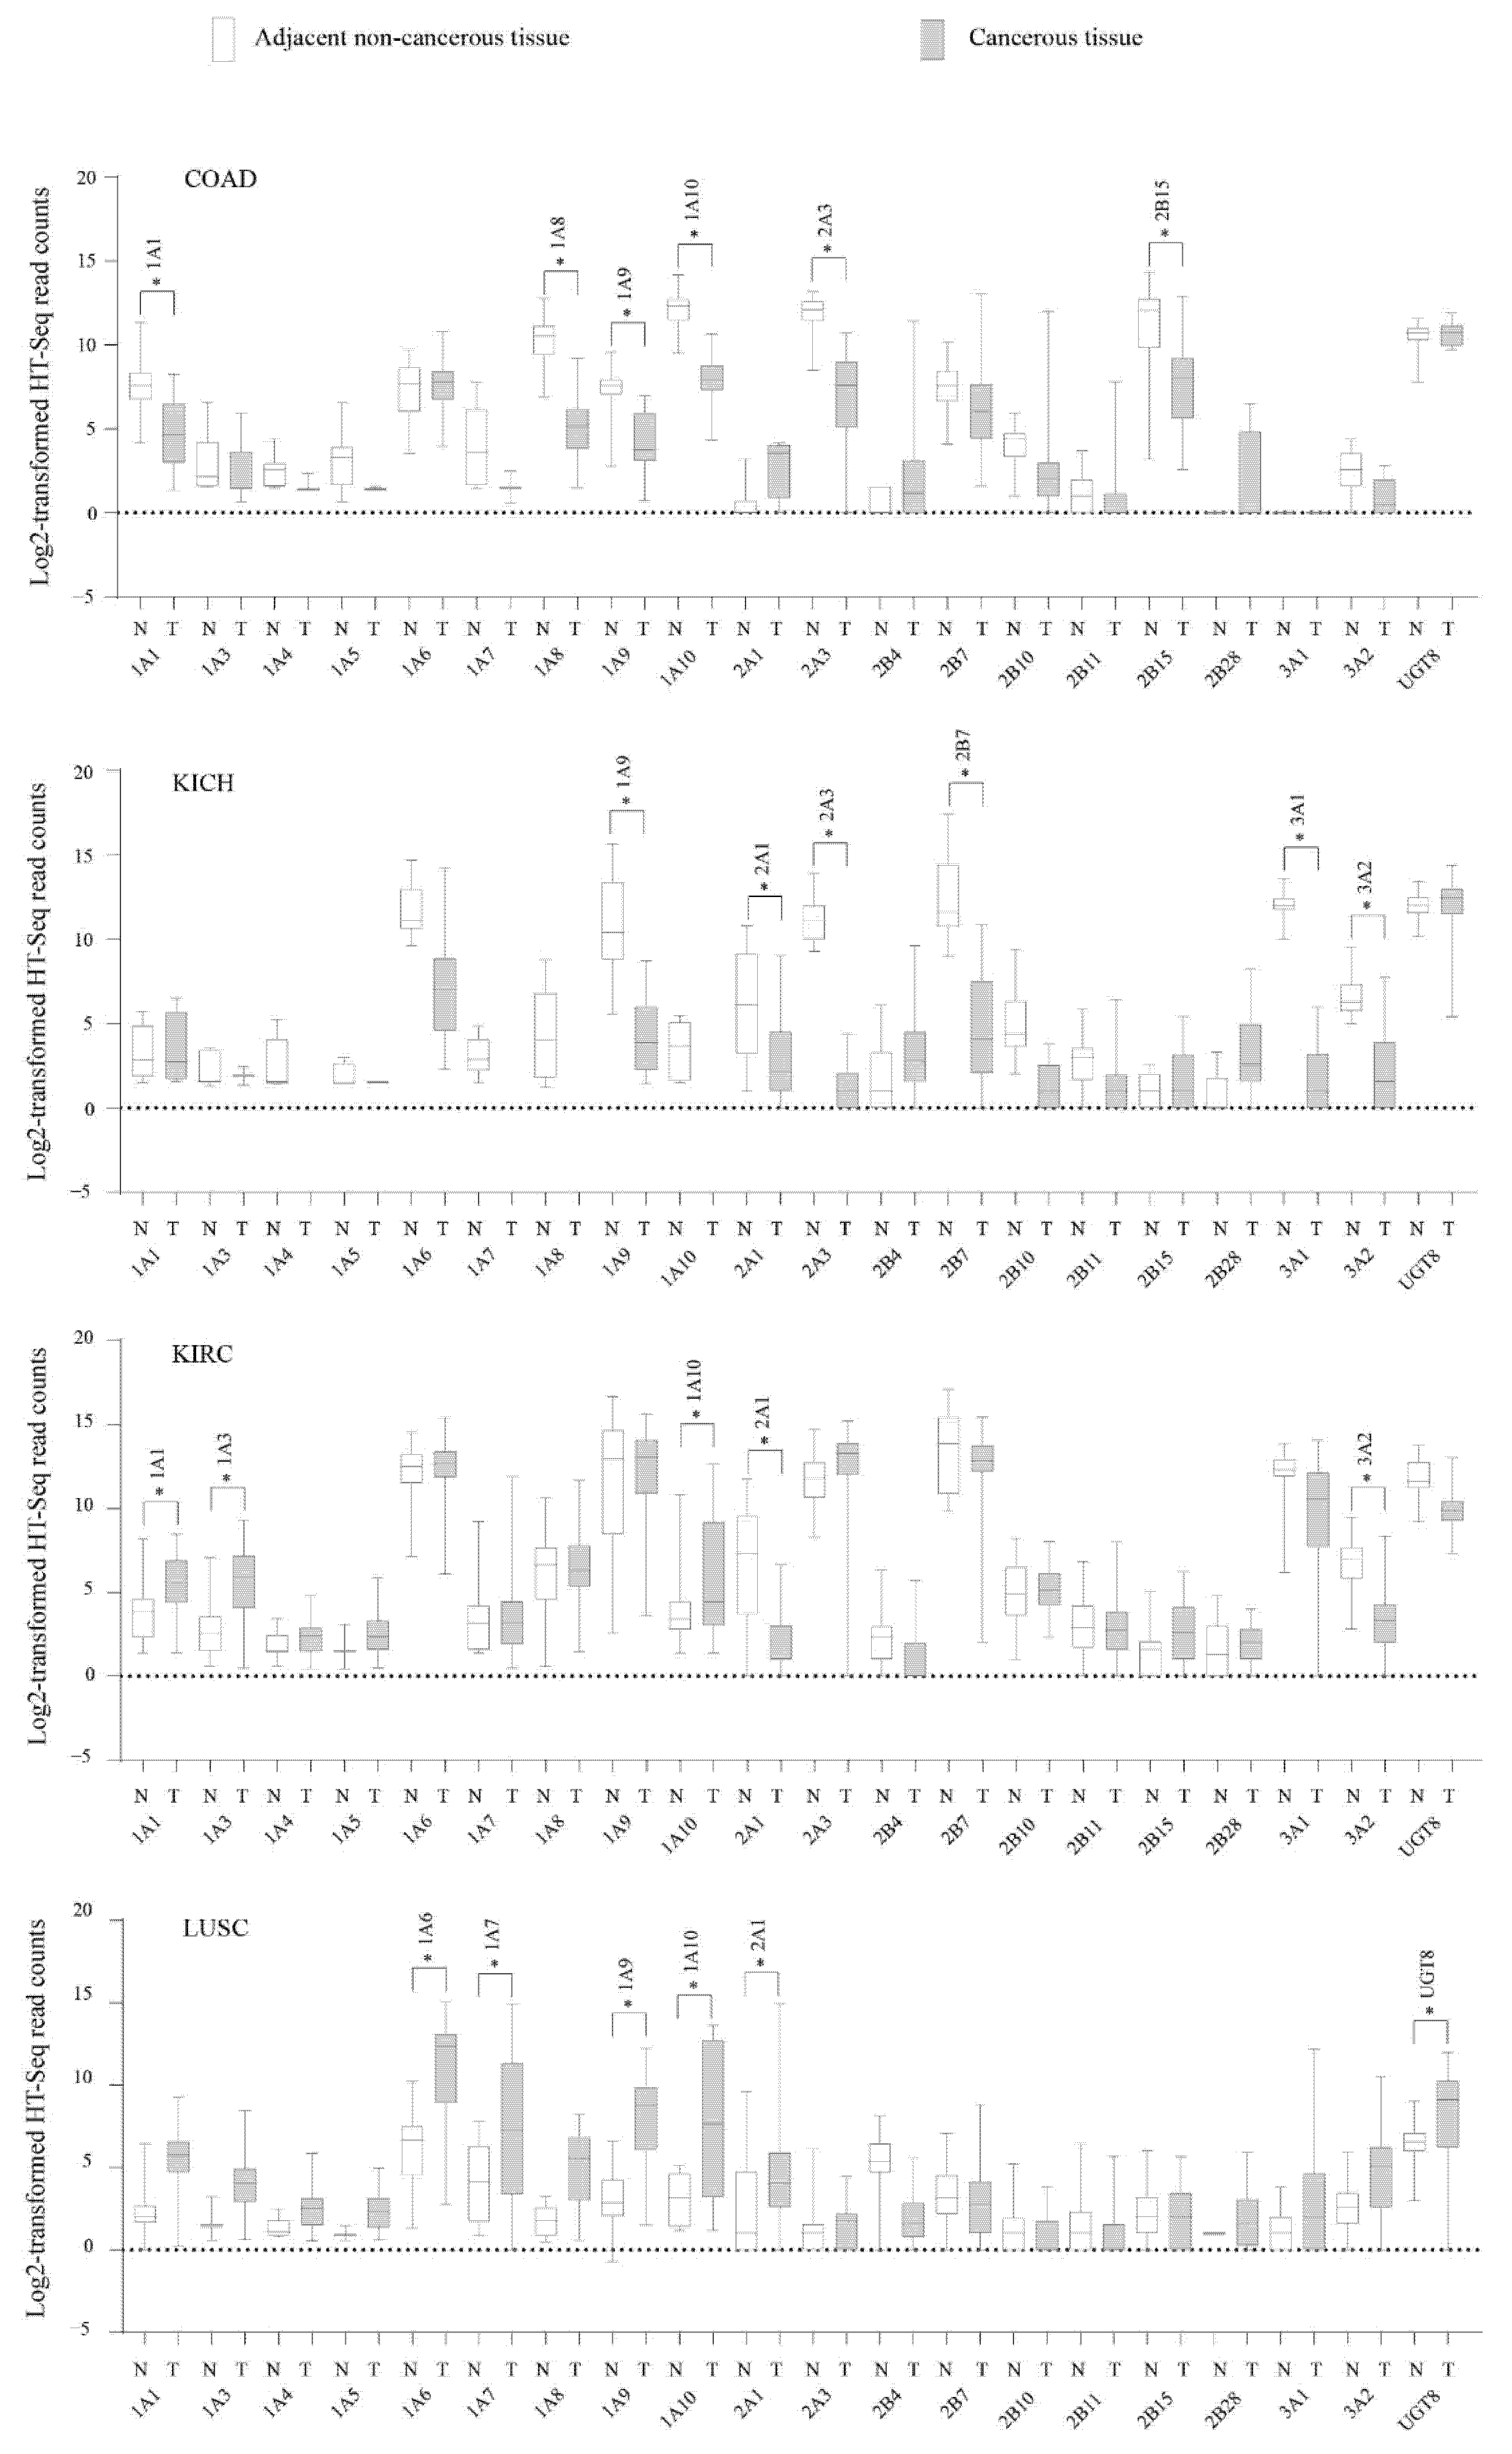
3.3. Deregulation of UGT Genes in Human Cancers

To examine the deregulation of UGT genes in cancers, we compared the expression levels of UGT genes between matched cancerous and adjacent non-cancerous tissues in 611 patients from 12 different cancer types where these data were available (Tables S3 and S4). Among the 20 UGT genes assessed, only 4 (1A4, 1A5, 2B10, 2B28) showed no deregulation in any cancer. The other 16 UGT genes were either upregulated or downregulated in at least 1 cancer type (Table 2). Among these genes, 8 were upregulated (1A3, 1A6, 1A7, UGT8) or downregulated (1A8, 2A3, 3A2, 2B7) consistently in at least 2 cancer types, and 5 genes (1A1, 1A9, 1A10, 2A1, 2B15) showed upregulation in some cancers but downregulation in other cancer types. For example, UGT2A1 was downregulated in 4 cancers (HNSC, KICH, KIRC, KIRP) but upregulated in LUSC. Of the 12 UGT genes that were highly expressed in LIHC (described above), only UGT2B11 showed downregulation in this cancer. Consistent with its low expression in the normal liver [44], UGT1A10 was barely expressed in non-cancerous liver tissues; however, it was significantly upregulated in LIHC (Figure S5).
Using the Oncomine platform as described in detail in Section 2, we analysed six non-TCGA cancer datasets that reported genome-wide differential gene expression analysis using DNA microarrays. Our results showed consistent findings for nearly half (15/37) of the significant gene deregulation patterns identified in the TCGA cancer datasets (Table 2). In TCGA COAD, 6 UGT genes (1A1, 1A8, 1A9, 1A10, 2A3, 2B15) were downregulated (Figure 3); all of these genes except UGT1A10 were also downregulated in the Kaiser colon cancer dataset [51] (Table 2). In TCGA LUSC, 6 UGT genes were upregulated (Figure 3), 3 of these genes (1A6, 1A9, UGT8) were also upregulated in the Hou lung cancer dataset (Table 2) [50]. In TCGA KICH, 6 UGT genes (1A9, 2A1, 2A3, 2B7, 3A1, 3A2) were downregulated (Figure 3); 2 of which (2A1, 2A3) were also downregulated in the Jones renal cancer dataset (Table 2) [53]. In TCGA KIRC, 3 UGT genes (1A1, 1A3, 1A10) were upregulated and 2 UGT genes (2A1, 3A2) were downregulated (Figure 3). The downregulation of UGT2A1 was also seen in the Jones Renal cancer dataset [53] (Table 2).

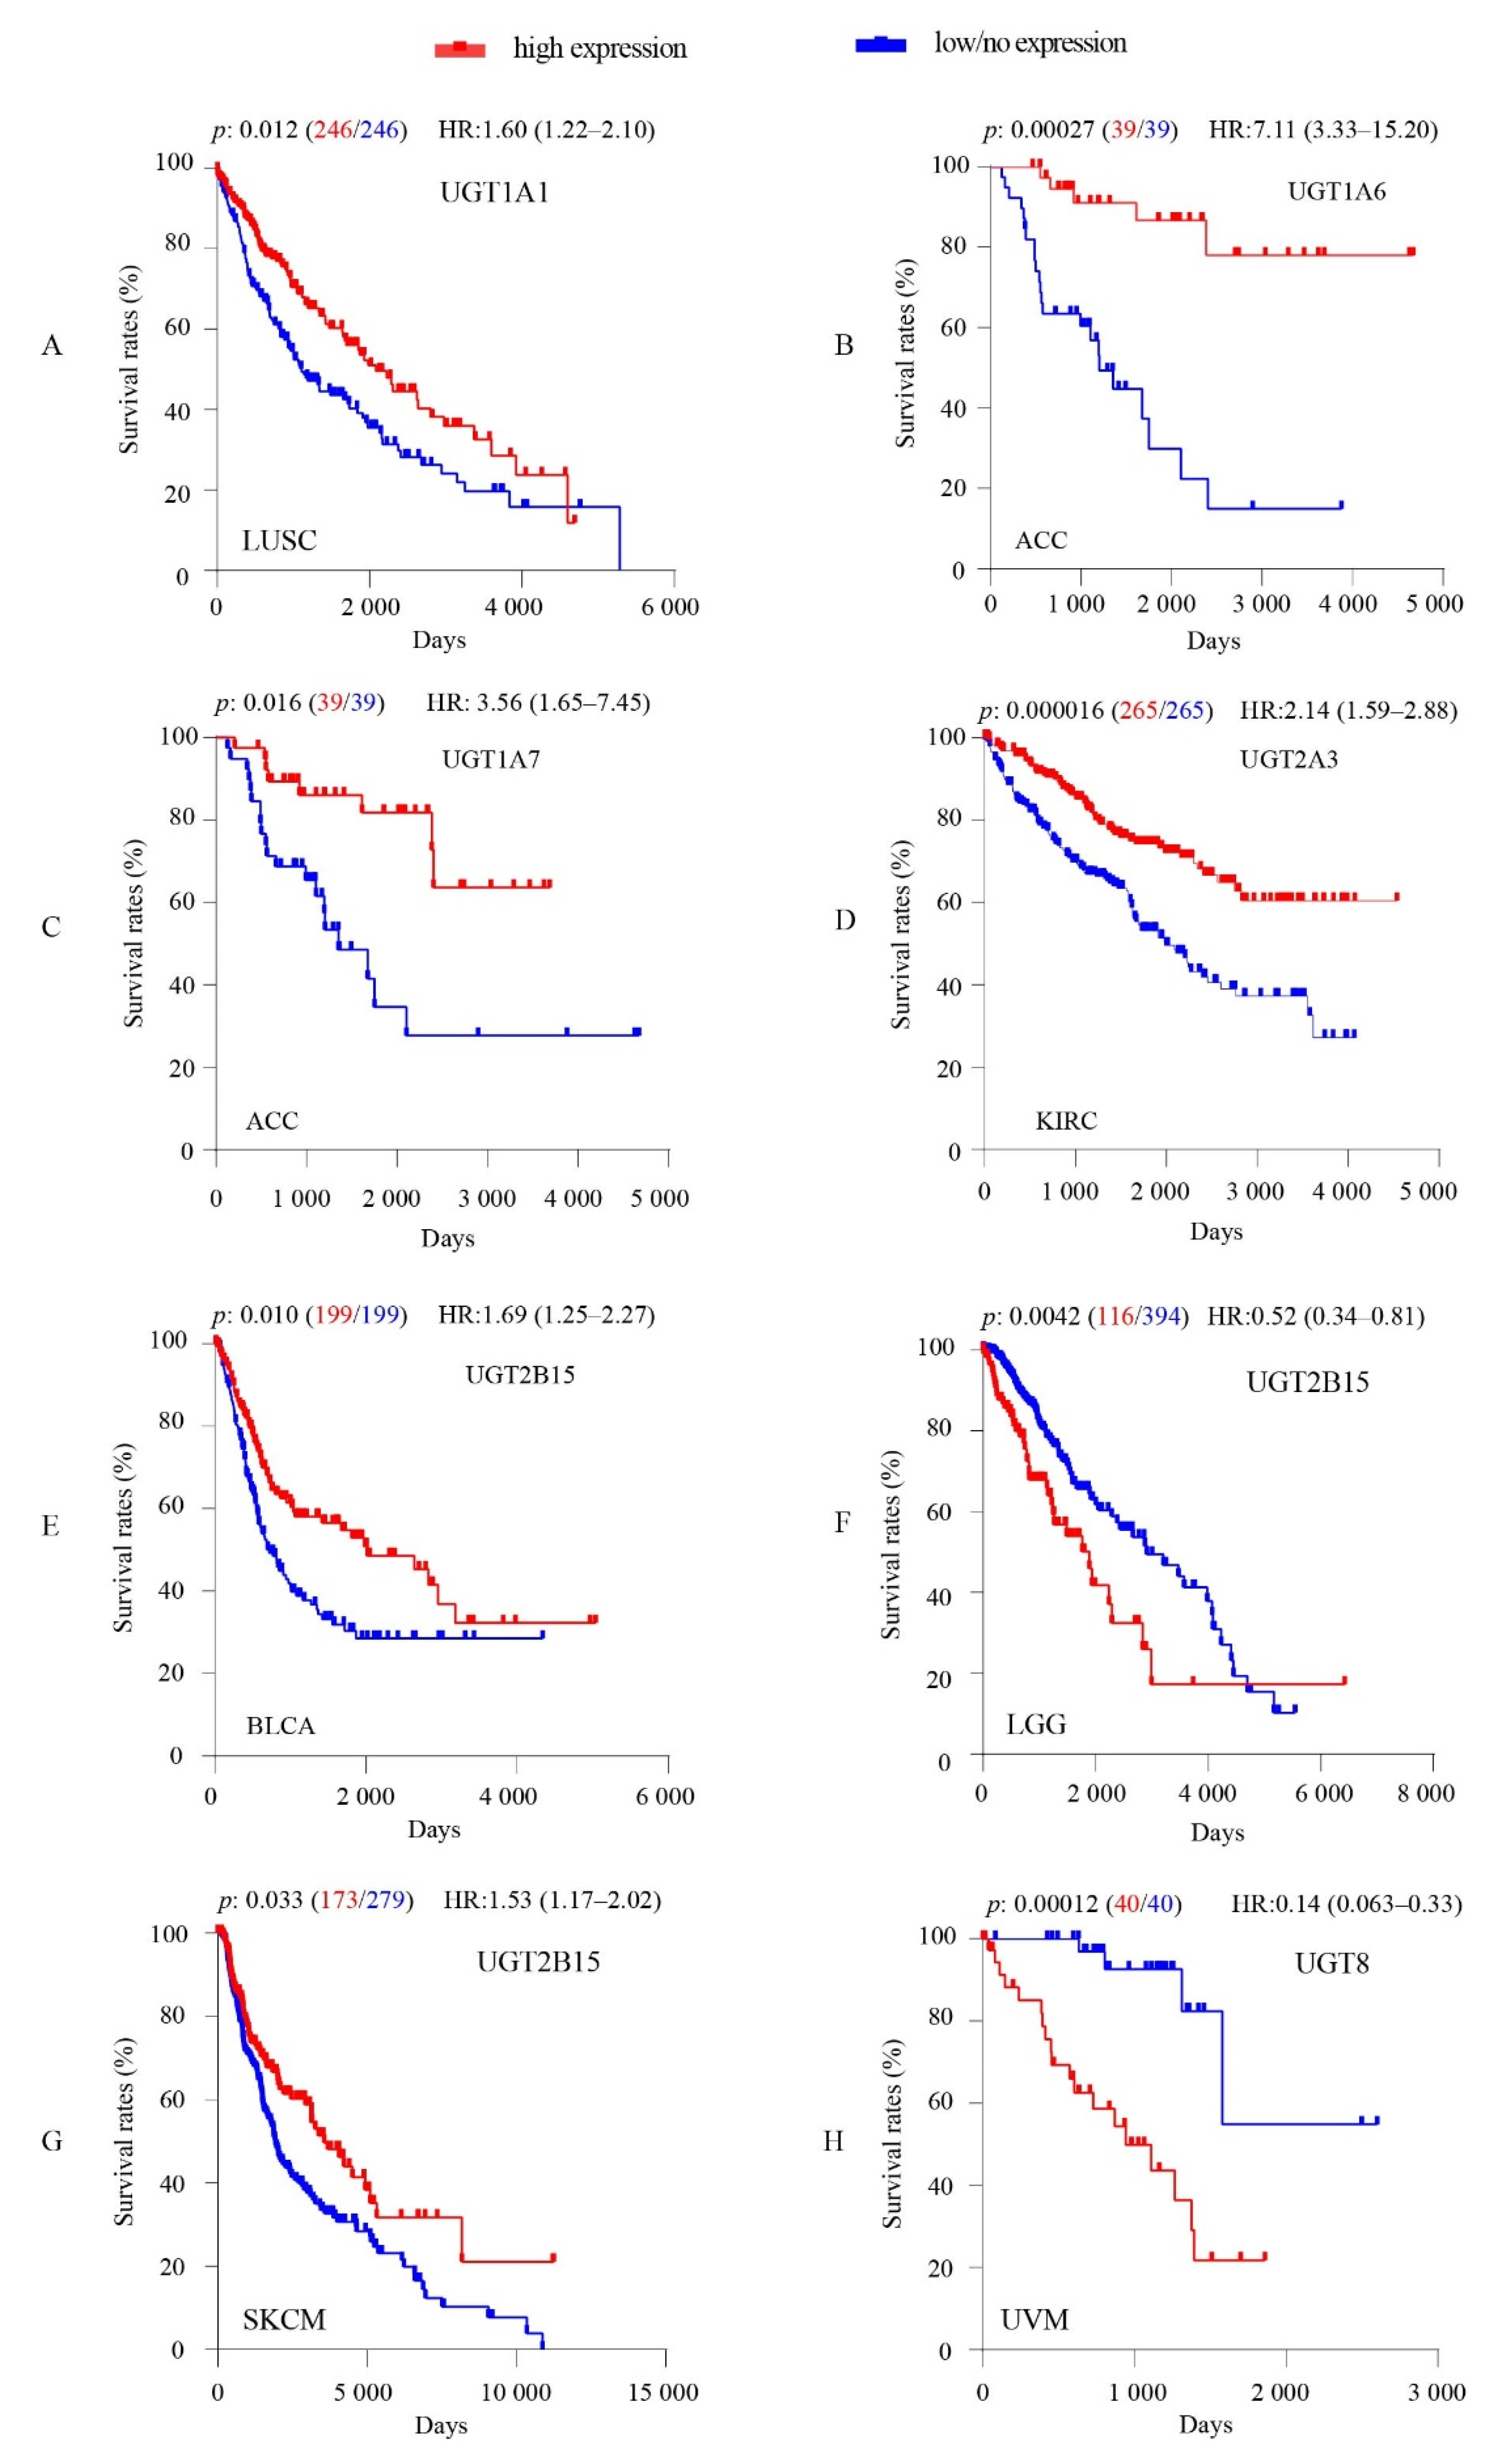
3.4. Associations between Intratumoral UGT Expression Levels and Overall Survival of Cancer Patients

Using Kaplan–Meier plots and logrank tests followed by Bonferroni multiple corrections, we assessed the potential association of the intratumoral expression levels of UGT genes with overall survival (OS) rates in each of the 33 TCGA cancer types (Table S2). Overall, our results showed that the expression levels of 6 UGT genes (1A1, 1A6, 1A7, 2A3, 2B15, UGT8) were significantly associated with OS rates in at least one cancer type (Figure 4). Of these genes, four showed significant association with increased OS rates (favourable survival), namely (1) UGT1A1 in LUSC (Figure 4A), (2) UGT1A6 in ACC (Figure 4B), (3) UGT1A7 in ACC (Figure 4C), and (4) UGT2A3 in KIRC (Figure 4D). UGT8 was significantly associated with decreased OS rates (unfavourable survival) in UVM (Figure 4H). UGT2B15 showed significant association with increased OS rates in BLCA and SKCM) (Figure 4E,G) but decreased OS rates in LGG (Figure 4F).

4. Discussion

We recently analysed the RNAseq data from the Human Protein Atlas [55] (https://www.proteinatlas.org, accessed on 10 January 2019) and the Genotype-Tissue Expression (GTEx) project [56] and reported the expression profiles of all 22 UGT genes in a panel of 43 normal human tissues [44]. This demonstrated that many UGT genes that have been traditionally associated with liver or other detoxifying tissues, in fact, have complex body-wide expression patterns. As an example, seven UGTs (1A1, 1A6, 1A10, 2B7, 2B15, 2B17, and UGT8) showed expression in more than 20 different tissues [44]. This widespread expression supports an important role for UGTs in intra-tissular drug/xenobiotic exposure, as well as controlling endogenous lipophilic metabolites and signaling molecules. These roles may also contribute to the systemic clearance of UGT substrates. UGT expression within tumors derived from various tissues could similarly affect intratumoral drug exposure, as well as levels of endogenous growth-regulatory chemicals. In the present study, we analysed the RNAseq data of 9514 cancer patients from the TCGA project, allowing us to characterize the expression profiles of 20 UGT genes in 33 different cancer types.
Overall, UGT genes exhibited cancer-specific expression profiles and high interindividual variabilities within cancer cohorts. Four (1A6, 1A10, 2B7, UGT8) of the aforementioned seven UGT genes that are widely expressed in normal tissues were also highly expressed in more than five different cancer types (Figure 2). Notably, UGT8 and UGT1A6 showed high expression in 18 and 13 different cancer types, respectively. A total of 25 cancer types (BLCA, CESC, CHOL, COAD, DLBC, ESCA, GBM, HNSC, KICH, KIRC, KIRP, LGG, LIHC, LUAD, LUSC, OV, PAAD, READ, SKCM, STAD, TGCT, STAD, THCA, THYM, UCS) highly expressed at least 1 UGT gene. Previous studies have shown high expression of UGT genes in drug-metabolizing tissues (e.g., liver, kidney, colon) [20,22,23,27,30,33]. Consistently, we found abundant expression of similar UGT genes in cancers that are derived from drug-metabolizing tissues (LIHC, KIRC/KIRP, COAD) (Figure 1). For example, 12 UGT genes were abundantly expressed in liver cancer (LIHC) in accordance with their high expression in the normal liver. The present study represents the first to comprehensively assess the expression profiles of UGT genes in nearly 30 different cancers derived from non-drug-metabolizing tissues. Collectively, our results demonstrate widespread expression profiles of UGT genes in human cancers, implying active metabolism of UGT substrates within the tumors that are derived from not only drug-metabolizing tissues but also non-drug-metabolizing tissues.
Deregulation of UGT genes have been previously reported in cancers that are derived from drug-metabolizing organs (LIHC [31,32], KIRC [20], COAD [7,33,34], STAD [35,36]). In the present study, we compared the expression of UGT genes between matched cancerous and non-cancerous tissues of 611 TCGA patients in 6 cancers derived from drug-metabolizing tissues (COAD, KICH, KIRC, KIRP, LIHC, STAD) and another six cancers derived from non-drug-metabolizing tissues (BRCA, HNSC, LUAD, LUSC, PRAD, THCA). Overall, we found 16 UGT genes (1A1, 1A3, 1A6, 1A7, 1A8, 1A9, 1A10, 2A1, 2A3, 2B4, 2B7, 2B11, 2B15, 3A1, 3A2, 8) that were up/down-regulated in at least 1 cancer type (Table 2). Nearly half of these up/downregulated UGT genes were consistent with the observations from the aforementioned studies or corroborated by other microarray-based gene expression profiling studies [48,49,50,51,52,53]. UGT enzymes are involved in the inactivation of procarcinogens and carcinogens, and hence their downregulation may represent a putative early event in carcinogenesis as previously suggested [7,32,33,35]. It is also possible that UGT down-regulation may be a late event linked to cellular de-differentiation in advanced cancers. Further analysis of UGT expression by cancer stage may help to tease out such possibilities. On the other hand, upregulation of UGT genes may be related to anticancer drug resistance, as discussed below.
Given that intratumoural UGT expression could enhance the inactivation of anticancer drugs and cancer-growth modulating molecules (e.g., steroids, lipids, fatty acids), it may be predicted to impact cancer progression and patient survival. Indeed, clinical and pre-clinical studies have shown that overexpression of specific UGTs can promote resistance to anticancer drugs that they metabolize [57,58,59,60,61,62,63]. In the present study, Kaplan–Meier survival analysis of 9145 patients from 33 different TCGA cancer types identified significant associations of intratumoral expression levels of UGT genes with overall survival rates in seven different cancer types, namely LUSC (1A1), ACC (1A6, 1A7), BLCA (2B15), KIRC (2A3), LGG (2B15), SKCM (2B15), and UVM (UGT8) (Figure 4). Of note, the associations of UGT1A1, UGT2B15, and UGT2A3 with favourable OS rates in LUSC [41], BLCA [41], and KIRC [55], respectively, were recently reported. As discussed in detail below, the inactivation of anticancer drugs within the tumor through the UGT conjugation pathway can reduce therapeutic efficacy and patient survival. Analysis of drug regimens received by TCGA patients could test this hypothesis. Therefore, we obtained drug regimen data for these seven TCGA cancer types from NCI Genomic Data Commons (https://gdc.cancer.gov/, accessed on 10 June 2021) (Table S5). Unfortunately, because drug regimens were only available for a small proportion of patients for these seven cancer types, we were not able to assess whether the observed association of UGTs with OS rates could be related to intratumoral inactivation of anticancer drugs.
Interestingly, our data show that high UGT levels were frequently correlated with increased OS rates (Figure 4). These findings are consistent with recent reports for other drug-metabolizing enzymes (e.g., CYPs, NAT1) [41], and support a hypothesis that intratumoral expression of UGTs and other drug-metabolizing enzymes can impact cancer patient survival through not only drug metabolism but also metabolism of numerous endogenous bioactive molecules (e.g., steroid hormones, amino acids, fatty acids, bile acids) that can modulate cancer growth as briefly discussed below.
Androgens are known to promote bladder cancer (BLCA) development and progression [64,65,66]. The two most potent natural androgens (testosterone and dihydrotestosterone) are primarily inactivated by UGT2B15 and UGT2B17 [67]. Our observed association of high UGT2B15 levels with increased OS rates in BLCA (Figure 4) might be attributable to its intratumoral glucuronidation of androgens within the tumour as recently suggested [41]. Unfortunately, UGT2B17 data were not available for analysis within the TCGA dataset. We also showed an association of UGT2B15 with increased OS rates in SKCM or decreased OS rates in LGG (Figure 4); however, the underlying mechanisms remains unknown.
Adrenocortical carcinoma (ACC) is a very rare malignancy that originates in the cortex of the adrenal gland, and patients with ACC often have poor clinical outcomes [68]. Surgery remains the only curative treatment for patients with ACC, and mitotane is the most effective drug in adjuvant chemotherapy of ACC or in inoperable ACC [69]. There is no evidence that mitotane and its two activate metabolites [1,1-(o,p’-dichlorodiphenyl)-2,2 dichloroethene (o,p’-DDE), 1,1-(o,p’-dichlorodiphenyl) acetic acid (o,p’-DDA) ] are substrates of any UGT [70]. Some patients with ACC have increased levels of steroid hormones and mineralocorticoids, and they tend to show hypercortisolism and hyperandrogenism [68]. ACC showed moderate expression of UGT1A6 and UGT1A7 but low/no expression of other UGT genes (Figure S2). Our observed association of high levels of UGT1A6 or UGT1A7 with increased OS rates might be related to their intratumoral inactivation and clearance of endogenous bioactive molecules, such as the aforementioned steroid hormones. This hypothesis remains to be investigated.
We showed a significant association of high UGT8 expression with poor OS rates in Uveal Melanoma (UVM) (Figure 4H). UVM originates from melanocytes within the uveal tract and is the second most common melanoma subtype after cutaneous melanoma [71]. Primary UVM is treated with surgery and radiation; however, remote metastasis (most often in the liver) occurs in nearly 50% of the patients with a very poor prognosis [72]. A 10-gene signature (SIRT3, HMCES, SLC44A3, TCTN1, STPG1, POMGNT2, RNF208, ANXA2P2, ULBP1, CA12) that predicts prognosis for this disease has been recently reported [73]. Further studies are warranted to determine whether UGT8 may be a useful prognostic biomarker for UVM. The mechanism by which UGT8 could influence UVM is currently speculative. UGT8 galactosidates bile acids [74] and ceramide [75]. The later reaction generates galactosylceramide (GalCer), which can be further converted into sufatide [76]. Ceramides are critical regulators of survival and drug resistance in melanoma, hence UGT8 might control UVM outcomes via modulation of ceramide levels [77]. In support of this notion, UGT8 overexpression was recently shown to promote basal-like breast cancer (BLBC) cell proliferation and invasion through production of GalCer and sufatide [78,79]. Although Cao et al. recently showed an association between high intratumoral UGT8 levels and poor survival in BLBC [79], no association was observed in our analysis of the TCGA BRCA dataset as a whole (1080 patients) or the basal subtype (179 patients) (data not shown).
The findings of the current study could provide impetus for future translational UGT research. The potential for such translation is supported by numerous clinical and pre-clinical studies. For example, our findings of high interindividual expression variability and deregulation of UGT genes within specific cancer types may be relevant to intratumoral exposure of anticancer drugs that are primarily metabolized through UGT conjugation. In support of this idea, pre-clinical and clinical studies have shown that high intratumoral expression of several UGT genes (e.g., 1A1, 1A6, 2B7, 2B17) contributed to de novo or acquired resistance to various anticancer drugs [39,60,80]. These findings, together with observations in the present study, suggest that assessing intratumoral UGT activity could help to achieve optimal personalized anticancer therapy. Moreover, our observed associations of intratumoral UGT expression with patient survival highlight their potential as prognostic biomarkers. In addition to the data shown here that assessed OS within 33 TCGA cancer types, other studies have reported the prognostic value of various UGTs in specific subsets of cancer patients [6,38,39,75]. For example, previous work shows that UGT2B17 and UGT2B28 are overexpressed in advanced and metastatic prostate cancer and associate with poor outcomes [6,81,82,83]. Pre-clinical studies in mouse xenograft models show that UGT2B17 overexpression promotes androgen-independent tumor progression via a pathway that may involve tyrosine-protein kinase Src [82]. UGT2B17 is also prognostic in chronic lymphocytic leukaemia (CLL), where high expression is associated with shorter treatment-free and overall survival primarily through its intracellular inactivation of anti-leukaemic drugs such as fludarabine [39]. In addition, we have shown that UGT2B15 and UGT2B17 are prognostic in specific molecular subtypes of breast cancer as defined by the METABRIC (Molecular Taxonomy of Breast Cancer International Consortium) project [84]. Based on these previous studies and the new data presented herein, we suggest that future work could focus on developing selected UGTs as clinically actionable biomarkers and/or therapeutic targets for new drug discovery.

5. Conclusions

In conclusion, the present study reported the unique expression profiles of UGT genes in 33 TCGA cancer types and identified the patterns of UGT deregulation in 12 TCGA cancer types. We further identified the UGT genes whose intratumoral expression was significantly associated with overall survival. Collectively, our results provide compelling evidence for the active metabolism of UGT substrates within tumors, and support further interrogation of UGT genes as potential prognostic biomarkers and therapeutic targets. Intratumoral UGT activity can influence cancer progression and patient survival not only through drug metabolism but also through the inactivation of numerous endogenous bioactive molecules that can modulate cancer growth.

Supplementary Materials

The following are available online at https://www.mdpi.com/article/10.3390/cancers13174491/s1, Figure S1: The expression profiles of UGT genes in 10 different types of TCGA cancers; Figure S2: The expression profiles of UGT genes in 17 different types of TCGA cancers; Figure S3: The expression profiles of 12 UGT genes in 33 different types of TCGA cancers; Figure S4: The expression profiles of UGT3A genes in 33 different types of TCGA cancers; Figure S5: Expression of UGT genes in matched cancerous (T) and adjacent non-cancerous (N) tissues in 8 different TCGA cancer types; Table S1: The expression levels (normalized RSEM values) of UGT genes and clinical datasets of 9514 patients from 33 different types of TCGA cancers; Table S2: The expression levels (means, medians, standard deviations) of UGT genes and assessment of their associations with overall survival rates in 33 different TCGA cancer types; Table S3: HT-seq counts for UGT genes in matched tumor and adjacent non-cancerous tissues for 611 patients from 12 different TCGA cancer types; Table S4: Differential gene expression analysis of 611 patients from 12 TCGA cancer types using DESeq2 revealed the UGT genes that were deregulated in these cancers; Table S5: Drug regimens of 7 TCGA cancer types.

Author Contributions

Conceptualization, D.G.H., R.M., P.I.M.; data acquisition, analysis, and presentation, D.G.H., S.M.; writing—original draft preparation, D.G.H.; writing—review and editing, D.G.H., R.M., R.A.M., P.I.M., J.-A.H., S.M. All authors have read and agreed to the published version of the manuscript.

Funding

This research was funded by The National Health and Medical Research Council (NHMRC) of Australia Grant ID 1143175 (R.M., R.A.M, P.I.M., D.G.H.). The project was also supported by funding from the Flinders Medical Centre Foundation.

Institutional Review Board Statement

Not applicable.

Informed Consent Statement

Not applicable.

Data Availability Statement

For analysis of gene expression profiles, RNASeq data (RSEM) were obtained from the TCGA Firehose database (http://gdac.broadinstitute.org) and the PanCanAtlas database (https://gdc.cancer.gov/about-data/publicatio ns/pancanatlase, accessed on 20 June 2021). For gene differential expression analysis, RNAseq data (HT-seq counts) were obtained from the TCGA legacy database using the “TCGAbiolinks” R package (https://bioconductor.org/packages/release/bioc/html/TCGAbiolinks.html). The survival data of TCGA patients were obtained from the PanCanAtlas database (https://gdc.cancer.gov/about-data/publications/pancanatlas).

Conflicts of Interest

The authors declare no conflict of interest.

References

  1. Mackenzie, P.I.; Bock, K.W.; Burchell, B.; Guillemette, C.; Ikushiro, S.-I.; Iyanagi, T.; Miners, J.O.; Owens, I.S.; Nebert, D.W. Nomenclature update for the mammalian UDP glycosyltransferase (UGT) gene superfamily. Pharmacogenet. Genom. 2005, 15, 677–685. [Google Scholar] [CrossRef]
  2. Guillemette, C.; Lévesque, É.; Harvey, M.; Bellemare, J.; Ménard, V. UGT genomic diversity: Beyond gene duplication. Drug Metab. Rev. 2009, 42, 24–44. [Google Scholar] [CrossRef] [PubMed]
  3. Meech, R.; Hu, D.G.; McKinnon, R.; Mubarokah, S.N.; Haines, A.Z.; Nair, P.; Rowland, A.; Mackenzie, P. The UDP-Glycosyltransferase (UGT) Superfamily: New Members, New Functions, and Novel Paradigms. Physiol. Rev. 2019, 99, 1153–1222. [Google Scholar] [CrossRef] [PubMed]
  4. MacKenzie, P.I.; Owens, I.S.; Burchell, B.; Bock, K.W.; Bairoch, A.; Belanger, A.; Fournel-Gigleux, S.; Green, M.; Hum, D.W.; Iyanagi, T.; et al. The UDP glycosyltransferase gene superfamily: Recommended nomenclature update based on evolutionary divergence. Pharmacogenetics 1997, 7, 255–269. [Google Scholar] [CrossRef] [PubMed]
  5. Tukey, R.H.; Strassburg, C.P. Human UDP-Glucuronosyltransferases: Metabolism, Expression, and Disease. Annu. Rev. Pharmacol. Toxicol. 2000, 40, 581–616. [Google Scholar] [CrossRef] [PubMed]
  6. Belledant, A.; Hovington, H.; Garcia, L.; Caron, P.; Brisson, H.; Villeneuve, L.; Simonyan, D.; Têtu, B.; Fradet, Y.; Lacombe, L.; et al. The UGT2B28 Sex-steroid Inactivation Pathway Is a Regulator of Steroidogenesis and Modifies the Risk of Prostate Cancer Progression. Eur. Urol. 2016, 69, 601–609. [Google Scholar] [CrossRef] [PubMed]
  7. Émond, J.-P.; Labriet, A.; Desjardins, S.; Rouleau, M.; Villeneuve, L.; Hovington, H.; Brisson, H.; Lacombe, L.; Simonyan, D.; Caron, P.; et al. Factors Affecting Interindividual Variability of Hepatic UGT2B17 Protein Expression Examined Using a Novel Specific Monoclonal Antibody. Drug Metab. Dispos. 2019, 47, 444–452. [Google Scholar] [CrossRef]
  8. Milne, A.M.; Burchell, B.; Coughtrie, M.W.H. A Novel Method for the Immunoquantification of UDP-Glucuronosyltransferases in Human Tissue. Drug Metab. Dispos. 2011, 39, 2258–2263. [Google Scholar] [CrossRef] [PubMed] [Green Version]
  9. Kerdpin, O.; Mackenzie, P.I.; Bowalgaha, K.; Finel, M.; Miners, J.O. Influence of N-Terminal Domain Histidine and Proline Residues on the Substrate Selectivities of Human UDP-Glucuronosyltransferase 1A1, 1A6, 1A9, 2B7, and 2B10. Drug Metab. Dispos. 2009, 37, 1948–1955. [Google Scholar] [CrossRef] [PubMed] [Green Version]
  10. Barbier, O.; Lapointe, H.; El Alfy, M.; Hum, D.W.; Bélanger, A. Cellular Localization of Uridine Diphosphoglucuronosyltransferase 2B Enzymes in the Human Prostate by in Situ Hybridization and Immunohistochemistry 1. J. Clin. Endocrinol. Metab. 2000, 85, 4819–4826. [Google Scholar] [CrossRef] [PubMed]
  11. Lévesque, E.; Labriet, A.; Hovington, H.; Allain, E.; Melo-Garcia, L.; Rouleau, M.; Brisson, H.; Turcotte, V.; Caron, P.; Villeneuve, L.; et al. Alternative promoters control UGT2B17-dependent androgen catabolism in prostate cancer and its influence on progression. Br. J. Cancer 2020, 122, 1068–1076. [Google Scholar] [CrossRef] [PubMed]
  12. Paquet, S.; Fazli, L.; Grosse, L.; Verreault, M.; Têtu, B.; Rennie, P.S.; Bélanger, A.; Barbier, O. Differential Expression of the Androgen-Conjugating UGT2B15 and UGT2B17 Enzymes in Prostate Tumor Cells during Cancer Progression. J. Clin. Endocrinol. Metab. 2012, 97, E428–E432. [Google Scholar] [CrossRef] [PubMed] [Green Version]
  13. Grant, D.J.; Chen, Z.; Howard, L.E.; Wiggins, E.; De Hoedt, A.; Vidal, A.C.; Carney, S.T.; Squires, J.; Magyar, C.E.; Huang, J.; et al. UDP-glucuronosyltransferases and biochemical recurrence in prostate cancer progression. BMC Cancer 2017, 17, 463. [Google Scholar] [CrossRef] [PubMed] [Green Version]
  14. Achour, B.; Russell, M.R.; Barber, J.; Rostami-Hodjegan, A. Simultaneous Quantification of the Abundance of Several Cytochrome P450 and Uridine 5′-Diphospho-Glucuronosyltransferase Enzymes in Human Liver Microsomes Using Multiplexed Targeted Proteomics. Drug Metab. Dispos. 2014, 42, 500–510. [Google Scholar] [CrossRef]
  15. Fallon, J.K.; Neubert, H.; Goosen, T.; Smith, P.C. Targeted Precise Quantification of 12 Human Recombinant Uridine-Diphosphate Glucuronosyl Transferase 1A and 2B Isoforms Using Nano-Ultra-High-Performance Liquid Chromatography/Tandem Mass Spectrometry with Selected Reaction Monitoring. Drug Metab. Dispos. 2013, 41, 2076–2080. [Google Scholar] [CrossRef] [Green Version]
  16. Fallon, J.K.; Neubert, H.; Hyland, R.; Goosen, T.C.; Smith, P.C. Targeted quantitative proteomics for the analysis of 14 UGT1As and -2Bs in human liver using NanoUPLC-MS/MS with selected reaction monitoring. J. Proteome Res. 2013, 12, 4402–4413. [Google Scholar] [CrossRef]
  17. Sato, Y.; Nagata, M.; Kawamura, A.; Miyashita, A.; Usui, T. Protein quantification of UDP-glucuronosyltransferases 1A1 and 2B7 in human liver microsomes by LC-MS/MS and correlation with glucuronidation activities. Xenobiotica 2012, 42, 823–829. [Google Scholar] [CrossRef]
  18. Sato, Y.; Nagata, M.; Tetsuka, K.; Tamura, K.; Miyashita, A.; Kawamura, A.; Usui, T. Optimized Methods for Targeted Peptide-Based Quantification of Human Uridine 5′-Diphosphate-Glucuronosyltransferases in Biological Specimens Using Liquid Chromatography–Tandem Mass Spectrometry. Drug Metab. Dispos. 2014, 42, 885–889. [Google Scholar] [CrossRef] [Green Version]
  19. Sridar, C.; Hanna, I.; Hollenberg, P.F. Quantitation of UGT1A1 in human liver microsomes using stable isotope-labelled peptides and mass spectrometry based proteomic approaches. Xenobiotica 2012, 43, 336–345. [Google Scholar] [CrossRef]
  20. Margaillan, G.; Rouleau, M.; Fallon, J.K.; Caron, P.; Villeneuve, L.; Turcotte, V.; Smith, P.C.; Joy, M.S.; Guillemette, C. Quantitative Profiling of Human Renal UDP-glucuronosyltransferases and Glucuronidation Activity: A Comparison of Normal and Tumoral Kidney Tissues. Drug Metab. Dispos. 2015, 43, 611–619. [Google Scholar] [CrossRef] [Green Version]
  21. Court, M.H.; Duan, S.X.; Von Moltke, L.L.; Greenblatt, D.J.; Patten, C.J.; Miners, J.O.; Mackenzie, P. Interindividual variability in acetaminophen glucuronidation by human liver microsomes: Identification of relevant acetaminophen UDP-glucuronosyltransferase isoforms. J. Pharmacol. Exp. Ther. 2001, 299, 998–1006. [Google Scholar] [PubMed]
  22. Court, M.H.; Zhang, X.; Ding, X.; Yee, K.K.; Hesse, L.M.; Finel, M. Quantitative distribution of mRNAs encoding the 19 human UDP-glucuronosyltransferase enzymes in 26 adult and 3 fetal tissues. Xenobiotica 2011, 42, 266–277. [Google Scholar] [CrossRef] [PubMed]
  23. Izukawa, T.; Nakajima, M.; Fujiwara, R.; Yamanaka, H.; Fukami, T.; Takamiya, M.; Aoki, Y.; Ikushiro, S.-I.; Sakaki, T.; Yokoi, T. Quantitative Analysis of UDP-Glucuronosyltransferase (UGT) 1A and UGT2B Expression Levels in Human Livers. Drug Metab. Dispos. 2009, 37, 1759–1768. [Google Scholar] [CrossRef] [PubMed] [Green Version]
  24. Nakamura, A.; Nakajima, M.; Yamanaka, H.; Fujiwara, R.; Yokoi, T. Expression of UGT1A and UGT2B mRNA in Human Normal Tissues and Various Cell Lines. Drug Metab. Dispos. 2008, 36, 1461–1464. [Google Scholar] [CrossRef] [PubMed] [Green Version]
  25. Nishimura, M.; Naito, S. Tissue-Specific mRNA Expression Profiles of Human Phase I Metabolizing Enzymes Except for Cytochrome P450 and Phase II Metabolizing Enzymes. Drug Metab. Pharmacokinet. 2006, 21, 357–374. [Google Scholar] [CrossRef]
  26. Ohno, S.; Nakajin, S. Determination of mRNA Expression of Human UDP-Glucuronosyltransferases and Application for Localization in Various Human Tissues by Real-Time Reverse Transcriptase-Polymerase Chain Reaction. Drug Metab. Dispos. 2009, 37, 32–40. [Google Scholar] [CrossRef] [Green Version]
  27. Schaefer, O.; Ohtsuki, S.; Kawakami, H.; Inoue, T.; Liehner, S.; Saito, A.; Sakamoto, A.; Ishiguro, N.; Matsumaru, T.; Terasaki, T.; et al. Absolute Quantification and Differential Expression of Drug Transporters, Cytochrome P450 Enzymes, and UDP-Glucuronosyltransferases in Cultured Primary Human Hepatocytes. Drug Metab. Dispos. 2011, 40, 93–103. [Google Scholar] [CrossRef] [Green Version]
  28. Rouleau, M.; Tourancheau, A.; Girard-Bock, C.; Villeneuve, L.; Vaucher, J.; Duperré, A.-M.; Audet-Delage, Y.; Gilbert, I.; Popa, I.; Droit, A.; et al. Divergent Expression and Metabolic Functions of Human Glucuronosyltransferases through Alternative Splicing. Cell Rep. 2016, 17, 114–124. [Google Scholar] [CrossRef] [Green Version]
  29. Tourancheau, A.; Margaillan, G.; Rouleau, M.; Gilbert, I.; Villeneuve, L.; Lévesque, E.; Droit, A.; Guillemette, C. Unravelling the transcriptomic landscape of the major phase II UDP-glucuronosyltransferase drug metabolizing pathway using targeted RNA sequencing. Pharm. J. 2015, 16, 60–70. [Google Scholar] [CrossRef] [Green Version]
  30. Tourancheau, A.; Rouleau, M.; Guauque-Olarte, S.; Villeneuve, L.; Gilbert, I.; Droit, A.; Guillemette, C. Quantitative profiling of the UGT transcriptome in human drug-metabolizing tissues. Pharm. J. 2017, 18, 251–261. [Google Scholar] [CrossRef] [Green Version]
  31. Hu, D.G.; Marri, S.; McKinnon, R.A.; MacKenzie, P.I.; Meech, R. Deregulation of the Genes that Are Involved in Drug Absorption, Distribution, Metabolism, and Excretion in Hepatocellular Carcinoma. J. Pharmacol. Exp. Ther. 2019, 368, 363–381. [Google Scholar] [CrossRef] [Green Version]
  32. Strassburg, C.P.; Manns, M.P.; Tukey, R.H. Differential down-regulation of the UDP-glucuronosyltransferase 1A locus is an early event in human liver and biliary cancer. Cancer Res. 1997, 57, 2979–2985. [Google Scholar]
  33. Beyerle, J.; Holowatyj, A.N.; Haffa, M.; Frei, E.; Gigic, B.; Schrotz-King, P.; Boehm, J.; Habermann, N.; Stiborova, M.; Scherer, D.; et al. Expression Patterns of Xenobiotic-Metabolizing Enzymes in Tumor and Adjacent Normal Mucosa Tissues among Patients with Colorectal Cancer: The ColoCare Study. Cancer Epidemiol. Biomarkers Prev. 2020, 29, 460–469. [Google Scholar] [CrossRef]
  34. Yang, W.; Ma, J.; Zhou, W.; Li, Z.; Zhou, X.; Cao, B.; Zhang, Y.; Liu, J.; Yang, Z.; Zhang, H.; et al. Identification of hub genes and outcome in colon cancer based on bioinformatics analysis. Cancer Manag. Res. 2019, 11, 323–338. [Google Scholar] [CrossRef] [Green Version]
  35. Cengiz, B.; Yumrutas, O.; Bozgeyik, E.; Borazan, E.; Igci, Y.Z.; Bozgeyik, I.; Oztuzcu, S. Differential expression of the UGT1A family of genes in stomach cancer tissues. Tumor Biol. 2015, 36, 5831–5837. [Google Scholar] [CrossRef]
  36. Strassburg, C.P.; Nguyen, N.; Manns, M.P.; Tukey, R.H. Polymorphic expression of the UDP-glucuronosyltransferase UGT1A gene locus in human gastric epithelium. Mol. Pharmacol. 1998, 54, 647–654. [Google Scholar]
  37. Hu, D.G.; Mackenzie, P.; McKinnon, R.; Meech, R. Genetic polymorphisms of human UDP-glucuronosyltransferase (UGT) genes and cancer risk. Drug Metab. Rev. 2016, 48, 47–69. [Google Scholar] [CrossRef]
  38. Allain, E.; Rouleau, M.; Vanura, K.; Tremblay, S.; Vaillancourt, J.; Bat, V.; Caron, P.; Villeneuve, L.; Labriet, A.; Turcotte, V.; et al. UGT2B17 modifies drug response in chronic lymphocytic leukaemia. Br. J. Cancer 2020, 123, 240–251. [Google Scholar] [CrossRef]
  39. Gruber, M.; Bellemare, J.; Hoermann, G.; Gleiss, A.; Porpaczy, E.; Bilban, M.; Le, T.; Zehetmayer, S.; Mannhalter, C.; Gaiger, A.; et al. Overexpression of uridine diphospho glucuronosyltransferase 2B17 in high-risk chronic lymphocytic leukemia. Blood 2013, 121, 1175–1183. [Google Scholar] [CrossRef] [Green Version]
  40. Weinstein, J.N.; Collisson, E.A.; Mills, G.B.; Shaw, K.R.M.; Ozenberger, B.A.; Ellrott, K.; Shmulevich, I.; Sander, C.; Stuart, J.M.; The Cancer Genome Atlas Research Network. The Cancer Genome Atlas Pan-Cancer analysis project. Nat. Genet. 2013, 45, 1113–1120. [Google Scholar] [CrossRef]
  41. Hu, D.G.; MacKenzie, P.I.; Nair, P.C.; McKinnon, R.A.; Meech, R. The Expression Profiles of ADME Genes in Human Cancers and Their Associations with Clinical Outcomes. Cancers 2020, 12, 3369. [Google Scholar] [CrossRef] [PubMed]
  42. Liu, J.; Lichtenberg, T.; Hoadley, K.A.; Poisson, L.M.; Lazar, A.J.; Cherniack, A.D.; Kovatich, A.J.; Benz, C.C.; Levine, D.A.; Lee, A.V.; et al. An Integrated TCGA Pan-Cancer Clinical Data Resource to Drive High-Quality Survival Outcome Analytics. Cell 2018, 173, 400–416. [Google Scholar] [CrossRef] [Green Version]
  43. Li, B.; Dewey, C.N. RSEM: Accurate transcript quantification from RNA-Seq data with or without a reference genome. BMC Bioinform. 2011, 12, 323-323. [Google Scholar] [CrossRef] [PubMed] [Green Version]
  44. Hu, D.G.; Hulin, J.-A.; Nair, P.C.; Haines, A.Z.; McKinnon, R.; Mackenzie, P.I.; Meech, R. The UGTome: The expanding diversity of UDP glycosyltransferases and its impact on small molecule metabolism. Pharmacol. Ther. 2019, 204, 107414. [Google Scholar] [CrossRef] [PubMed]
  45. Risso, D.; Schwartz, K.; Sherlock, G.; Dudoit, S. GC-Content Normalization for RNA-Seq Data. BMC Bioinform. 2011, 12, 480. [Google Scholar] [CrossRef] [PubMed] [Green Version]
  46. Love, M.I.; Huber, W.; Anders, S. Moderated estimation of fold change and dispersion for RNA-seq data with DESeq2. Genome Biol. 2014, 15, 550. [Google Scholar] [CrossRef] [PubMed] [Green Version]
  47. Rhodes, D.R.; Kalyana-Sundaram, S.; Mahavisno, V.; Varambally, R.; Yu, J.; Briggs, B.B.; Barrette, T.R.; Anstet, M.J.; Kincead-Beal, C.; Kulkarni, P.; et al. Oncomine 3.0: Genes, Pathways, and Networks in a Collection of 18,000 Cancer Gene Expression Profiles. Neoplasia 2007, 9, 166–180. [Google Scholar] [CrossRef] [PubMed] [Green Version]
  48. Welsh, J.B.; Sapinoso, L.M.; Su, A.I.; Kern, S.G.; Wang-Rodriguez, J.; Moskaluk, C.A.; Frierson, H.F., Jr.; Hampton, G.M. Analysis of gene expression identifies candidate markers and pharmacological targets in prostate cancer. Cancer Res. 2001, 61, 5974–5978. [Google Scholar]
  49. Okayama, H.; Kohno, T.; Ishii, Y.; Shimada, Y.; Shiraishi, K.; Iwakawa, R.; Furuta, K.; Tsuta, K.; Shibata, T.; Yamamoto, S.; et al. Identification of Genes Upregulated in ALK-Positive and EGFR/KRAS/ALK-Negative Lung Adenocarcinomas. Cancer Res. 2012, 72, 100–111. [Google Scholar] [CrossRef] [Green Version]
  50. Hou, J.; Aerts, J.; den Hamer, B.; van Ijcken, W.; den Bakker, M.; Riegman, P.; Van Der Leest, C.; Van Der Spek, P.; Foekens, J.A.; Hoogsteden, H.C.; et al. Gene Expression-Based Classification of Non-Small Cell Lung Carcinomas and Survival Prediction. PLoS ONE 2010, 5, e10312. [Google Scholar] [CrossRef]
  51. Kaiser, S.; Park, Y.-K.; Franklin, J.L.; Halberg, R.B.; Yu, M.; Jessen, W.J.; Freudenberg, J.; Chen, X.; Haigis, K.; Jegga, A.G.; et al. Transcriptional recapitulation and subversion of embryonic colon development by mouse colon tumor models and human colon cancer. Genome Biol. 2007, 8, R131. [Google Scholar] [CrossRef] [Green Version]
  52. Chen, X.; Leung, S.Y.; Yuen, S.T.; Chu, K.-M.; Ji, J.; Li, R.; Chan, A.S.Y.; Law, S.; Troyanskaya, O.G.; Wong, J.; et al. Variation in Gene Expression Patterns in Human Gastric Cancers. Mol. Biol. Cell 2003, 14, 3208–3215. [Google Scholar] [CrossRef] [Green Version]
  53. Jones, J.; Otu, H.; Spentzos, D.; Kolia, S.; Inan, M.; Beecken, W.D.; Fellbaum, C.; Gu, X.; Joseph, M.; Pantuck, A.J.; et al. Gene Signatures of Progression and Metastasis in Renal Cell Cancer. Clin. Cancer Res. 2005, 11, 5730–5739. [Google Scholar] [CrossRef] [Green Version]
  54. Dinse, G.E.; Lagakos, S.W. Nonparametric Estimation of Lifetime and Disease Onset Distributions from Incomplete Observations. Biometrics 1982, 38, 921. [Google Scholar] [CrossRef]
  55. Uhlén, M.; Zhang, C.; Lee, S.; Sjöstedt, E.; Fagerberg, L.; Bidkhori, G.; Benfeitas, R.; Arif, M.; Liu, Z.; Edfors, F.; et al. A pathology atlas of the human cancer transcriptome. Science 2017, 357, eaan2507. [Google Scholar] [CrossRef] [Green Version]
  56. Lonsdale, J.; Thomas, J.; Slavatore, M.; Phillips, R.; Lo, E.; Shad, S.; Hasz, R.; Walters, G.; Garcia, F.; Young, N.; et al. The Genotype-Tissue Expression (GTEx) project. Nat. Genet. 2013, 45, 580–585. [Google Scholar] [CrossRef]
  57. Allain, E.; Rouleau, M.; Lévesque, E.; Guillemette, C. Emerging roles for UDP-glucuronosyltransferases in drug resistance and cancer progression. Br. J. Cancer 2020, 122, 1277–1287. [Google Scholar] [CrossRef] [Green Version]
  58. De Almagro, M.C.; Selga, E.; Thibaut, R.; Porte, C.; Noé, V.; Ciudad, C. UDP-glucuronosyltransferase 1A6 overexpression in breast cancer cells resistant to methotrexate. Biochem. Pharmacol. 2011, 81, 60–70. [Google Scholar] [CrossRef] [Green Version]
  59. Hu, D.G.; MacKenzie, P.I.; Lu, L.; Meech, R.; McKinnon, R.A. Induction of Human UDP-Glucuronosyltransferase 2B7 Gene Expression by Cytotoxic Anticancer Drugs in Liver Cancer HepG2 Cells. Drug Metab. Dispos. 2015, 43, 660–668. [Google Scholar] [CrossRef] [Green Version]
  60. Hu, D.G.; Rogers, A.; Mackenzie, P. Epirubicin Upregulates UDP Glucuronosyltransferase 2B7 Expression in Liver Cancer Cells via the p53 Pathway. Mol. Pharmacol. 2014, 85, 887–897. [Google Scholar] [CrossRef] [Green Version]
  61. Acquaviva, J.; He, S.; Zhang, C.; Jimenez, J.-P.; Nagai, M.; Sang, J.; Sequeira, M.; Smith, N.L.; Ogawa, L.S.; Inoue, T.; et al. FGFR3 Translocations in Bladder Cancer: Differential Sensitivity to HSP90 Inhibition Based on Drug Metabolism. Mol. Cancer Res. 2014, 12, 1042–1054. [Google Scholar] [CrossRef] [PubMed] [Green Version]
  62. Landmann, H.; Proia, D.A.; He, S.; Ogawa, L.S.; Kramer, F.; Beißbarth, T.; Grade, M.; Gaedcke, J.; Ghadimi, M.; Moll, U.; et al. UDP glucuronosyltransferase 1A expression levels determine the response of colorectal cancer cells to the heat shock protein 90 inhibitor ganetespib. Cell Death Dis. 2014, 5, e1411. [Google Scholar] [CrossRef] [PubMed] [Green Version]
  63. Oguri, T.; Takahashi, T.; Miyazaki, M.; Isobe, T.; Kohno, N.; Mackenzie, P.; Fujiwara, Y. UGT1A10 is responsible for SN-38 glucuronidation and its expression in human lung cancers. Anticancer. Res. 2004, 24, 2893–2896. [Google Scholar] [PubMed]
  64. Li, P.; Chen, J.; Miyamoto, H. Androgen Receptor Signaling in Bladder Cancer. Cancers 2017, 9, 20. [Google Scholar] [CrossRef] [PubMed] [Green Version]
  65. Lombard, A.P.; Mudryj, M. The emerging role of the androgen receptor in bladder cancer. Endocrine-Related Cancer 2015, 22, R265–R277. [Google Scholar] [CrossRef] [PubMed] [Green Version]
  66. Mizushima, T.; Tirador, K.A.; Miyamoto, H. Androgen receptor activation: A prospective therapeutic target for bladder cancer? Expert Opin. Ther. Targets 2017, 21, 249–257. [Google Scholar] [CrossRef] [PubMed]
  67. Bélanger, A.; Pelletier, G.; Labrie, F.; Barbier, O.; Chouinard, S. Inactivation of androgens by UDP-glucuronosyltransferase enzymes in humans. Trends Endocrinol. Metab. 2003, 14, 473–479. [Google Scholar] [CrossRef]
  68. Crona, J.; Beuschlein, F. Adrenocortical carcinoma—towards genomics guided clinical care. Nat. Rev. Endocrinol. 2019, 15, 548–560. [Google Scholar] [CrossRef]
  69. Waszut, U.; Szyszka, P.; Dworakowska, D. Understanding mitotane mode of action. J. Physiol. Pharmacol. Off. J. Pol. Physiol. Soc. 2017, 68, 13–26. [Google Scholar]
  70. Cai, W.; Benitez, R.; Counsell, R.E.; Djanegara, T.; Schteingart, D.E.; Sinsheimer, J.E.; Wotring, L.L. Bovine adrenal cortex transformations of mitotane [1-(2-chlorophenyl)-1-(4-chlorophenyl)-2,2-dichloroethane; o,p′-DDD] and its p,p′- and m,p′-isomers. Biochem. Pharmacol. 1995, 49, 1483–1489. [Google Scholar] [CrossRef]
  71. Robertson, A.G.; Shih, J.; Yau, C.; Gibb, E.A.; Oba, J.; Mungall, K.L.; Hess, J.M.; Uzunangelov, V.; Walter, V.; Danilova, L.; et al. Integrative Analysis Identifies Four Molecular and Clinical Subsets in Uveal Melanoma. Cancer Cell 2017, 32, 204–220. [Google Scholar] [CrossRef] [Green Version]
  72. Kaliki, S.; Shields, C.L. Uveal melanoma: Relatively rare but deadly cancer. Eye 2017, 31, 241–257. [Google Scholar] [CrossRef] [Green Version]
  73. Luo, H.; Ma, C. Identification of prognostic genes in uveal melanoma microenvironment. PLoS ONE 2020, 15, e0242263. [Google Scholar] [CrossRef]
  74. Meech, R.; Mubarokah, N.; Shivasami, A.; Rogers, A.; Nair, P.C.; Hu, D.G.; McKinnon, R.A.; MacKenzie, P.I. A Novel Function for UDP Glycosyltransferase 8: Galactosidation of Bile Acids. Mol. Pharmacol. 2015, 87, 442–450. [Google Scholar] [CrossRef] [Green Version]
  75. Bosioa, A.; Binczeka, E.; Le Beau, M.M.; Fernald, A.A.; Stoffel, W. The Human Gene CGT Encoding the UDP-Galactose Ceramide Galactosyl Transferase (Cerebroside Synthase): Cloning, Characterization, and Assignment to Human Chromosome 4, Band q26. Genomics 1996, 34, 69–75. [Google Scholar] [CrossRef]
  76. Honke, K.; Tsuda, M.; Koyota, S.; Wada, Y.; Iida-Tanaka, N.; Ishizuka, I.; Nakayama, J.; Taniguchi, N. Molecular cloning and characterization of a human beta-Gal-3’-sulfotransferase that acts on both type 1 and type 2 (Gal beta 1-3/1-4GlcNAc-R) oligosaccharides. J. Biol. Chem. 2001, 276, 267–274. [Google Scholar] [CrossRef] [Green Version]
  77. Lai, M.; La Rocca, V.; Amato, R.; Freer, G.; Pistello, M. Sphingolipid/Ceramide Pathways and Autophagy in the Onset and Progression of Melanoma: Novel Therapeutic Targets and Opportunities. Int. J. Mol. Sci. 2019, 20, 3436. [Google Scholar] [CrossRef] [Green Version]
  78. Owczarek, T.B.; Suchanski, J.; Pula, B.; Kmiecik, A.M.; Chadalski, M.; Jethon, A.; Dziegiel, P.; Ugorski, M. Galactosylceramide Affects Tumorigenic and Metastatic Properties of Breast Cancer Cells as an Anti-Apoptotic Molecule. PLoS ONE 2013, 8, e84191. [Google Scholar] [CrossRef] [Green Version]
  79. Cao, Q.; Chen, X.; Wu, X.; Liao, R.; Huang, P.; Tan, Y.; Wang, L.; Ren, G.; Huang, J.; Dong, C. Inhibition of UGT8 suppresses basal-like breast cancer progression by attenuating sulfatide-alphaVbeta5 axis. J. Exp. Med. 2018, 215, 1679–1692. [Google Scholar] [CrossRef] [Green Version]
  80. Izumi, K.; Li, Y.; Ishiguro, H.; Zheng, Y.; Yao, J.L.; Netto, G.J.; Miyamoto, H. Expression of UDP-glucuronosyltransferase 1A in bladder cancer: Association with prognosis and regulation by estrogen. Mol. Carcinog. 2012, 53, 314–324. [Google Scholar] [CrossRef]
  81. Kaushik, A.K.; Vareed, S.K.; Basu, S.; Putluri, V.; Putluri, N.; Panzitt, K.; Brennan, C.A.; Chinnaiyan, A.M.; Vergara, I.A.; Erho, N.; et al. Metabolomic Profiling Identifies Biochemical Pathways Associated with Castration-Resistant Prostate Cancer. J. Proteome Res. 2014, 13, 1088–1100. [Google Scholar] [CrossRef] [Green Version]
  82. Olivier, B.; Xie, N.; Chen, R.; Verreault, M.; Fazli, L.; Gleave, M.; Barbier, O.; Dong, X. UGT2B17 Expedites Progression of Castration-Resistant Prostate Cancers by Promoting Ligand-Independent AR Signaling. Cancer Res. 2016, 76, 6701–6711. [Google Scholar] [CrossRef] [Green Version]
  83. Stanbrough, M.; Bubley, G.J.; Ross, K.; Golub, T.R.; Rubin, M.; Penning, T.; Febbo, P.G.; Balk, S.P. Increased Expression of Genes Converting Adrenal Androgens to Testosterone in Androgen-Independent Prostate Cancer. Cancer Res. 2006, 66, 2815–2825. [Google Scholar] [CrossRef] [Green Version]
  84. Hu, D.G.; Selth, L.A.; Tarulli, G.A.; Meech, R.; Wijayakumara, D.; Chanawong, A.; Russell, R.; Caldas, C.; Robinson, J.L.L.; Carroll, J.S.; et al. Androgen and estrogen receptors in breast cancer coregulate human UDP-glucuronosyltransferases 2B15 and 2B17. Cancer Res. 2016, 76, 5881–5893. [Google Scholar] [CrossRef] [PubMed] [Green Version]
Figure 1. The expression profiles of UGT genes in six different types of TCGA cancers. The log2-transformed expression levels (RSEM values) of UGT genes in six TCGA cancer types (CHOL, COAD, KIRC, KIRP, LIHC, PAAD) are presented using the box-and-whisker plots that show the distribution of the expression levels (minimum, first quartile, median, third quartile, and maximum) in each of these cancers.
Cancers 13 04491 g001
Figure 2. The expression profiles of 6 UGT genes (1A6, 1A9, 1A10, 2A3, 2B7, UGT8) in 33 different types of TCGA cancers. The log2-transformed expression levels (RSEM values) of 6 UGT genes in 33 TCGA cancer types as indicated at the X-Axis are presented using the box-and-whisker plots that show the distribution of the expression levels (minimum, first quartile, median, third quartile, and maximum) in each of these cancers.
Cancers 13 04491 g002
Figure 3. Expression of UGT genes in matched cancerous (T) and adjacent non-cancerous (N) tissues from four TCGA cancer types (COAD, KICH, KIRC, LUSC). The log2-transformed expression levels (HT-Seq counts) of UGT genes in matched cancerous (T) and non-cancerous (N) tissues from four TCGA cancer types as indicated are presented using the box-and-whisker plots that show the distribution of the expression levels (minimum, first quartile, median, third quartile, and maximum) in each of these cancers. Up/downregulated UGT genes are highlighted with * indicating an adjusted p-value of <0.01.
Cancers 13 04491 g003
Figure 4. Kaplan–Meier plots and logrank tests show significant associations of intratumoral expression levels of UGT genes with overall survival rates in TCGA cancer types as indicated. For Kaplan–Meier survival analysis, the patients were separated into high-expression groups and low/no-expression group by gene expression levels as described in the Materials and Methods Section. The number of patients in each group for each Kaplan–Meier plot/logrank test was given in bracket following the p-value. Hazard Ratios (HR) and 95% confidence intervals (95% CI) are also shown. Logrank p-values were adjusted using Bonferroni correction as described in the Materials and Method Section. A Bonferroni-corrected cutoff logrank p-value of <0.05 indicates statistical significance.
Cancers 13 04491 g004
Table 1. A total of 9514 patients of 33 different types of TCGA cancers were analysed in this study.
Cancer TypeDescriptionNo. of
Patients
No. of Paired Cancerous
and Non-Cancerous Tissues
ACCAdrenocortical carcinoma78
BLCABladder Urothelial Carcinoma398
BRCABreast Invasive Carcinoma1080113
CESCCervical Squamous Cell Carcinoma and
endocervical Adenocarcinoma304
CHOLCholangiocarcinoma35
COADColon Adenocarcinoma23524
DLBCLymphoid Neoplasm Diffuse Large B-cell
lymphoma47
ESCAEsophageal Carcinoma182
GBMGlioblastoma Multiforme148
HNSCHead and Neck Squamous Cell Carcinoma51943
KICHKidney Chromophobe6525
KIRCKidney Renal Clear Cell Carcinoma53172
KIRPKidney Renal Papillary Cell Carcinoma28732
LAMLAcute Myeloid Leukemia149
LGGBrain Lower Grade Glioma510
LIHCLiver Hepatocellular Carcinoma36550
LUADLung Adenocarcinoma50258
LUSCLung Squamous Cell Carcinoma49251
MESOMesothelioma85
OVOvary Serous Cystadenocarcinoma294
PCPGPheochromocytoma and Paraganglioma179
PAADPancreatic Adenocarcinoma144
PRADProstate adenocarcinoma46252
READRectum Adenocarcinoma93
SARCSarcoma258
SKCMSkin Cutaneous Melanoma452
STADStomach Adenocarcinoma35732
TGCTTesticular Germ Cell Tumors134
THCAThyroid Carcinoma50459
THYMThymoma119
UCECUterine Corpus Endometrial Carcinoma370
UCSUterine Carcinosarcoma56
UVMUveal Melanoma80
Table 2. UGT genes that were up/downregulated in cancerous tissues compared to matched adjacent non-cancerous tissues in TCGA and non-TCGA cancer datasets. A p-value of <0.01 is considered statistically significant.
TCGA DatasetsNon-TCGA Datasets
UGT GenesCancer TypesFold Changep-ValuesFold Changep-ValuesIndependent Studies
1A1COAD−7.02.74 × 10−6−10.56.66 × 10−5Kaiser S et al., 2007 [51]
1A1KIRC4.89.69 × 10−11
1A1STAD−10.11.90 × 10−5
1A3KIRC13.43.35 × 10−25
1A3PRAD6.81.49 × 107
1A6LUAD6.54.82 × 10−10
1A6LUSC48.51.63 × 10−4511.92.04 × 10−11Hou J et al., 2010 [50]
1A7LUSC1074.92.96 × 10−28
1A7STAD−8.80.0051
1A8COAD−27.07.70 × 10−34−12.52.01 × 10−5Kaiser S et al., 2007 [51]
1A8HNSC−6.30.00011
1A9COAD−10.82.33 × 10−11−11.72.66 × 10−5Kaiser S et al., 2007 [51]
1A9KICH−229.13.36 × 10−22
1A9LUSC65.33.00 × 10−3314.91.19 × 10−11Hou J et al., 2010 [50]
1A10COAD−16.52.18 × 10−39
1A10KIRC39.17.84 × 10−19
1A10LIHC54.54.81 × 10−12
2A1HNSC−6.50.0033
2A1KICH−8.32.24 × 10−5−2.51.38 × 10−4Jones J et al., 2005 [53]
2A1KIRC−90.54.34 × 10−36−4.03.63 × 10−18Jones J et al., 2005 [53]
2A1KIRP−6.50.000673
2A1LUSC16.45.19 × 10−11
2A3COAD−15.89.33 × 10−22−7.66.38 × 10−10Kaiser S et al., 2007 [51]
2A3KICH−1112.82.90 × 10−101−3.11.62 × 10−6Jones J et al., 2005 [53]
2B4PRAD29.42.62 × 10−254.36.18 × 10−5Welsh JB et al., 2001 [48]
2B7KICH−110.67.06 × 10−23
2B7KIRP−6.03.99 × 10−9
2B7STAD−4.10.0093−2.51.15 × 10−4Chen X et al., 2003 [52]
2B7PRAD−56.84.32 × 10−18
2B11LIHC5.31.30 × 10−12
2B15COAD−10.57.09 × 10−10−12.03.42 × 10−6Kaiser S et al., 2007 [51]
2B15LUAD64.56 × 10−103.33.82 × 10−16Okayama H et al., 2003 [49]
3A1KICH−661.63.10 × 10−99
3A2KICH−11.72.90 × 10−8
3A2KIRC−6.63.04 × 10−22
UGT8LUAD5.31.63 × 10−2634.33 × 10−8Hou J et al., 2010 [50]
UGT8LUSC6.82.45 × 10−225.84.11 × 10−9Hou J et al., 2010 [50]
Publisher’s Note: MDPI stays neutral with regard to jurisdictional claims in published maps and institutional affiliations.

