
Neuroinflammation and Its Association with Cognition, Neuronal Markers and Peripheral Inflammation after Chemotherapy for Breast Cancer

 , , , , , , , ,
Abstract
:Simple Summary
Abstract
1. Introduction
2. Patients and Methods
2.1. Neuroimaging
2.2. Clinical Parameters
2.3. Statistics
3. Results
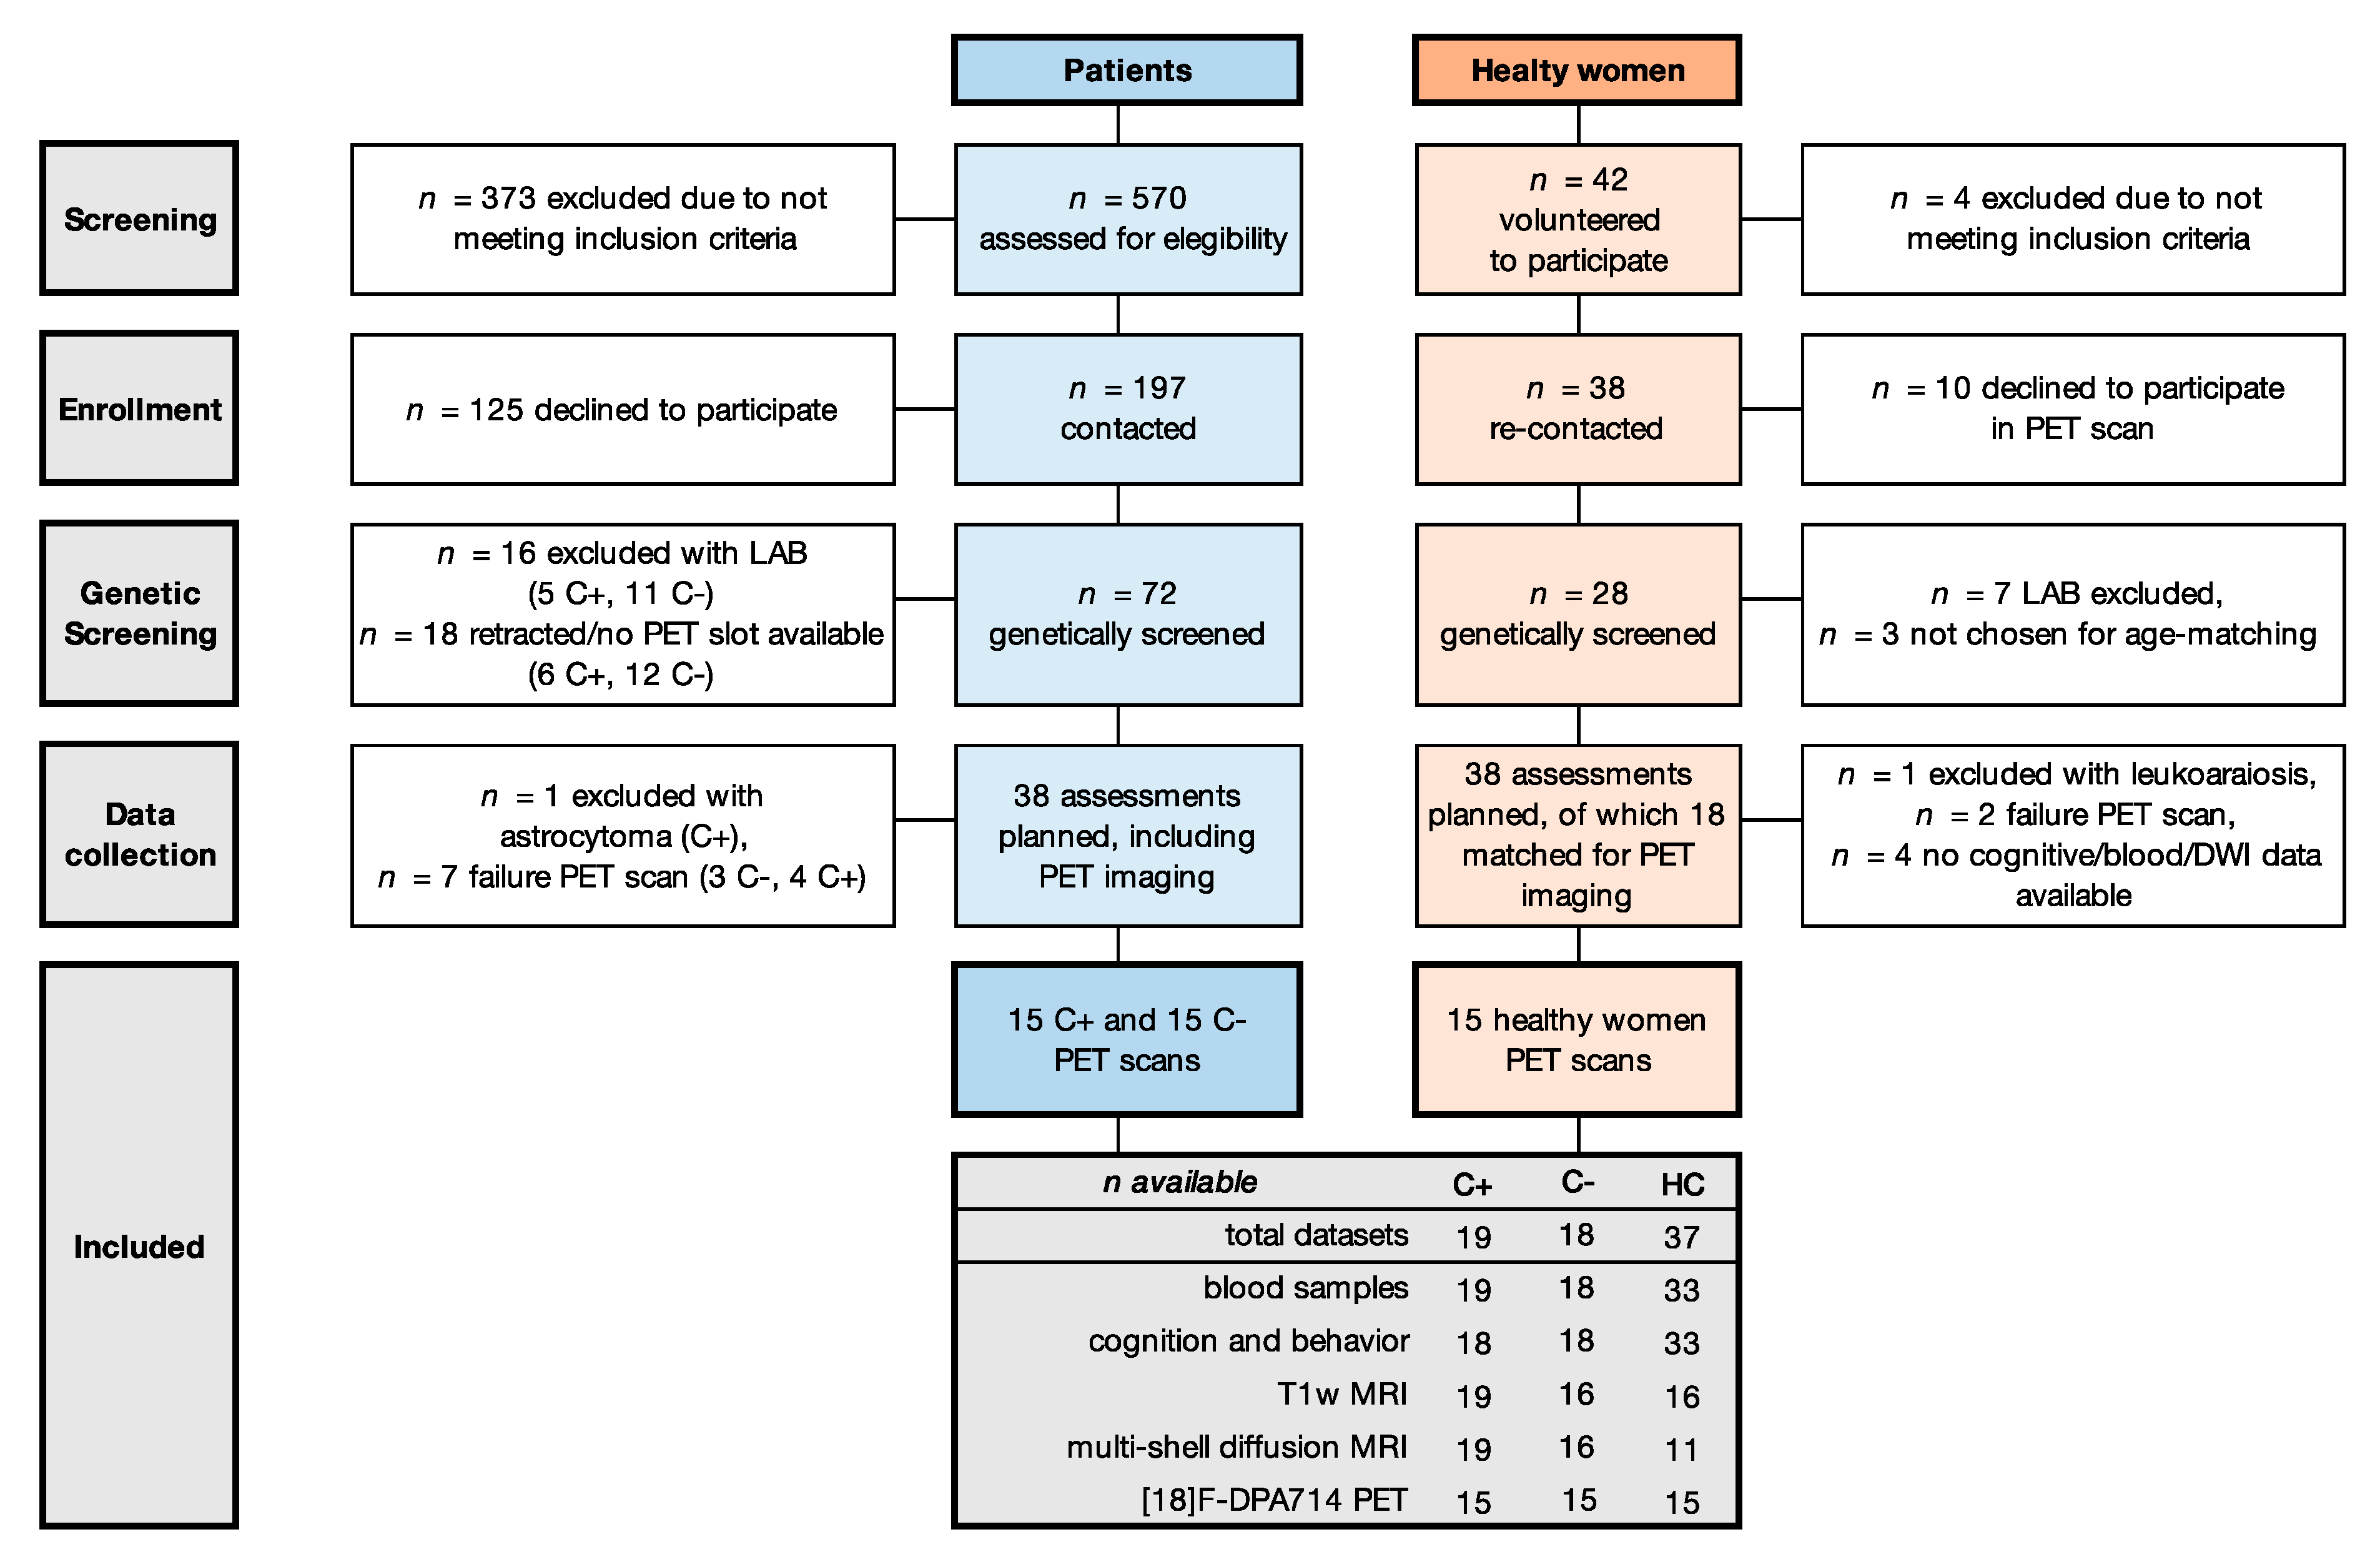
3.1. Participants
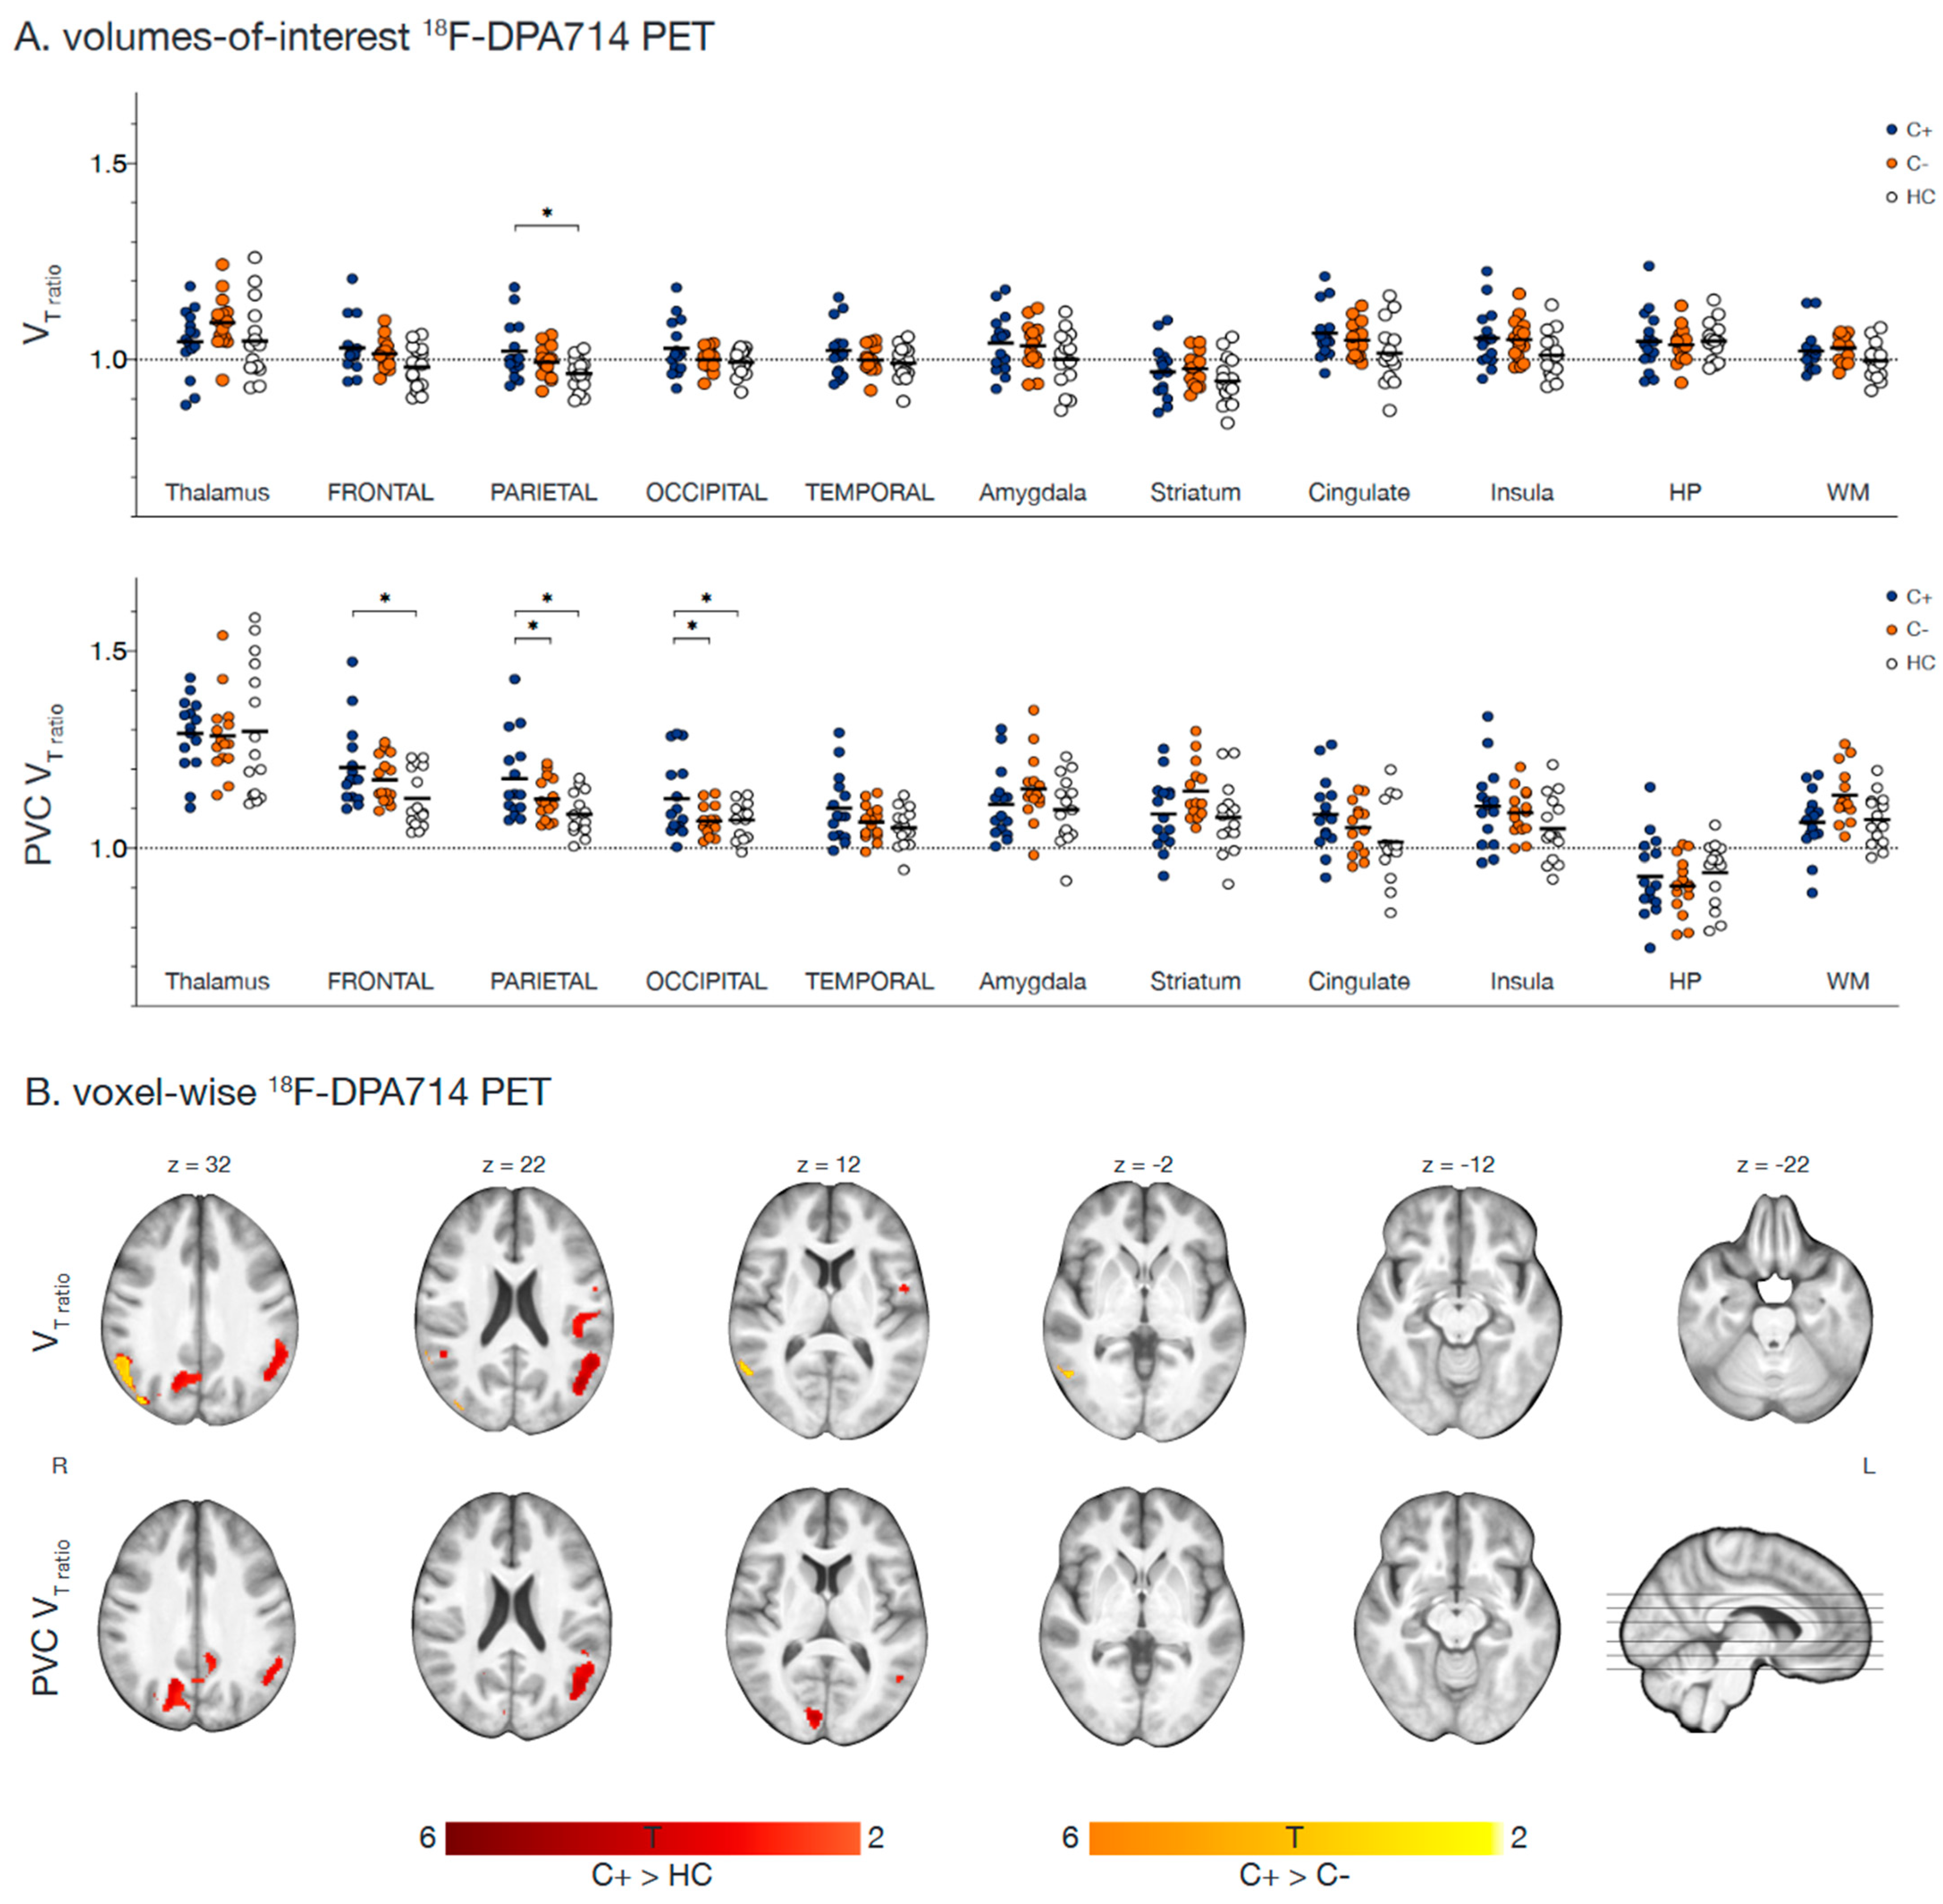
3.2. Neuroimaging
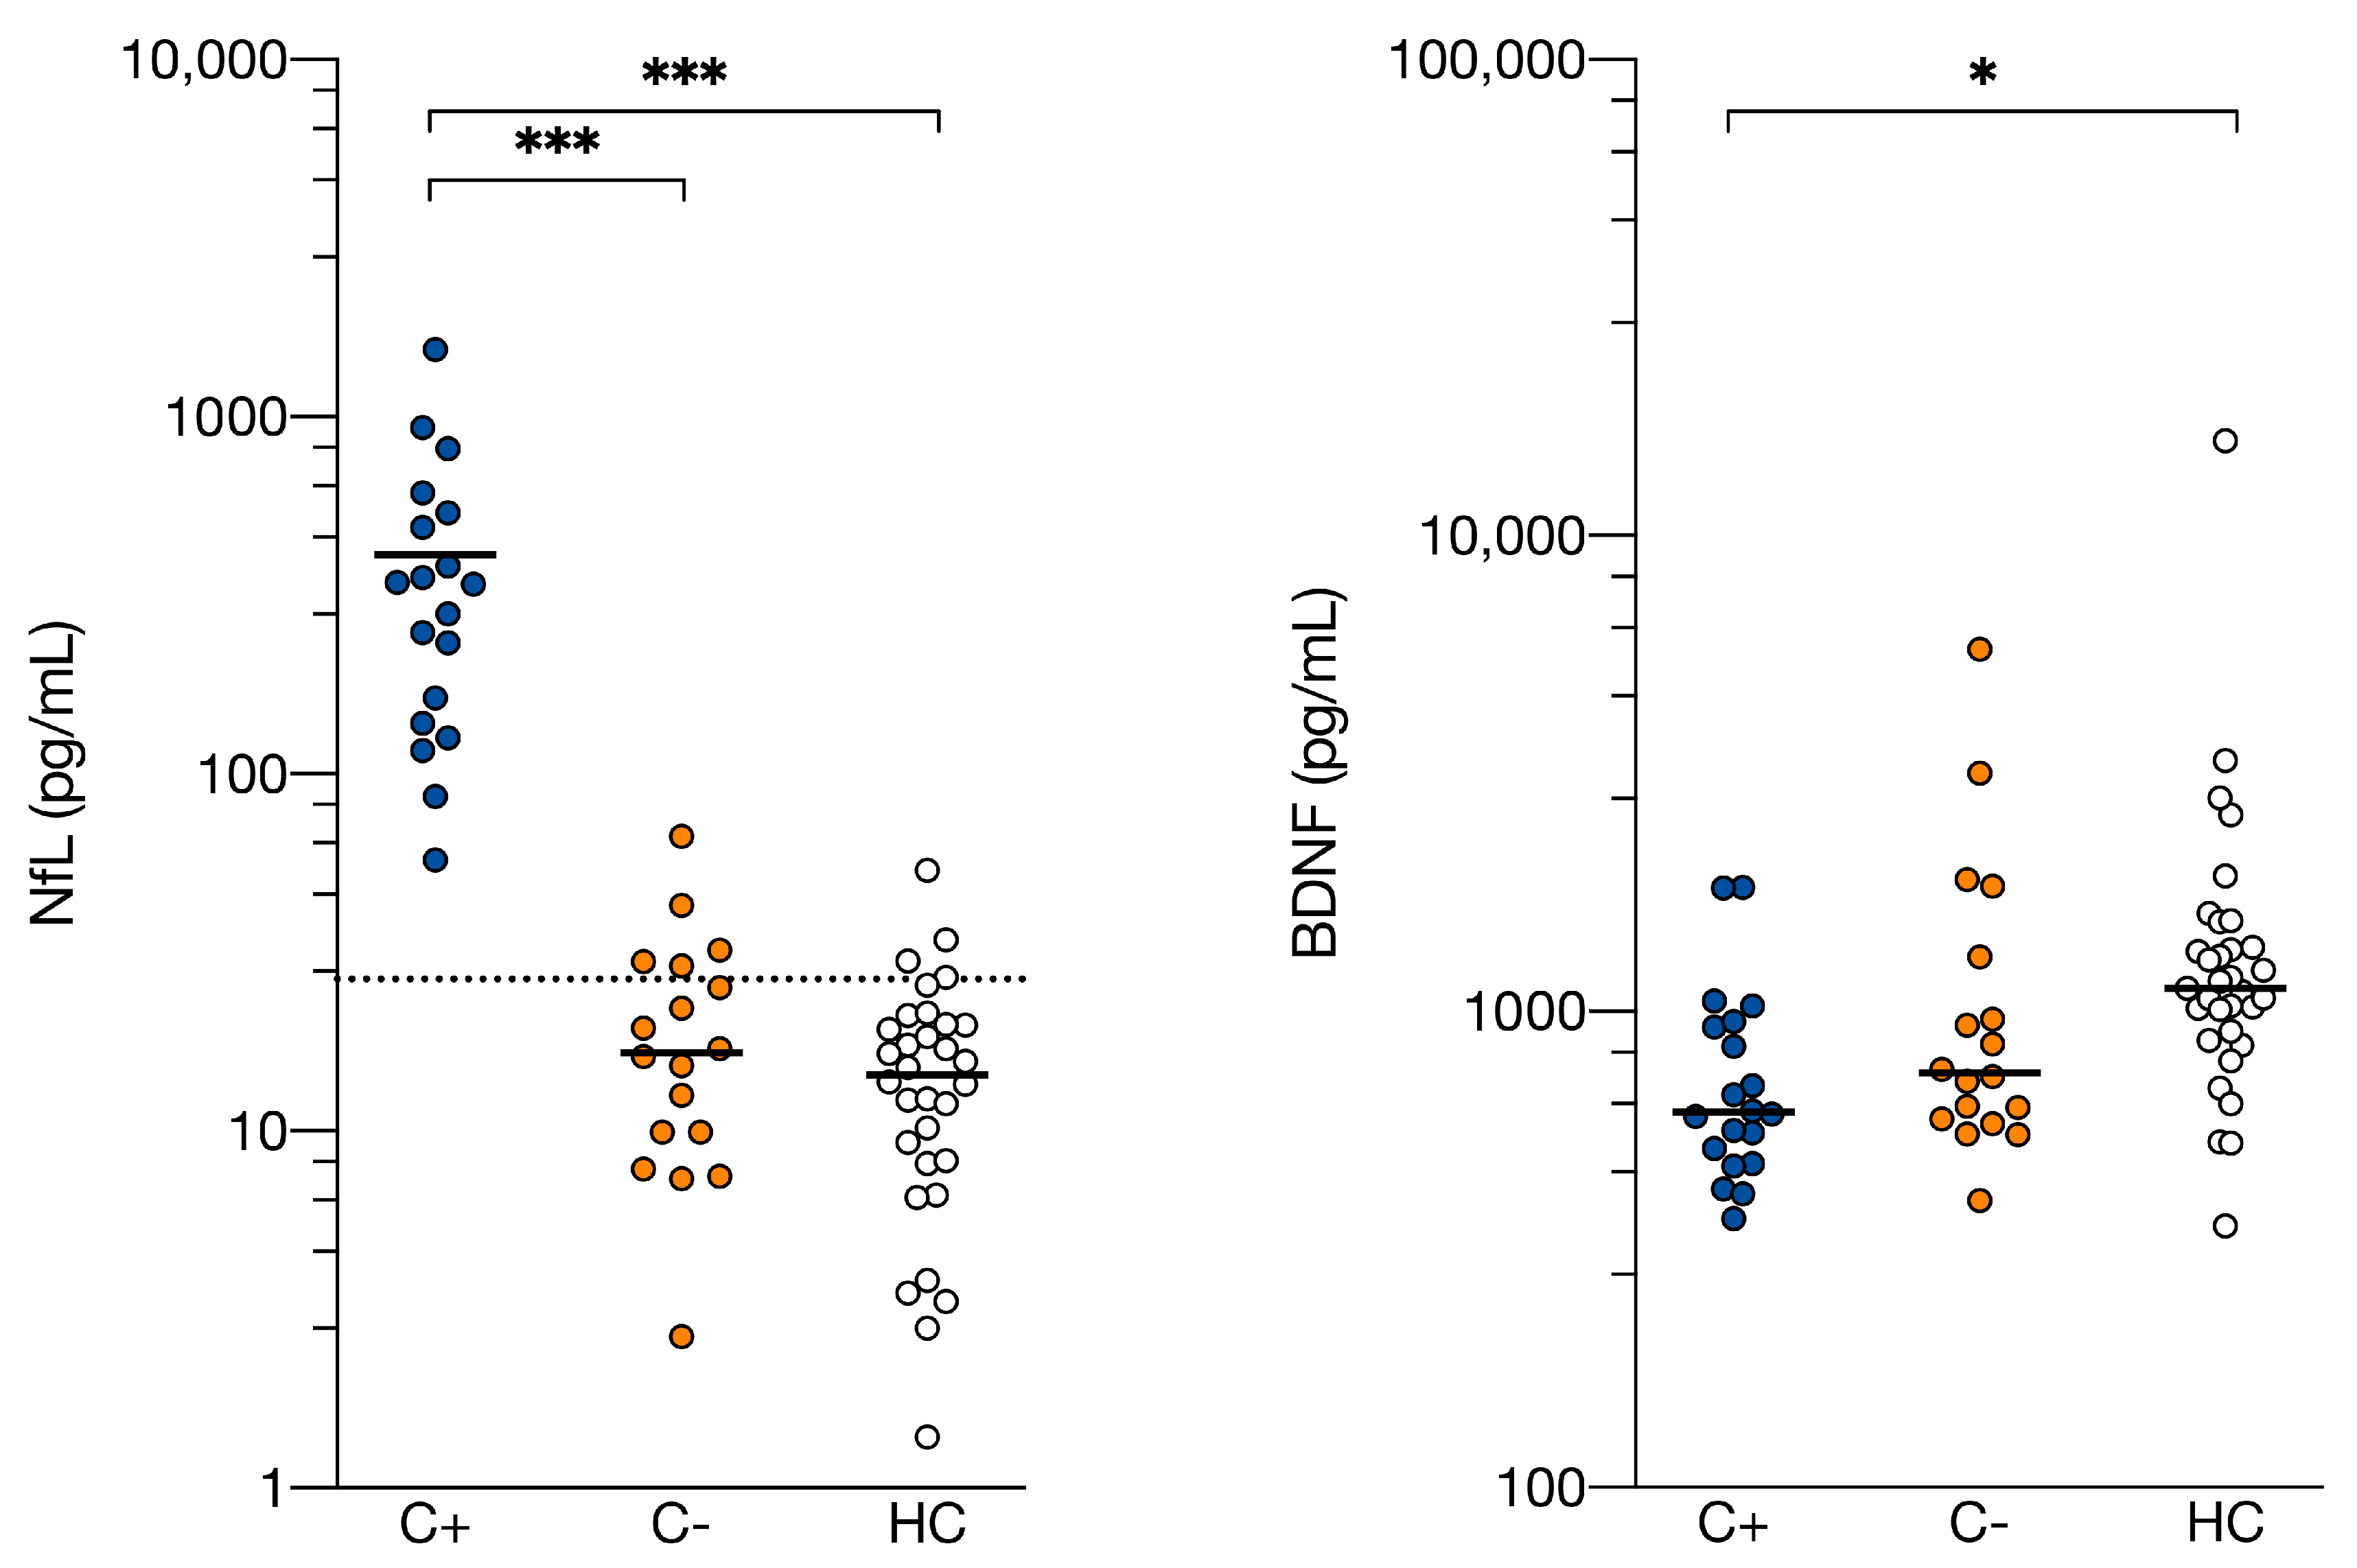
3.3. Clinical Parameters
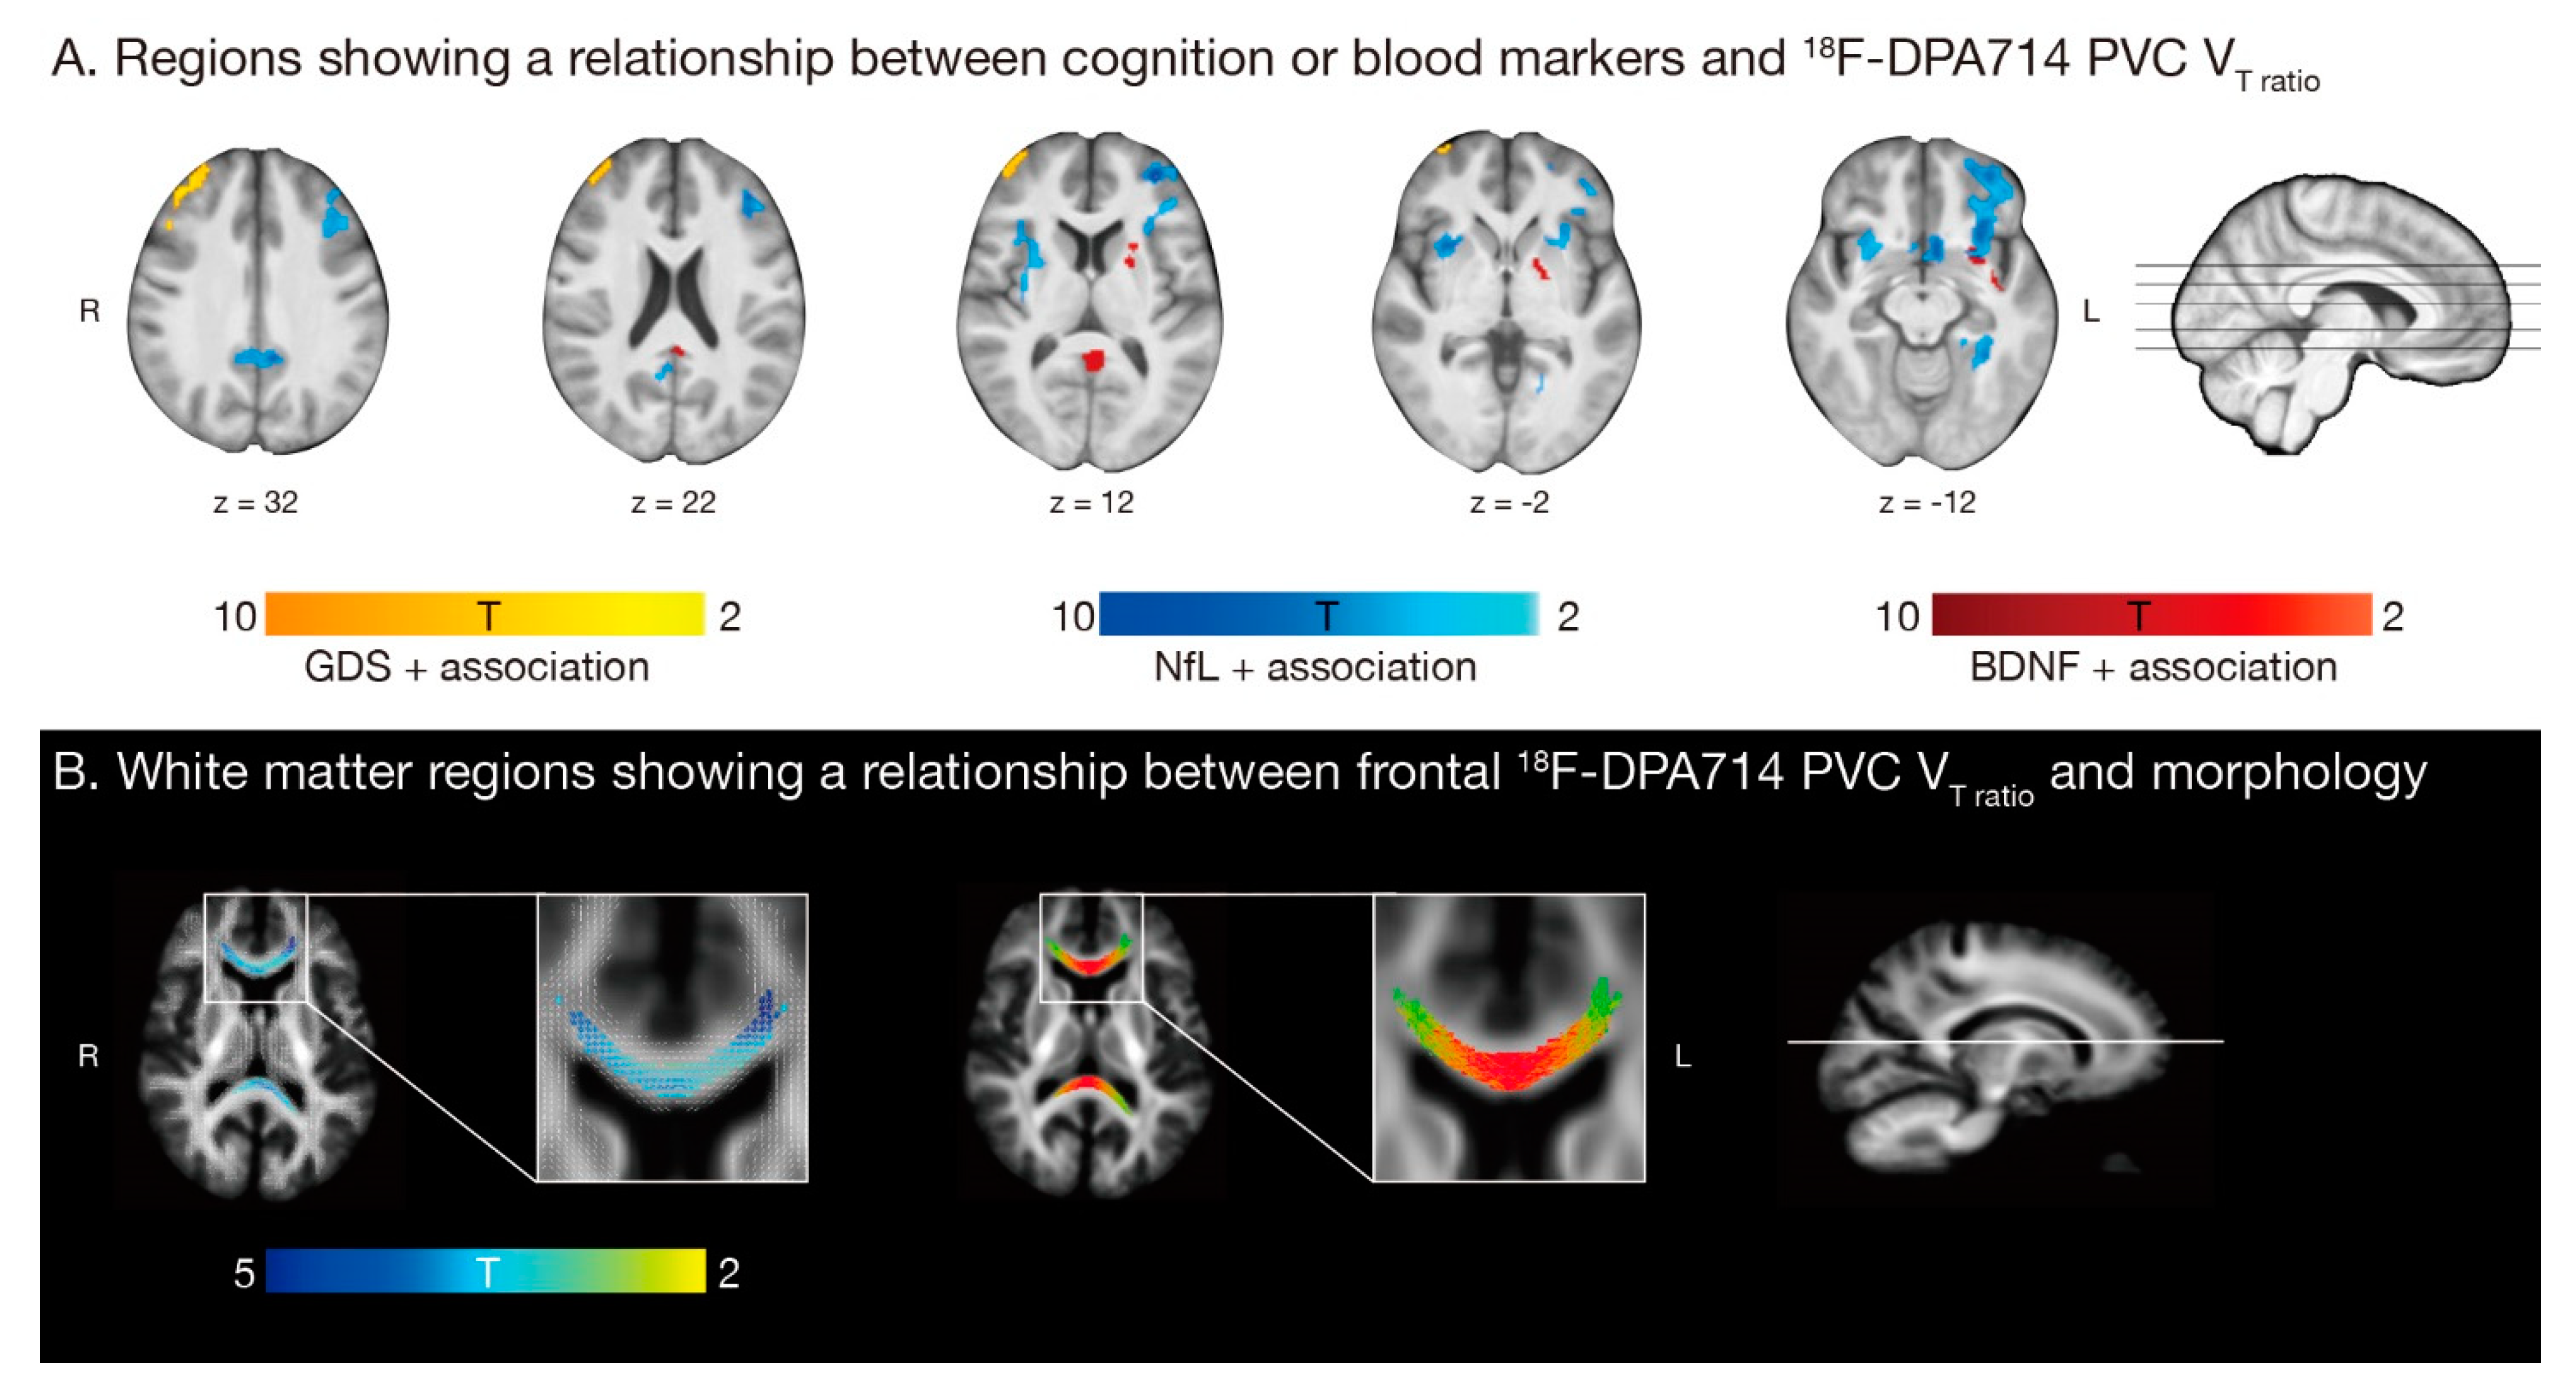
3.4. Associations for C+ Patients
4. Discussion
5. Conclusions
Supplementary Materials
Author Contributions
Funding
Institutional Review Board Statement
Informed Consent Statement
Data Availability Statement
Acknowledgments
Conflicts of Interest
References
- Bray, F.; Ferlay, J.; Soerjomataram, I.; Siegel, R.L.; Torre, L.A.; Jemal, A. Global cancer statistics 2018: GLOBOCAN estimates of incidence and mortality worldwide for 36 cancers in 185 countries. CA Cancer J. Clin. 2018, 68, 394–424. [Google Scholar] [CrossRef]
- Janelsins, M.C.; Kesler, S.R.; Ahles, T.A.; Morrow, G.R. Prevalence, mechanisms, and management of cancer-related cognitive impairment. Int. Rev. Psychiatry 2014, 26, 102–113. [Google Scholar] [CrossRef] [PubMed]
- Van Der Willik, K.D.; Koppelmans, V.; Hauptmann, M.; Compter, A.; Ikram, M.A.; Schagen, S.B. Inflammation markers and cognitive performance in breast cancer survivors 20 years after completion of chemotherapy: A cohort study. Breast Cancer Res. 2018, 20, 135. [Google Scholar] [CrossRef] [PubMed]
- Sleurs, C.; Madoe, A.; Lagae, L.; Jacobs, S.; Deprez, S.; Lemiere, J.; Uyttebroeck, A. Genetic Modulation of Neurocognitive Development in Cancer Patients throughout the Lifespan: A Systematic Review. Neuropsychol. Rev. 2019, 29, 190–219. [Google Scholar] [CrossRef] [PubMed]
- Blommaert, J.; Schroyen, G.; Vandenbulcke, M.; Radwan, A.; Smeets, A.; Peeters, R.; Sleurs, C.; Neven, P.; Wildiers, H.; Amant, F.; et al. Age-dependent brain volume and neuropsychological changes after chemotherapy in breast cancer patients. Hum. Brain Mapp. 2019, 40, 4994–5010. [Google Scholar] [CrossRef]
- Ahles, T.A.; Root, J.C. Cognitive Effects of Cancer and Cancer Treatments. Annu. Rev. Clin. Psychol. 2018, 14, 425–451. [Google Scholar] [CrossRef]
- Han, R.; Yang, Y.M.; Dietrich, J.; Luebke, A.; Mayer-Pröschel, M.; Noble, M. Systemic 5-fluorouracil treatment causes a syndrome of delayed myelin destruction in the central nervous system. J. Biol. 2008, 7, 12. [Google Scholar] [CrossRef]
- Ahles, T.A.; Saykin, A.J. Candidate mechanisms for chemotherapy-induced cognitive changes. Nat. Rev. Cancer 2007, 7, 192–201. [Google Scholar] [CrossRef] [PubMed]
- Wardill, H.R.; Mander, K.A.; Van Sebille, Y.Z.A.; Gibson, R.J.; Logan, R.M.; Bowen, J.M.; Sonis, S.T. Cytokine-mediated blood brain barrier disruption as a conduit for cancer/chemotherapy-associated neurotoxicity and cognitive dysfunction. Int. J. Cancer 2016, 139, 2635–2645. [Google Scholar] [CrossRef]
- Tsavaris, N.; Kosmas, C.; Vadiaka, M.; Kanelopoulos, P.; Boulamatsis, D. Immune changes in patients with advanced breast cancer undergoing chemotherapy with taxanes. Br. J. Cancer 2002, 87, 21–27. [Google Scholar] [CrossRef]
- Castel, H.; Denouel, A.; Lange, M.; Tonon, M.-C.; Dubois, M.; Joly, F. Biomarkers Associated with Cognitive Impairment in Treated Cancer Patients: Potential Predisposition and Risk Factors. Front. Pharmacol. 2017, 8, 138. [Google Scholar] [CrossRef] [PubMed]
- Seigers, R.; Timmermans, J.; Van Der Horn, H.J.; De Vries, E.F.J.; Dierckx, R.A.; Visser, L.; Schagen, S.B.; Van Dam, F.S.A.M.; Koolhaas, J.M.; Buwalda, B. Methotrexate reduces hippocampal blood vessel density and activates microglia in rats but does not elevate central cytokine release. Behav. Brain Res. 2010, 207, 265–272. [Google Scholar] [CrossRef]
- Dina, O.A.; Chen, X.; Reichling, D.; Levine, J.D. Role of protein kinase Cε and protein kinase A in a model of paclitaxel-induced painful peripheral neuropathy in the rat. Neuroscience 2001, 108, 507–515. [Google Scholar] [CrossRef]
- Christie, L.-A.; Acharya, M.M.; Parihar, V.K.; Nguyen, A.; Martirosian, V.; Limoli, C.L. Impaired cognitive function and hippocampal neurogenesis following cancer chemotherapy. Clin. Cancer Res. 2012, 18, 1954–1965. [Google Scholar] [CrossRef]
- Paquet, C.; Boche, D.; El Bouchtaoui, M.; Gourmaud, S.; Janin, A.; Bousquet, G. Effect of anti-cancer drugs on microglia in patient-derived breast cancer xenografted mouse models. Neuropathology 2017, 37, 91–93. [Google Scholar] [CrossRef]
- Santos, J.C.; Pyter, L.M. Neuroimmunology of Behavioral Comorbidities Associated with Cancer and Cancer Treatments. Front. Immunol. 2018, 9, 1195. [Google Scholar] [CrossRef] [PubMed]
- Arlicot, N.; Vercouillie, J.; Ribeiro, M.-J.; Tauber, C.; Venel, Y.; Baulieu, J.-L.; Maia, S.; Corcia, P.; Stabin, M.G.; Reynolds, A.; et al. Initial evaluation in healthy humans of [18F]DPA-714, a potential PET biomarker for neuroinflammation. Nucl. Med. Biol. 2012, 39, 570–578. [Google Scholar] [CrossRef] [PubMed]
- Notter, T.; Coughlin, J.M.; Sawa, A.; Meyer, U. Reconceptualization of translocator protein as a biomarker of neuroinflammation in psychiatry. Mol. Psychiatry 2018, 23, 36–47. [Google Scholar] [CrossRef]
- Beckers, L.; Ory, D.; Geric, I.; Declercq, L.; Koole, M.; Kassiou, M.; Bormans, G.; Baes, M. Increased Expression of Translocator Protein (TSPO) Marks Pro-inflammatory Microglia but Does Not Predict Neurodegeneration. Mol. Imaging Biol. 2018, 20, 94–102. [Google Scholar] [CrossRef] [PubMed]
- Seigers, R.; Schagen, S.B.; Van Tellingen, O.; Dietrich, J. Chemotherapy-related cognitive dysfunction: Current animal studies and future directions. Brain Imaging Behav. 2013, 7, 453–459. [Google Scholar] [CrossRef]
- Winocur, G.; Berman, H.; Nguyen, M.; Binns, M.A.; Henkelman, M.; van Eede, M.; Piquette-Miller, M.; Sekeres, M.J.; Wojtowicz, J.M.; Yu, J.; et al. Neurobiological Mechanisms of Chemotherapy-induced Cognitive Impairment in a Transgenic Model of Breast Cancer. Neuroscience 2018, 369, 51–65. [Google Scholar] [CrossRef]
- De Vocht, J.; Blommaert, J.; Devrome, M.; Radwan, A.; Van Weehaeghe, D.; De Schaepdryver, M.; Ceccarini, J.; Rezaei, A.; Schramm, G.; Van Aalst, J.; et al. Use of Multimodal Imaging and Clinical Biomarkers in Presymptomatic Carriers of C9orf72 Repeat Expansion. JAMA Neurol. 2020, 77, 1008–1017. [Google Scholar] [CrossRef]
- Ashton, N.J.; Janelidze, S.; Al Khleifat, A.; Leuzy, A.; van der Ende, E.L.; Karikari, T.K.; Benedet, A.L.; Pascoal, T.A.; Lleó, A.; Parnetti, L.; et al. A multicentre validation study of the diagnostic value of plasma neurofilament light. Nat. Commun. 2021, 12, 3400. [Google Scholar] [CrossRef]
- Natori, A.; Ogata, T.; Sumitani, M.; Kogure, T.; Yamauchi, T.; Yamauchi, H. Potential Role of pNF-H, a Biomarker of Axonal Damage in the Central Nervous System, as a Predictive Marker of Chemotherapy-Induced Cognitive Impairment. Clin. Cancer Res. 2015, 21, 1348–1352. [Google Scholar] [CrossRef] [PubMed]
- Dietrich, J.; Han, R.; Yang, Y.; Mayer-Pröschel, M.; Noble, M. CNS progenitor cells and oligodendrocytes are targets of chemotherapeutic agents in vitro and in vivo. J. Biol. 2006, 5, 22. [Google Scholar] [CrossRef] [PubMed]
- Gibson, E.M.; Nagaraja, S.; Ocampo, A.; Tam, L.T.; Wood, L.S.; Pallegar, P.N.; Greene, J.J.; Geraghty, A.C.; Goldstein, A.K.; Ni, L.; et al. Methotrexate Chemotherapy Induces Persistent Tri-glial Dysregulation that Underlies Chemotherapy-Related Cognitive Impairment. Cell 2019, 176, 43–55.e13. [Google Scholar] [CrossRef] [PubMed]
- Deprez, S.; Amant, F.; Smeets, A.; Peeters, R.; Leemans, A.; Van Hecke, W.; Verhoeven, J.S.; Christiaens, M.-R.; Vandenberghe, J.; Vandenbulcke, M.; et al. Longitudinal Assessment of Chemotherapy-Induced Structural Changes in Cerebral White Matter and Its Correlation with Impaired Cognitive Functioning. J. Clin. Oncol. 2012, 30, 274–281. [Google Scholar] [CrossRef] [PubMed]
- Deprez, S.; Amant, F.; Yigit, R.; Porke, K.; Verhoeven, J.; Van den Stock, J.; Smeets, A.; Christiaens, M.-R.; Leemans, A.; Van Hecke, W.; et al. Chemotherapy-induced structural changes in cerebral white matter and its correlation with impaired cognitive functioning in breast cancer patients. Hum. Brain Mapp. 2011, 32, 480–493. [Google Scholar] [CrossRef]
- Amidi, A.; Hosseini, S.M.H.; Leemans, A.; Kesler, S.R.; Agerbæk, M.; Wu, L.M.; Zachariae, R. Changes in Brain Structural Networks and Cognitive Functions in Testicular Cancer Patients Receiving Cisplatin-Based Chemotherapy. JNCI J. Natl. Cancer Inst. 2017, 109, djx085. [Google Scholar] [CrossRef] [PubMed]
- Briones, T.L.; Woods, J. Dysregulation in myelination mediated by persistent neuroinflammation: Possible mechanisms in chemotherapy-related cognitive impairment. Brain. Behav. Immun. 2014, 35, 23–32. [Google Scholar] [CrossRef]
- Owen, D.R.J.; Gunn, R.N.; Rabiner, E.A.; Bennacef, I.; Fujita, M.; Kreisl, W.C.; Innis, R.B.; Pike, V.W.; Reynolds, R.; Matthews, P.M.; et al. Mixed-affinity binding in humans with 18-kDa translocator protein ligands. J. Nucl. Med. 2011, 52, 24–32. [Google Scholar] [CrossRef] [PubMed]
- Schramm, G.; Koole, M.; Willekens, S.M.A.; Rezaei, A.; Van Weehaeghe, D.; Delso, G.; Peeters, R.; Mertens, N.; Nuyts, J.; Van Laere, K. Regional Accuracy of ZTE-Based Attenuation Correction in Static [18F]FDG and Dynamic [18F]PE2I Brain PET/MR. Front. Phys. 2019, 7, 211. [Google Scholar] [CrossRef]
- Lavisse, S.; García-Lorenzo, D.; Peyronneau, M.A.; Bodini, B.; Thiriez, C.; Kuhnast, B.; Comtat, C.; Remy, P.; Stankoff, B.; Bottlaender, M. Optimized quantification of translocator protein radioligand 18F-DPA-714 uptake in the brain of genotyped healthy volunteers. J. Nucl. Med. 2015, 56, 1048–1054. [Google Scholar] [CrossRef] [PubMed]
- Thomas, B.A.; Erlandsson, K.; Modat, M.; Thurfjell, L.; Vandenberghe, R.; Ourselin, S.; Hutton, B.F. The importance of appropriate partial volume correction for PET quantification in Alzheimer’s disease. Eur. J. Nucl. Med. Mol. Imaging 2011, 38, 1104–1119. [Google Scholar] [CrossRef]
- Ponto, L.L.B.; Menda, Y.; Magnotta, V.A.; Yamada, T.H.; Denburg, N.L.; Schultz, S.K. Frontal hypometabolism in elderly breast cancer survivors determined by [(18)F]fluorodeoxyglucose (FDG) positron emission tomography (PET): A pilot study. Int. J. Geriatr. Psychiatry 2015, 30, 587–594. [Google Scholar] [CrossRef]
- Li, M.; Caeyenberghs, K. Longitudinal assessment of chemotherapy-induced changes in brain and cognitive functioning: A systematic review. Neurosci. Biobehav. Rev. 2018, 92, 304–317. [Google Scholar] [CrossRef]
- Raffelt, D.A.; Tournier, J.-D.; Smith, R.E.; Vaughan, D.N.; Jackson, G.; Ridgway, G.R.; Connelly, A. Investigating white matter fibre density and morphology using fixel-based analysis. Neuroimage 2017, 144, 58–73. [Google Scholar] [CrossRef] [PubMed]
- Tournier, J.-D.; Smith, R.E.; Raffelt, D.A.; Tabbara, R.; Dhollander, T.; Pietsch, M.; Christiaens, D.; Jeurissen, B.; Yeh, C.-H.; Connelly, A. MRtrix3: A fast, flexible and open software framework for medical image processing and visualisation. Neuroimage 2019, 202, 116137. [Google Scholar] [CrossRef] [PubMed]
- Jeurissen, B.; Tournier, J.D.; Dhollander, T.; Connelly, A.; Sijbers, J. Multi-tissue constrained spherical deconvolution for improved analysis of multi-shell diffusion MRI data. Neuroimage 2014, 103, 411–426. [Google Scholar] [CrossRef]
- Wefel, J.S.; Vardy, J.; Ahles, T.; Schagen, S.B. International Cognition and Cancer Task Force recommendations to harmonise studies of cognitive function in patients with cancer. Lancet. Oncol. 2011, 12, 703–708. [Google Scholar] [CrossRef]
- Carey, C.L.; Woods, S.P.; Gonzalez, R.; Conover, E.; Marcotte, T.D.; Grant, I.; Heaton, R.K. Predictive Validity of Global Deficit Scores in Detecting Neuropsychological Impairment in HIV Infection. J. Clin. Exp. Neuropsychol. 2004, 26, 307–319. [Google Scholar] [CrossRef] [PubMed]
- Vardy, J.; Rourke, S.; Tannock, I.F. Evaluation of cognitive function associated with chemotherapy: A review of published studies and recommendations for future research. J. Clin. Oncol. 2007, 25, 2455–2463. [Google Scholar] [CrossRef] [PubMed]
- Van der Ploeg, H.M.; Defares, P.B. Zelf-Beoordelings Vragenlijst: Een Nederlandstalige Bewerking van de Spielberger State-Trait. Anxiety Inventory STAI-D; Swets en Zeitlinger: Lisse, The Netherlands, 1990. [Google Scholar]
- Bosscher, R.J.; Koning, H.; Van Meurs, R. Reliability and validity of the Beck Depression Inventory in a Dutch college population. Psychol. Rep. 1986, 58, 696–698. [Google Scholar] [CrossRef] [PubMed]
- Cohen, S.; Kamarck, T.; Mermelstein, R. A global measure of perceived stress. J. Health Soc. Behav. 1983, 24, 385–396. [Google Scholar] [CrossRef]
- Michielsen, H.J.; De Vries, J.; Van Heck, G.L.; Van De Vijver, F.J.R.; Sijtsma, K. Examination of the Dimensionality of Fatigue The Construction of the Fatigue Assessment Scale (FAS). Eur. J. Psychol. Assess. 2004, 20, 39–48. [Google Scholar] [CrossRef]
- Merckelbach, H.; Muris, P.; Nijman, H.; De Jong, P.J. Self-reported cognitive failures and neurotic symptomatology. Pers. Individ. Dif. 1996, 20, 715–724. [Google Scholar] [CrossRef]
- Ponds, R.; van Boxtel, M.J.J. “Cognitive Failure Questionnaire” als maat voor subjectief cognitief functioneren. Tijdschr. Neuropsychol. 2006, 2, 37–45. [Google Scholar]
- Poesen, K.; De Schaepdryver, M.; Stubendorff, B.; Gille, B.; Muckova, P.; Wendler, S.; Prell, T.; Ringer, T.M.; Rhode, H.; Stevens, O.; et al. Neurofilament markers for ALS correlate with extent of upper and lower motor neuron disease. Neurology 2017, 88, 2302–2309. [Google Scholar] [CrossRef]
- Gaiottino, J.; Norgren, N.; Dobson, R.; Topping, J.; Nissim, A.; Malaspina, A.; Bestwick, J.P.; Monsch, A.U.; Regeniter, A.; Lindberg, R.L.; et al. Increased Neurofilament Light Chain Blood Levels in Neurodegenerative Neurological Diseases. PLoS ONE 2013, 8, e75091. [Google Scholar] [CrossRef]
- Carr, E.J.; Dooley, J.; Garcia-Perez, J.E.; Lagou, V.; Lee, J.C.; Wouters, C.; Meyts, I.; Goris, A.; Boeckxstaens, G.; Linterman, M.A.; et al. The cellular composition of the human immune system is shaped by age and cohabitation. Nat. Immunol. 2016, 17, 461–468. [Google Scholar] [CrossRef]
- Fan, H.G.M.; Houédé-Tchen, N.; Yi, Q.-L.; Chemerynsky, I.; Downie, F.P.; Sabate, K.; Tannock, I.F. Fatigue, menopausal symptoms, and cognitive function in women after adjuvant chemotherapy for breast cancer: 1- and 2-year follow-up of a prospective controlled study. J. Clin. Oncol. 2005, 23, 8025–8032. [Google Scholar] [CrossRef] [PubMed]
- Ganz, P.A.; Bower, J.E.; Kwan, L.; Castellon, S.A.; Silverman, D.H.S.; Geist, C.; Breen, E.C.; Irwin, M.R.; Cole, S.W. Does tumor necrosis factor-alpha (TNF-a) play a role in post-chemotherapy cerebral dysfunction ? Brain Behav. Immun. 2013, 30, S99–S108. [Google Scholar] [CrossRef] [PubMed]
- Kesler, S.; Janelsins, M.; Koovakkattu, D.; Palesh, O.; Mustian, K.; Morrow, G.; Dhabhar, F.S. Reduced hippocampal volume and verbal memory performance associated with interleukin-6 and tumor necrosis factor-alpha levels in chemotherapy-treated breast cancer survivors. Brain. Behav. Immun. 2013, 30, S109–S116. [Google Scholar] [CrossRef]
- Poesen, K.; Van Damme, P. Diagnostic and Prognostic Performance of Neurofilaments in ALS. Front. Neurol. 2019, 9, 1167. [Google Scholar] [CrossRef]
- Vichaya, E.G.; Chiu, G.S.; Krukowski, K.; Lacourt, T.E.; Kavelaars, A.; Dantzer, R.; Heijnen, C.J.; Walker, A.K. Mechanisms of chemotherapy-induced behavioral toxicities. Front. Neurosci. 2015, 9, 131. [Google Scholar] [CrossRef] [PubMed]
- Sandelius, Å.; Zetterberg, H.; Blennow, K.; Adiutori, R.; Malaspina, A.; Laura, M.; Reilly, M.M.; Rossor, A.M. Plasma neurofilament light chain concentration in the inherited peripheral neuropathies. Neurology 2018, 90, e518–e524. [Google Scholar] [CrossRef] [PubMed]
- Louwsma, J.; Brunger, A.F.; Bijzet, J.; Kroesen, B.J.; Roeloffzen, W.W.H.; Bischof, A.; Kuhle, J.; Drost, G.; Lange, F.; Kuks, J.B.M.; et al. Neurofilament light chain, a biomarker for polyneuropathy in systemic amyloidosis. Amyloid 2021, 28, 50–55. [Google Scholar] [CrossRef]
- Bergman, J.; Dring, A.; Zetterberg, H.; Blennow, K.; Norgren, N.; Gilthorpe, J.; Bergenheim, T.; Svenningsson, A. Neurofilament light in CSF and serum is a sensitive marker for axonal white matter injury in MS. Neurol. Neuroimmunol. Neuroinflamm. 2016, 3, 271. [Google Scholar] [CrossRef]
- Lima Giacobbo, B.; Doorduin, J.; Klein, H.C.; Dierckx, R.A.J.O.; Bromberg, E.; de Vries, E.F.J. Brain-Derived Neurotrophic Factor in Brain Disorders: Focus on Neuroinflammation. Mol. Neurobiol. 2019, 56, 3295–3312. [Google Scholar] [CrossRef]
- Vardy, J.L.; Stouten-Kemperman, M.M.; Pond, G.; Booth, C.M.; Rourke, S.B.; Dhillon, H.M.; Dodd, A.; Crawley, A.; Tannock, I.F. A mechanistic cohort study evaluating cognitive impairment in women treated for breast cancer. Brain Imaging Behav. 2019, 13, 15–26. [Google Scholar] [CrossRef]
- Seigers, R.; Loos, M.; Van Tellingen, O.; Boogerd, W.; Smit, A.B.; Schagen, S.B. Neurobiological changes by cytotoxic agents in mice. Behav. Brain Res. 2016, 299, 19–26. [Google Scholar] [CrossRef]
- Winocur, G.; Johnston, I.; Castel, H. Chemotherapy and cognition: International cognition and cancer task force recommendations for harmonising preclinical research. Cancer Treat. Rev. 2018, 69, 72–83. [Google Scholar] [CrossRef] [PubMed]
- Seigers, R.; Fardell, J.E. Neurobiological basis of chemotherapy-induced cognitive impairment: A review of rodent research. Neurosci. Biobehav. Rev. 2011, 35, 729–741. [Google Scholar] [CrossRef] [PubMed]
- Dahoun, T.; Calcia, M.A.; Veronese, M.; Bloomfield, P.; Reis Marques, T.; Turkheimer, F.; Howes, O.D. The association of psychosocial risk factors for mental health with a brain marker altered by inflammation: A translocator protein (TSPO) PET imaging study. Brain. Behav. Immun. 2019, 80, 742–750. [Google Scholar] [CrossRef] [PubMed]
- Sleurs, C.; Lemiere, J.; Christiaens, D.; Billiet, T.; Peeters, R.; Sunaert, S.; Uyttebroeck, A.; Deprez, S. Advanced MR diffusion imaging and chemotherapy-related changes in cerebral white matter microstructure of survivors of childhood bone and soft tissue sarcoma? Hum. Brain Mapp. 2018, 39, 3375–3387. [Google Scholar] [CrossRef]
- Menning, S.; De Ruiter, M.B.; Veltman, D.J.; Boogerd, W.; Oldenburg, H.S.A.; Reneman, L.; Schagen, S.B. Changes in brain white matter integrity after systemic treatment for breast cancer: A prospective longitudinal study. Brain Imaging Behav. 2017, 12, 324–334. [Google Scholar] [CrossRef]
- Garg, N.; Reddel, S.W.; Miller, D.H.; Chataway, J.; Riminton, D.S.; Barnett, Y.; Masters, L.; Barnett, M.H.; Hardy, T.A. The corpus callosum in the diagnosis of multiple sclerosis and other CNS demyelinating and inflammatory diseases. J. Neurol. Neurosurg. Psychiatry 2015, 86, 1374–1382. [Google Scholar] [CrossRef]
- Nettis, M.A.; Veronese, M.; Nikkheslat, N.; Mariani, N.; Lombardo, G.; Sforzini, L.; Enache, D.; Harrison, N.A.; Turkheimer, F.E.; Mondelli, V.; et al. PET imaging shows no changes in TSPO brain density after IFN-α immune challenge in healthy human volunteers. Transl. Psychiatry 2020, 10, 89. [Google Scholar] [CrossRef]
- Kang, S.; Lee, S.; Kim, J.; Kim, J.C.; Kim, S.H.; Son, Y.; Shin, T.; Youn, B.H.; Kim, J.S.; Wang, H.; et al. Chronic treatment with combined chemotherapeutic agents affects hippocampal micromorphometry and function in mice, independently of neuroinflammation. Exp. Neurobiol. 2018, 27, 419–436. [Google Scholar] [CrossRef] [PubMed]
- Oldoni, E.; Smets, I.; Mallants, K.; Vandebergh, M.; Van Horebeek, L.; Poesen, K.; Dupont, P.; Dubois, B.; Goris, A. CHIT1 at Diagnosis Reflects Long-Term Multiple Sclerosis Disease Activity. Ann. Neurol. 2020, 87, 633–645. [Google Scholar] [CrossRef]
- Kreisl, W.C.; Kim, M.J.; Coughlin, J.M.; Henter, I.D.; Owen, D.R.; Innis, R.B. PET imaging of neuroinflammation in neurological disorders. Lancet Neurol. 2020, 19, 940–950. [Google Scholar] [CrossRef]
- Owen, D.R.; Narayan, N.; Wells, L.; Healy, L.; Smyth, E.; Rabiner, E.A.; Galloway, D.; Williams, J.B.; Lehr, J.; Mandhair, H.; et al. Pro-inflammatory activation of primary microglia and macrophages increases 18 kDa translocator protein expression in rodents but not humans. J. Cereb. Blood Flow Metab. 2017, 37, 2679–2690. [Google Scholar] [CrossRef] [PubMed]
- Van Dyk, K.; Bower, J.E.; Crespi, C.M.; Petersen, L.; Ganz, P.A. Cognitive function following breast cancer treatment and associations with concurrent symptoms. NPJ Breast Cancer 2018, 4, 25. [Google Scholar] [CrossRef] [PubMed]
- Weber, M.T.; Mapstone, M.; Staskiewicz, J.; Maki, P.M. Reconciling subjective memory complaints with objective memory performance in the menopausal transition. Menopause 2012, 19, 735–741. [Google Scholar] [CrossRef]

| Characteristic | Whole Sample | PET Subsample | ||||||||||||
|---|---|---|---|---|---|---|---|---|---|---|---|---|---|---|
| C+ n = 19 | C− n = 18 | HC n = 37 | Group Difference p Value * | C+ n = 15 | C− n = 15 | HC n = 15 | Group Difference p Value * | |||||||
| Age in years, mean (SD) | 47 | (10) | 50 | (6) | 45 | (10) | 0.092 | 51 | (8) | 49 | (6) | 44 | (10) | 0.059 |
| Education in years, mean (SD) | 13 | (4) | 14 | (3) | 15 | (2) | 0.315 | 13 | (3) | 14 | (3) | 14 | (2) | 0.872 |
| Body-mass index in kg/m2, mean (SD) | 25 | (4) | 25 | (5) | 24 | (3) | 0.184 | 25 | (4) | 25 | (5) | 23 | (3) | 0.400 |
| Postmenopausal at diagnosis, no. (%) | 9 | (47) | 8 | (44) | - | 0.999 † | 9 | (60) | 6 | (40) | - | 0.273 † | ||
| Post- or perimenopausal at assessment, no. (%) | 15 | (79) | 8 | (44) | 13 | (34) | 0.006 † | 14 | (93) | 6 | (40) | 4 | (27) | 0.001 † |
| Days since end of chemotherapy/surgery, mean (SD) | 26 | (17) | 36 | (12) | - | 0.025 | 28 | (13) | 36 | (12) | - | 0.106 | ||
| Breast cancer stage, no. (%) | <0.001 † | 0.002 † | ||||||||||||
| 0–1 | 0 | (0) | 10 | (55) | - | - | 0 | (0) | 8 | (53) | - | - | ||
| 2 | 6 | (32) | 7 | (39) | - | - | 6 | (40) | 6 | (40) | - | - | ||
| 3 | 13 | (68) | 1 | (6) | - | - | 9 | (60) | 1 | (1) | - | - | ||
| Cancer treatment, no. (%) | ||||||||||||||
| Neo-adjuvant chemotherapy (EC + T) | 8 | (42) | - | - | - | 8 | (53) | - | - | - | ||||
| Scheduled for radiotherapy | 13 | (68) | 11 | (61) | - | - | 10 | (67) | 9 | (60) | - | - | ||
| Scheduled for anti-hormone therapy | 9 | (47) | 14 | (78) | - | - | 8 | (53) | 12 | (80) | - | - | ||
| High affinity binders, no. (%) | - | - | - | - | 9 | (60) | 7 | (53) | 7 | (47) | 0.809 † | |||
| Injected activity in MBq, mean (SD) | - | - | - | - | 144 | (12) | 144 | (15) | 144 | (21) | 0.983 | |||
| C+ n = 19 | C− n = 18 | HC n = 33 | Group Difference p Value * | Post-hoc p Value | ||||||
|---|---|---|---|---|---|---|---|---|---|---|
| C+ vs. HC | C− vs. HC | C+ vs. C− | ||||||||
| Cognition (C+ n = 18) | ||||||||||
| Global deficit score, mean (SD) | 0.27 | (0.27) | 0.21 | (0.14) | - | 0.388 | - | - | - | |
| Impaired, no. (%) (GDS) | 3 | (17) | 0 | (0) | - | 0.286 † | - | - | - | |
| Self-report cognitively impaired, no. (%) (CFQTOT) | 4 | (22) | 1 | (6) | 0 | (0) | 0.434 † | - | - | - |
| Self-report, mean (SD) (C+ n = 18) | ||||||||||
| Beck depression inventory | 10.83 | (5.25) | 7.28 | (6.62) | 4.11 | (3.45) | <0.001 | <0.001 | 0.040 | 0.034 |
| Spielberger state-trait anxiety inventory | 41.00 | (11.62) | 37.83 | (14.36) | 31.74 | (9.09) | 0.008 | 0.005 | 0.053 | 0.407 |
| Self-perceived stress scale | 16.67 | (6.75) | 15.44 | (9.82) | 9.20 | (6.06) | 0.001 | 0.001 | 0.006 | 0.638 |
| Fatigue assessment scale | 28.17 | (6.41) | 26.17 | (7.39) | 19.43 | (5.79) | <0.001 | <0.001 | 0.001 | 0.324 |
| CFQ total score | 39.61 | (15.31) | 33.50 | (13.54) | 25.38 | (8.00) | 0.001 | <0.001 | 0.026 | 0.130 |
| Inflammatory markers, median pg/mL (IQR) | ||||||||||
| bNGF | 18.20 | (8.87) | 16.52 | (9.80) | 19.29 | (9.48) | 0.961 | - | - | - |
| CRP, mg/L | 1.20 | (0.90) | 1.30 | (2.75) | 0.85 | (0.65) | 0.240 | - | - | - |
| Eotaxin | 27.07 | (5.85) | 29.58 | (11.84) | 28.66 | (12.31) | 0.555 | - | - | - |
| IFN-g | 3.39 | (1.91) | 3.39 | (1.55) | 2.68 | (1.27) | 0.471 | - | - | - |
| IL-1a | 1.20 | (0.93) | 1.29 | (1.72) | 1.03 | (1.01) | 0.668 † | - | - | - |
| IL-1b | 1.16 | (0.82) | 2.27 | (3.00) | 1.16 | (1.23) | 0.440 † | - | - | - |
| IL-4 | 12.70 | (5.54) | 11.87 | (7.10) | 10.50 | (3.88) | 0.578 | - | - | - |
| IL-6 | 7.66 | (5.04) | 6.41 | (3.02) | 4.60 | (2.98) | 0.031 | 0.010 | 0.402 | 0.093 |
| IL-8 | 9.68 | (3.81) | 8.58 | (12.23) | 5.31 | (3.81) | 0.001 | 0.008 | 0.001 | 0.446 |
| IL-10 | 1.24 | (0.93) | 0.97 | (0.63) | 0.97 | (0.66) | 0.638 | - | - | - |
| IL-12 | 2.00 | (0.40) | 2.10 | (0.35) | 1.95 | (0.27) | 0.187 | - | - | - |
| IL-18 | 36.55 | (27.75) | 31.10 | (7.85) | 33.47 | (24.51) | 0.751 | - | - | - |
| MCP-1 | 70.33 | (33.35) | 61.54 | (25.56) | 47.64 | (16.70) | <0.001 | <0.001 | 0.033 | 0.069 |
| MIP-1B | 146.36 | (101.06) | 105.73 | (121.97) | 79.78 | (53.70) | 0.006 | 0.002 | 0.098 | 0.210 |
| TNF-a | 0.64 | (1.24) | 1.39 | (2.44) | 0.88 | (1.39) | 0.575 † | - | - | - |
| VCAM-1 | 93294 | (41634) | 73552 | (47979) | 91143 | (52101) | 0.051 | - | - | - |
| VEGF-A | 24.15 | (18.88) | 27.56 | (15.50) | 31.98 | (24.97) | 0.338 | - | - | - |
| Neuronal survival markers, median pg/mL (IQR) | ||||||||||
| BDNF | 617.24 | (472.04) | 741.98 | (843.38) | 1110.17 | (482.29) | 0.010 | 0.011 | 0.484 | 0.089 |
| NfL | 339.00 | (399.00) | 16.55 | (19.84) | 14.38 | (11.68) | <0.001 | <0.001 | 0.475 | <0.001 |
Publisher’s Note: MDPI stays neutral with regard to jurisdictional claims in published maps and institutional affiliations. |
© 2021 by the authors. Licensee MDPI, Basel, Switzerland. This article is an open access article distributed under the terms and conditions of the Creative Commons Attribution (CC BY) license (https://creativecommons.org/licenses/by/4.0/).
Share and Cite
Schroyen, G.; Blommaert, J.; van Weehaeghe, D.; Sleurs, C.; Vandenbulcke, M.; Dedoncker, N.; Hatse, S.; Goris, A.; Koole, M.; Smeets, A.; et al. Neuroinflammation and Its Association with Cognition, Neuronal Markers and Peripheral Inflammation after Chemotherapy for Breast Cancer. Cancers 2021, 13, 4198. https://doi.org/10.3390/cancers13164198
Schroyen G, Blommaert J, van Weehaeghe D, Sleurs C, Vandenbulcke M, Dedoncker N, Hatse S, Goris A, Koole M, Smeets A, et al. Neuroinflammation and Its Association with Cognition, Neuronal Markers and Peripheral Inflammation after Chemotherapy for Breast Cancer. Cancers. 2021; 13(16):4198. https://doi.org/10.3390/cancers13164198
Chicago/Turabian StyleSchroyen, Gwen, Jeroen Blommaert, Donatienne van Weehaeghe, Charlotte Sleurs, Mathieu Vandenbulcke, Nina Dedoncker, Sigrid Hatse, An Goris, Michel Koole, Ann Smeets, and et al. 2021. "Neuroinflammation and Its Association with Cognition, Neuronal Markers and Peripheral Inflammation after Chemotherapy for Breast Cancer" Cancers 13, no. 16: 4198. https://doi.org/10.3390/cancers13164198
APA StyleSchroyen, G., Blommaert, J., van Weehaeghe, D., Sleurs, C., Vandenbulcke, M., Dedoncker, N., Hatse, S., Goris, A., Koole, M., Smeets, A., van Laere, K., Sunaert, S., & Deprez, S. (2021). Neuroinflammation and Its Association with Cognition, Neuronal Markers and Peripheral Inflammation after Chemotherapy for Breast Cancer. Cancers, 13(16), 4198. https://doi.org/10.3390/cancers13164198