
Measuring NQO1 Bioactivation Using [2H7]Glucose


Abstract
Simple Summary
Abstract

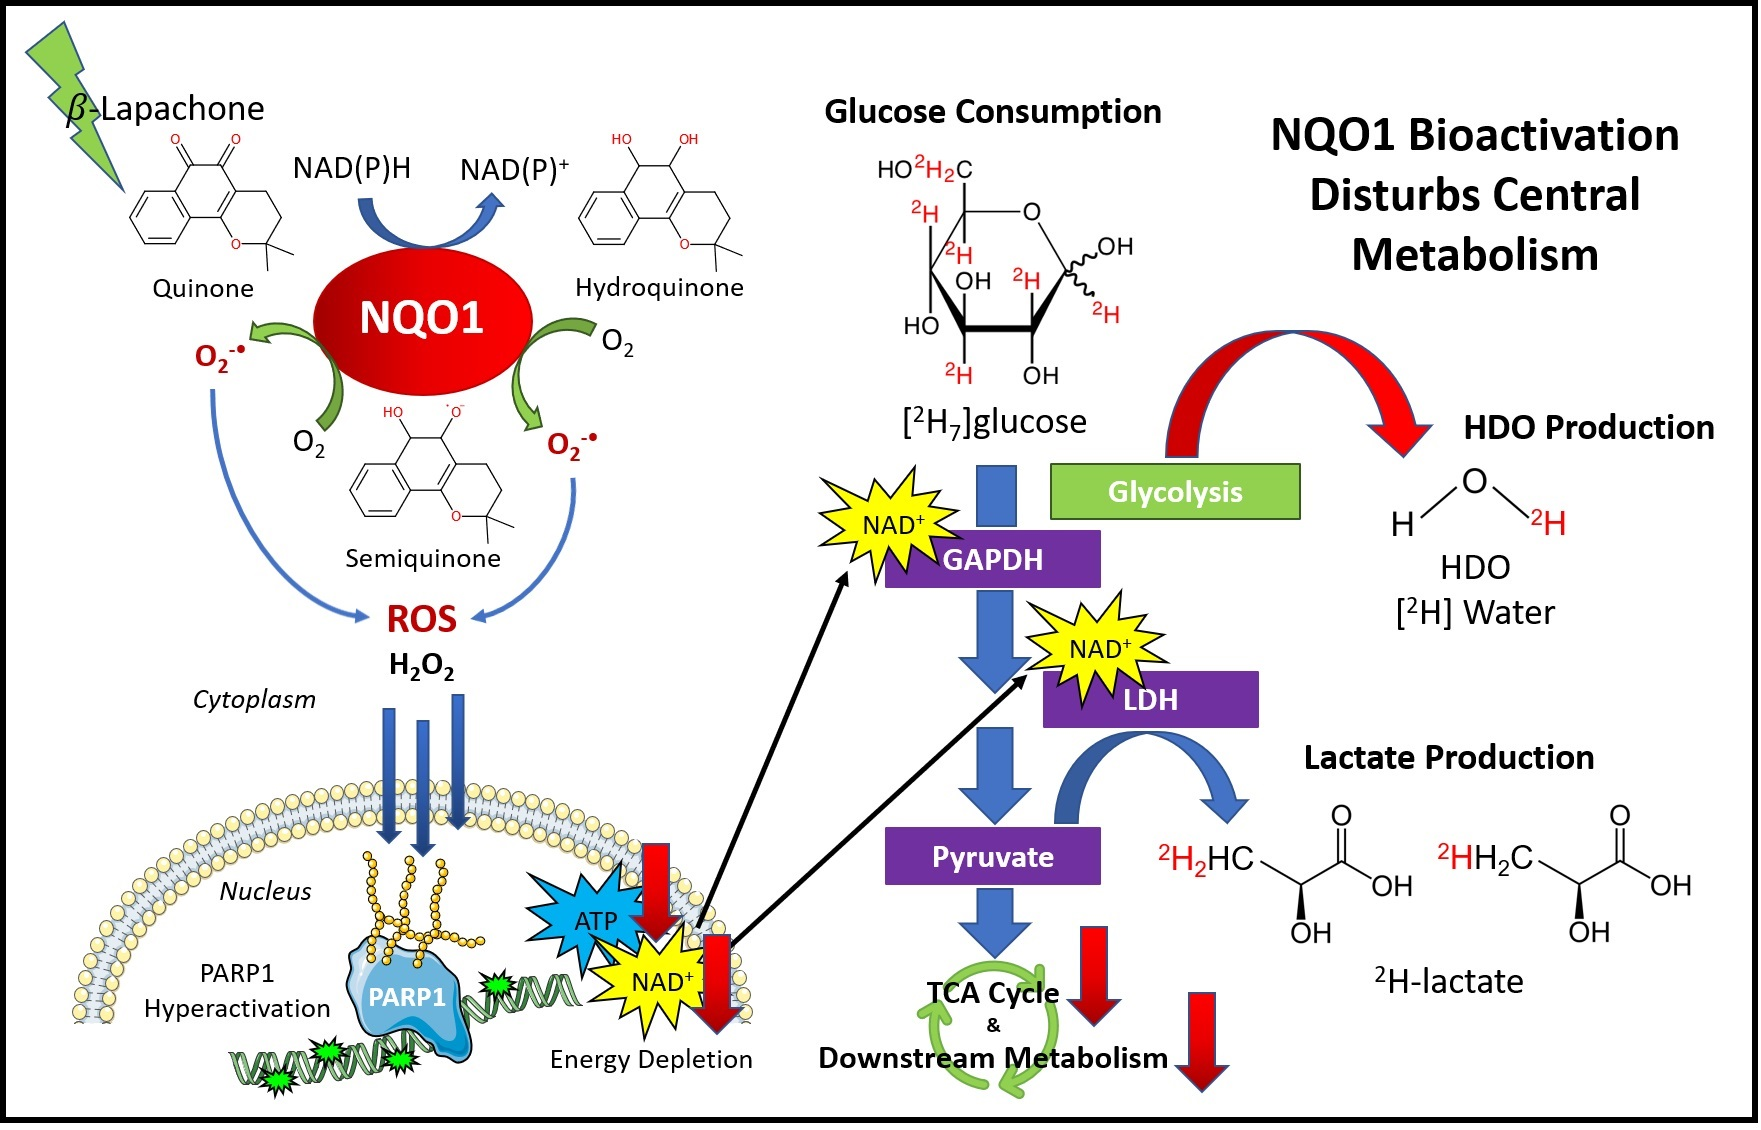
1. Introduction
2. Materials and Methods
2.1. Cell Lines, Chemicals, and Media
2.2. Cell Culture
2.3. NMR Sample Preparation
2.4. 2H-NMR Spectroscopy
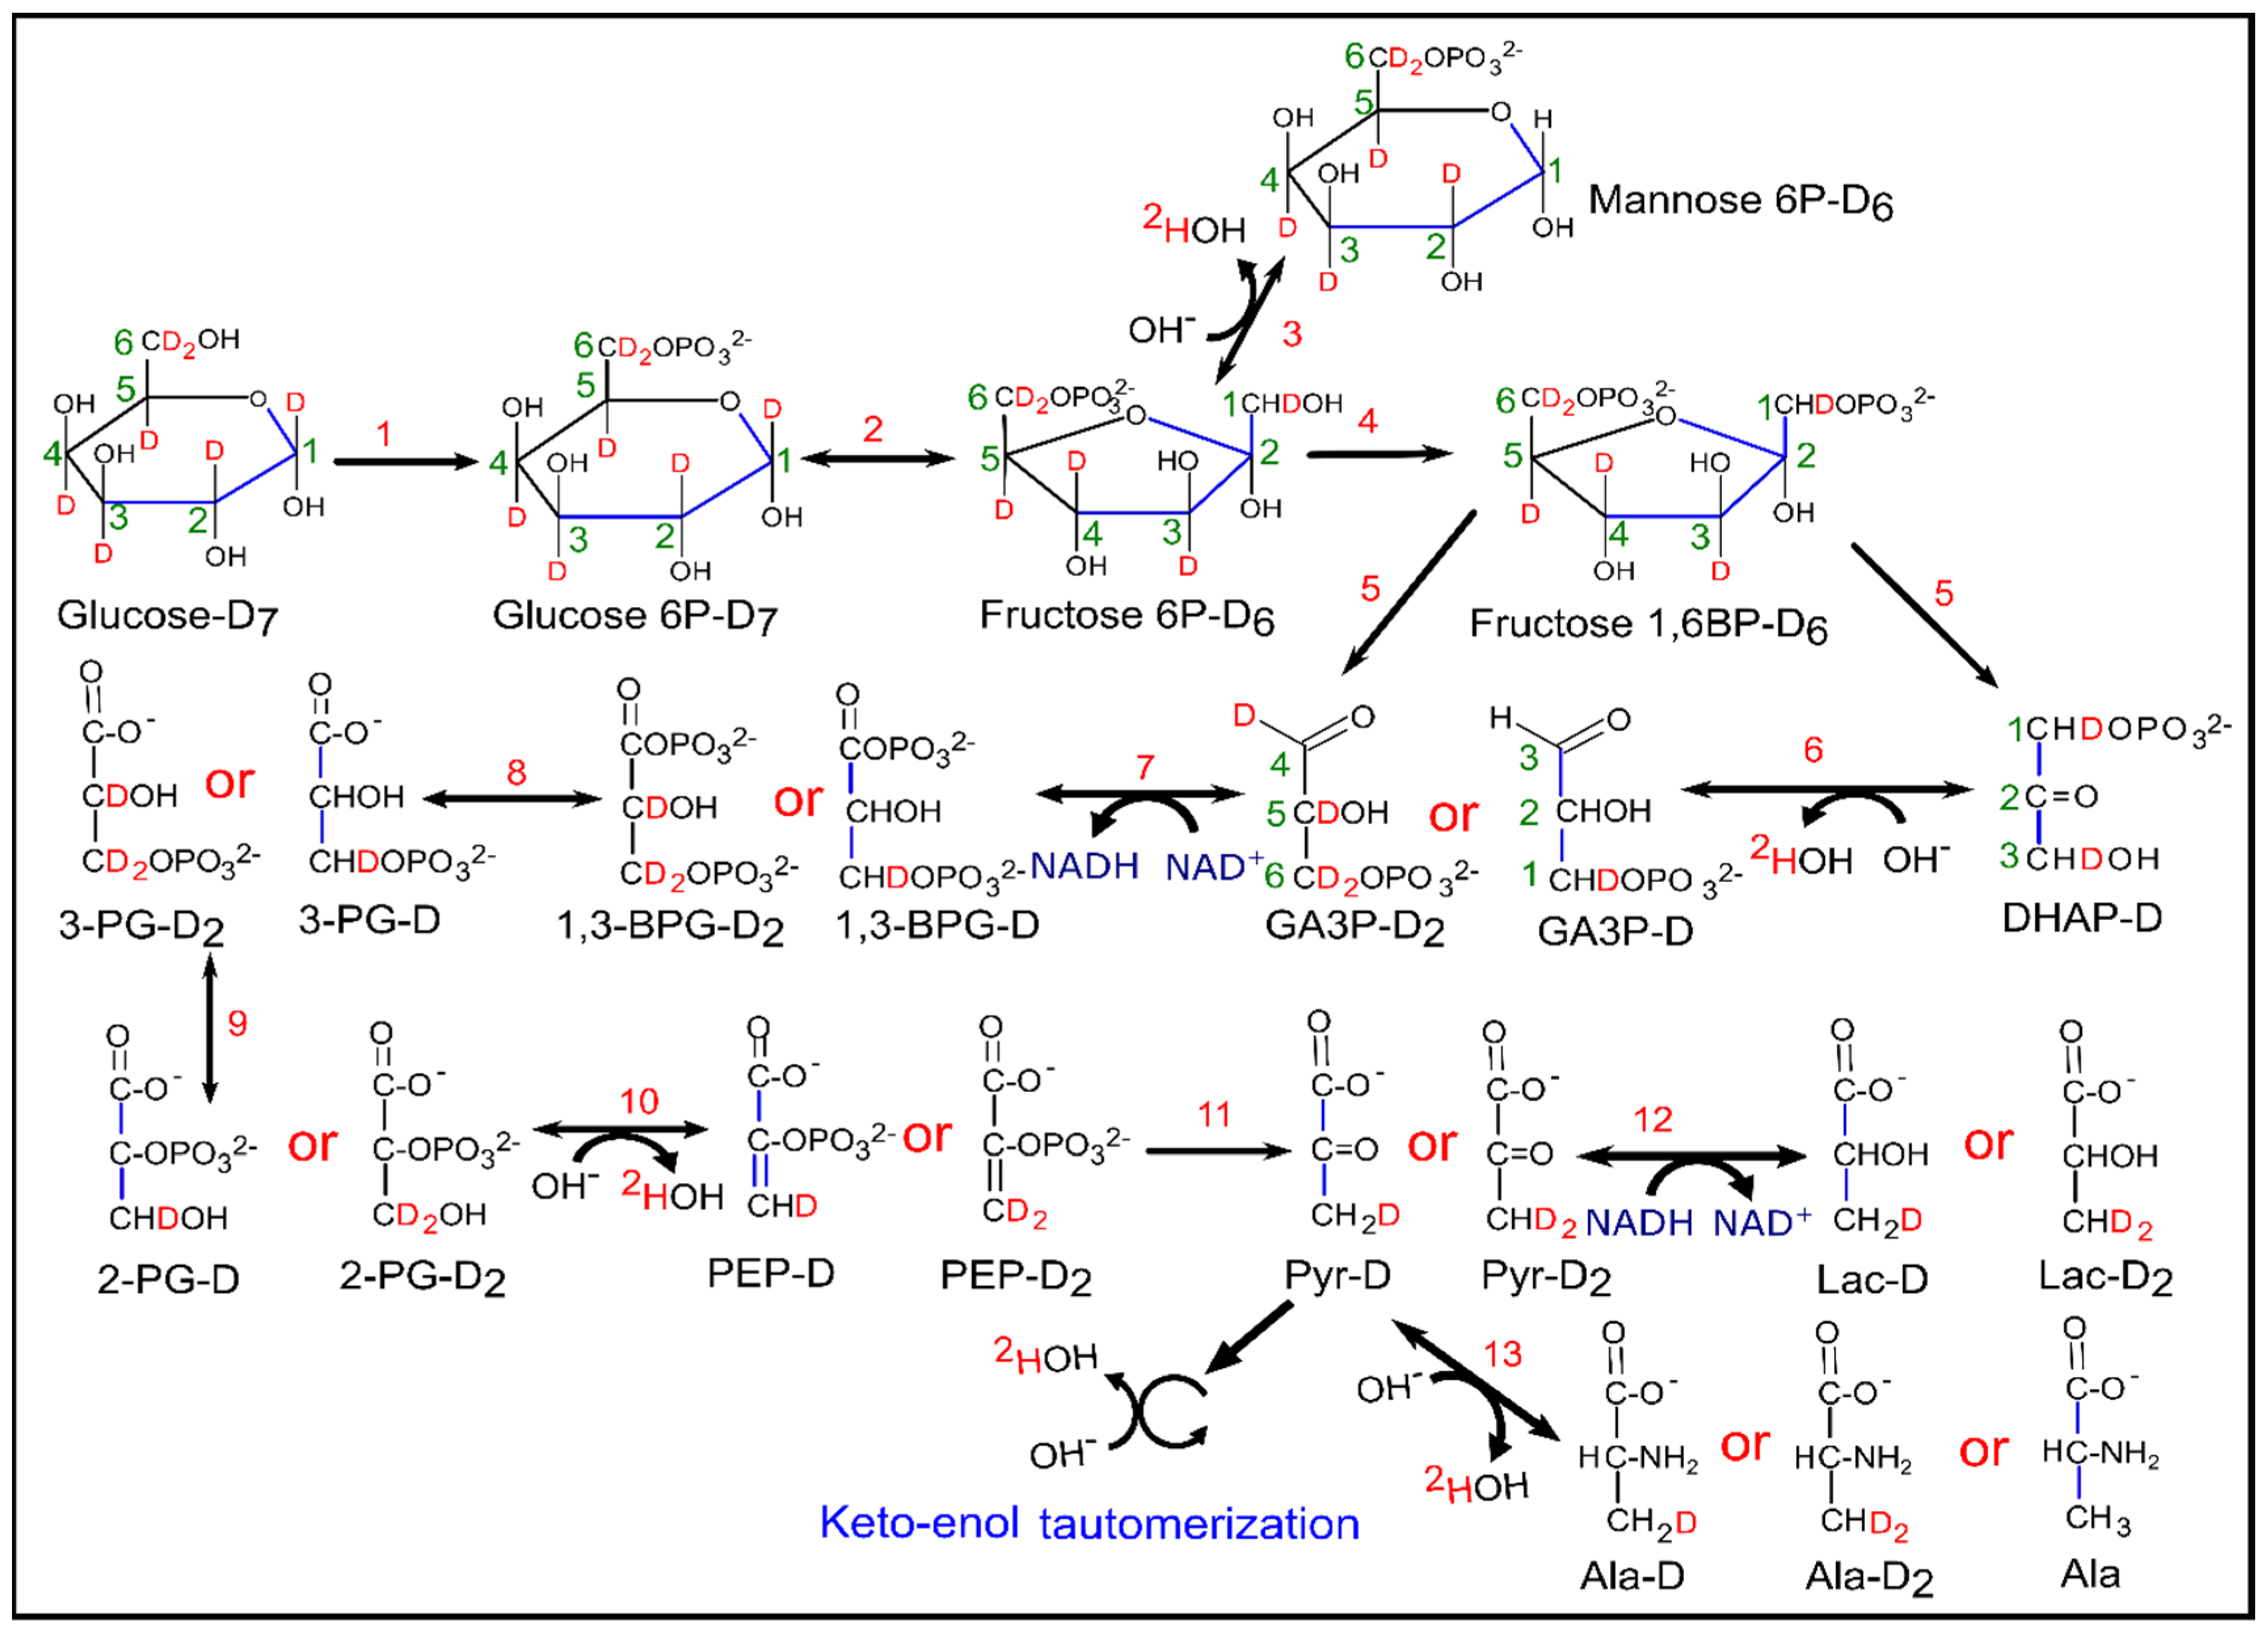
2.5. 2H-NMR Data Processing and Quantification of HDO, 2H-Lactate, and Residual [2H7]Glucose
2.6. GC-MS Sample Preparation
2.7. GC-MS Analysis
3. Results
3.1. 2H-NMR Spectra of Cell Culture Media
3.2. Quantification of the 2H-Lactate, HDO and [2H7]Glucose in Cell Media
3.3. Correlation between [2H7]Glucose Consumption and 2H-Lactate, HDO Production
3.4. Correlation between 2H-Lactate and HDO Production
3.5. Fractional Enrichment of Lactate and Citrate Isotopologues
3.6. Oxygen Consumption Rate of the Cancer Cell Lines
3.7. Metabolic Profiling of Control and β-Lapachone Treated Cancer Cell Lines
4. Discussion
5. Conclusions
Supplementary Materials
Author Contributions
Funding
Institutional Review Board Statement
Informed Consent Statement
Data Availability Statement
Acknowledgments
Conflicts of Interest
References
- Pavlova, N.N.; Thompson, C.B. The Emerging Hallmarks of Cancer Metabolism. Cell Metab. 2016, 23, 27–47. [Google Scholar] [CrossRef] [PubMed]
- Phan, L.M.; Yeung, S.-C.J.; Lee, M.-H. Cancer Metabolic Reprogramming: Importance, Main Features, and Potentials for Precise Targeted Anti-Cancer Therapies. Cancer Biol. Med. 2014, 11, 1–19. [Google Scholar] [CrossRef]
- Warburg, O. On Respiratory Impairment in Cancer Cells. Science 1956, 124, 269–270. [Google Scholar] [PubMed]
- Gatenby, R.A.; Gillies, R.J. Why Do Cancers Have High Aerobic Glycolysis? Nat. Rev. Cancer 2004, 4, 891–899. [Google Scholar] [CrossRef] [PubMed]
- Vander Heiden, M.G.; DeBerardinis, R.J. Understanding the Intersections between Metabolism and Cancer Biology. Cell 2017, 168, 657–669. [Google Scholar] [CrossRef] [PubMed]
- Chakrabarti, G.; Silvers, M.A.; Ilcheva, M.; Liu, Y.; Moore, Z.R.; Luo, X.; Gao, J.; Anderson, G.; Liu, L.; Sarode, V.; et al. Tumor-Selective Use of DNA Base Excision Repair Inhibition in Pancreatic Cancer Using the NQO1 Bioactivatable Drug, β-Lapachone. Sci. Rep. 2015, 5, 17066. [Google Scholar] [CrossRef] [PubMed]
- Belinsky, M.; Jaiswal, A.K. NAD(P)H:Quinone Oxidoreductase1 (DT-Diaphorase) Expression in Normal and Tumor Tissues. Cancer Metastasis Rev. 1993, 12, 103–117. [Google Scholar] [CrossRef] [PubMed]
- Joseph, P.; Xie, T.; Xu, Y.; Jaiswal, A.K. NAD(P)H:Quinone Oxidoreductase1 (DT-Diaphorase): Expression, Regulation, and Role in Cancer. Oncol. Res. 1994, 6, 525–532. [Google Scholar]
- Pink, J.J.; Planchon, S.M.; Tagliarino, C.; Varnes, M.E.; Siegel, D.; Boothman, D.A. NAD(P)H:Quinone Oxidoreductase Activity Is the Principal Determinant of β-Lapachone Cytotoxicity. J. Biol. Chem. 2000, 275, 5416–5424. [Google Scholar] [CrossRef]
- Ross, D.; Siegel, D. Functions of NQO1 in Cellular Protection and CoQ10 Metabolism and Its Potential Role as a Redox Sensitive Molecular Switch. Front. Physiol. 2017, 8, 595. [Google Scholar] [CrossRef]
- Silvers, M.A.; Deja, S.; Singh, N.; Egnatchik, R.A.; Sudderth, J.; Luo, X.; Beg, M.S.; Burgess, S.C.; DeBerardinis, R.J.; Boothman, D.A.; et al. The NQO1 Bioactivatable Drug, β-Lapachone, Alters the Redox State of NQO1+ Pancreatic Cancer Cells, Causing Perturbation in Central Carbon Metabolism. J. Biol. Chem. 2017, 292, 18203–18216. [Google Scholar] [CrossRef]
- Moore, Z.; Chakrabarti, G.; Luo, X.; Ali, A.; Hu, Z.; Fattah, F.J.; Vemireddy, R.; DeBerardinis, R.J.; Brekken, R.A.; Boothman, D.A. NAMPT Inhibition Sensitizes Pancreatic Adenocarcinoma Cells to Tumor-Selective, PAR-Independent Metabolic Catastrophe and Cell Death Induced by β-Lapachone. Cell Death Dis. 2015, 6, e1599. [Google Scholar] [CrossRef]
- Gerber, D.E.; Beg, M.S.; Fattah, F.; Frankel, A.E.; Fatunde, O.; Arriaga, Y.; Dowell, J.E.; Bisen, A.; Leff, R.D.; Meek, C.C.; et al. Phase 1 Study of ARQ 761, a β-Lapachone Analogue That Promotes NQO1-Mediated Programmed Cancer Cell Necrosis. Br. J. Cancer 2018, 119, 928–936. [Google Scholar] [CrossRef]
- Iasonos, A.; O’Quigley, J. Adaptive Dose-Finding Studies: A Review of Model-Guided Phase I Clinical Trials. J. Clin. Oncol. 2014, 32, 2505–2511. [Google Scholar] [CrossRef]
- Linet, M.S.; Slovis, T.L.; Miller, D.L.; Kleinerman, R.; Lee, C.; Rajaraman, P.; Gonzalez, D.A.B. Cancer Risks Associated With External Radiation From Diagnostic Imaging Procedures. CA Cancer J. Clin. 2012, 62, 75–100. [Google Scholar] [CrossRef] [PubMed]
- Kaushik, A.; Jaimini, A.; Tripathi, M.; Souza, M.D.; Sharma, R.; Mondal, A. Estimation of Radiation Dose to Patients from 18 FDG Whole Body PET / CT Investigations Using Dynamic PET Scan Protocol. Indian J. Med. Res. 2015, 721–731. [Google Scholar] [CrossRef]
- Mahar, R.; Donabedian, P.L.; Merritt, M.E. HDO Production from [2H7]Glucose Quantitatively Identifies Warburg Metabolism. Sci. Rep. 2020, 10, 8885. [Google Scholar] [CrossRef] [PubMed]
- Mahar, R.; Zeng, H.; Giacalone, A.; Ragavan, M.; Mareci, T.H.; Merritt, M.E. Deuterated Water Imaging of the Rat Brain Following Metabolism of [2H7]Glucose. Magn. Reson. Med. 2021, mrm.28700. [Google Scholar] [CrossRef]
- De Feyter, H.M.; Behar, K.L.; Corbin, Z.A.; Fulbright, R.K.; Brown, P.B.; McIntyre, S.; Nixon, T.W.; Rothman, D.L.; de Graaf, R.A. Deuterium Metabolic Imaging (DMI) for MRI-Based 3D Mapping of Metabolism in Vivo. Sci. Adv. 2018, 4, eaat7314. [Google Scholar] [CrossRef] [PubMed]
- Bey, E.A.; Bentle, M.S.; Reinicke, K.E.; Dong, Y.; Yang, C.-R.; Girard, L.; Minna, J.D.; Bornmann, W.G.; Gao, J.; Boothman, D.A. An NQO1- and PARP-1-Mediated Cell Death Pathway Induced in Non-Small-Cell Lung Cancer Cells by β-Lapachone. Proc. Natl. Acad. Sci. USA 2007, 104, 11832–11837. [Google Scholar] [CrossRef]
- Kim, D.; Cho, J.-Y. NQO1 Is Required for β-Lapachone-Mediated Downregulation of Breast-Cancer Stem-Cell Activity. Int. J. Mol. Sci. 2018, 19, 3813. [Google Scholar] [CrossRef] [PubMed]
- Lajin, B.; Alachkar, A. The NQO1 Polymorphism C609T (Pro187Ser) and Cancer Susceptibility: A Comprehensive Meta-Analysis. Br. J. Cancer 2013, 109, 1325–1337. [Google Scholar] [CrossRef] [PubMed]
- Anwar, A.; Dehn, D.; Siegel, D.; Kepa, J.K.; Tang, L.J.; Pietenpol, J.A.; Ross, D. Interaction of Human NAD(P)H:Quinone Oxidoreductase 1 (NQO1) with the Tumor Suppressor Protein P53 in Cells and Cell-Free Systems. J. Biol. Chem. 2003, 278, 10368–10373. [Google Scholar] [CrossRef]
- Huang, X.; Motea, E.A.; Moore, Z.R.; Yao, J.; Dong, Y.; Chakrabarti, G.; Kilgore, J.A.; Silvers, M.A.; Patidar, P.L.; Cholka, A.; et al. Leveraging an NQO1 Bioactivatable Drug for Tumor-Selective Use of Poly(ADP-Ribose) Polymerase Inhibitors. Cancer Cell 2016, 30, 940–952. [Google Scholar] [CrossRef]
- Young, J.D. INCA: A Computational Platform for Isotopically Non-Stationary Metabolic Flux Analysis. Bioinformatics 2014, 30, 1333–1335. [Google Scholar] [CrossRef]
- Ackerman, J.J.H.; Ewy, C.S.; Becker, N.N.; Shalwitz, R.A. Deuterium Nuclear Magnetic Resonance Measurements of Blood Flow and Tissue Perfusion Employing 2H2O as a Freely Diffusible Tracer. Proc. Natl. Acad. Sci. USA 1987, 84, 4099–4102. [Google Scholar] [CrossRef]
- Ewy, C.S.; Ackerman, J.J.H.; Balaban, R.S. Deuterium NMR Cerebral Imaging in Situ. Magn. Reson. Med. 1988, 8, 35–44. [Google Scholar] [CrossRef] [PubMed]
- Lu, M.; Zhu, X.-H.; Zhang, Y.; Mateescu, G.; Chen, W. Quantitative Assessment of Brain Glucose Metabolic Rates Using in Vivo Deuterium Magnetic Resonance Spectroscopy. J. Cereb. Blood Flow Metab. 2017, 37, 3518–3530. [Google Scholar] [CrossRef]
- Klein, P.D.; Klein, E.R. Stable Isotopes: Origins and Safety. J. Clin. Pharmacol. 1986, 26, 378–382. [Google Scholar] [CrossRef]
- Funk, A.M.; Anderson, B.L.; Wen, X.; Hever, T.; Khemtong, C.; Kovacs, Z.; Sherry, A.D.; Malloy, C.R. The Rate of Lactate Production from Glucose in Hearts Is Not Altered by Per-Deuteration of Glucose. J. Magn. Reson. 2017, 284, 86–93. [Google Scholar] [CrossRef]
- Zhang, W.; Sargent, D.J.; Mandrekar, S. An Adaptive Dose-Finding Design Incorporating Both Toxicity and Efficacy. Statist. Med. 2006, 25, 2365–2383. [Google Scholar] [CrossRef]
- Ben-Yoseph, O.; Kingsley, P.B.; Ross, B.D. Metabolic Loss of Deuterium from Isotopically Labeled Glucose. Magn. Reson. Med. 1994, 32, 405–409. [Google Scholar] [CrossRef]
- Browning, J.D.; Burgess, S.C. Use of 2H2O for Estimating Rates of Gluconeogenesis: Determination and Correction of Error Due to Transaldolase Exchange. Am. J. Physiol. Endocrinol. Metab. 2012, 303, E1304–E1312. [Google Scholar] [CrossRef] [PubMed][Green Version]
- Leadlay, P.F.; Albery, W.J.; Knowles, J.R. Energetics of Triosephosphate Isomerase: Deuterium Isotope Effects in the Enzyme-Catalyzed Reaction. Biochemistry 1976, 15, 5617–5620. [Google Scholar] [CrossRef] [PubMed]
- Chandramouli, V.; Ekberg, K.; Schumann, W.C.; Wahren, J.; Landau, B.R. Origins of the Hydrogen Bound to Carbon 1 of Glucose in Fasting: Significance in Gluconeogenesis Quantitation. Am. J. Physiol. Endocrinol. Metab. 1999, 277, E717–E723. [Google Scholar] [CrossRef]
- Read, J.; Pearce, J.; Li, X.; Muirhead, H.; Chirgwin, J.; Davies, C. The Crystal Structure of Human Phosphoglucose Isomerase at 1.6 Å Resolution: Implications for Catalytic Mechanism, Cytokine Activity and Haemolytic Anaemia. J. Mol. Biol. 2001, 309, 447–463. [Google Scholar] [CrossRef]
- Lorentzen, E.; Siebers, B.; Hensel, R.; Pohl, E. Mechanism of the Schiff Base Forming Fructose-1,6-Bisphosphate Aldolase: Structural Analysis of Reaction Intermediates. Biochemistry 2005, 44, 4222–4229. [Google Scholar] [CrossRef] [PubMed]
- Reis, M.; Alves, C.N.; Lameira, J.; Tuñón, I.; Martí, S.; Moliner, V. The Catalytic Mechanism of Glyceraldehyde 3-Phosphate Dehydrogenase from Trypanosoma Cruzi Elucidated via the QM/MM Approach. Phys. Chem. Chem. Phys. 2013, 15, 3772–3785. [Google Scholar] [CrossRef][Green Version]
- Lebioda, L.; Stec, B. Mechanism of Enolase: The Crystal Structure of Enolase-Mg2+-2-Phosphoglycerate/Phosphoenolpyruvate Complex at 2.2-Å Resolution. Biochemistry 1991, 30, 2817–2822. [Google Scholar] [CrossRef]
- Hanau, S.; Montin, K.; Cervellati, C.; Magnani, M.; Dallocchio, F. 6-Phosphogluconate Dehydrogenase Mechanism. J. Biol. Chem. 2010, 285, 21366–21371. [Google Scholar] [CrossRef] [PubMed]
- Funk, A.M.; Wen, X.; Hever, T.; Maptue, N.R.; Khemtong, C.; Sherry, A.D.; Malloy, C.R. Effects of Deuteration on Transamination and Oxidation of Hyperpolarized 13C-Pyruvate in the Isolated Heart. J. Magn. Reson. 2019, 301, 102–108. [Google Scholar] [CrossRef]
- Aguayo, J.B.; McLennan, I.J.; Graham, C.; Cheng, H.-M. Dynamic Monitoring of Corneal Carbohydrate Metabolism Using High-Resolution Deuterium NMR Spectroscopy. Exp. Eye Res. 1988, 47, 337–343. [Google Scholar] [CrossRef]
- Lewis, J.E.; Costantini, F.; Mims, J.; Chen, X.; Furdui, C.M.; Boothman, D.A.; Kemp, M.L. Genome-Scale Modeling of NADPH-Driven β-Lapachone Sensitization in Head and Neck Squamous Cell Carcinoma. Antioxid. Redox Signal. 2018, 29, 937–952. [Google Scholar] [CrossRef] [PubMed]
- O’Donnell, J.M.; Kudej, R.K.; LaNoue, K.F.; Vatner, S.F.; Lewandowski, E.D. Limited Transfer of Cytosolic NADH into Mitochondria at High Cardiac Workload. Am. J. Physiol. Heart Circ. Physiol. 2004, 286, H2237–H2242. [Google Scholar] [CrossRef] [PubMed]
- Harris, R.A.; Kobayashi, R.; Murakami, T.; Shimomura, Y. Regulation of Branched-Chain α-Keto Acid Dehydrogenase Kinase Expression in Rat Liver. J. Nutr. 2001, 131, 841S–845S. [Google Scholar] [CrossRef]
- McKenna, M.C.; Dienel, G.A.; Sonnewald, U.; Waagepetersen, H.S.; Schousboe, A. Energy Metabolism of the Brain. In Basic Neurochemistry; Elsevier: Amsterdam, The Netherlands, 2012; pp. 200–231. ISBN 978-0-12-374947-5. [Google Scholar]
- Kreis, F.; Wright, A.J.; Hesse, F.; Fala, M.; Hu, D.; Brindle, K.M. Measuring Tumor Glycolytic Flux in Vivo by Using Fast Deuterium MRI. Radiology 2020, 294, 289–296. [Google Scholar] [CrossRef]


| Cell Lines | Control | Treatment | |||
|---|---|---|---|---|---|
| A549 | Concentration (µmol/L) | Number of µmol of 2H | Concentration (µmol/L) | Number of µmol of 2H | |
| [2H7]glucose | 5064.0 ± 70.8 | 35,448.2 ± 496.1 | 1289.17 ± 148.67 | 9024.2 ± 1040.7 | |
| HDO | 19,623.3 ± 102.9 | 19,623.3 ± 552.2 | 6532.5 ± 851.6 | 6532.5 ± 851.6 | |
| Lactate-CH2D | 4663.4 ± 136.2 | 4663.4 ± 136.2 | 1279.3 ± 147.6 | 1279.3 ± 147.6 | |
| Lactate-CHD2 | 3034.0 ± 105.3 | 6068.0 ± 210.6 | 595.3 ± 83.6 | 1190.5 ± 167.2 | |
| µmol of 2H in 2H-lactate and HDO | 30,354.8 | 9002.3 | |||
| MiaPaCa2 | [2H7]glucose | 5723.0 ± 39.4 | 40,061.1 ± 276.4 | 2199.6 ± 21.7 | 15,397.2 ± 152.3 |
| HDO | 22,344.5 ± 471.6 | 22,344.5 ± 471.6 | 10,629.0 ± 526.4 | 10,629.0 ± 526.4 | |
| Lactate-CH2D | 4798.8 ± 122.4 | 4798.8 ± 122.4 | 1562.1 ± 116.5 | 1562.1 ± 116.5 | |
| Lactate-CHD2 | 3046.3 ± 68.0 | 6092.6 ± 135.9 | 753.8 ± 59.6 | 1507.6 ± 119.3 | |
| µmol of 2H in 2H-lactate and HDO | 33,075.9 | 13,098.8 | |||
| HCT-116 | [2H7]glucose | 4373.3 ± 19.2 | 30,613.7 ± 427.1 | 3510.6 ± 48.4 | 24,574.6 ± 338.9 |
| HDO | 13,004.6 ± 494.6 | 13,004.6 ± 494.6 | 10,854.5 ± 786.38 | 10,854.5 ± 786.3 | |
| Lactate-CH2D | 3151.1 ± 242.4 | 3151.1 ± 242.4 | 2607.2 ± 149.9 | 2607.2 ± 149.9 | |
| Lactate-CHD2 | 2397.7 ± 229.5 | 4795.5 ± 459.0 | 1967.1 ± 145.9 | 3934.1 ± 291.9 | |
| µmol of 2H in 2H-lactate and HDO | 20,951.2 | 17,395.8 | |||
Publisher’s Note: MDPI stays neutral with regard to jurisdictional claims in published maps and institutional affiliations. |
© 2021 by the authors. Licensee MDPI, Basel, Switzerland. This article is an open access article distributed under the terms and conditions of the Creative Commons Attribution (CC BY) license (https://creativecommons.org/licenses/by/4.0/).
Share and Cite
Mahar, R.; Chang, M.C.; Merritt, M.E. Measuring NQO1 Bioactivation Using [2H7]Glucose. Cancers 2021, 13, 4165. https://doi.org/10.3390/cancers13164165
Mahar R, Chang MC, Merritt ME. Measuring NQO1 Bioactivation Using [2H7]Glucose. Cancers. 2021; 13(16):4165. https://doi.org/10.3390/cancers13164165
Chicago/Turabian StyleMahar, Rohit, Mario C. Chang, and Matthew E. Merritt. 2021. "Measuring NQO1 Bioactivation Using [2H7]Glucose" Cancers 13, no. 16: 4165. https://doi.org/10.3390/cancers13164165
APA StyleMahar, R., Chang, M. C., & Merritt, M. E. (2021). Measuring NQO1 Bioactivation Using [2H7]Glucose. Cancers, 13(16), 4165. https://doi.org/10.3390/cancers13164165